
Acoustic Emission Waveform Characteristics of Red Sandstone Failure under Uniaxial Compression after Thermal Damage

1
School of Urban Geology and Engineering, Hebei GEO University, Shijiazhuang 050031, China
2
School of Resources and Geosciences, China University of Mining and Technology, Xuzhou 221116, China
3
Hebei Technology Innovation Center for Intelligent Development and Control of Underground Built Environment, Hebei GEO University, Shijiazhuang 050031, China
4
Key Laboratory of Intelligent Detection and Equipment for Underground Space of Beijing-Tianjin-Hebei Urban Agglomeration, Ministry of Natural Resources, Hebei GEO University, Shijiazhuang 050031, China
*
Author to whom correspondence should be addressed.
Sustainability 2022, 14(20), 13285; https://doi.org/10.3390/su142013285
Submission received: 28 August 2022
/
Revised: 24 September 2022
/
Accepted: 13 October 2022
/
Published: 16 October 2022
(This article belongs to the Collection Mine Hazards Identification, Prevention and Control)
Abstract
:During the exploitation of deep resources, rocks are often in a high-temperature, high-pressure environment. It is of great significance to study the acoustic emission (AE) characteristics of thermal damaged rock under load to improve the accuracy of monitoring in practical engineering. In this paper, sandstone was heated at different temperatures, before a uniaxial compression test was performed and the AE in the process was monitored. The results show that the strength and AE energy of sandstone decrease gradually with an increase in heating temperature. Through frequency domain analysis of the AE waveform at the time of failure, it was found that the frequency and intensity of AE also showed a downward trend with an increase in temperature. In addition, multifractal theory is introduced to deconstruct the waveform data. The multifractal characteristics of the waveforms decrease with an increase in temperature. It provides new parameters for waveform analysis, which can be combined with frequency analysis as parameters to more accurately identify rock failure in engineering practice. The attenuation of AE of thermally damaged sandstone may be related to an increase in porosity and a decrease in elastic energy release.
1. Introduction
The rock mass in the deep part of the stratum is often in the mechanical environment of high temperature and high pressure, which brings great challenges to the engineering stability of underground development activities such as coal resource mining, tunnel construction, and deep drilling [1,2,3,4]. In the process of geothermal energy exploitation, temperature effect and rock damage evaluation are especially important [5,6]. Therefore, the mechanical properties and fracture behavior of rock under high temperatures are of great concern for scholars.
Extensive research shows that high-temperature treatment will damage rock and reduce a series of mechanical parameters such as compressive strength, tensile strength, and elastic modulus [7,8,9]. Moreover, there may be a temperature threshold of 200 °C for sandstone and granite. Below this threshold, the rock damage can be ignored [10]. The higher the temperature, the more serious the rock damage. Pyrolysis of some minerals leads to an increase in porosity and decrease in P-wave velocity. When the temperature exceeds 600 °C, quartz will undergo phase transformation, resulting in a significant reduction in rock strength [6,11]. Related research involves different rocks such as granite [12,13], sandstone [14,15], shale [5], etc. In addition, many scholars have explored rock characteristics under different temperature levels [16], different cooling methods [17], cyclic thermal shock [11], and other conditions.
The acoustic emission (AE) signal will be generated when the rock fractures. It is a transient elastic wave generated by the rapid release of energy from the local source in the material [7,11,12,18,19,20]. It is widely used in the field of underground engineering disaster monitoring and material nondestructive monitoring [21,22]. By monitoring and analyzing AE signals, rock damage can be evaluated and rock fracture behavior can be inversed [18]. The analysis methods of AE signals generally include parameter analysis and waveform analysis. Waveform analysis refers to the frequency domain performance of the signal obtained by time-frequency transformation. The fracture scale of rock is generally inversely proportional to the AE frequency. There have been recent reports [6,11,12] on the AE characteristics of heat-damaged rocks, especially the performance of parameters such as count and energy. The AE signal generally has good activity in the crack initiation and propagation stage loading, which is closely related to the stress drop process [19]. Kong et al. [23] also studied the nonlinear characteristics of the time-varying process of the AE signal in the uniaxial compression process of sandstone after high-temperature treatment. However, few studies have paid attention to the attenuation behavior of AE signals of rock during loading after thermal damage, especially the analysis of waveform.
Therefore, standard samples of red sandstone were processed in this paper, and they were heated at 0 °C (no treatment), 300 °C, 600 °C, and 900 °C, respectively. The AE signals were then monitored and analyzed when they were loaded in the unconfined condition. In particular, the waveforms at the time of failure were analyzed by multiple methods. In addition to the common time-frequency transform analysis of the waveform, including fast Fourier transform (FFT) [22] and short-time Fourier transform (STFT) [24], multifractal theory [25,26] was introduced to deeply deconstruct the nonlinear characteristics of the waveform data. The research results are of great significance in improving the accuracy of rock damage monitoring in the process of sustainable development of deep energy engineering.
2. Specimen Preparation and Test System
The rock used for the test was red sandstone, and it was obtained from the Linfen area of ShanXi, China. Its density was approximately 2545.65 kg/m3. Large blocks with no obvious cracks on the surface were selected for drilling and coring. Further, standard specimens of 50 mm in diameter and 100 mm in height were cut and made for mechanical testing of uniaxial compression. The top- and bottom-end faces were smoothed according to the standards of the International Society of Rock Mechanics (ISRM).
Next, the specimens were divided into four groups, with two replicate experiments performed in each group. One group of specimens (Group S25) was not subjected to heat treatment. We regard the treatment temperature as the room temperature at the time of the experiment, which was 25 °C. The other three groups were heated in a QSH-1200T chamber-type high-temperature furnace. The three groups were heated from room temperature to 300 °C (Group S300), 600 °C (Group S600), and 900 °C (Group S900), respectively, and cooled after two hours of constant temperature. The heating rate and cooling rate were 5 °C/min and 1 °C/min, respectively. The process of heat treatment is shown in Figure 1. All specimens were tested for P-wave velocity. The specimen numbers and test results are shown in Table 1. The wave velocity of the untreated specimens was approximately 3.51 km/s and it gradually decreased as the temperature increased. This shows that the homogeneity of the specimens was satisfactory and the heat treatment was very effective.
After heat treatment, all the specimens were subjected to uniaxial compression mechanical tests. In addition, the AE signals generated by the rock during the loading process were collected synchronously. The press used for the test was the new SANS microcomputer-controlled electro-hydraulic servo pressure testing machine. It can control and collect the axial stress and strain of the specimen with high precision. The AE collector was a 24-channel Micro-II type AE monitoring host of American Physical Acoustics Corporation and the NANO-30 AE probe. The center frequency of the probe is 150 kHz and it can respond well to a wider frequency range. During the experiment, the probe was attached to the surface of the specimen and coupled with a specially formulated reagent. The threshold value, amplification, and acquisition frequency of AE acquisition were set at 45 dB, 40 dB, and 2 × 10⁶/s, respectively. The loading rate of the press was set at 120 N/s.
3. Mechanical Properties and AE Response
Figure 2 shows the axial stress–strain curves of a group of specimens after heat treatment at different temperatures. The final failure occurred at the peak stress point after the specimens had undergone the stages of primary pore compacting (where the curves have an upward concave shape), elastic deformation (where the curve is linear), and yielding (where the curve has a downward concave shape before the peak). In Figure 3, the uniaxial compressive strength (USC, i.e., peak stress) and elasticity modulus (E, i.e., the slope of the curve in the elastic deformation phase) of all specimens are counted. The USC and E of red sandstone gradually decrease with increasing temperature of heat treatment. The UCS and E of the samples without heat treatment are approximately 65.74 MPa and 11.52 GPa, respectively. However, the USC and E of the samples treated at 900 °C are approximately 35.32 MPa and 6.04 GPa, respectively. The reductions in USC and E reached 46.27% and 47.57%, respectively. All the data are shown in Table 1.
Energy is an important parameter of the AE signal. It refers to the area under the envelope of the waveform signal, which generally reflects the intensity of AE. Figure 4 shows the AE energy of a set of specimens subjected to heat treatment at different temperatures during the loading process. AE energy has a good response to rock fracture. It is kept at a low value in the early stage, but increases sharply in the later stage when the stress fluctuates (with significant fracture). When the stress is loaded to the peak value, the main fracture of the specimen occurs and leads to complete failure. The AE energy also reaches its peak value at this time. With an increase in heat treatment temperature, the level of the AE energy value of the specimens in the whole loading process generally shows a downward trend. This can be clearly seen from the curves of cumulative AE energy. The AE energy accumulation of the untreated sample increases rapidly with an increase in stress. After high-temperature treatment, the increase rate slows down. Figure 5 and Table 1 show the comparison between total AE energy and peak AE energy. After high-temperature treatment at 900 °C, AE energy and peak AE energy decreased by 84.45% and 73.47%, respectively, compared with the untreated samples.
4. Waveform Characteristics at Failure
4.1. Original Waveform and FFT Analysis
The AE waveform at the failure point (peak stress) was extracted and further analyzed. The original waveforms of a group of specimens treated at different temperatures are shown in Figure 6. The AE waveforms all show the shape of increasing at first and then decreasing gradually. With an increase in the treatment temperature, the maximum amplitude of the waveform decreases significantly. In order to further analyze its frequency characteristics, fast Fourier transform (FFT) [22] was performed on all waveforms. The obtained frequency spectrums are shown in Figure 7. Further, the main frequency (frequency of the highest amplitude point in the spectrum) and the amplitude of the main frequency for all specimens in the experiment are counted and shown in Figure 8. As the temperature increases, both the main frequency and its amplitude gradually decrease. From no treatment to the 900 °C treatment, the average value of the main frequency decreases from 24.63 kHz to 18.91 kHz. The average value of the main frequency decreases by 23.22%. Moreover, these frequencies belong to the range of low-frequency AE signals caused by macroscopic large-scale fracture of rock under a laboratory test [6]. The amplitude of the main frequency decreases from 0.12 mv to 0.04 mv, a decrease of 66.67%. The decrease in amplitude is more significant than the main frequency. In addition, it is obvious from the FFT spectrum that the signal has significant subdominant frequency characteristics between 60–70 kHz. With an increase in the heat treatment temperature, the amplitude of the subdominant frequency also gradually decreased.
4.2. STFT Analysis
Compared with the FFT, the short-time Fourier transform (STFT) [24] has the resolution on the time scale and is more advanced. By setting the window function, it can obtain the frequency domain performance of the signal at different times. Figure 9 shows the calculated time-frequency spectrums of a set of specimens treated at different temperatures. Consistent with the trend of the FFT results, the highest energy (color axis in Figure 9) of the signal gradually decreases as the temperature increases. The highest energy value of the untreated specimen is approximately 6, while the highest energy value of the sample treated at 900 °C is approximately 0.9. The frequencies at the highest energy are all below 100 Hz. On the time scale, the signal gradually attenuates after reaching the highest energy, with its frequency and energy range both showing a gradually decreasing trend. For example, in Figure 9a, the signals at approximately the 600th sampling point show good performance in the range of 0–500 Hz. With the increase in time, at the 1500th sampling point, the signal only performs well at 0–200 Hz. Moreover, the attenuation of signal strength is also obvious.
4.3. Multifractal Analysis
Fractal theory is proposed by scientists to describe the existence of irregularities in nature [25,26]. At present, multifractal theory is also used by many scholars to analyze AE parameters in the field of rock mechanics, but it is rarely used for waveform analysis [19,22]. Multifractal analysis can deconstruct data and reflect the characteristics of an uneven distribution of data. Through multifractal analysis of the waveform, new signal characteristic parameters can be obtained, which is beneficial to the monitoring of rock failure. The larger the width of the calculated multifractal spectrum , the more uneven the data [19]. In addition, reflects the proportion of large data and small data [22]. If is small, it means that large data prevails; if is large, it means that small data prevails. The multifractal spectrum of waveform data is calculated by the box dimension method [19]. The formulas used for the calculations are listed below, with details provided in the literature [22].
The data are divided into multiple subsets of length . is the probability distribution of the subset; is the statistical moment; is the quality index; is the singularity index, which reflects the inhomogeneity of the subset; and denotes the frequency of the represented subset in the whole subset, i.e., the fractal dimension of the subset.
Figure 10 shows the multifractal spectrums of a set of specimens treated at different temperatures. They all have a right hook shape ( > 0), reflecting the fact that the data are all dominated by small values. Figure 11 tallies and shows the and for all specimens. As the temperature increases, the multifractal characteristics of the AE waveform weaken and the multifractal parameters and tend to decrease in general. The mean value of decreases from 2.14 to 0.73, while the mean value of f decreases from 0.45 to 0.08. This reflects that the data distribution of the waveform is becoming increasingly less different, with the large data becoming increasingly more dominant.
In summary, all analyses show that heat treatment causes a weakening of the AE signal of the rock, both in terms of the temporal variation of the energy and the time-frequency domain performance of the waveform at the time of failure. This may be due to various reasons. Heat treatment leads to damage of sandstone and an increase in porosity [27,28,29], which will aggravate attenuation of the AE signal during propagation. In addition, the strength of sandstone after thermal damage is reduced, while the storage of elastic properties is weakened during loading [6]. Less elastic energy is released, resulting in weaker AE signals [13]. In addition, it is useful to analyze the waveform by multiple means, which is beneficial to the depth inversion of rock fracture and improves the monitoring accuracy. Moreover, the introduction of multifractal theory provides new characteristic parameters for the analysis of AE waveforms.
5. Conclusions
In this paper, in order to improve the accuracy of acoustic emission monitoring of rock failure after thermal damage, sandstone was heated at different temperatures (25 °C, 300 °C, 600 °C, 900 °C) and then subjected to an unconfined compression test, with the AE monitored. The mechanical properties and AE response of heat-damaged sandstone were analyzed. In particular, frequency domain analysis (including FFT and STFT) and multifractal analysis of the AE waveform at the time of failure were performed. The main conclusions are as follows:
- (1)
- When the heating temperature increases from 25 °C to 900 °C, the uniaxial compressive strength and elastic modulus of sandstone decrease by 46.27% and 47.57%, respectively. Moreover, with an increase in temperature, the AE energy level in the loading process tends to decay. Compared with the untreated samples, the total value and peak value of AE energy of the samples after the 900 °C treatment decrease by 84.45% and 73.47%, respectively.
- (2)
- The FFT analysis shows that with an increase in temperature, the dominant frequency and amplitude of the AE waveform of sandstone failure are decreased. The dominant frequency and amplitude of the samples treated at 900 °C are 23.22% and 66.67% lower, respectively, than those of the untreated samples. The STFT analysis also has basically consistent laws. In addition, STFT shows that the frequency range and intensity are gradually attenuated after the waveform reaches a peak. The attenuation of AE may be related to the decrease in elastic energy release and the increase in porosity.
- (3)
- Multifractal theory was introduced to analyze the waveform of failure. The multifractal characteristic ( and ) of the signal gradually decreases with an increase in temperature, and it provides new parameters for the waveform characteristic analysis, which has an engineering application value and is conducive to improving the accuracy of rock-failure monitoring.
Author Contributions
Conceptualization, W.G.; methodology, H.Z.; data curation, H.Z.; writing—original draft preparation, H.Z.; writing—review and editing, W.G. All authors have read and agreed to the published version of the manuscript.
Funding
This research received no external funding.
Institutional Review Board Statement
Not applicable.
Informed Consent Statement
Not applicable.
Data Availability Statement
Not applicable.
Conflicts of Interest
The authors declare that they have no conflict of interest.
References
- He, M.C.; Xie, H.P.; Peng, S.P.; Jiang, Y.D. Study on rock mechanics in deep mining engineering. Chin. J. Rock. Mech. Eng. 2005, 24, 2803–2813. [Google Scholar]
- Kong, X.G.; He, D.; Liu, X.F.; Wang, E.Y.; Li, S.G.; Liu, T.; Ji, P.F.; Deng, D.Y.; Yang, S.R. Strain characteristics and energy dissipation laws of gas-bearing coal during impact fracture process. Energy 2022, 242, 123028. [Google Scholar] [CrossRef]
- Kong, X.G.; Li, S.G.; Wang, E.Y.; Wang, X.; Zhou, Y.X.; Ji, P.F.; Shuang, H.Q.; Li, S.R.; Wei, Z.Y. Experimental and numerical investigations on dynamic mechanical responses and failure process of gas-bearing coal under impact load. Soil Dyn. Earthq. Eng. 2021, 142, 106579. [Google Scholar] [CrossRef]
- Kong, X.G.; Li, S.G.; Wang, E.Y.; Ji, P.F.; Wang, X.; Shuang, H.Q.; Zhou, Y.X. Dynamics behaviour of gas-bearing coal subjected to SHPB tests. Compos. Struct. 2021, 256, 113088. [Google Scholar] [CrossRef]
- Han, S.B.; Hu, X.D.; Zhou, F.J.; Qiu, Y.; Li, M.H.; Huang, G.P. Influence of temperature on the interaction of metal veins and hydraulic fractures in shale formations: Experiment and simulation. J. Pet. Sci. Eng. 2021, 200, 108372. [Google Scholar] [CrossRef]
- Kong, B.; Wang, E.Y.; Li, Z.H.; Wang, X.R.; Liu, J.; Li, N. Fracture mechanical behavior of sandstone subjected to high-temperature treatment and its acoustic emission characteristics under uniaxial compression conditions. Rock Mech. Rock Eng. 2016, 49, 4911–4918. [Google Scholar] [CrossRef]
- Giordano, M.; Calabro, A.; Esposito, C.; Damore, A.; Nicolais, L. An acoustic-emission characterization of the failure modes in polymer-composite materials. Compos. Sci. Technol. 1998, 58, 1923–1928. [Google Scholar] [CrossRef]
- Brotons, V.; Tomas, R.; Ivorra, S.; Alarcon, J.C. Temperature influence on the physical and mechanical properties of a porous rock: San Julian’s calcarenite. Eng. Geol. 2013, 167, 117–127. [Google Scholar] [CrossRef]
- Ozguven, A.; Ozcelik, Y. Investigation of some property changes of natural building stones exposed to fire and high heat. Constr. Build. Mater. 2013, 38, 813–821. [Google Scholar] [CrossRef]
- Ozguven, A.; Ozcelik, Y. Effects of high temperature on physico-mechanical properties of Turkish natural building stones. Eng. Geol. 2014, 183, 127–136. [Google Scholar] [CrossRef]
- Zhu, D.; Jing, H.W.; Yin, Q.; Han, G.S. Experimental study on the damage of granite by acoustic emission after cyclic heating and cooling with circulating water. Processes 2018, 6, 101. [Google Scholar] [CrossRef] [Green Version]
- Chmel, A.; Shcherbakov, I. Temperature dependence of acoustic emission from impact fractured granites. Tectonophysics 2014, 632, 218–223. [Google Scholar] [CrossRef]
- Chmel, A.; Shcherbakov, I. Microcracking in impact-damaged granites heated up to 600 °C. J. Geophys. Eng. 2015, 12, 485–491. [Google Scholar] [CrossRef]
- Sun, Q.; Lu, C.; Cao, L.W.; Li, W.C.; Geng, J.S.; Zhang, W.Q. Thermal properties of sandstone after treatment at high temperature. Int. J. Rock. Mech. Min. Sci. 2016, 85, 60–66. [Google Scholar] [CrossRef]
- Zuo, J.P.; Xie, H.P.; Zhou, H.W.; Peng, S.P. SEM investigation on thermal cracking behaviour of PingDingShan sandstone at elevated temperatures. Geophys. J. Int. 2010, 181, 593–603. [Google Scholar]
- Hueckel, T.; Peano, A.; Pellegrini, R. A thermo-plastic constitutive law for brittle-plastic behavior of rocks at high temperatures. Pure. Appl. Geophys. 1994, 143, 483–510. [Google Scholar] [CrossRef]
- Han, G.S.; Jing, H.W.; Su, H.J.; Liu, R.C.; Yin, Q.; Wu, J.Y. Effects of thermal shock due to rapid cooling on the mechanical properties of sandstone. Environ. Earth Sci. 2019, 78, 146. [Google Scholar] [CrossRef]
- Wang, X.R.; Wang, E.Y.; Liu, X.F.; Zhou, X. Failure mechanism of fractured rock and associated acoustic behaviors under different loading rates. Eng. Fract. Mech. 2021, 247, 107674. [Google Scholar] [CrossRef]
- Li, H.R.; Qiao, Y.F.; Shen, R.X.; He, M.C.; Cheng, T.; Xiao, Y.M.; Tang, J. Effect of water on mechanical behavior and acoustic emission response of sandstone during loading process: Phenomenon and mechanism. Eng. Geol. 2021, 294, 106386. [Google Scholar] [CrossRef]
- Shen, R.X.; Li, H.R.; Wang, E.Y.; Li, D.X.; Hou, Z.H.; Zhang, X.; Han, X. Mechanical behavior and AE and EMR characteristics of natural and saturated coal samples in the indirect tensile process. J. Geophys. Eng. 2019, 16, 753–763. [Google Scholar] [CrossRef]
- Li, H.R.; Shen, R.X.; Qiao, Y.F.; He, M.C. Acoustic emission signal characteristics and its critical slowing down phenomenon during the loading process of water-bearing sandstone. J. Appl. Geophys. 2021, 194, 104458. [Google Scholar] [CrossRef]
- Li, H.R.; Qiao, Y.F.; Shen, R.X.; He, M.C. Electromagnetic radiation signal monitoring and multi-fractal analysis during uniaxial compression of water-bearing sandstone. Measurement 2022, 196, 111245. [Google Scholar] [CrossRef]
- Kong, B.; Wang, E.Y.; Li, Z.H.; Wang, X.R.; Chen, L.; Kong, X.G. Nonlinear characteristics of acoustic emissions during the deformation and fracture of sandstone subjected to thermal treatment. Int. J. Rock Mech. Min. Sci. 2016, 90, 43–52. [Google Scholar] [CrossRef]
- Masera, D.; Bocca, P.; Grazzini, A. Frequency analysis of acoustic emission signal to monitor damage evolution in masonry structures. J. Phys. Conf. Ser. 2011, 305, 12134–12143. [Google Scholar] [CrossRef]
- Li, D.X.; Wang, E.Y.; Kong, X.G.; Ali, M.; Wang, D.M. Mechanical behaviors and acoustic emission fractal characteristics of coal specimens with a pre-existing flaw of various inclinations under uniaxial compression. Int. J. Rock Mech. Min. Sci. 2019, 116, 38–51. [Google Scholar] [CrossRef]
- Wu, Z.X.; Liu, X.X.; Liang, Z.Z.; You, X.; Yu, M. Experimental study of fractal dimension of AE serials of different rocks under uniaxial compression. Rock. Soil. Mech. 2012, 33, 3561–3569. [Google Scholar]
- Yavuz, H.; Demirdag, S.; Caran, S. Thermal effect on the physical properties of carbonate rocks. Int. J. Rock. Mech. Min. Sci. 2010, 47, 94–103. [Google Scholar] [CrossRef]
- Hajpál, M. Changes in sandstones of historical monuments exposed to fire or high temperature. Fire. Technol. 2002, 38, 373–382. [Google Scholar] [CrossRef]
- Ito, K.; Enoki, M. Acquisition and analysis of continuous acoustic emission waveform for classification of damage sources in ceramic fiber mat. Mater. Trans. 2007, 48, 1221–1226. [Google Scholar] [CrossRef] [Green Version]
Figure 1.
The heating process.

Figure 2.
Stress–strain curves.

Figure 3.
Changes of UCS and E.
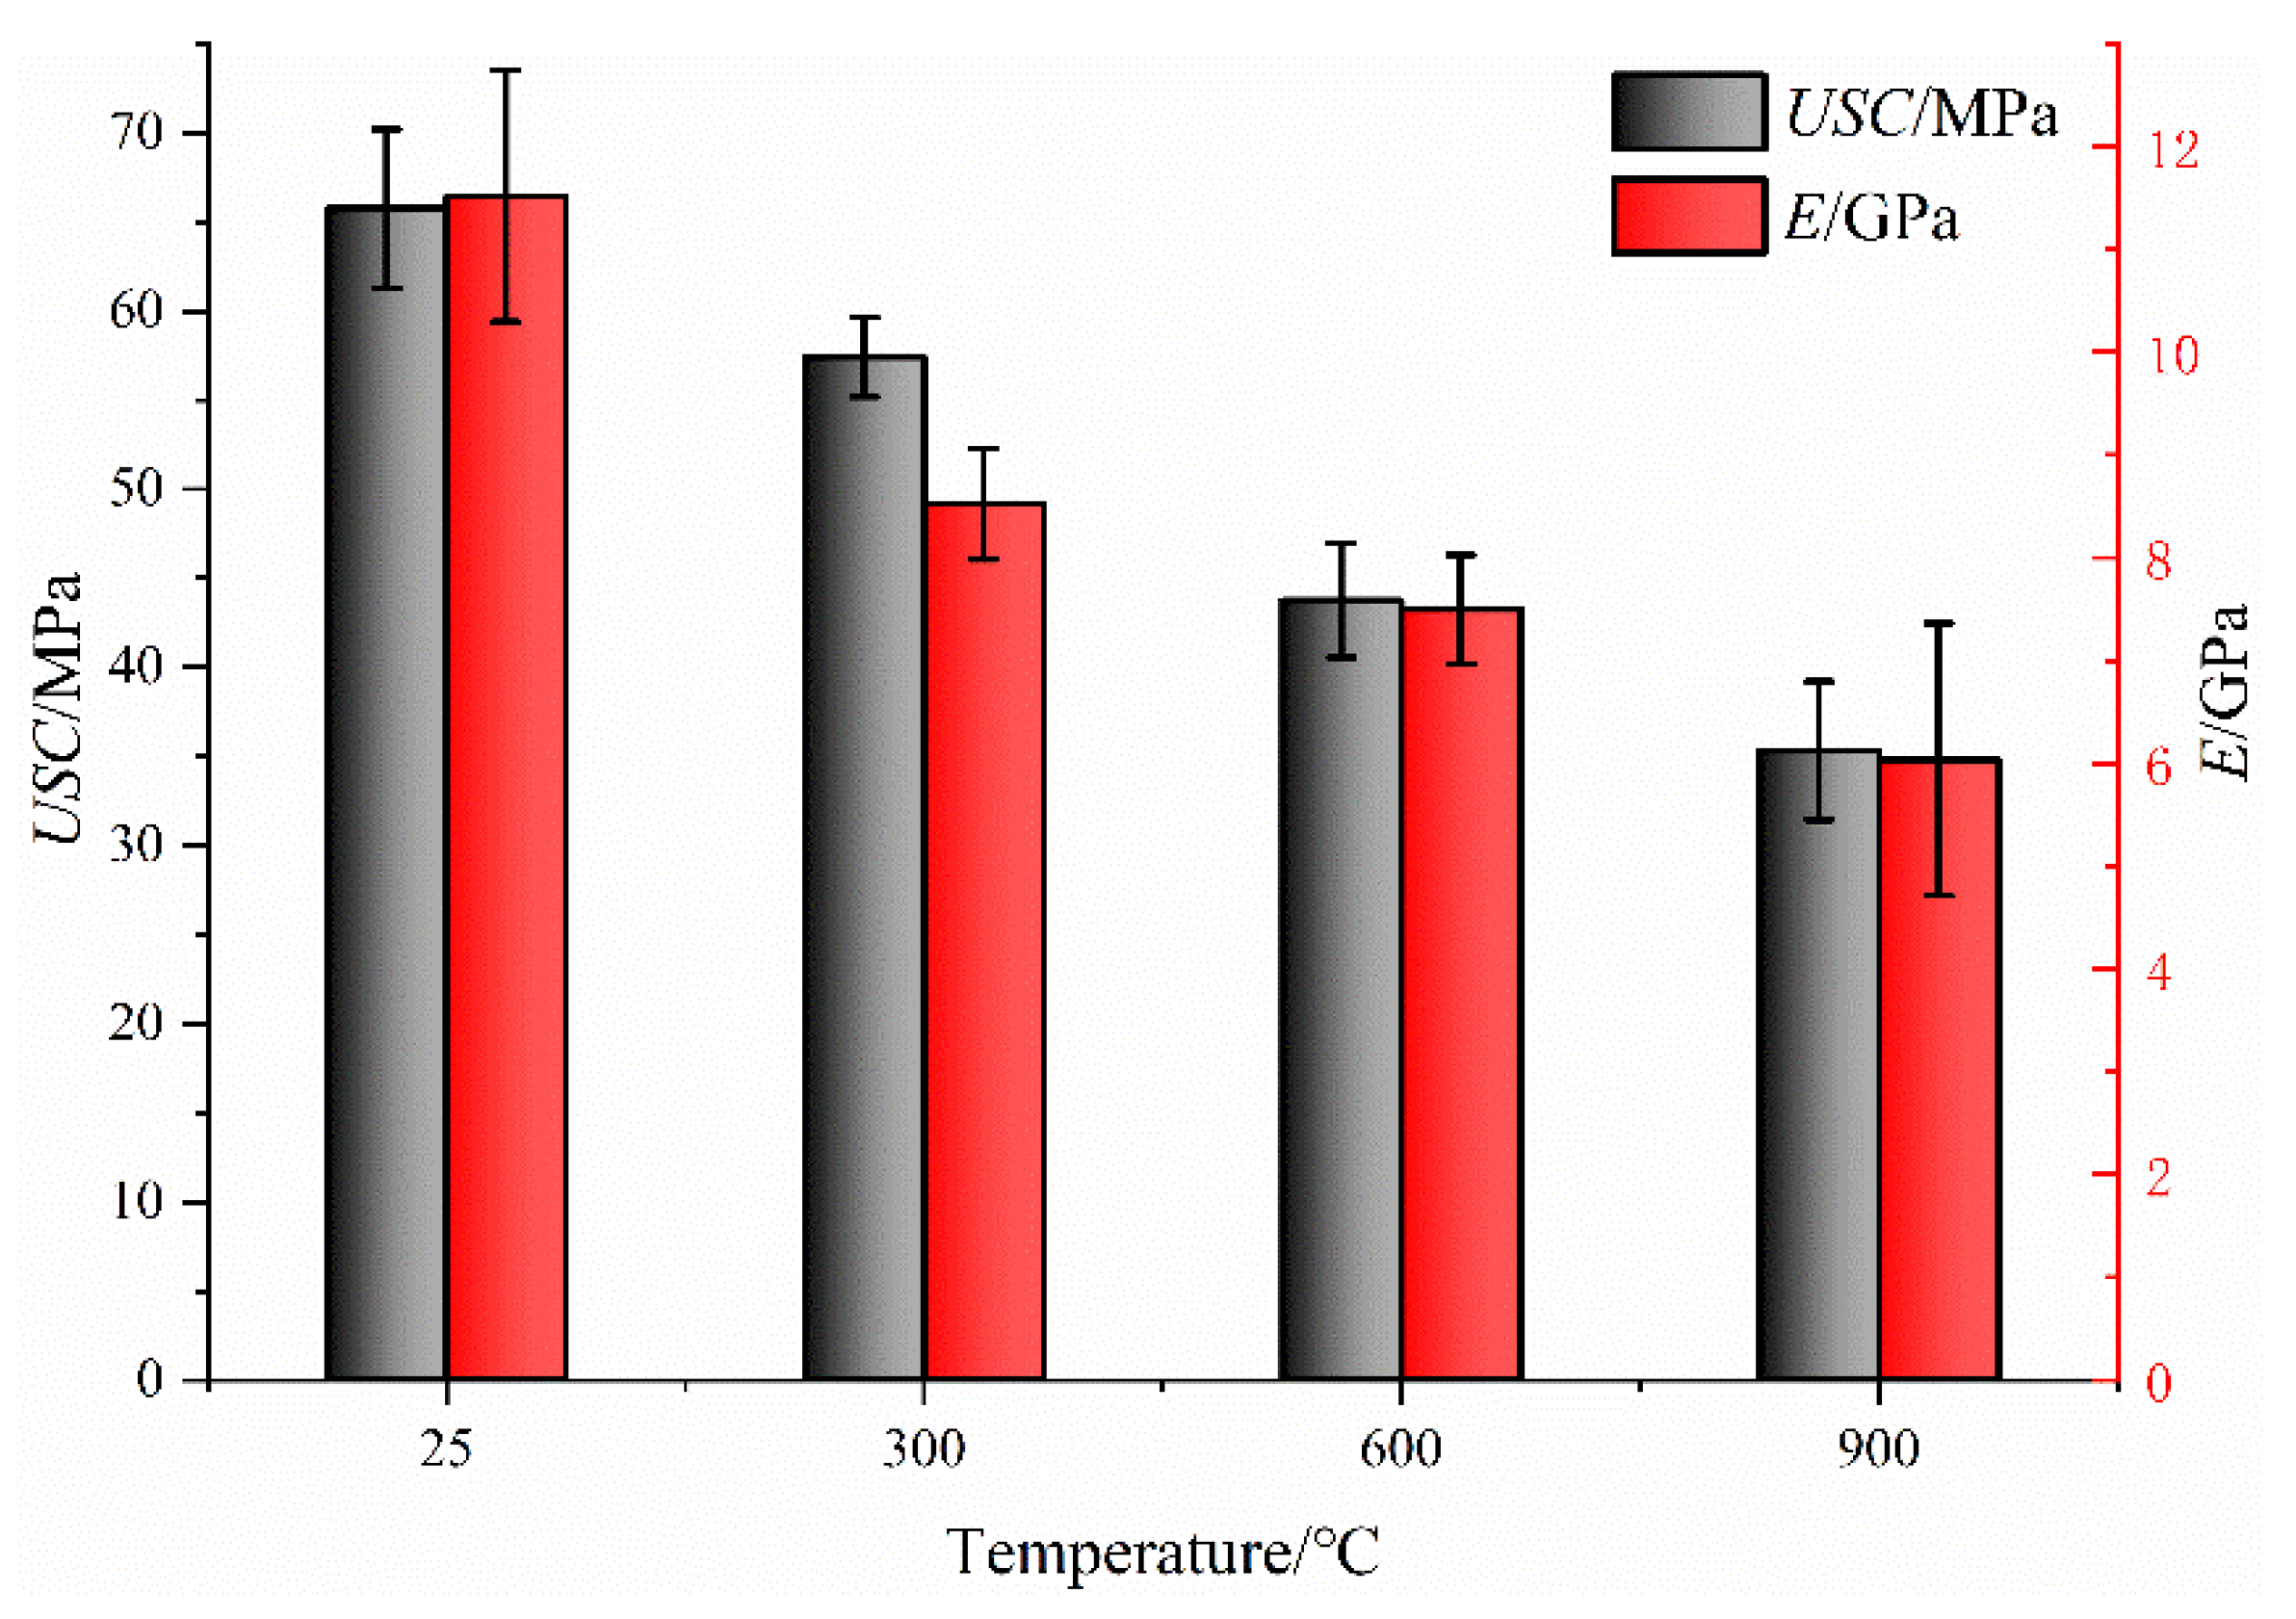
Figure 4.
AE energy of the specimens during loading: (a) 25 °C, (b) 300 °C, (c) 600 °C, (d) 900 °C.

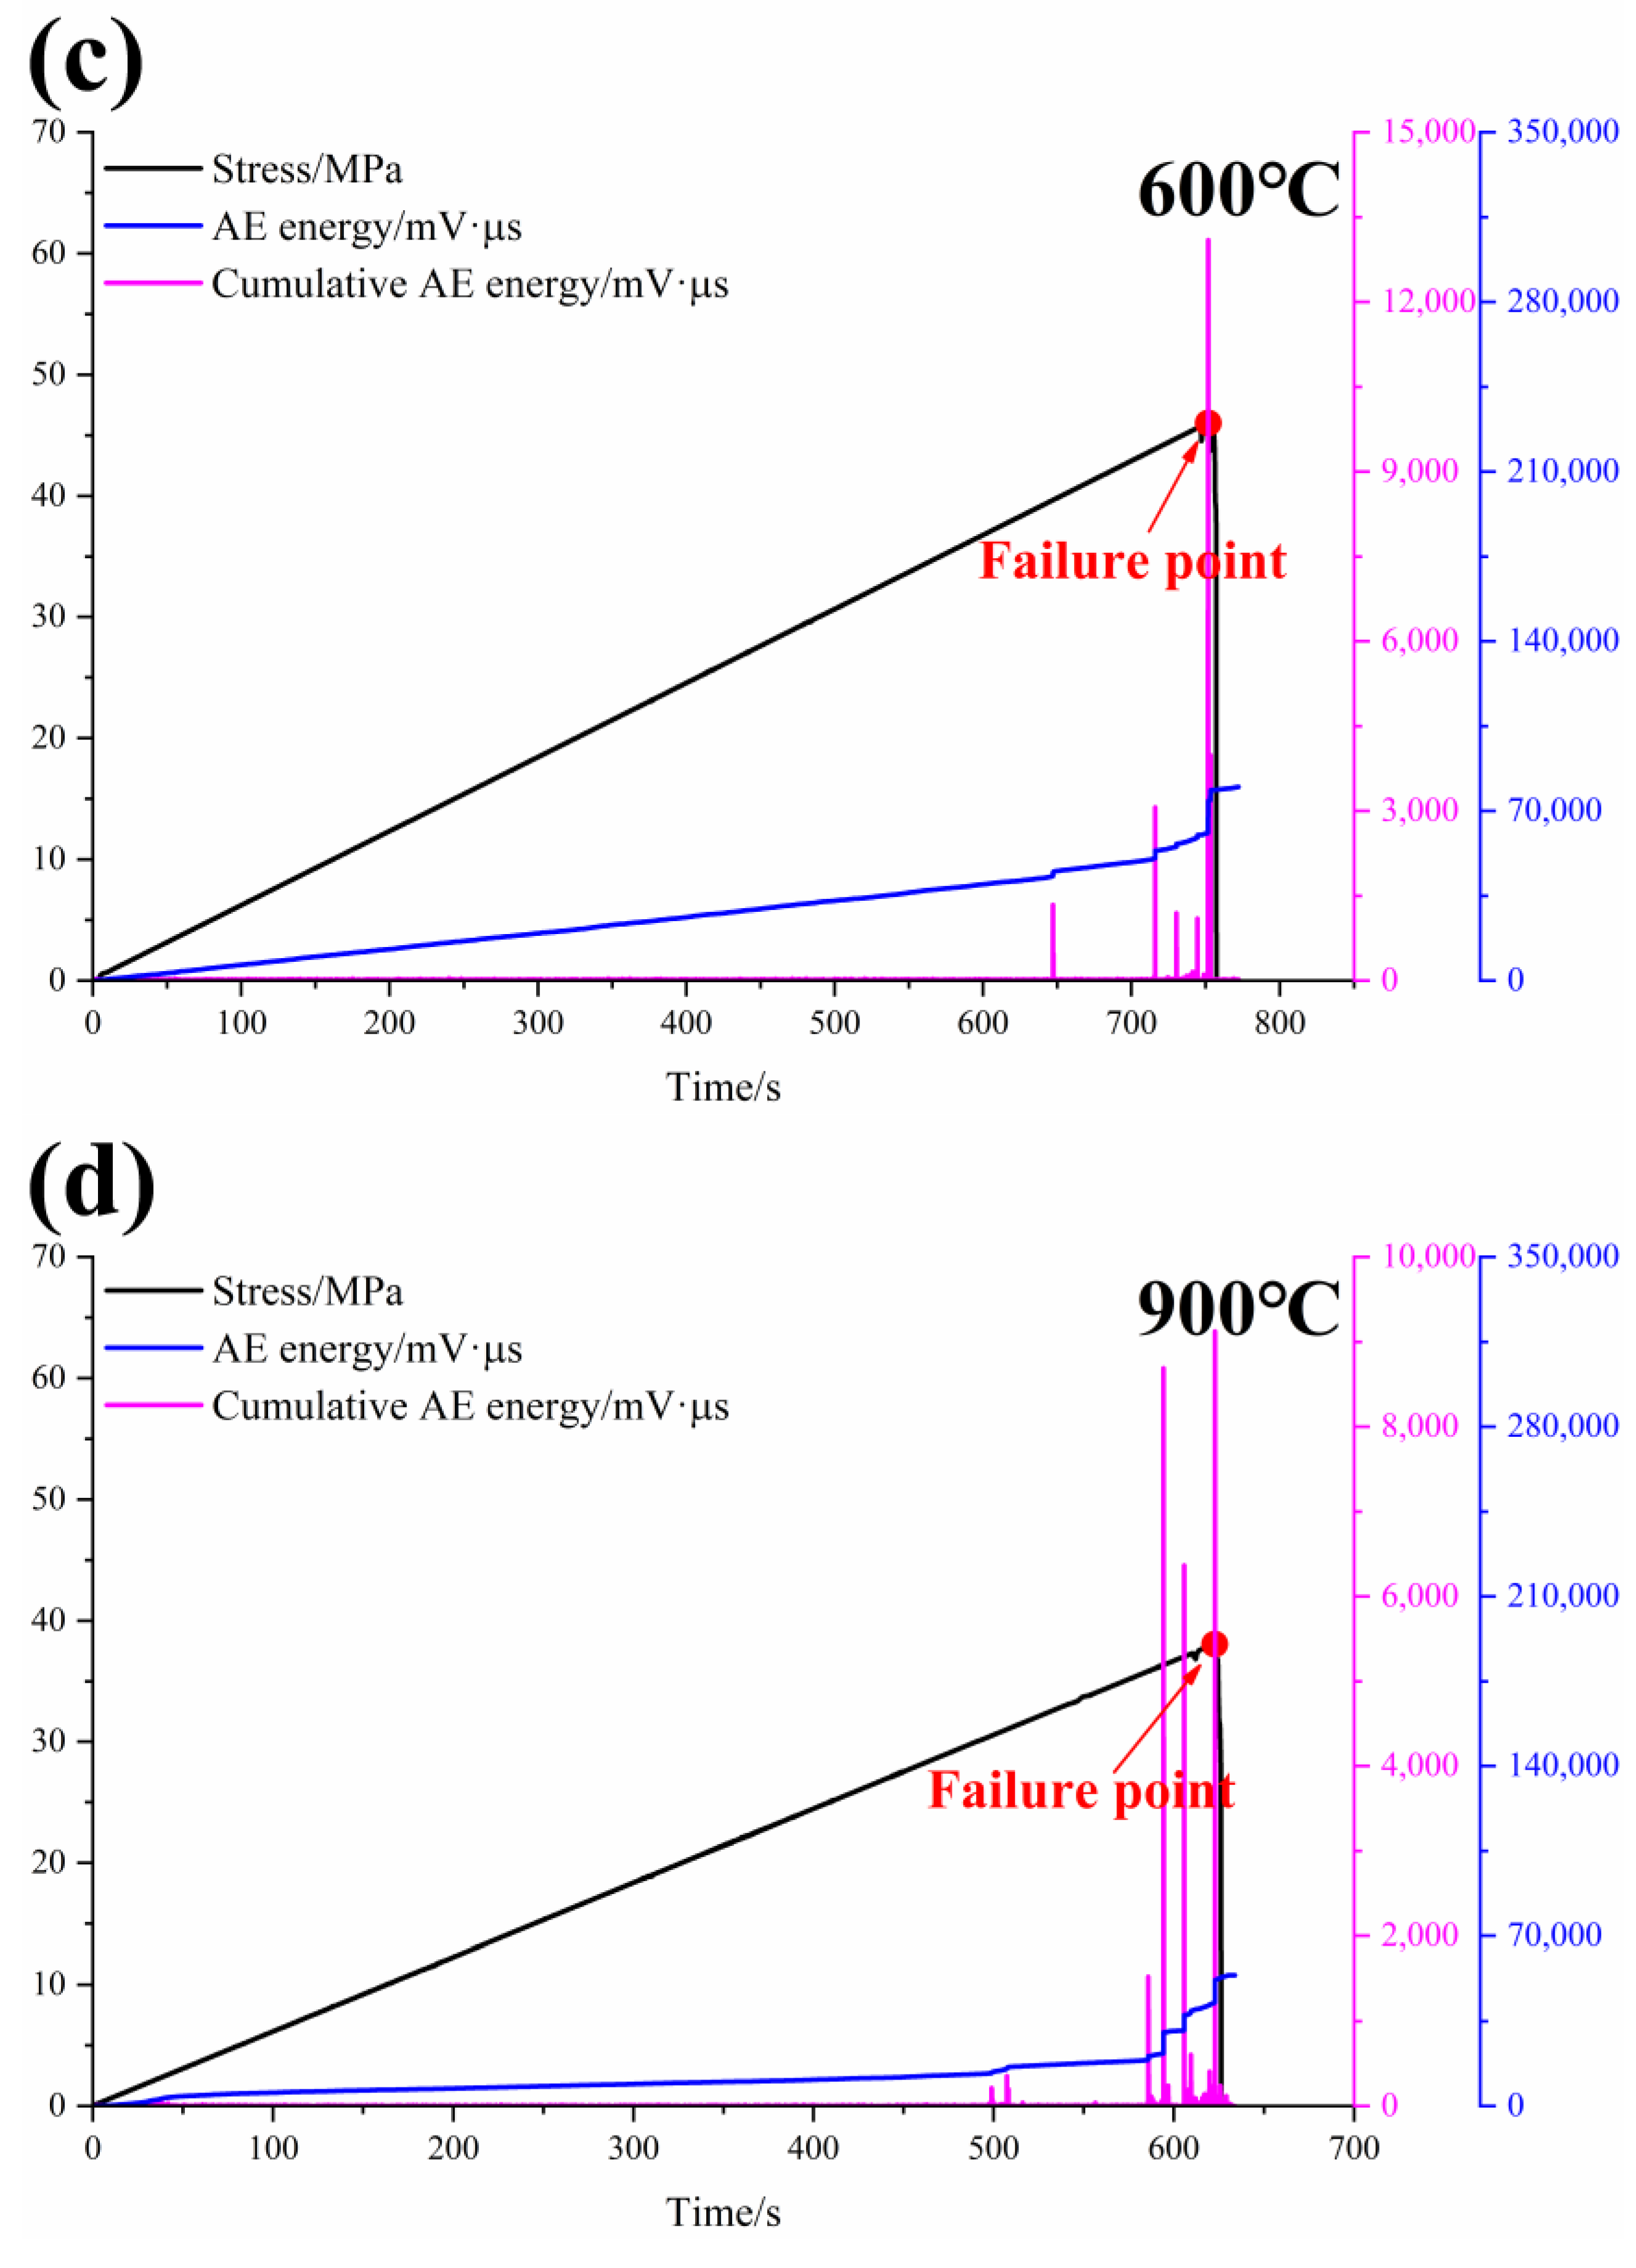
Figure 5.
Changes of total AE energy and peak AE energy.
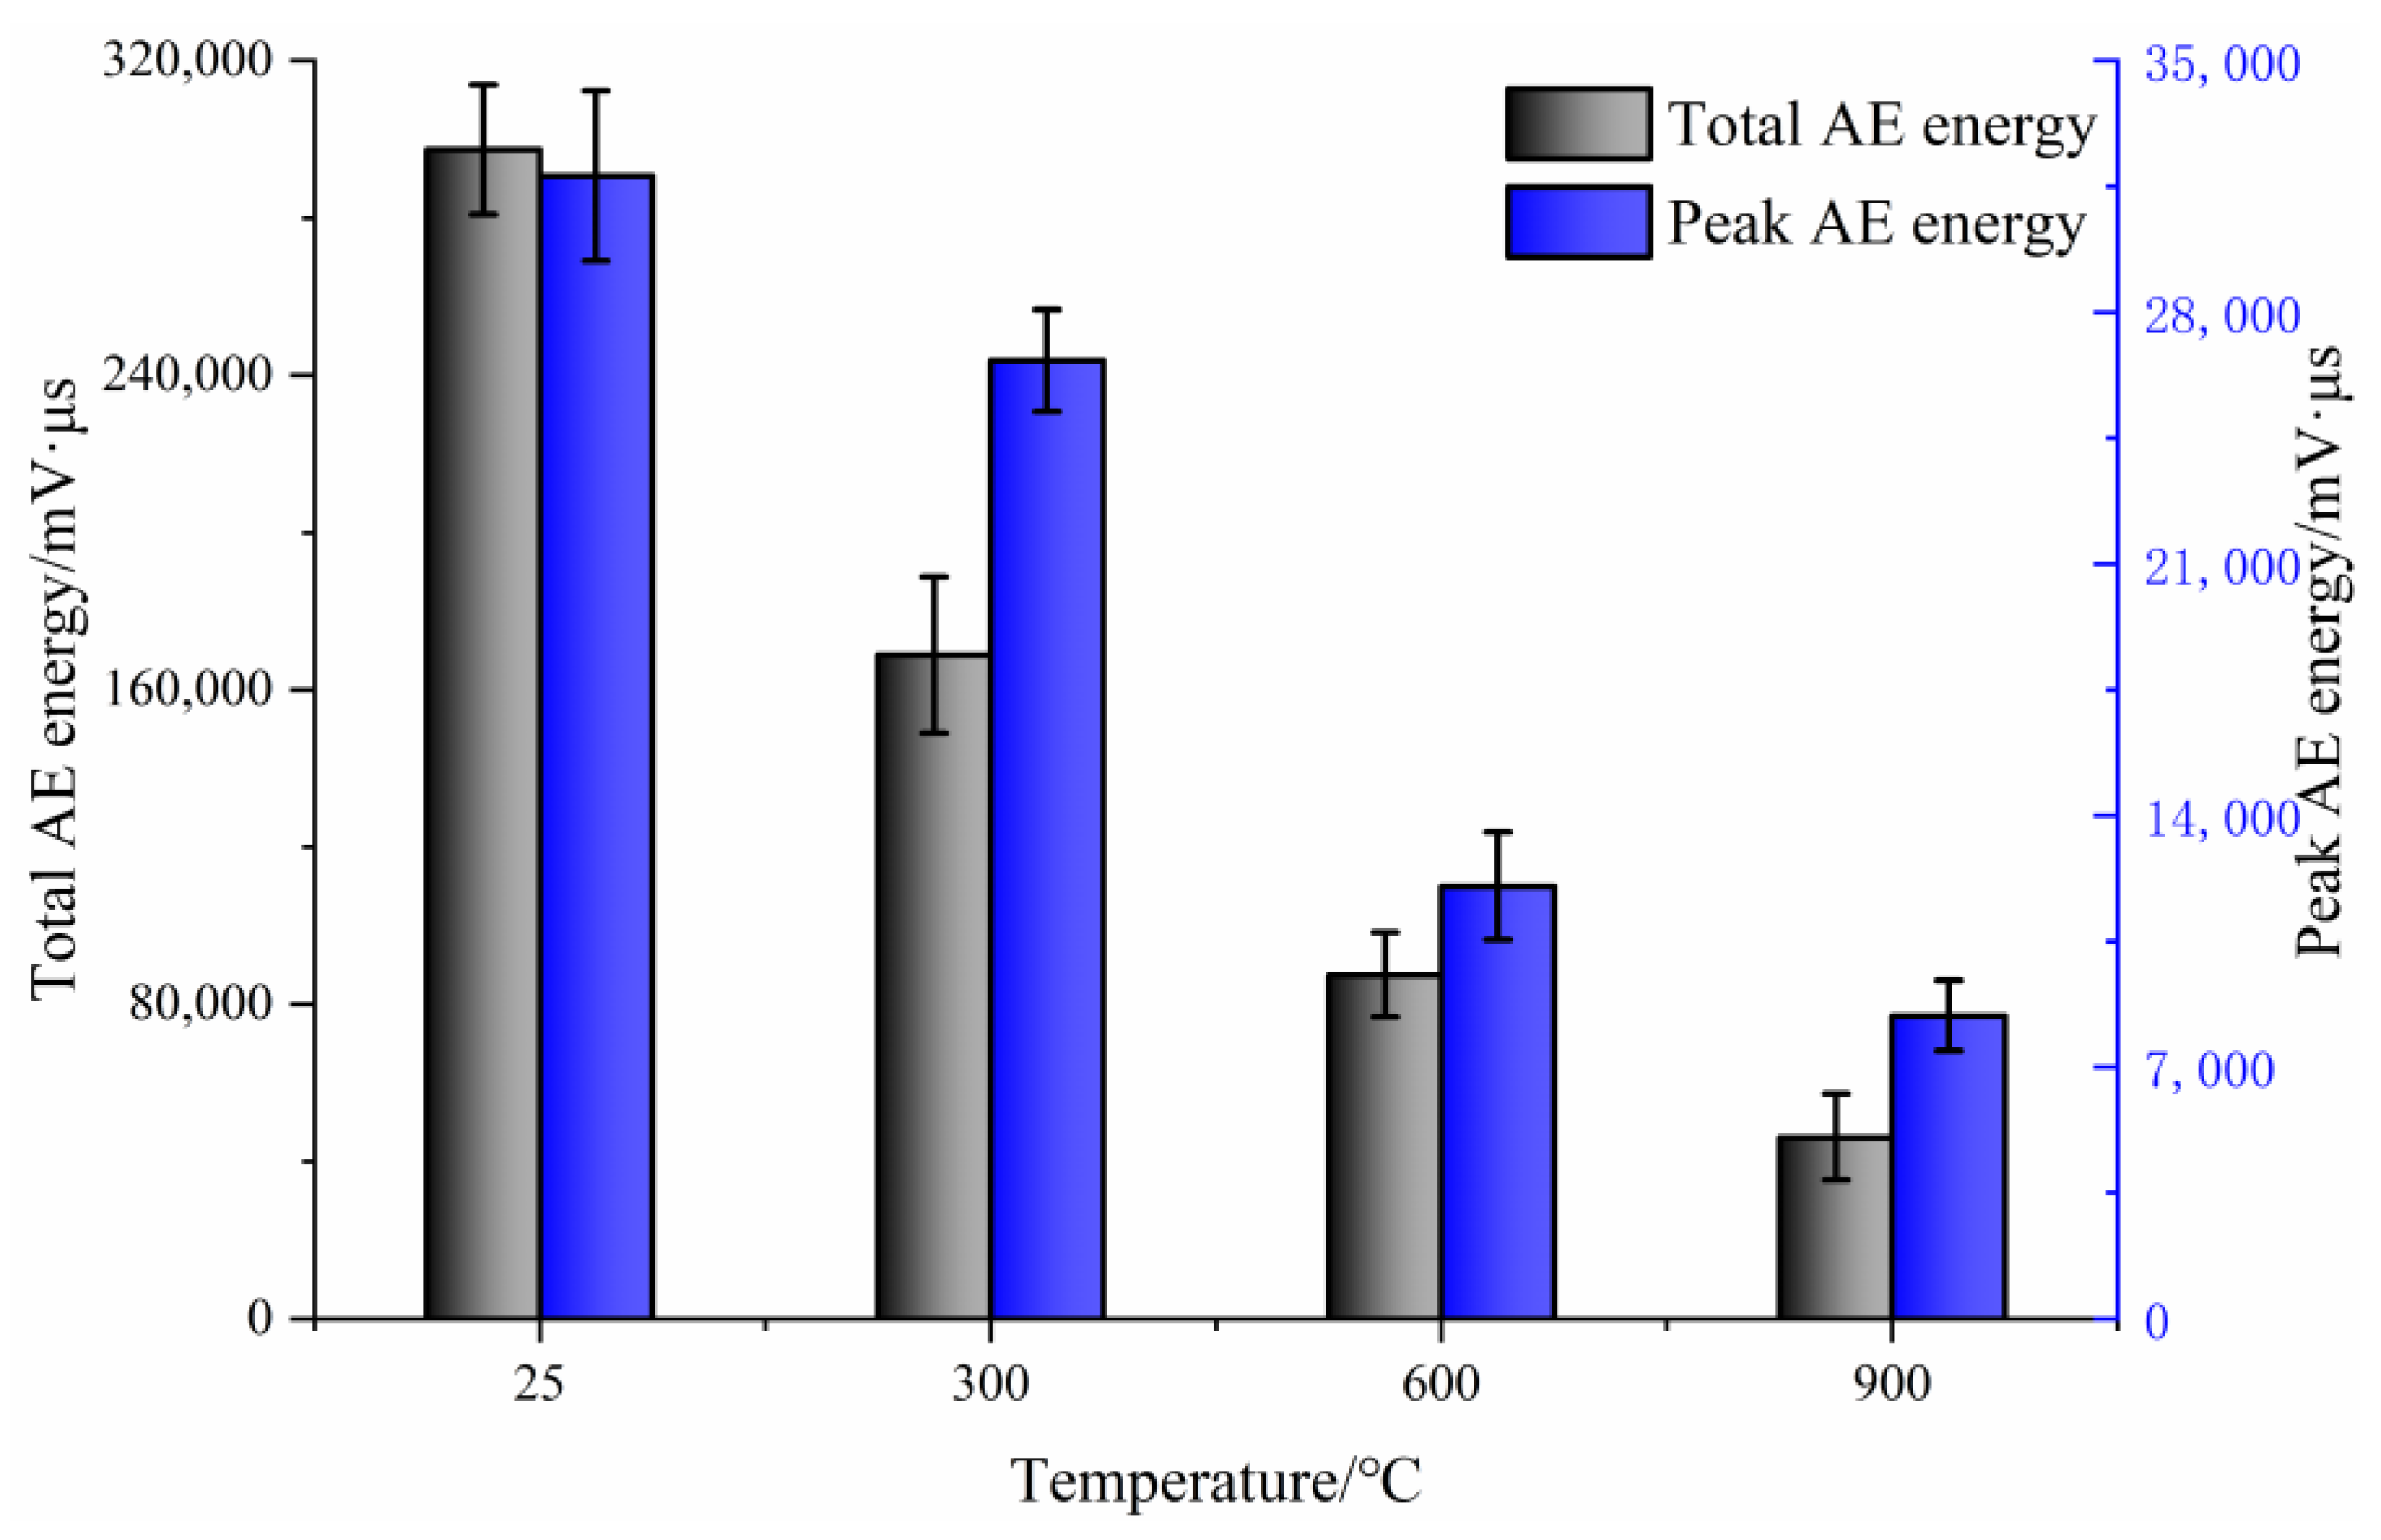
Figure 6.
The AE waveform at failure point: (a) 25 °C, (b) 300 °C, (c) 600 °C, (d) 900 °C.
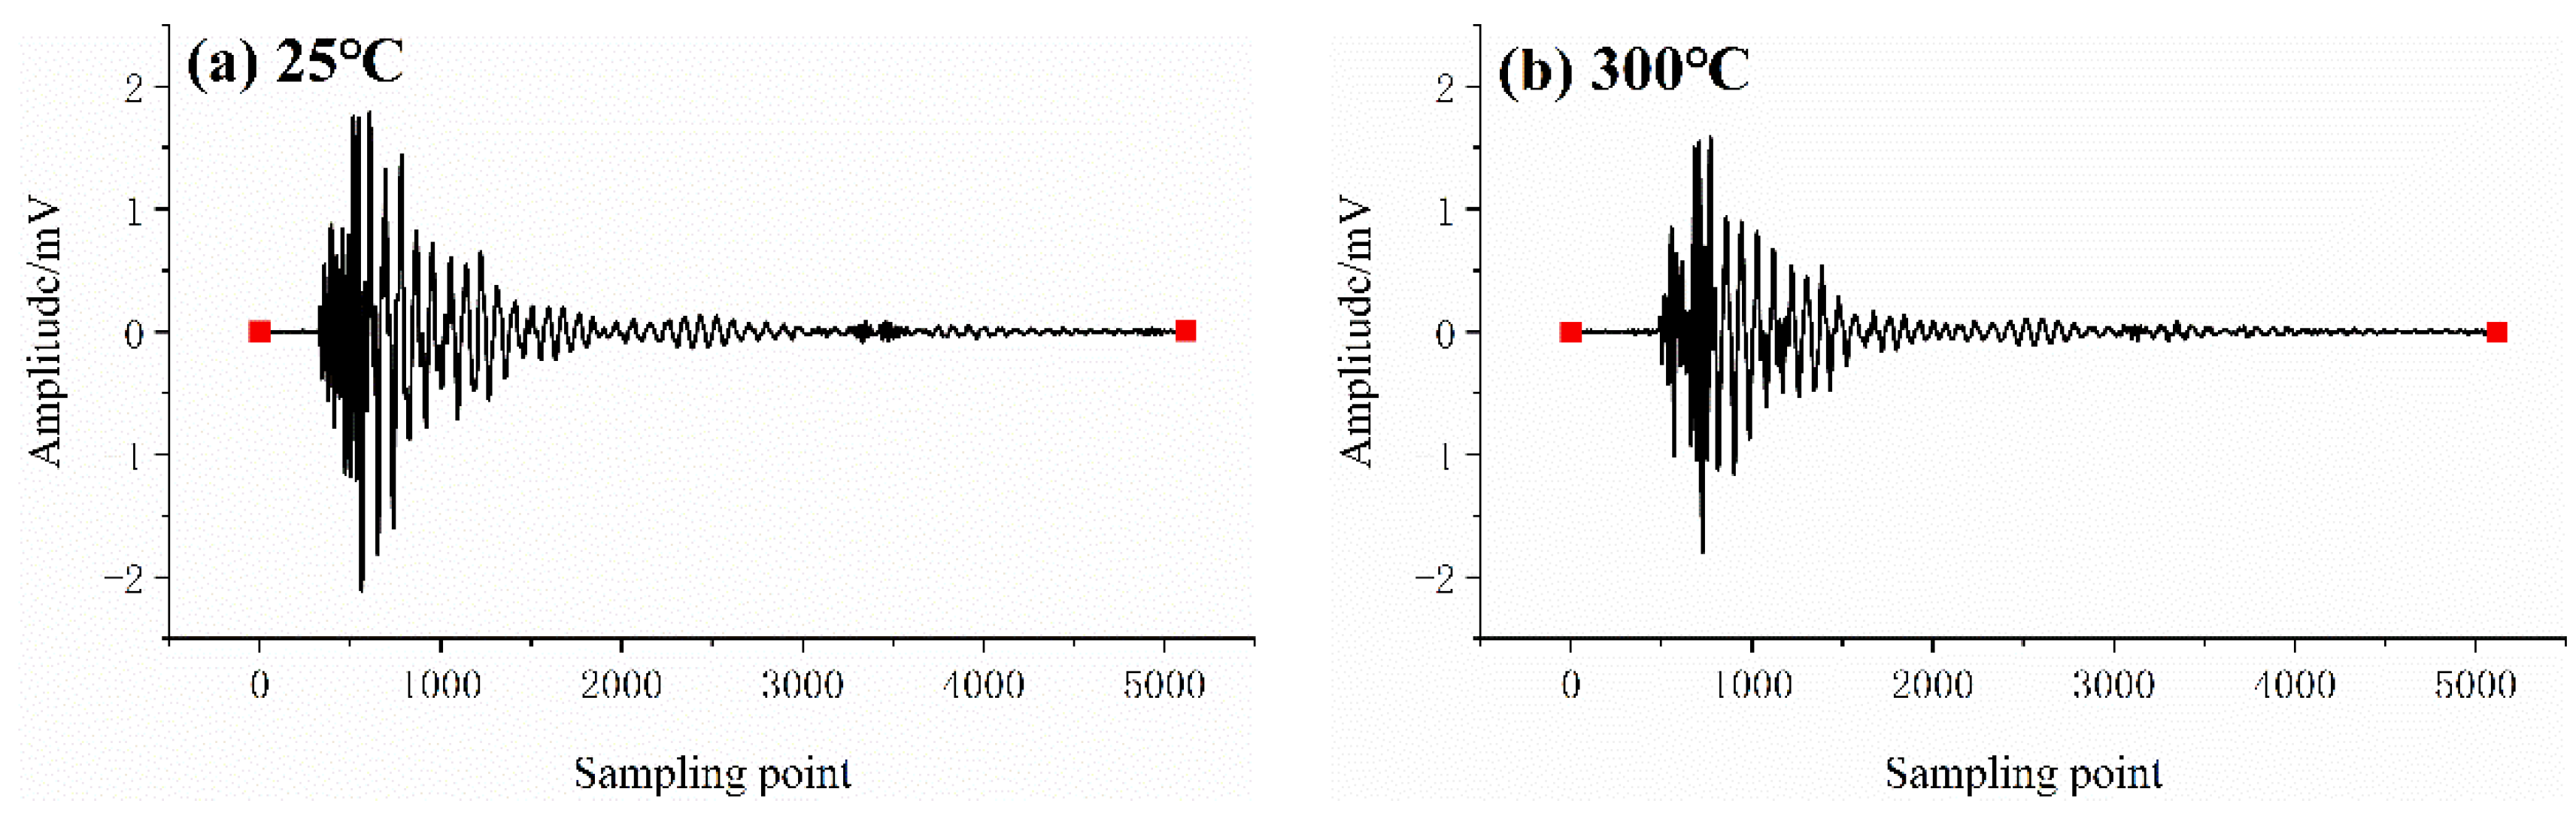
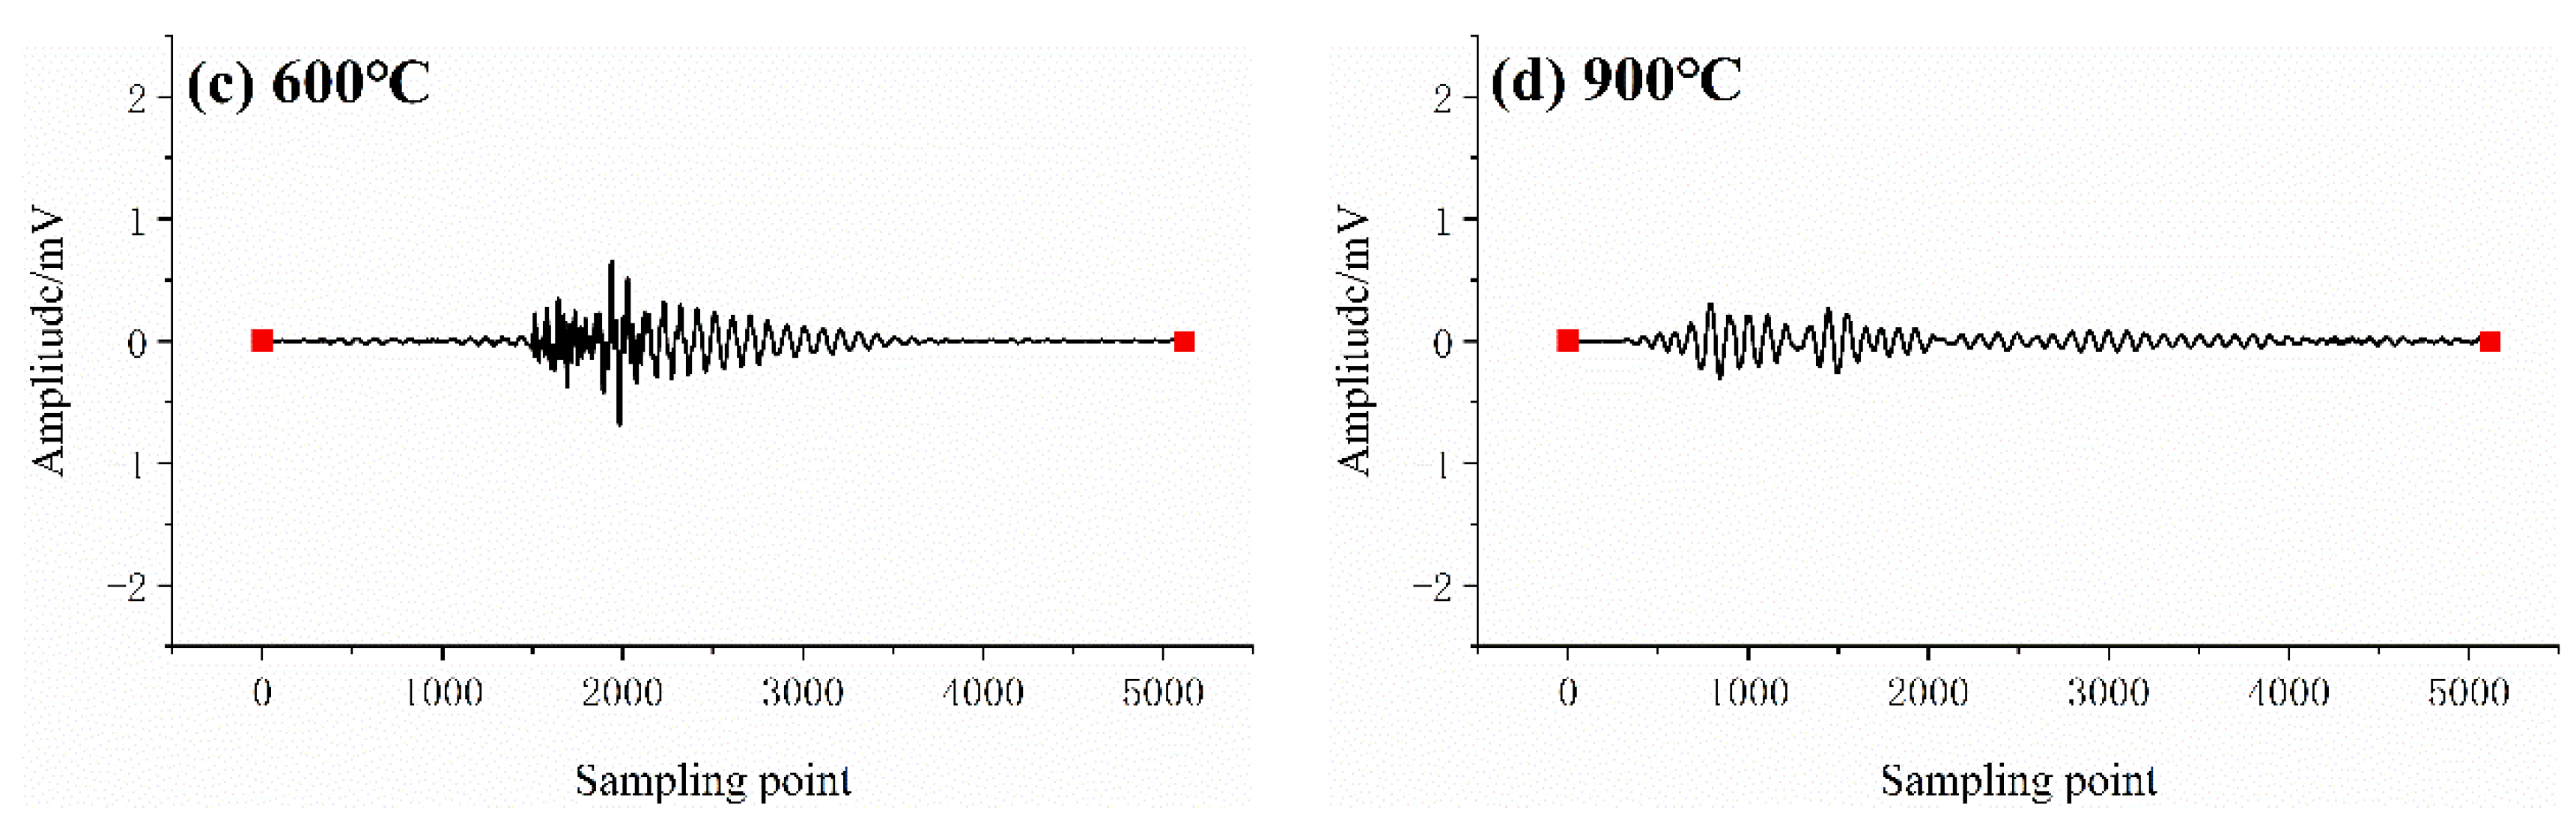
Figure 7.
Frequency spectrums after FFT: (a) 25 °C, (b) 300 °C, (c) 600 °C, (d) 900 °C.
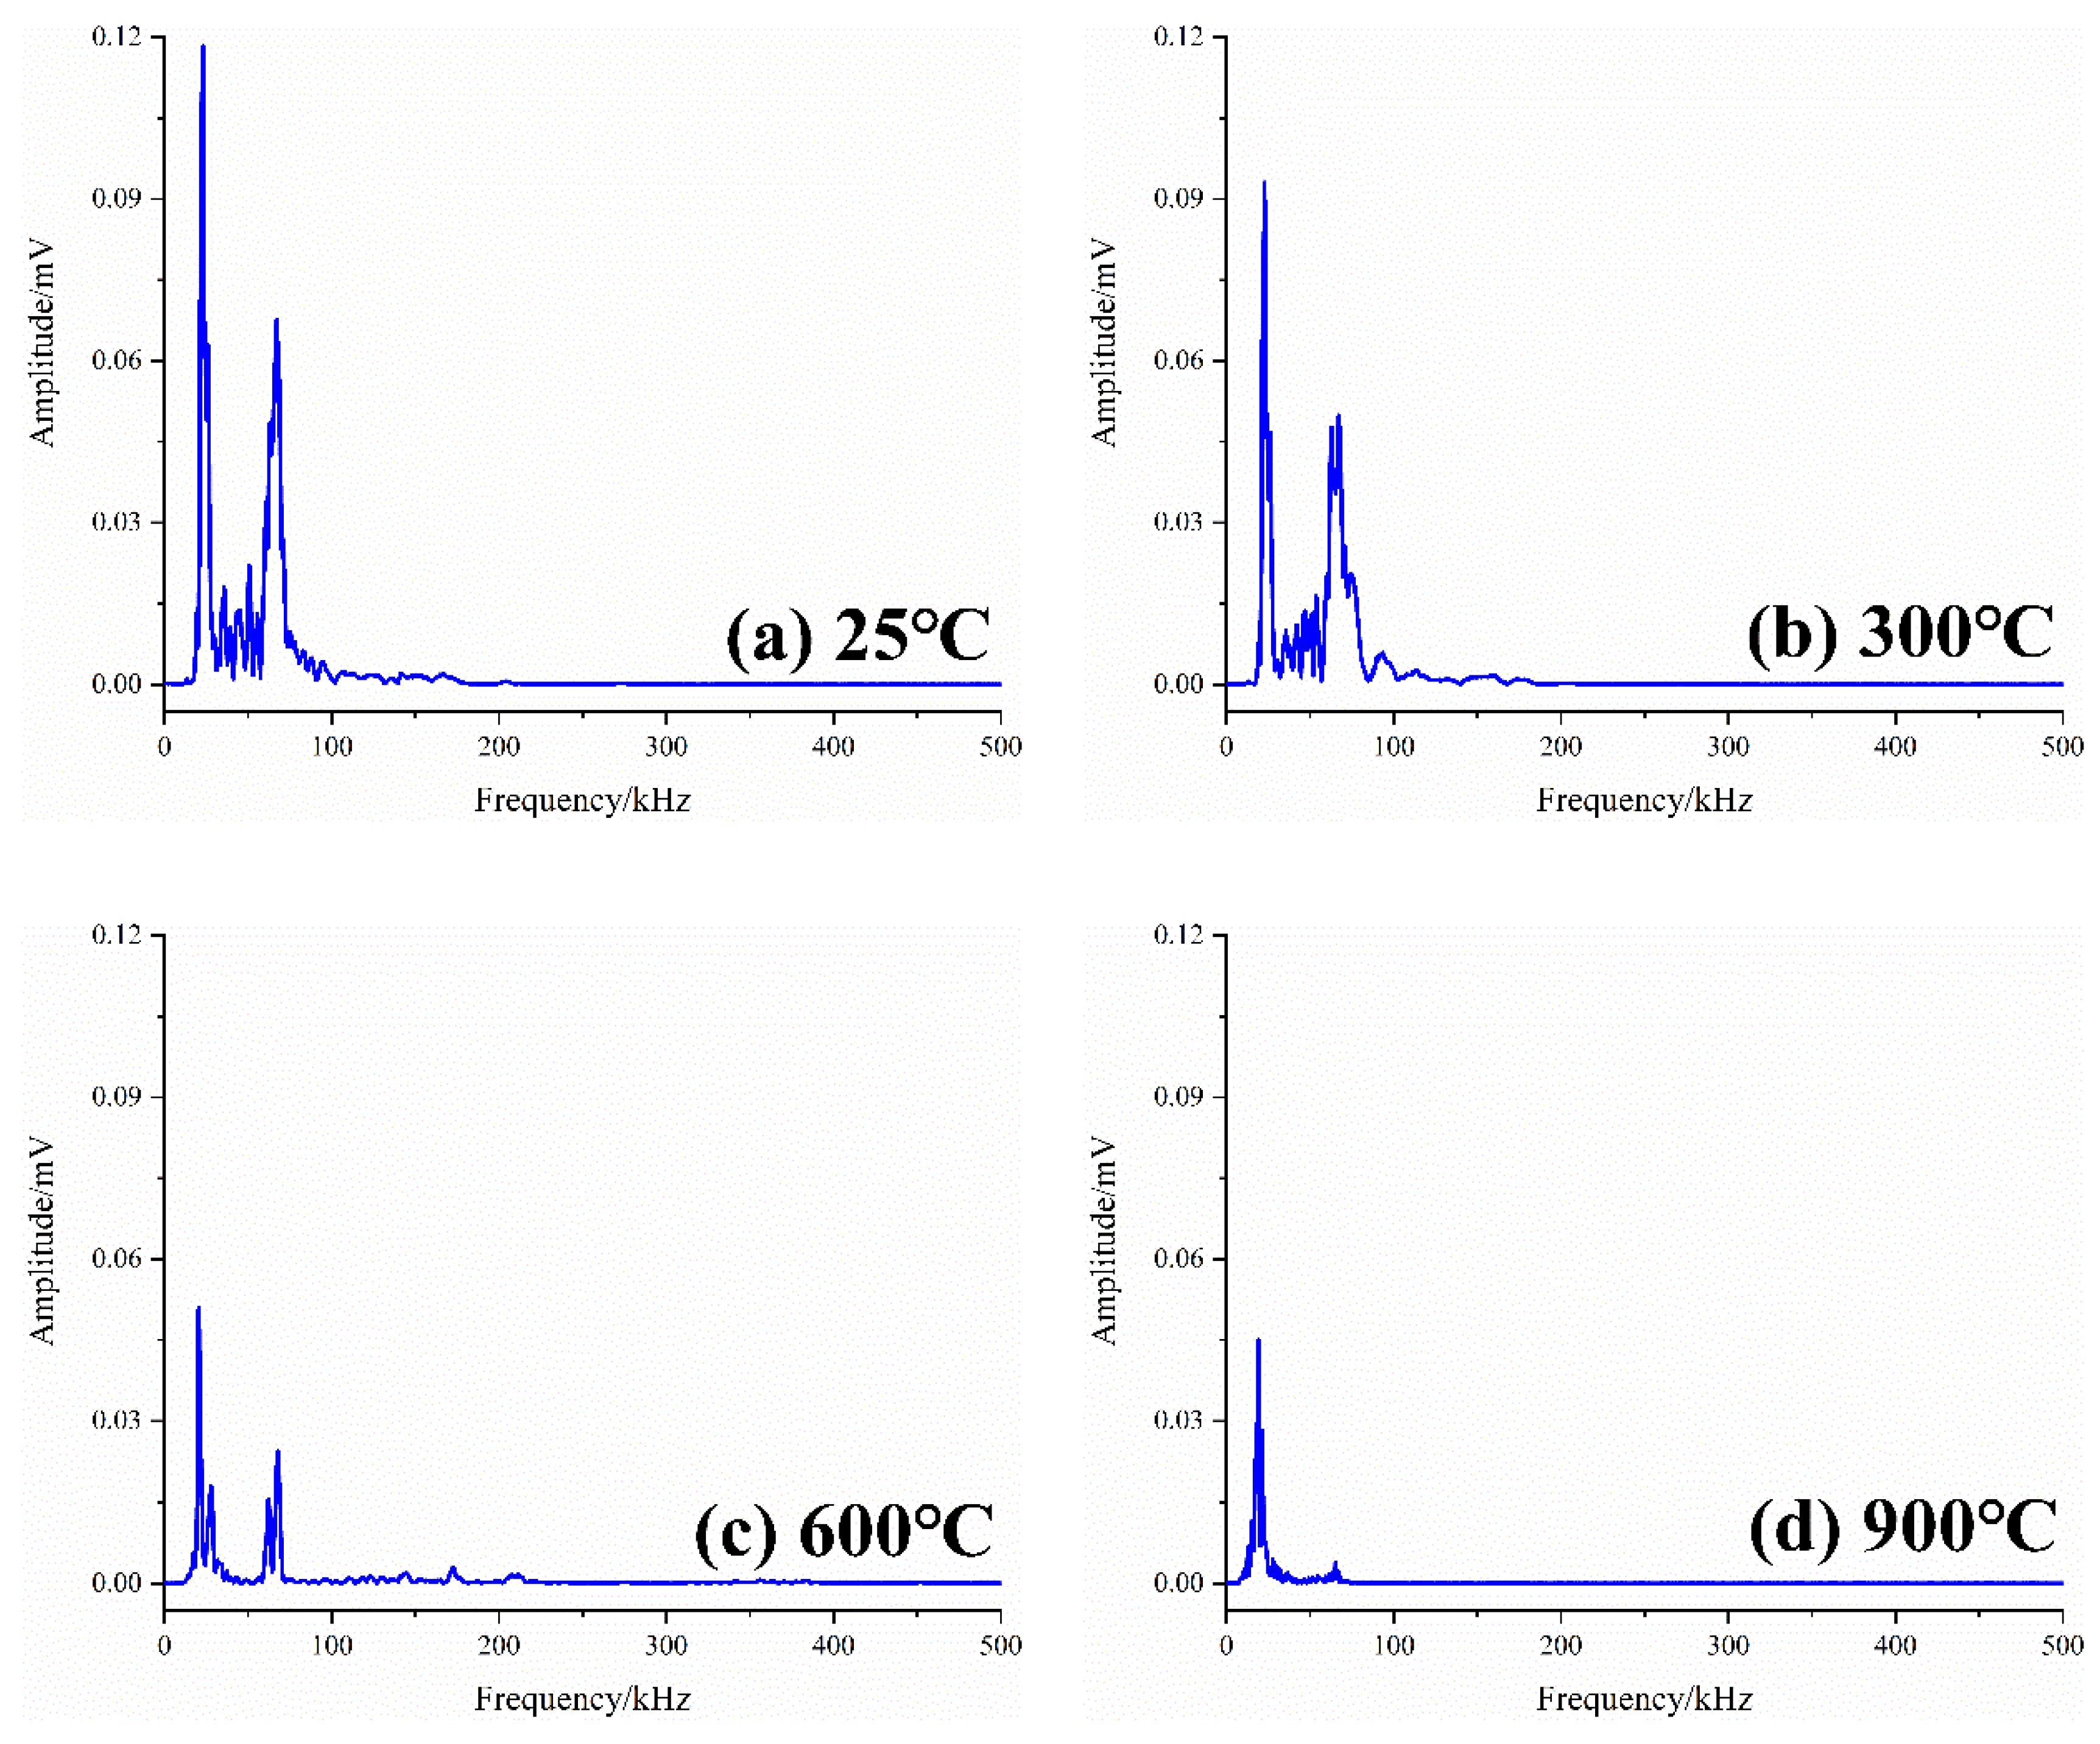
Figure 8.
Changes of main frequency and its amplitude: (a) Main frequency, (b) Amplitude of main frequency.
Figure 8.
Changes of main frequency and its amplitude: (a) Main frequency, (b) Amplitude of main frequency.

Figure 9.
Time-frequency spectrums after STFT: (a) 25 °C, (b) 300 °C, (c) 600 °C, (d) 900 °C.
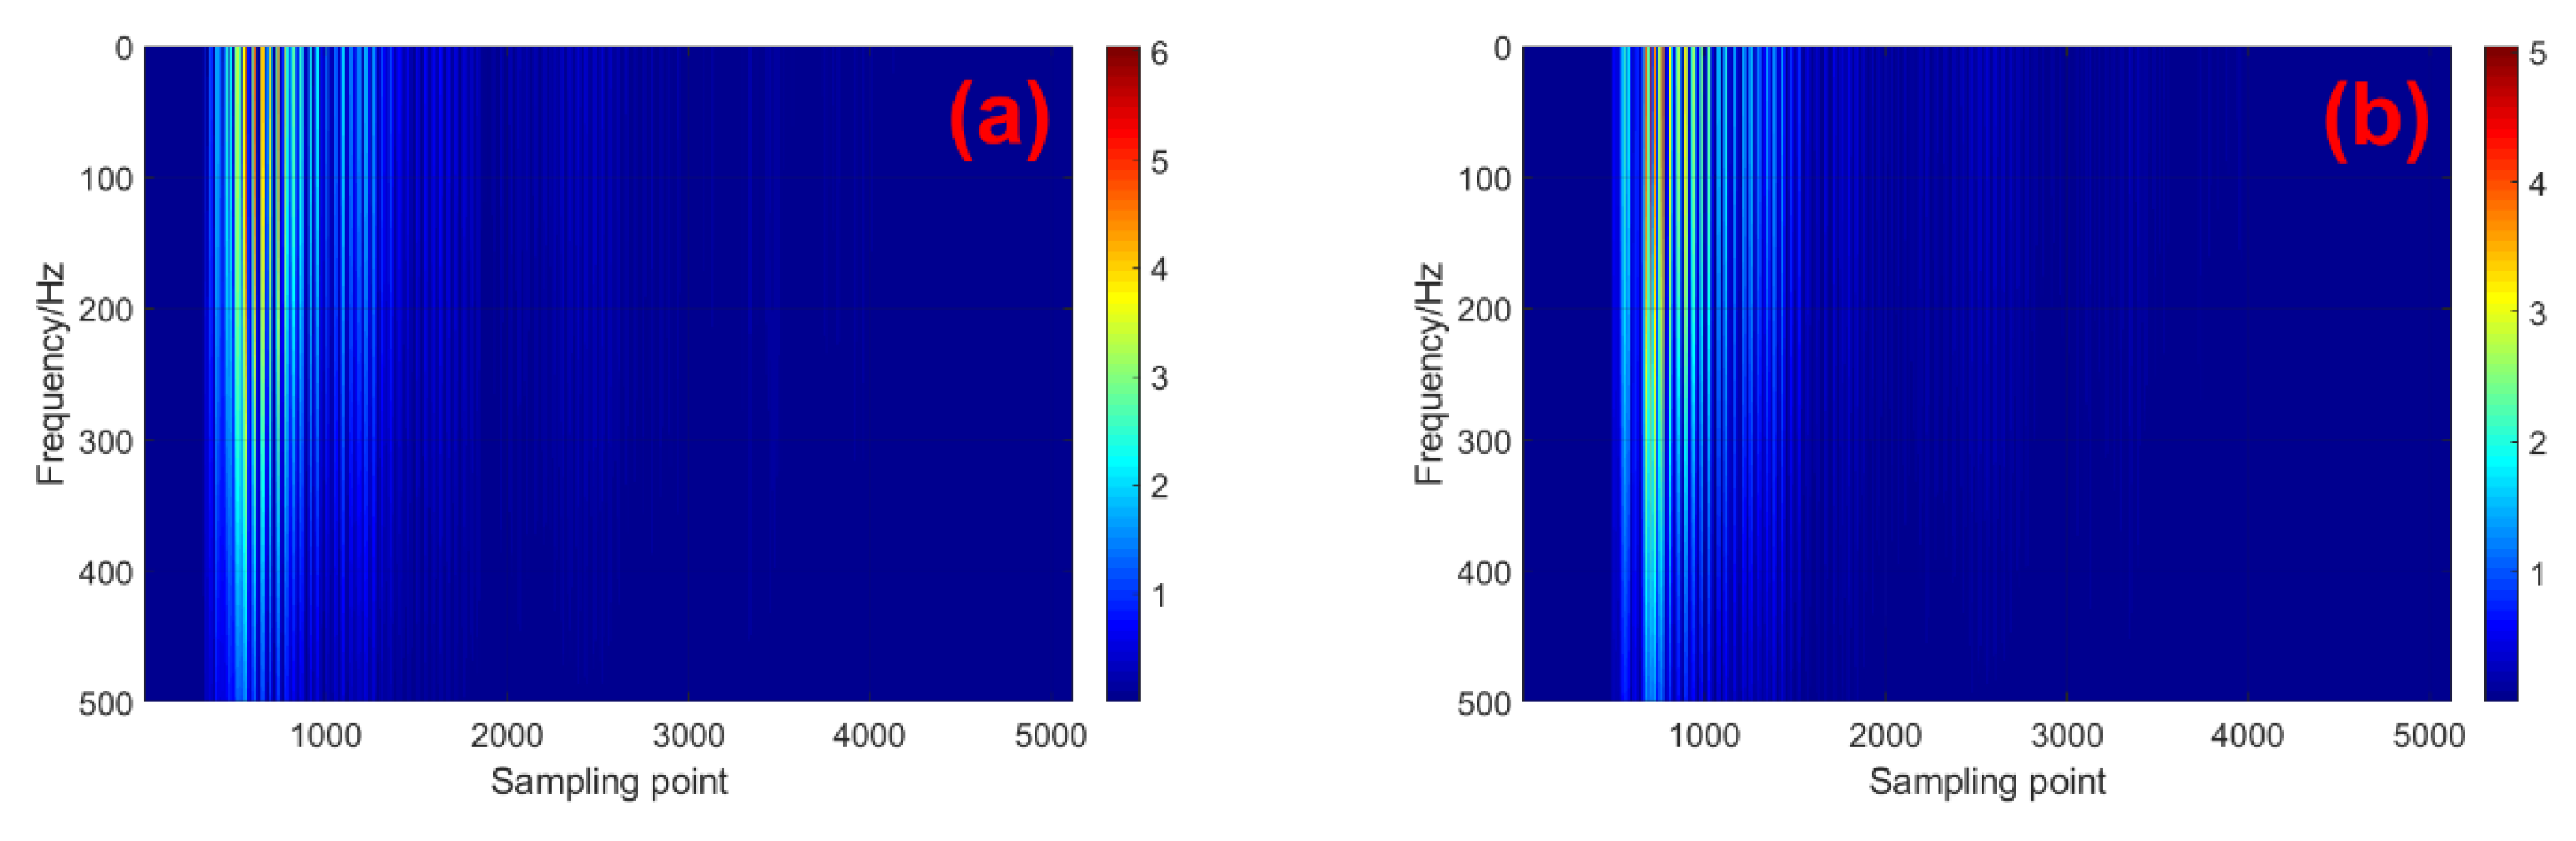
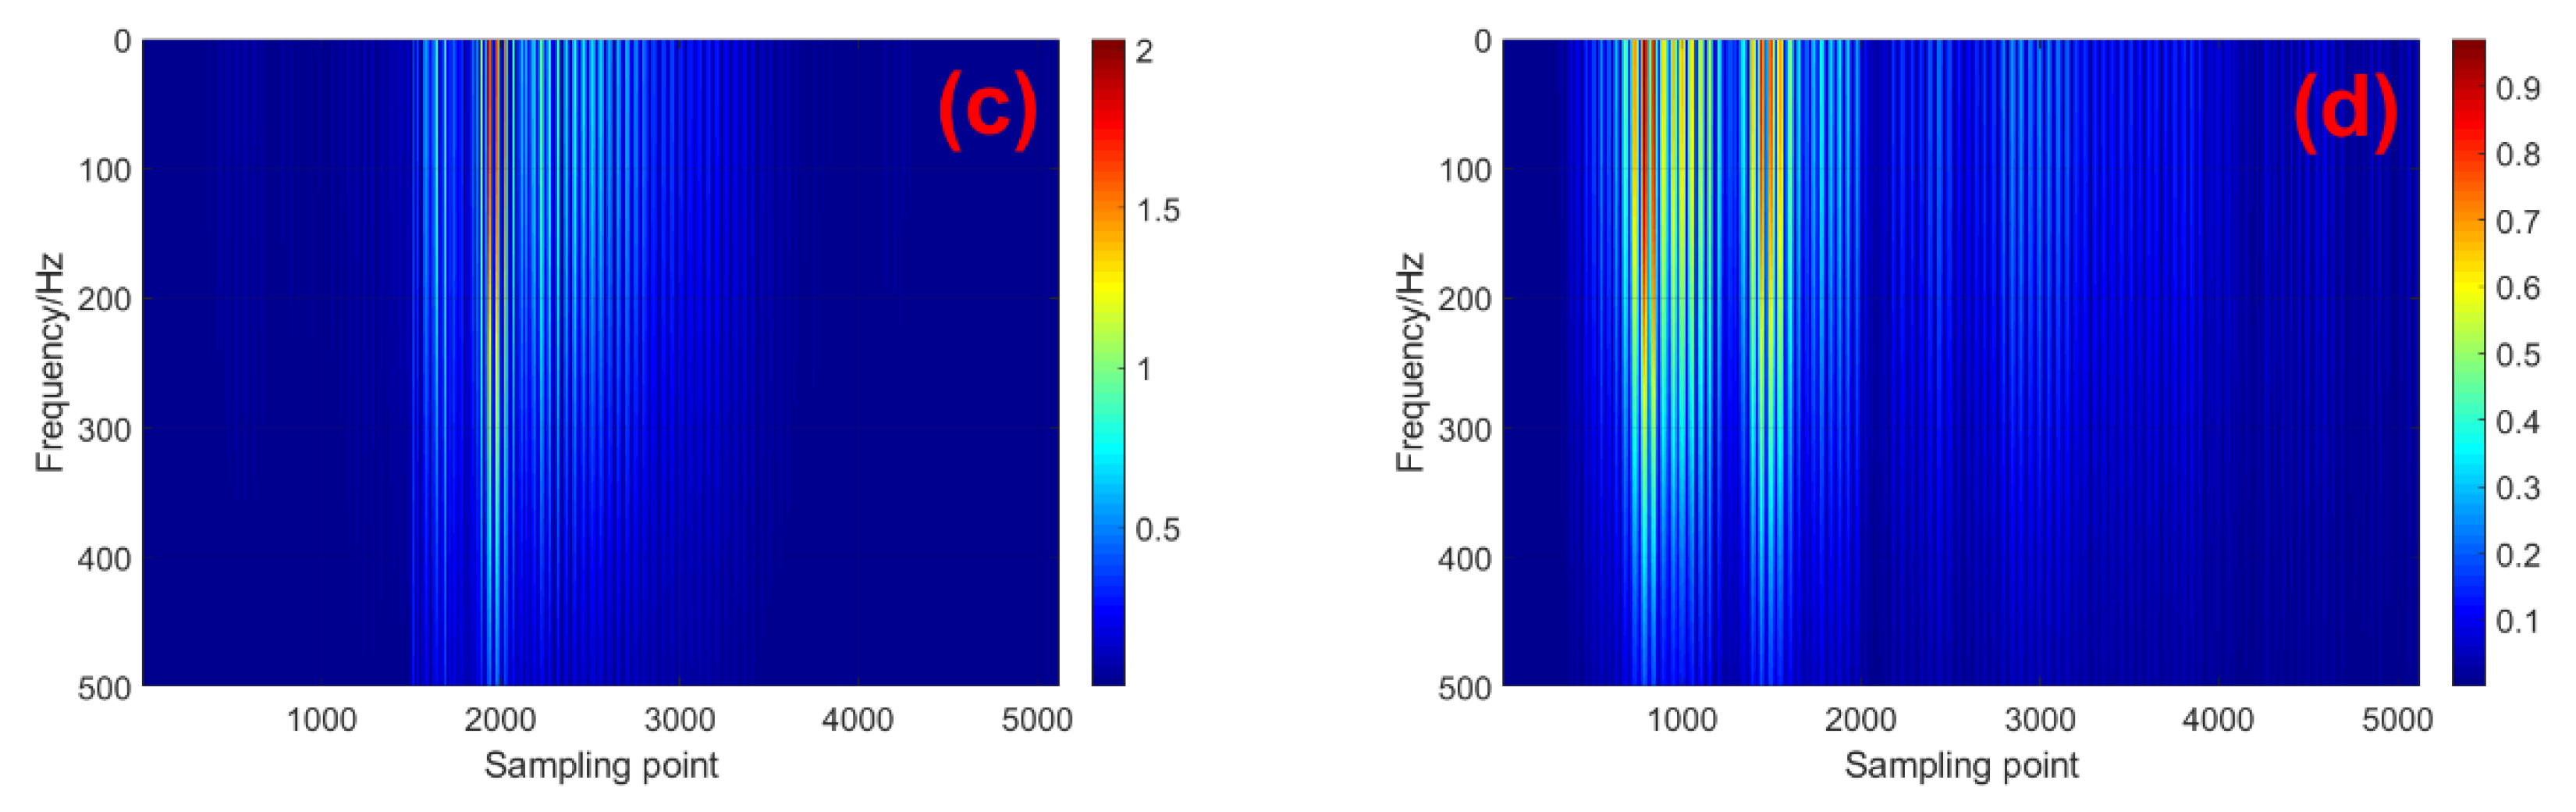
Figure 10.
Multifractal spectrums.
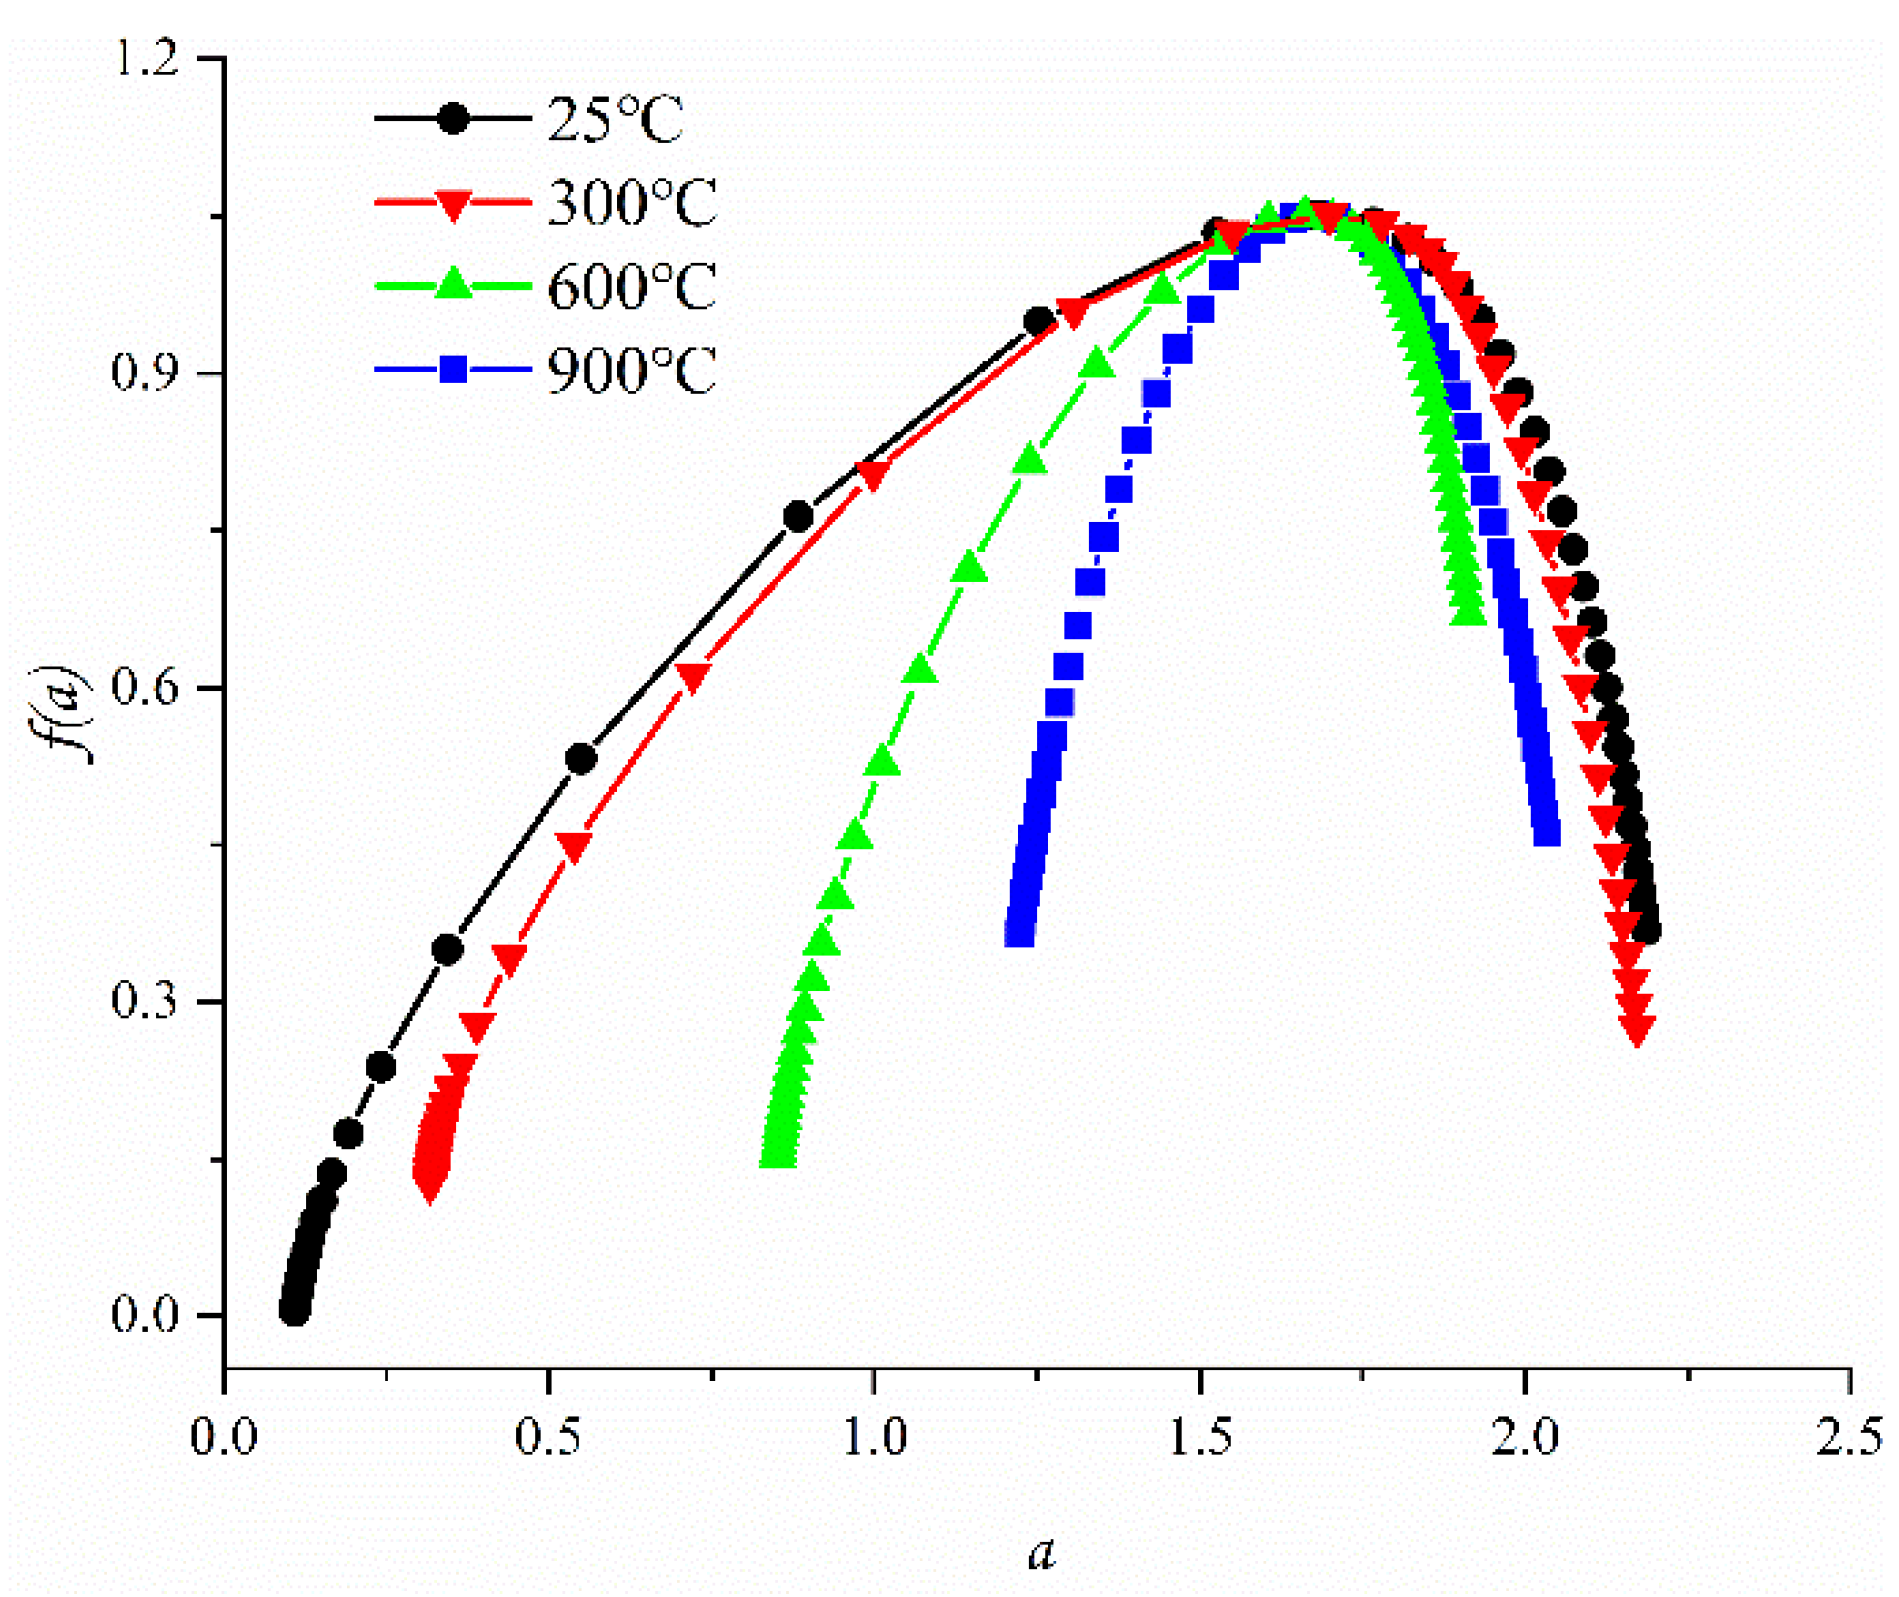
Figure 11.
Changes of multifractal parameters: (a) , (b) .


Table 1.
Specimen number and test results.
| Sample NO. | P-Wave Velocity (km/s) | USC (MPa) | E (GPa) | Total AE Energy (mV·μs) | Peak AE Energy (mV·μs) | |||||
|---|---|---|---|---|---|---|---|---|---|---|
| Value | Mean | Value | Mean | Value | Mean | Value | Mean | Value | Mean | |
| S25-1 | 3.52 | 3.51 | 62.58 | 65.74 | 10.65 | 11.52 | 308,982 | 297,311.5 | 30,120 | 31,788 |
| S25-2 | 3.51 | 68.89 | 12.38 | 285,641 | 33,456 | |||||
| S300-1 | 2.84 | 2.82 | 55.83 | 57.4 | 8.9 | 8.52 | 182,911 | 168,878.5 | 25,657 | 26,657.5 |
| S300-2 | 2.81 | 58.98 | 8.14 | 154,846 | 27,658 | |||||
| S600-1 | 2.38 | 2.36 | 46.03 | 43.76 | 7.87 | 7.5 | 79,938 | 87,521 | 13,093 | 12,037 |
| S600-2 | 2.34 | 41.48 | 7.12 | 95,104 | 10,981 | |||||
| S900-1 | 2.03 | 2.01 | 38.07 | 35.32 | 6.97 | 6.04 | 54,006 | 46,231 | 9125 | 8433 |
| S900-2 | 1.98 | 32.57 | 5.1 | 38,456 | 7741 | |||||
Publisher’s Note: MDPI stays neutral with regard to jurisdictional claims in published maps and institutional affiliations. |
© 2022 by the authors. Licensee MDPI, Basel, Switzerland. This article is an open access article distributed under the terms and conditions of the Creative Commons Attribution (CC BY) license (https://creativecommons.org/licenses/by/4.0/).
Share and Cite
MDPI and ACS Style
Zhang, H.; Guo, W. Acoustic Emission Waveform Characteristics of Red Sandstone Failure under Uniaxial Compression after Thermal Damage. Sustainability 2022, 14, 13285. https://doi.org/10.3390/su142013285
AMA Style
Zhang H, Guo W. Acoustic Emission Waveform Characteristics of Red Sandstone Failure under Uniaxial Compression after Thermal Damage. Sustainability. 2022; 14(20):13285. https://doi.org/10.3390/su142013285
Chicago/Turabian StyleZhang, Herui, and Weihong Guo. 2022. "Acoustic Emission Waveform Characteristics of Red Sandstone Failure under Uniaxial Compression after Thermal Damage" Sustainability 14, no. 20: 13285. https://doi.org/10.3390/su142013285
Note that from the first issue of 2016, this journal uses article numbers instead of page numbers. See further details here.