Article

Effects of Changes in Discretionary Trips and Online Activities on Social and Mental Health during Two Different Phases of the COVID-19 Pandemic in Malaysia

by
Arif Budiarto
1,
Nur Shalin Abdi
2,
Dimas Bayu Endrayana Dharmowijoyo
2,3,4,5,*,
Nursitihazlin Ahmad Termida
6,7,
Basil David Daniel
6,7,
Nur Sabahiah Abdul Sukor
8 and
Liza Evianti Tanjung
2,9
1
Department of Civil Engineering, Universitas Sebelas Maret, Surakarta 57126, Indonesia
2
Department of Civil and Environmental Engineering, Universiti Teknologi PETRONAS, Seri Iskandar 32610, Malaysia
3
Institute of Transport and Infrastructure, Universiti Teknologi PETRONAS, Seri Iskandar 32610, Malaysia
4
School of Planning and Policy Development, Institute Teknologi Bandung, Bandung 40132, Indonesia
5
Department of Civil Engineering, Universitas Janabadra, Yogyakarta 55231, Indonesia
6
Department of Civil Engineering, Faculty of Civil Engineering and Built Environment, Universiti Tun Hussein Onn Malaysia, Parit Raja 86400, Malaysia
7
Smart Driving Research Centre, Faculty of Civil Engineering and Built Environment, Universiti Tun Hussein Onn Malaysia, Parit Raja 86400, Malaysia
8
School of Civil Engineering, Universiti Sains Malaysia, Nibong Tebal 14300, Malaysia
9
Department of Civil Engineering, Universitas Muhammadiyah Sumatera Utara, Medan 20238, Indonesia
*
Author to whom correspondence should be addressed.
Sustainability 2022, 14(21), 13776; https://doi.org/10.3390/su142113776
Submission received: 11 September 2022 / Revised: 12 October 2022 / Accepted: 13 October 2022 / Published: 24 October 2022
(This article belongs to the Collection Sustainability in Urban Transportation Planning)

Abstract

:
An aggregate analysis shows that undertaking fewer work and leisure trips during the pandemic had negative effects on mental health, but reducing trips to grocery shops, pharmacies and parks had the opposite effect, but there is a lack of studies on the effects of behaviour change on mental health using a disaggregate analysis. Beside mental health, a lockdown is assumed to cause social isolation, which is hypothesised to also deteriorate social health due to reducing one’s time spent socialising. This study fills these research gaps and examines the effects of behaviour change on social and mental health during the pandemic. Travel restraints have been relaxed and tightened several times, but no study has investigated the behaviour changes and discrepancies in social and mental health between Malaysia’s strict and relaxed periods. Around 438 respondents reported their behaviour changes during two different travel restraint periods and before the pandemic. This study confirms that the relaxation period caused a significant increase in the number of discretionary trips in Malaysia; however, the increase in discretionary trips did not have any significant effects in improving mental and social health. A disaggregate analysis showed that grocery shopping and socialising trips had negative effects on mental health, as opposed to previous studies using an aggregate analysis. Socialising trips, however, helped to improve the social health conditions.

1. Introduction

Social distancing has been applied as a measure in many countries to inhibit the spread of COVID-19 cases. The ‘lockdowns’ or travel restraints were derived from the social distancing policy, as part of the fight against the virus. The government of Malaysia imposed a full lockdown policy, defined as a Movement Control Order (MCO), on 18 March 2020, and this was followed by the implementation of many new standards to support the MCO [1,2]. The MCO was prolonged, and eased over in stages in 2020 and 2021, including through the Conditional MCO (CMCO) and Recovery MCO (RMCO).
The lockdowns and travel restrictions caused behaviour changes, as indicated by many researchers (e.g., [3,4,5]). People were not permitted to visit usually crowded places or meeting hubs such as the city centre, offices, universities, schools or shopping malls, to reduce the virus transmission. People were forced to undertake various activities at home (including working and schooling), and to use online platforms for these activities. Some offline activities needed to change to online activities, such as online meetings for work or social purposes, online gaming, streaming films instead of going to the cinema, food delivery orders instead of dining out, online grocery shopping instead of grocery shopping in stores, and increased online shopping instead of going to the mall. Online teaching and online libraries were introduced in the education system, to continue teaching, learning, and research without sacrificing the social distance protocols [6,7]. The travel restrictions undermined the social rhythm by depriving individuals of their coping mechanisms for stress [8], because daily trips, especially for socialising and discretionary trips, were limited during the pandemic.
Certain activities are considered to be more pleasurable, including socialising, and recreation or leisure activities, and are deemed to have a positive effect on people’s everyday well-being [9,10]. Eliminating these activities and imposing the repetitive use of a place for a substantial period might, therefore, correlate with negative social health (SH) and mental health (MH) effects [11,12]. Studies have reported that the cases of depression, loneliness and boredom were double, triple or even quintuple of those from before the pandemic [13]. Less social contact and limitations to out-of-home activities or trips might correlate with negative effects on SH and MH, resulting in depression and anxiety [14,15]. The activation of unpleasant feelings such as worry/fear, annoyance, frustration and irritation could also be overwhelming, and heighten psychological distress [8,16]. Meanwhile, chronic social isolation due to social distancing, restrictions on social activities or limited opportunities for physical social engagements could also significantly correlate with low SH [17,18].
Regulations restricting travel for a relatively long duration required the closure of various business activities—particularly in the tourism, travel and hospitality sectors—and led to a loss of employment status for many people in Malaysia [8]. Income insecurity and uncertainty resulted in more depression and social isolation. Nanath et al. [19] found that reducing the working and recreation trips during the pandemic was negatively correlated with MH, whereas decreasing trips to grocery stores, pharmacies and parks had the opposite effect on MH; however, their study used aggregate data to measure the effects of various trip purposes on MH. To the best of our knowledge, the effects of reducing some trip purposes and out-of-home activities using a disaggregate model have not yet been explored, and this study aims to fill this research gap. The study by [19] also did not include SH measurements. Expanding the effects of behaviour change on the deterioration of SH is, therefore, also the gap that will be answered in this study.
Hartwig et al. [5] considered the reduction in activity time for travelling, working, schooling, physical shopping and personal activities, and also highlighted the increased time spent eating and in leisure activities using a disaggregate analysis in Austria; however, they did not measure the effects of behaviour change on SH and MH. Using a disaggregate analysis, more walking and cycling were hypothesised to improve people’s SH and MH, and some online activities were hypothesised to ease people’s daily activities during the pandemic, which might correlate to a better SH and MH; however, a long time spent working or studying from home was hypothesised to correlate with a low SH and MH.
Travel restrictions have been lifted and tightened multiple times in many countries. The MCO in Malaysia initially ran from 18 March to 3 May 2020. The MCO was lifted and replaced by a CMCO due to the decreasing number of COVID-19 cases; this led to the partial reopening of economic activities and allowed movement across districts within a state, without permitting inter-state travel [1]. The CMCO was active from 4 May to 9 June 2020, and then a further relaxation was promoted under the RMCO, which ran from 10 June 2020 to 31 March 2021. Inter-state movement was allowed under the RMCO, which reopened almost all economic sectors [2]. To the authors’ knowledge, there has been limited or no investigation of the effects of this relaxation on increasing the number of trips for various purposes and out-of-home activities and on SH and MH. It was hypothesised that relaxing the control of movement improved people’s SH and MH in Malaysia due to the increased number of trips and participation in out-of-home activities. A statistical analysis should be conducted, however, to measure whether the improved MH is statistically different from that under the MCO; this is the second research gap investigated in this study.
This study used a disaggregate analysis to investigate whether reducing trips for various out-of-home activities and performing activities online for a long period during the two different lockdown periods (the MCO/CMCO and RMCO) was significantly correlated with SH and MH. The authors assumed that people had similar activity-travel patterns during the MCO and CMCO, both of which disallowed the operation of numerous business activities in Malaysia. On the other hand, the RMCO was assumed to have encouraged more trips, particularly inter-state and recreation trips, which were barred in the two earlier stages. It was, therefore, hypothesised that there should have been a SH and MH improvement in the RMCO in Malaysia between March and April 2021, which means the data collection was performed between the end of the RMCO period and the beginning of the state-based MCO (from 1 April to 31 May 2021). The state-based MCO was implemented due to the increasing number of cases of the Delta variant in several states in Malaysia. This was then continued as a total lockdown, or MCO, in all states from 1 June to 8 November 2021. The data in the present study include the perceived discrepancy in the trips undertaken for various discretionary activities and online activities between the two travel restriction periods in Malaysia, as well as compared to before the pandemic. The built environment conditions of home locations, including their districts and states, were also captured. The dataset also recorded the SH and MH, and the affective well-being of the respondents during the two different stages of travel restrictions.

2. Literature Review

2.1. Activity—Travel Behaviour Change during the COVID–19 Pandemic

It is acknowledged that the pandemic has reshaped daily routines into new behavioural patterns. A number of studies have found, as a part of life course analysis, that the change in life events has changed people’s activity-travel behaviour [20,21,22,23,24,25,26,27]. Because social distancing was implemented as the main policy for cutting the chain of viral transmission, reductions in people’s mobility of 20–40% were found to reduce the COVID-19 cases [28]. Many places saw a decline in trips by more than 50% compared to normal, including Switzerland [29,30], the US [31], Germany [32], the Netherlands [33], Indonesia [34], Australia [35,36], Taiwan [37] and Sweden [38]. Almost all people implemented preventive and avoidant behaviour in Singapore, including using online shopping more often and avoiding public transport and public spaces [39]. Digital technology was found to replace activities such as online shopping and streaming films [40,41,42] and to move business functions to a digital platform [43,44].
The most significant trip reduction was found in public transport [37,45,46]. The reduction of trips using public transport was 90% in Switzerland [46], and 70% in Zurich alone [45], particularly in the first two months of the lockdown between March and April 2020. The number of public transport users declined to almost 50% of normal in Taipei, Taiwan [37]. The effects of COVID-19 were more significant at the weekends compared to weekdays in Taipei [37]. An analysis of the daily ridership in metro stations located near leisure and entertainment areas, suggests that there was a decrease in recreational leisure trips for both weekends and weekdays, due to factors perceived by the population, who intended to reduce their recreational leisure trips in response to the fear of infection [37].
A study investigating the activity-travel behaviour changes due to COVID-19 in Australia found that the outbreak distorted the respondents’ out-of-home activities, such as shopping, social activities and dining trips, by 76%, 80% and 76%, respectively [35]. In a study examining the change in activities and associated travel during the beginning of the COVID-19 pandemic in Indonesia, around 71.28% and 15.82% of the respondents reported that their out-of-home activities were “very significantly” and “significantly” reduced, respectively. When focusing on socialising and discretionary trips, the data analysis showed that sightseeing and dining trips also decreased, from at least three times to once a week during the pandemic [34]. Generally, unperformed work, retail and recreation activities also appear to be negatively associated with low MH [19], while changes in activity-travel behaviour from offline to online are expected to have a longer-term impact because people experience the benefits of online tools for communications (e.g., Skype, Zoom, Microsoft Teams, Webex and Google Meet) and teleworking [4]. The pandemic has shifted customer behaviour to the use of digital technology [47] due to the effects of social norms and word of mouth [41], both in personal and business communications [48,49] and a better knowledge of COVID-19 and consistency to implement social distancing were found to positively correlate with attitudes toward social media use, and in turn, using social media more often [49]. The habits created during the pandemic seems to have continued, thus, creating new habits [41].

2.2. Connection between Travel Behaviour and Social and Mental Health

In the time–space prism, the travel and activity participation of individuals is shaped by the interaction of needs, constraints and resources. Activities are undertaken to fulfil needs and desires, and each activity has been found to have a different level of enjoyability [9], activity well-being [50,51] and daily experience [52]. Each activity corresponds with a specific need, such as a basic need or a need for material resources (e.g., working, schooling, extracting foods from nature and grocery shopping); a love or immaterial need (e.g., socialising, dating and family engagements); and self-actualisation needs (e.g., climbing Mount Everest, representing a country in a competition or receiving an award). People need to engage in activities more often in order to fulfil their love and/or self-actualisation needs such as recreation and socialising activities, and most would like to spend less time on activities to satisfy their basic needs, or obligation activities such as out-of-home maintenance activities (e.g., grocery shopping, errands, health care and shopping for other things), particularly in developed countries [53]. Socialising and recreation were found to have a higher rate of enjoyability [9], a better sense of activity well-being [50,51] and to correlate with a better daily experience [52] and global subjective well-being [10], whereas working, studying and travelling have the opposite effect. Participation in activities with a low rate of enjoyability, low activity well-being or correlating with worse daily experience might be necessary to fulfil basic needs, whereas undertaking more enjoyable activities might have the objective of fulfilling higher-level needs such as love/psychological and self-actualisation needs [53,54,55,56].
From a time–space prism perspective, activities with a low rate of enjoyability, such as working, studying and dropping off or picking up children, are seen as high-level constraints or commitments. It tends to be difficult to reschedule activities with high-level constraints as they have a higher temporal or spatial fixity [57,58,59,60]. Difficulties in rescheduling such activities make them an anchor and dictate other activities that are easier to reschedule, such as maintenance and leisure activities, or activities with a higher or lower rate of enjoyability [61,62,63]. People in developing countries were, therefore, found to prioritise working and grocery shopping, but categorised leisure and socialising activities as impulsive activities, or activities that can be performed when people have spare time [64]. People in developed countries, however, saw socialising as a more fixed activity than working and grocery shopping [65]. The activity location, including the built environment conditions (e.g., land use shape and the road and public transport networks) and other related conditions (e.g., income and the availability of private vehicles as defined by [23,27]), also determine the opportunities for, or barriers to, engaging in various types of out-of-home activities, otherwise called resources. The examples above indicate the interrelationships between activities with high and low rates of enjoyability, which includes people’s daily situations and reveal the interactions between constraints, needs and resources.
Well-being can be a proxy for SH and MH [66,67]. An experience of performing an activity or trip that is enjoyable might correlate with positive SH and MH and this can be reflected in satisfaction with engaging in the activities and trips, or the time allocated to do so. Some studies have suggested that well-being or an experience to perform a specific activity might mediate the effects of activity-travel patterns on SH and MH [10,52,66,68]. Other studies, however, have suggested that the effects of the activity-travel patterns are directly correlated to SH and MH [69,70,71].
Participation in some out-of-home activities has been hypothesised to correlate with better SH and MH, while performing more trips for a particular purpose has also been hypothesised to correlate with SH and MH. Before the pandemic, individuals with a balanced life (i.e., with enough time for active leisure/travel, leisure activities, work/school and sleep) were shown to have better physical, mental and social health [60,72]. This shows that, theoretically, individuals need to have more regular leisure and social engagements associated with a longer amount of time spent on, and a higher frequency of, activities and trips in order to improve their SH and MH. More time at home or limiting out-of-home activities—particularly activities for fulfilling higher level needs (e.g., love or immaterial needs and self-actualisation needs)—is hypothesised to significantly correlate with worse SH and MH. Activities for fulfilling higher-level needs have been limited during the pandemic. Understanding people’s behaviour has been found to be a significant factor in improving an organisation’s performance [73], which has also been found to be significantly associated with social and mental health performance [67,68,69]. Built environments and policies only stimulate behaviour, whereas people might perform an opposite behaviour from a policy [73], for satisfying their well-being or health conditions; therefore, for avoiding a counter-productive policy, the suggested policy to maintain SH and MH in a future pandemic should be proposed from an empirical study of the previous pandemics. This is the focus of the present study: investigating the effects of the reduced time spent on various trips, and the increased time spent on online activities, as a replacement for out-of-home activities in the previous COVID-19 pandemic, on SH and MH.

2.3. Travel Restrictions in Malaysia

Social distancing was the standard approach to stopping the transmission of COVID-19 outbreaks across the world. Many countries applied social quarantines—popularly called lockdowns—to support social distancing. Malaysia adopted travel restrictions or lockdowns (i.e., the MCO; [1,2]) after two outbreaks at the beginning of 2020, which increased the number in COVID-19 cases. The MCO was intended to last for eight weeks, from 18 March to 12 May 2020, but on 4 May the MCO was changed to a CMCO, which included the partial opening of some economic sectors [2]. Due to the decrease in COVID-19 cases, the Prime Minister announced a relaxation of the MCO/CMCO (i.e., the RMCO), and the reactivation of economic, education, religious, hospitality and tourism sectors, including meetings, conventions and exhibitions, with a strict standard operating procedure. On 1 April 2021, Malaysia returned to a state-based MCO due to an increase in the spread of the Delta variant, and the entire country then returned to a general MCO (for all states) on 1 June 2021.
Inter-district movements were relaxed during the CMCO, but inter-state travel was still prohibited. During the RMCO, however, the inter-state travel restrictions were relaxed. In this study, the authors assumed that there were no significant activity-travel pattern differences between the MCO and CMCO periods. Due to the reopening of almost all activities and all travel options, however, the authors assumed that there was a huge difference in the activity-travel patterns between the MCO/CMCO and RMCO periods. The assumptions about the discrepancy in activity-travel patterns between the MCO/CMCO and RMCO periods were, therefore, investigated. The different activity-travel patterns during the two different travel restriction periods mean it was also hypothesised that the SH and MH would be significantly different, and this was investigated as well.

3. Data Collection

3.1. Data Collection Process

Travel behaviour research relies on observing people’s activity-travel behaviour in a specific context, such as the travel time, number of trips, number of trip chains, intention to participate in a particular activity, and behaviour change. A self-reported survey is usually used to observe people’s behaviour, even though other methods such as a non-self-reported survey or observation by a secondary party can also be used. Since a statistical analysis is used for the analysis, which requires data adequation, a self-reported survey is a more appropriate choice for practical reasons.
The traditional data collection method is via face-to-face meetings and paper and pencil. Interaction between the surveyors and respondents is important, particularly in developing countries, for ensuring that the information provided meets expectations [61]. A face-to-face meeting also aims to secure the expected sample size or to reach the minimum amount of data. It was impossible to undertake face-to-face meeting data collection during the COVID-19 pandemic, considering the uncertainty of the pandemic situation. The emerging new variants and unacceptable vaccination rate meant that the government authorities still applied a full health protocol and direct social contact was avoided, even though the policy was relaxed several times. During such a highly uncertain situation, face-to-face meetings and paper and pencil were also too risky for both the surveyors and the respondents. Online data collection was, therefore, proposed.
The 2021 COVID-19 Malaysia dataset was collected during the pandemic from March to May 2021. The data collection was conducted on the cusp between the RMCO stage and another full lockdown, or the MCO phase, in April 2021. An online format was chosen due to uncertain situations. The dataset contained several sections. The first section collected socio-demographic information, including the state of the residential location. The second section asked about the perceived change in trip frequency for various purposes and travel use by various modes during (MCO/CMCO and RMCO) and before the pandemic, and the third section was intended to determine people’s activity-travel patterns, the perceived change in various online activity patterns during and before the pandemic; and to make a comparison of the perceived frequency of using social media, gadgets and computers during and before the pandemic; thus, the affective well-being. The fourth, final, section collected information about SH and MH conditions during the MCO/CMCO and RMCO.
The socio-demographic information included personal and household information such as gender, age, employment status, number of households, income, and number of accessed cars and motorcycles. The state of the residential areas was examined to differentiate the SH and MH patterns in different states.
In order to determine the perceived changes in trip frequency and online activity patterns, the respondents were asked questions such as: “Do you perceive that your performed trips for working/grocery shopping/dining/socialising/sports/healthcare on weekdays or weekends were more frequent during MCO/CMCO and RMCO than before the pandemic?”, “Do you perceive that your number of trips on weekdays or weekends was higher during MCO/CMCO and RMCO than before the pandemic?” and “Do you perceive that your online activities (work/school from home [WFH/SFH], e-grocery, e-shopping, e-meeting, food-delivery and movie streaming) were more frequent during MCO/CMCO and RMCO than before the pandemic?” The items were rated on 7-point Likert scales, ranging from strongly disagree to strongly agree. If the respondents undertook trips or online activities more often for a specific purpose during the MCO/CMCO and RMCO than before the pandemic, they responded “agree or “strongly agree”; however, if they performed such trips or online activities less often during the pandemic period than before the pandemic, they answered “strongly disagree” or “disagree”. Finally, if they perceived that the number of performed trips was similar during and before the pandemic, they answered in the middle range, “neutral”.
After the screening process, a total of 438 respondents completed the survey. A lunch or dinner voucher was offered as a token of appreciation for those who completed the survey. The survey was conducted in urban areas in Malaysia. A convenient sampling method was applied, within a population of around 15,795,200 in eight urban areas in the Malaya Peninsula, Malaysia [74]. The survey covered 0.003% of the population in those eight urban areas; the areas represented in this survey were the Kuala Lumpur Metropolitan Area (KLMA, including Kuala Lumpur and six districts in the State of Selangor, Gombak, Petaling, Klang, Sepang, Hulu Langat and Kuala Langat, as defined by [75]; the Penang Metropolitan Area (PMA); the Johor Bahru Metropolitan Area (JBMA); the Ipoh Urban Area (IUA), the Alor Setar Urban Area (ASUA); the Kota Bharu Urban Area (KBUA); the Kuantan Urban Area (KUA); and the Kuala Trengganu Urban Area (KTUA). Some small urban areas were combined to simplify the analysis. The IUA and ASUA were combined to represent metropolitan areas in the northern region, and the KBUA, KUA and KTUA were combined to represent metropolitan areas in the east coastal region. Because they covered a population of more than 1.5 million, the KLMA, PMA and JBMA were left to stand alone.
Table 1 shows the sample descriptions. The northern region and JBMA were oversampled at 27.63% and 23.29%, respectively, whereas the proportions of the population compared to all eight urban areas were only 14.44% and 15.27%, respectively. The KLMA, PMA and the east coastal region were under-sampled at 33.56%, 7.76% and 7.76% in comparison to their population shares of 45.05%, 10.37% and 14.86%, respectively, among the eight urban areas. Performing the survey during the pandemic might explain why the sample was lower than 0.01%, and why the proportions for each region in the sample did not match their relative populations.
The respondents were skewed to more females (66.50%) and fewer males (33.50%). Around 40.40% of the respondents were from Gen Z (below 25 years old), and around 55% were from Gen Y. Only 4.60% of the respondents were not Millennials, or not from Gen Z and Y. Persons from low-income households only accounted for 20.30% of the respondents, and the rest were from middle-high income households. Most of the respondents were educated or at least had a diploma degree, and 6.60% only had a high school degree. People from low-income households did not seem to be under-represented, but the respondents were generally more educated people compared to the population as a whole [74]. In addition, 93% of the respondents had a fixed commitment such as being students or workers, and only 6.60% were non-workers.

3.2. The Proposed Analysis Method

Bivariate and multivariate analyses were proposed in the analysis. A bivariate analysis with a one-way ANOVA was applied. An ANOVA was chosen because almost all the behaviour change data tended to be normally distributed. The bivariate analysis applying the statistical difference of the mean role was the preliminary analysis used to investigate the statistical difference between activity-travel patterns during the MCO/CMCO and RMCO stages. The bivariate analysis with the one-way ANOVA also measured whether people’s SH and MH in two different stages of the MCO resulted in SH and MH results that were also different or the same. This analysis answers the second objective of this study.
The bivariate analysis with the one-way ANOVA was also extended to provide preliminary results regarding whether those who reduced their trips for various purposes during the two different stages in Malaysia statistically tended to have lower SH and MH, as hypothesised, than those who had a similar trip number, or more trips, for various purposes during those two stages. This second bivariate analysis objective fulfils the first objective of this study.
The preliminary bivariate analysis was used as an indication of the effects of the declining trips for various purposes during the pandemic on the SH and MH, and to determine whether the SH and MH were similar or different in the two different stages. A multivariate analysis was applied to further investigate the first and second objectives using a more advanced statistical model. A multilevel regression model was applied for these purposes. The multilevel regression had objectives in which the activity-travel patterns had significant effects on worsening and improving the SH and MH. The multilevel effects also account for whether the variance of the activity-travel patterns performed during the two different stages, namely, the MCO/CMCO and RMCO, did have or did not have a significant effect on the SH and MH. The multilevel effect confirms whether or not the variances in the performed activity-travel pattern had nearly zero effects (or had very limited effects), or had high values (or had significant effects) in explaining the error term. The general equation of the multilevel modelling is shown in Equation (1). Since this study focuses on investigating whether there were variability effects of behaviour change during two different COVID-19 stages on SH and MH, this study only includes the time effects (t) as suggested by other health studies [76,77]. However, geographical variances were not included in this study as opposing other health studies [76,77].
Y i t = β X i t + α + u i + ϵ i t   i = 1 ,   2 ,   ,   N ,   t   = MCO / CMCO ,   RMCO
where:
Y i t = social and mental health,
X i t = vectors of explanatory variables,
β = estimated coefficient representing each explanatory variable,
α = intercept,
ui = individual i specific error term due to having different activity-travel patterns and SH and MH conditions in different COVID-19 stages (or defined as a different COVID-19 lockdown phase error term),
ϵ i t = independent random error term.

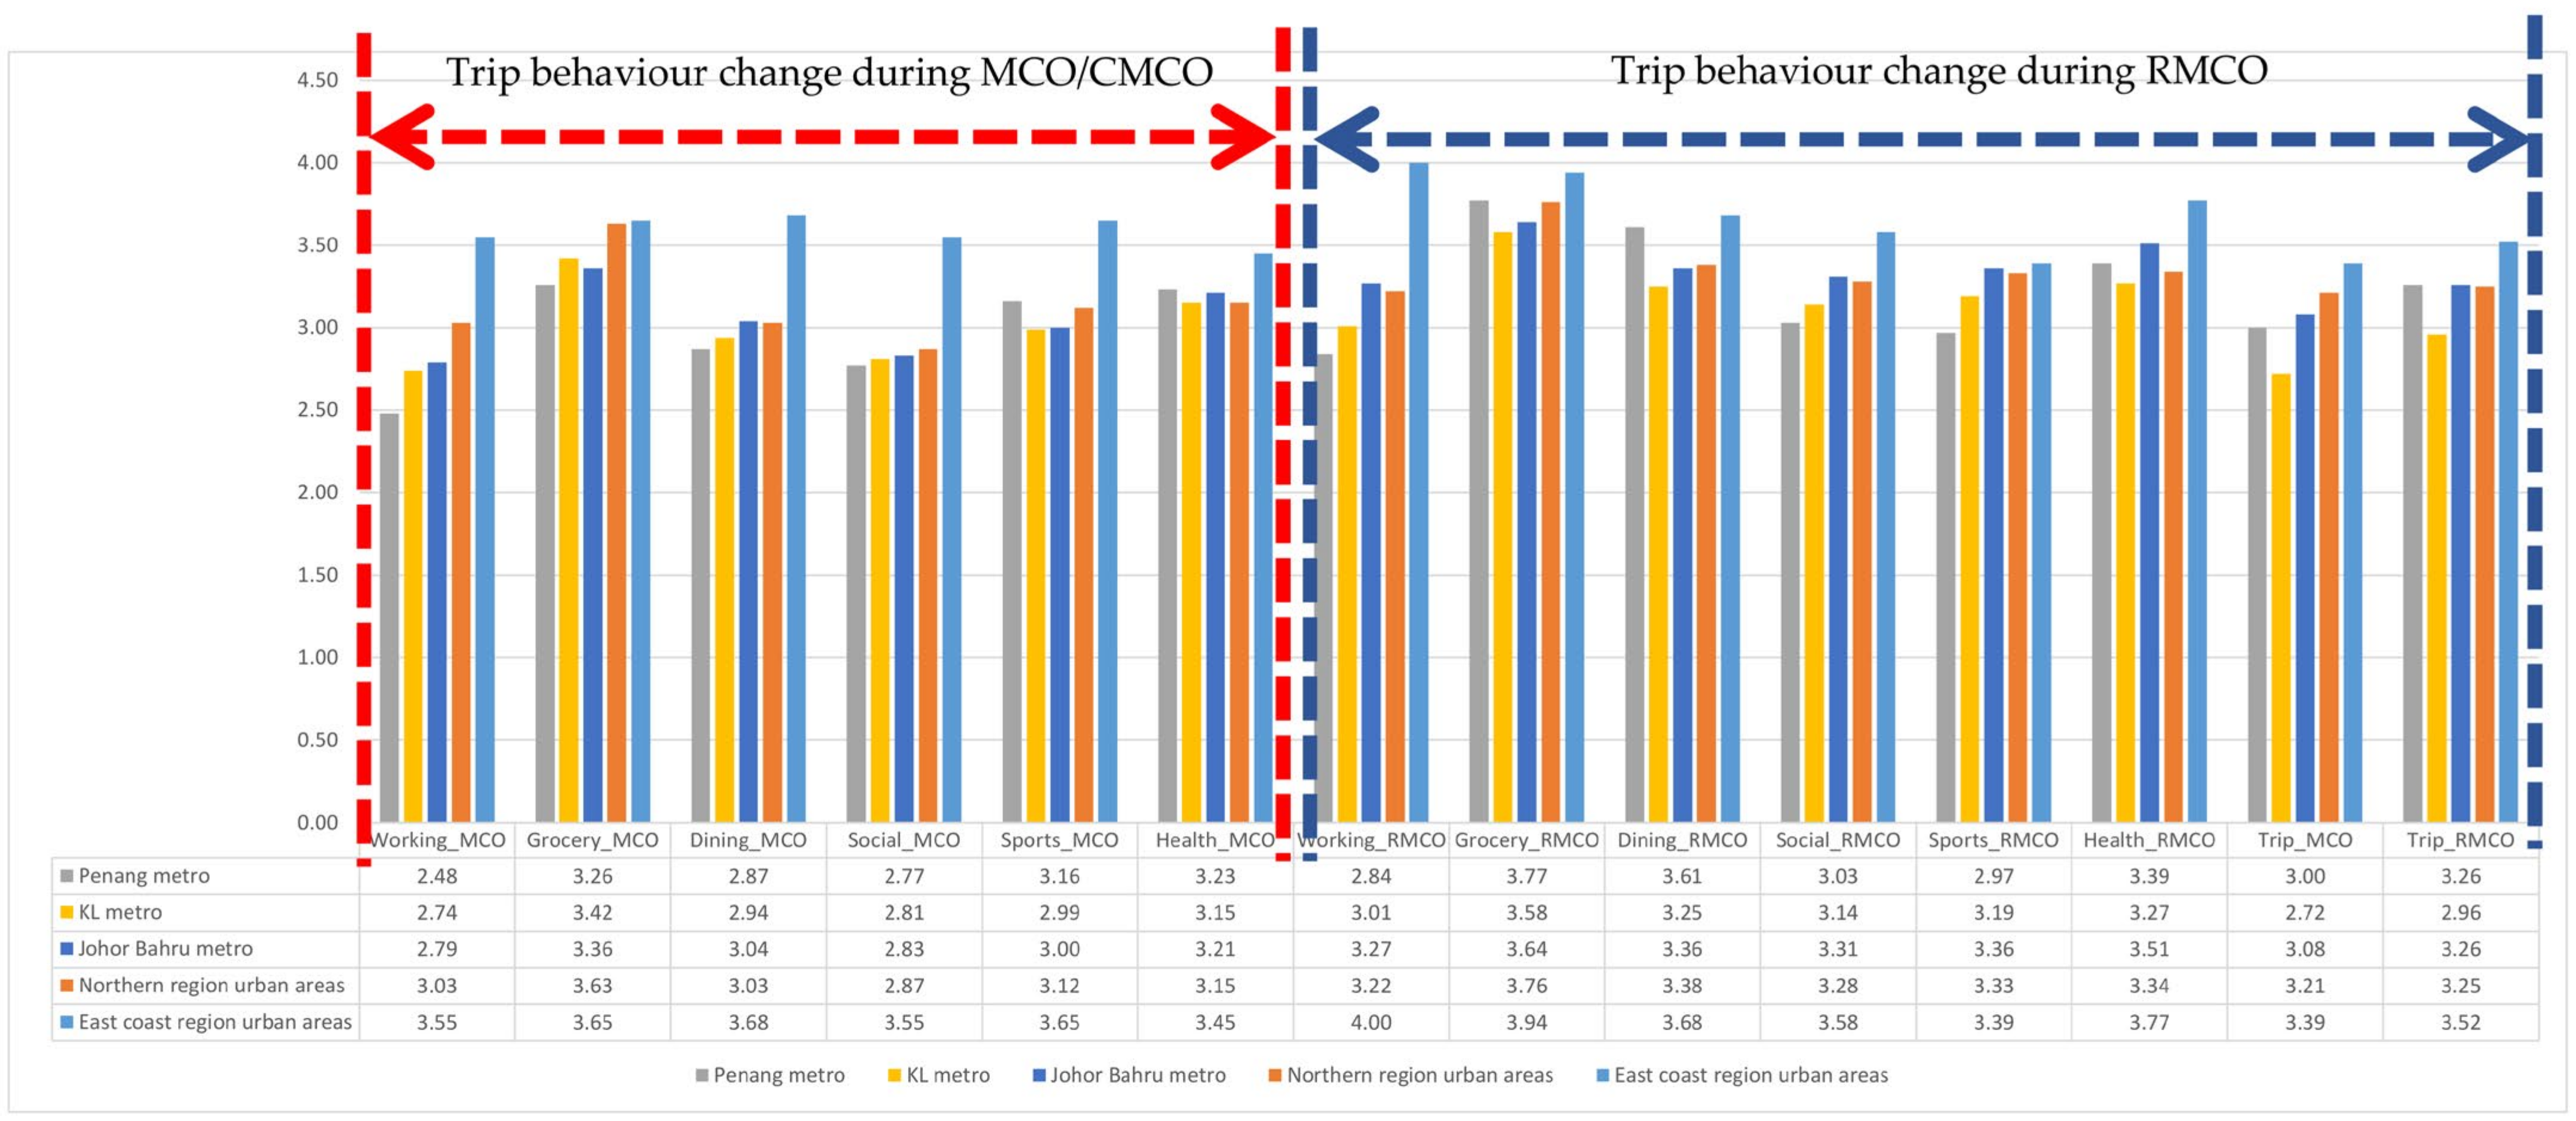
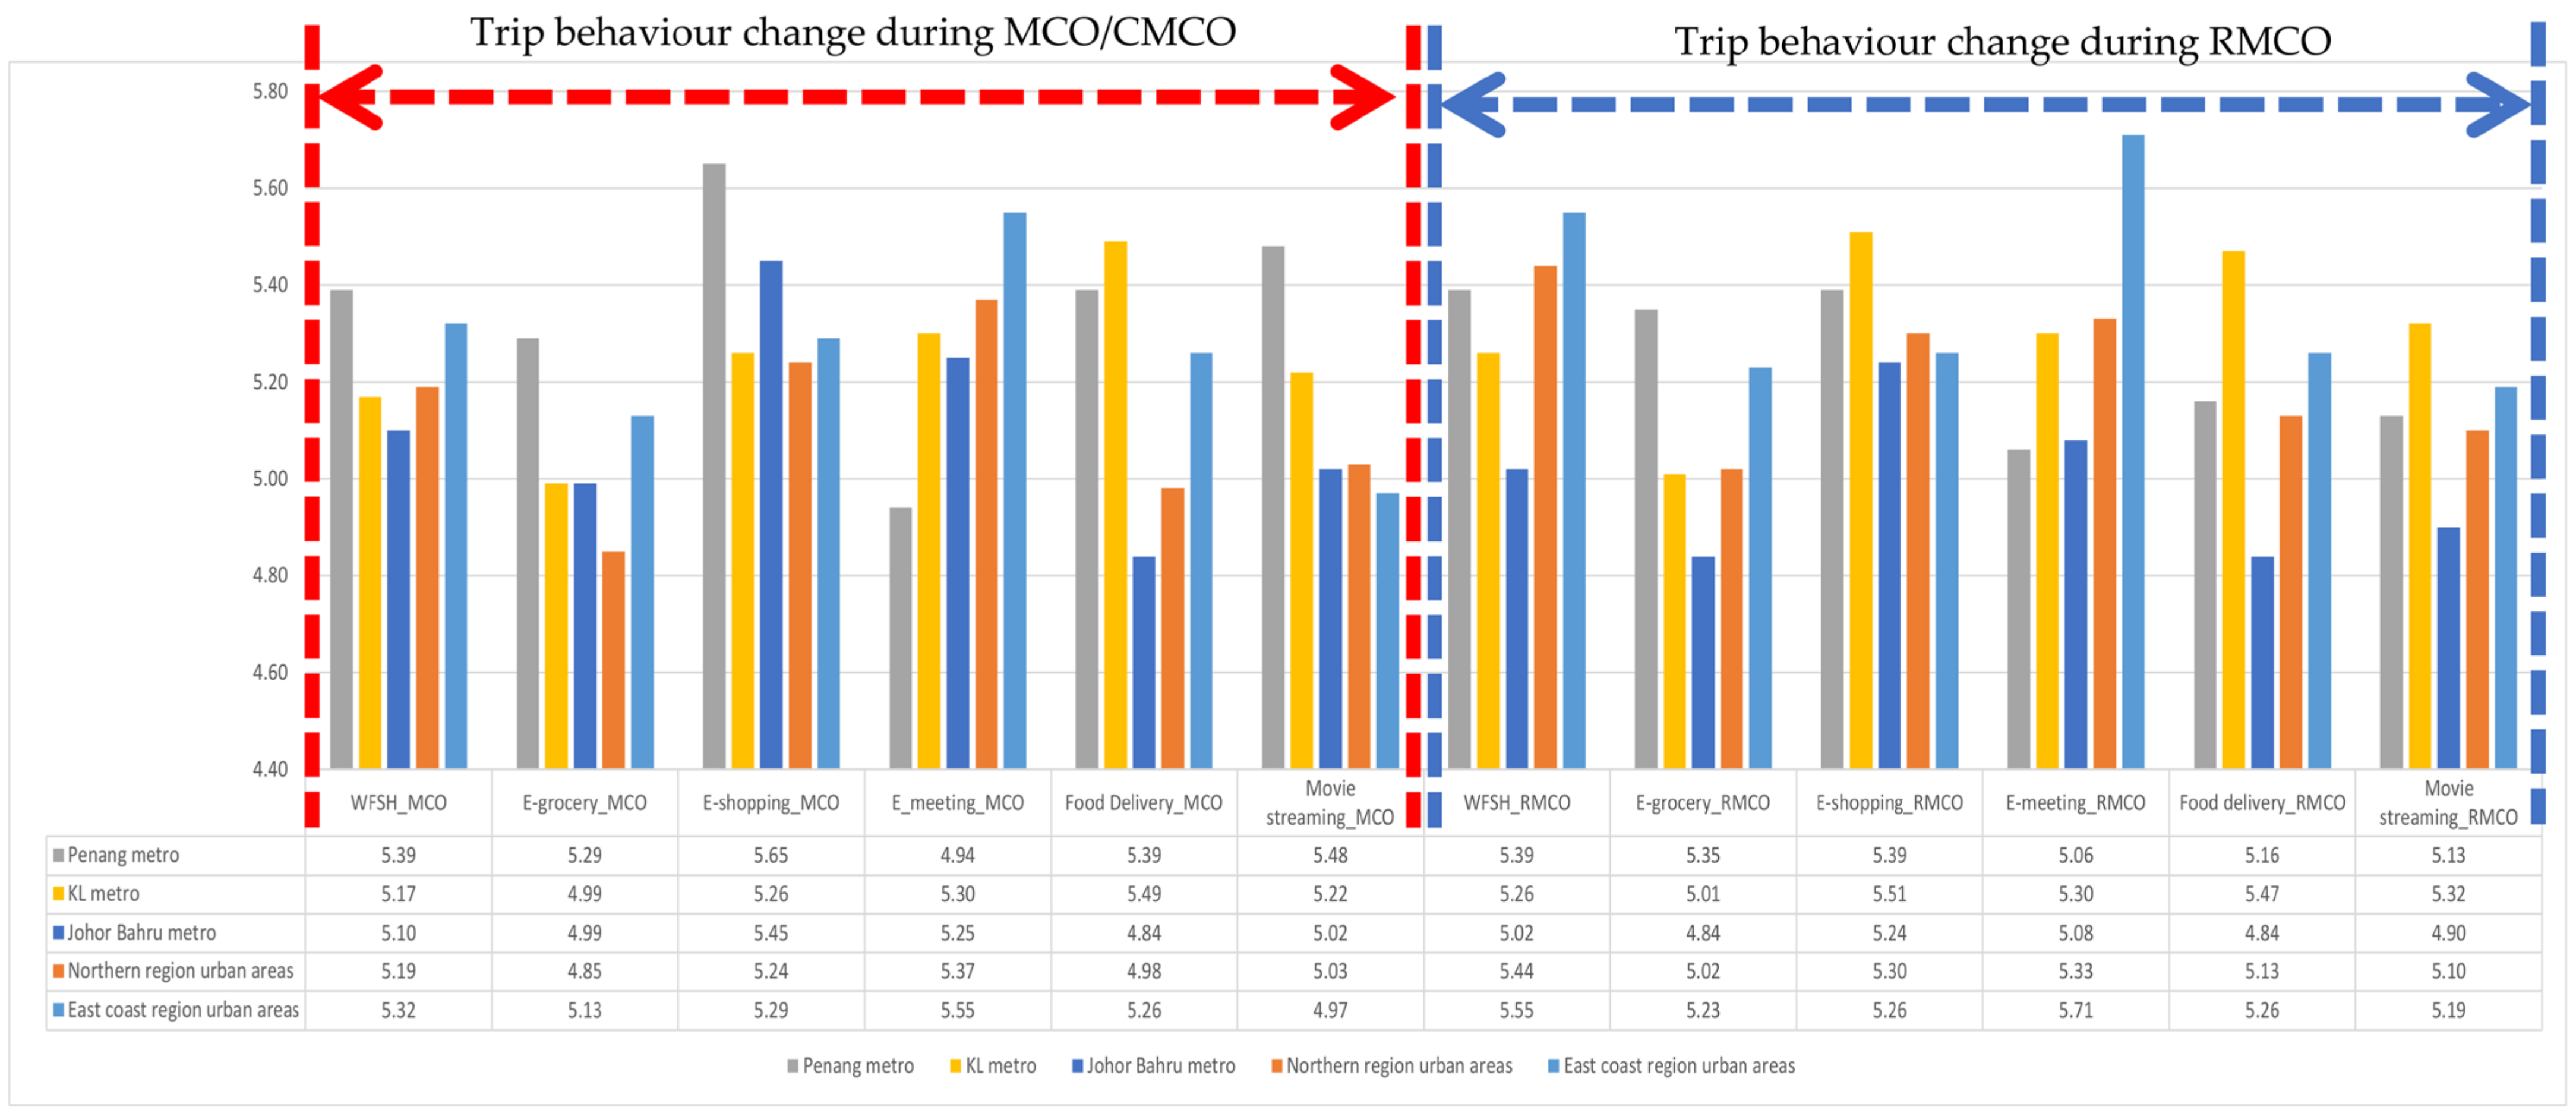
3.3. The Perceived Change in Trip Frequency and Online Activities during and before the Pandemic

As shown in Table 2, the results, on average, were below four, which means that, as expected, the respondents tended to take fewer trips for all purposes during the MCO or full-lockdown period, on both weekdays and weekends, compared to before the pandemic as also found in developed [29,30,31,32,33,38] and developing countries [34,37]. The respondents tended to take work and socialisation trips less often than other trips, and grocery shopping tended to be undertaken on weekdays rather than on weekends. Going grocery shopping more often on weekdays might have been intended to replace work trips. People might have tried to manage their boredom and maintain their SH and MH by undertaking grocery shopping on weekdays, as people cannot stay in the same place for long periods [11,12].
The one-way ANOVA showed that the number of trips undertaken for various purposes during the RMCO was statistically different from during the MCO. Against the hypothesis, people performed significantly more trips, both on weekdays and weekends, during relaxation period (i.e., during the RMCO period) than during the MCO; however, their perceived total number of trips during the RMCO was found to be no different from the MCO, as similar to the hypothesis. Under the RMCO, people might still have maintained the same number of trips as in the MCO period, but they might have distributed those trips across more purposes than during the MCO. People seemed to spread their trips out during the RMCO, including not only for grocery shopping but also for dining out and socialising on both weekdays and weekends. The respondents tended to shift their sports activities to the weekends rather than weekdays, and health trips were taken on weekdays rather than at the weekend.
In general, people took fewer trips compared to before the pandemic as also found in developed [45,46] and developing countries [37]. People were also found to take fewer trips using any travel mode, both during the MCO and RMCO, than before the pandemic; however, people tended to take private vehicles more often than other modes in both stages, and public transport was taken less often than other modes as also found in developed countries. Although people were found to take more trips during the RMCO than in the MCO/CMCO, no significant differences were observed.
Looking at the emerging online activities during the pandemic, as expected, people spent more time on social media, computers and gadgets, including online activities such as WFH/SFH, e-grocery shopping, e-shopping, food delivery using ride-sourcing and movie streaming, at the beginning of the pandemic compared to before the pandemic. People seemed to undertake e-grocery shopping less often than other online activities because they might as well performed physical grocery shopping to manage their boredom at home, and to maintain their MH. People maintained the habits they had developed during the MCO/CMCO during the relaxation of the lockdown, and continued to engage in more online activities, although a significant increase in trips for various purposes was also observed. The disruptions to people’s activity-travel behaviour could, thus, be permanent, as has also been found by [78] in developed countries. It appears that people were balancing their new online activity behaviour and out-of-home activities during the RMCO.
Figure 1 and Figure 2 present the trip and online activity changes during the MCO/CMCO and RMCO, broken down into the state locations for a respondent’s residency. People from the PMA and KLMA tended to perform fewer trips for various purposes at the beginning of the pandemic than people from other urban areas. This might be because the number of COVID-19 cases in the PMA and KLMA tended to be higher than in other areas. An increase in the perceived number of trips for various purposes in all areas was observable during the relaxation; however, people in the JBMA and urban areas in the northern and east coast region metro areas seemed to have more perceived trips for various purposes than people in the KLMA. People in the east coast region metro area tended to have a similar perceived number of trips for work and grocery shopping as before the pandemic. The relaxation period might have led people in the PMA area to undertake more grocery shopping and dining trips during the RMCO than people in the KLMA; however, people from the PMA tended to limit their trips for socialising, work and sports purposes during the relaxation compared to people in the KLMA.
The respondents from the PMA tended to undertake WFH/SFH, e-grocery, e-shopping, food delivery and movie streaming more often at the beginning of the pandemic than people from other urban areas. It seems that trips during the MCO had been exchanged for undertaking more online activities. During the relaxation period, people from the PMA tended to continue to engage in WFH/SFH, e-grocery and e-shopping more often than people from the other areas. The PMA respondents tended to have more exposure to online platforms such as social media, computers and gadgets than the respondents from the other areas, and the KLMA respondents tended to have the least exposure to all online platforms.

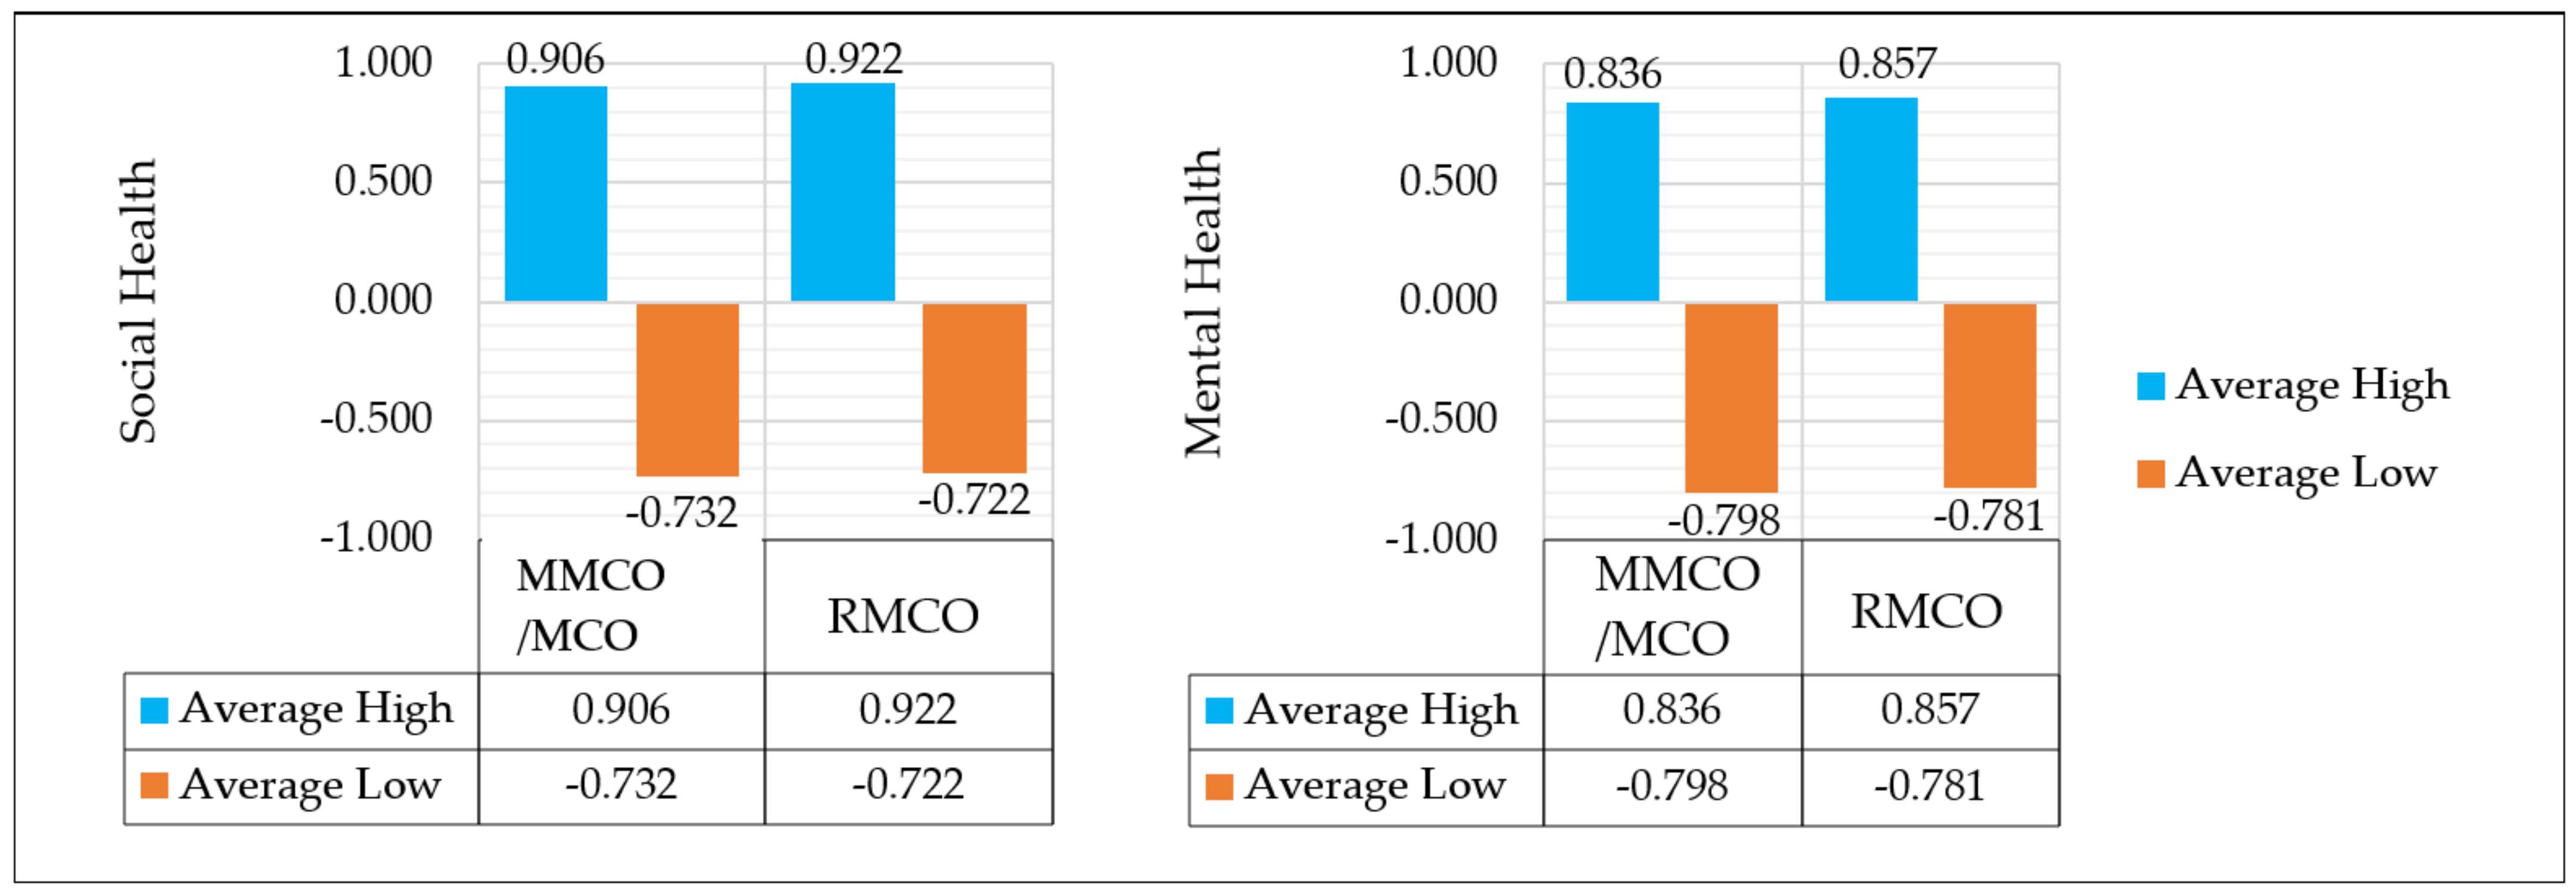
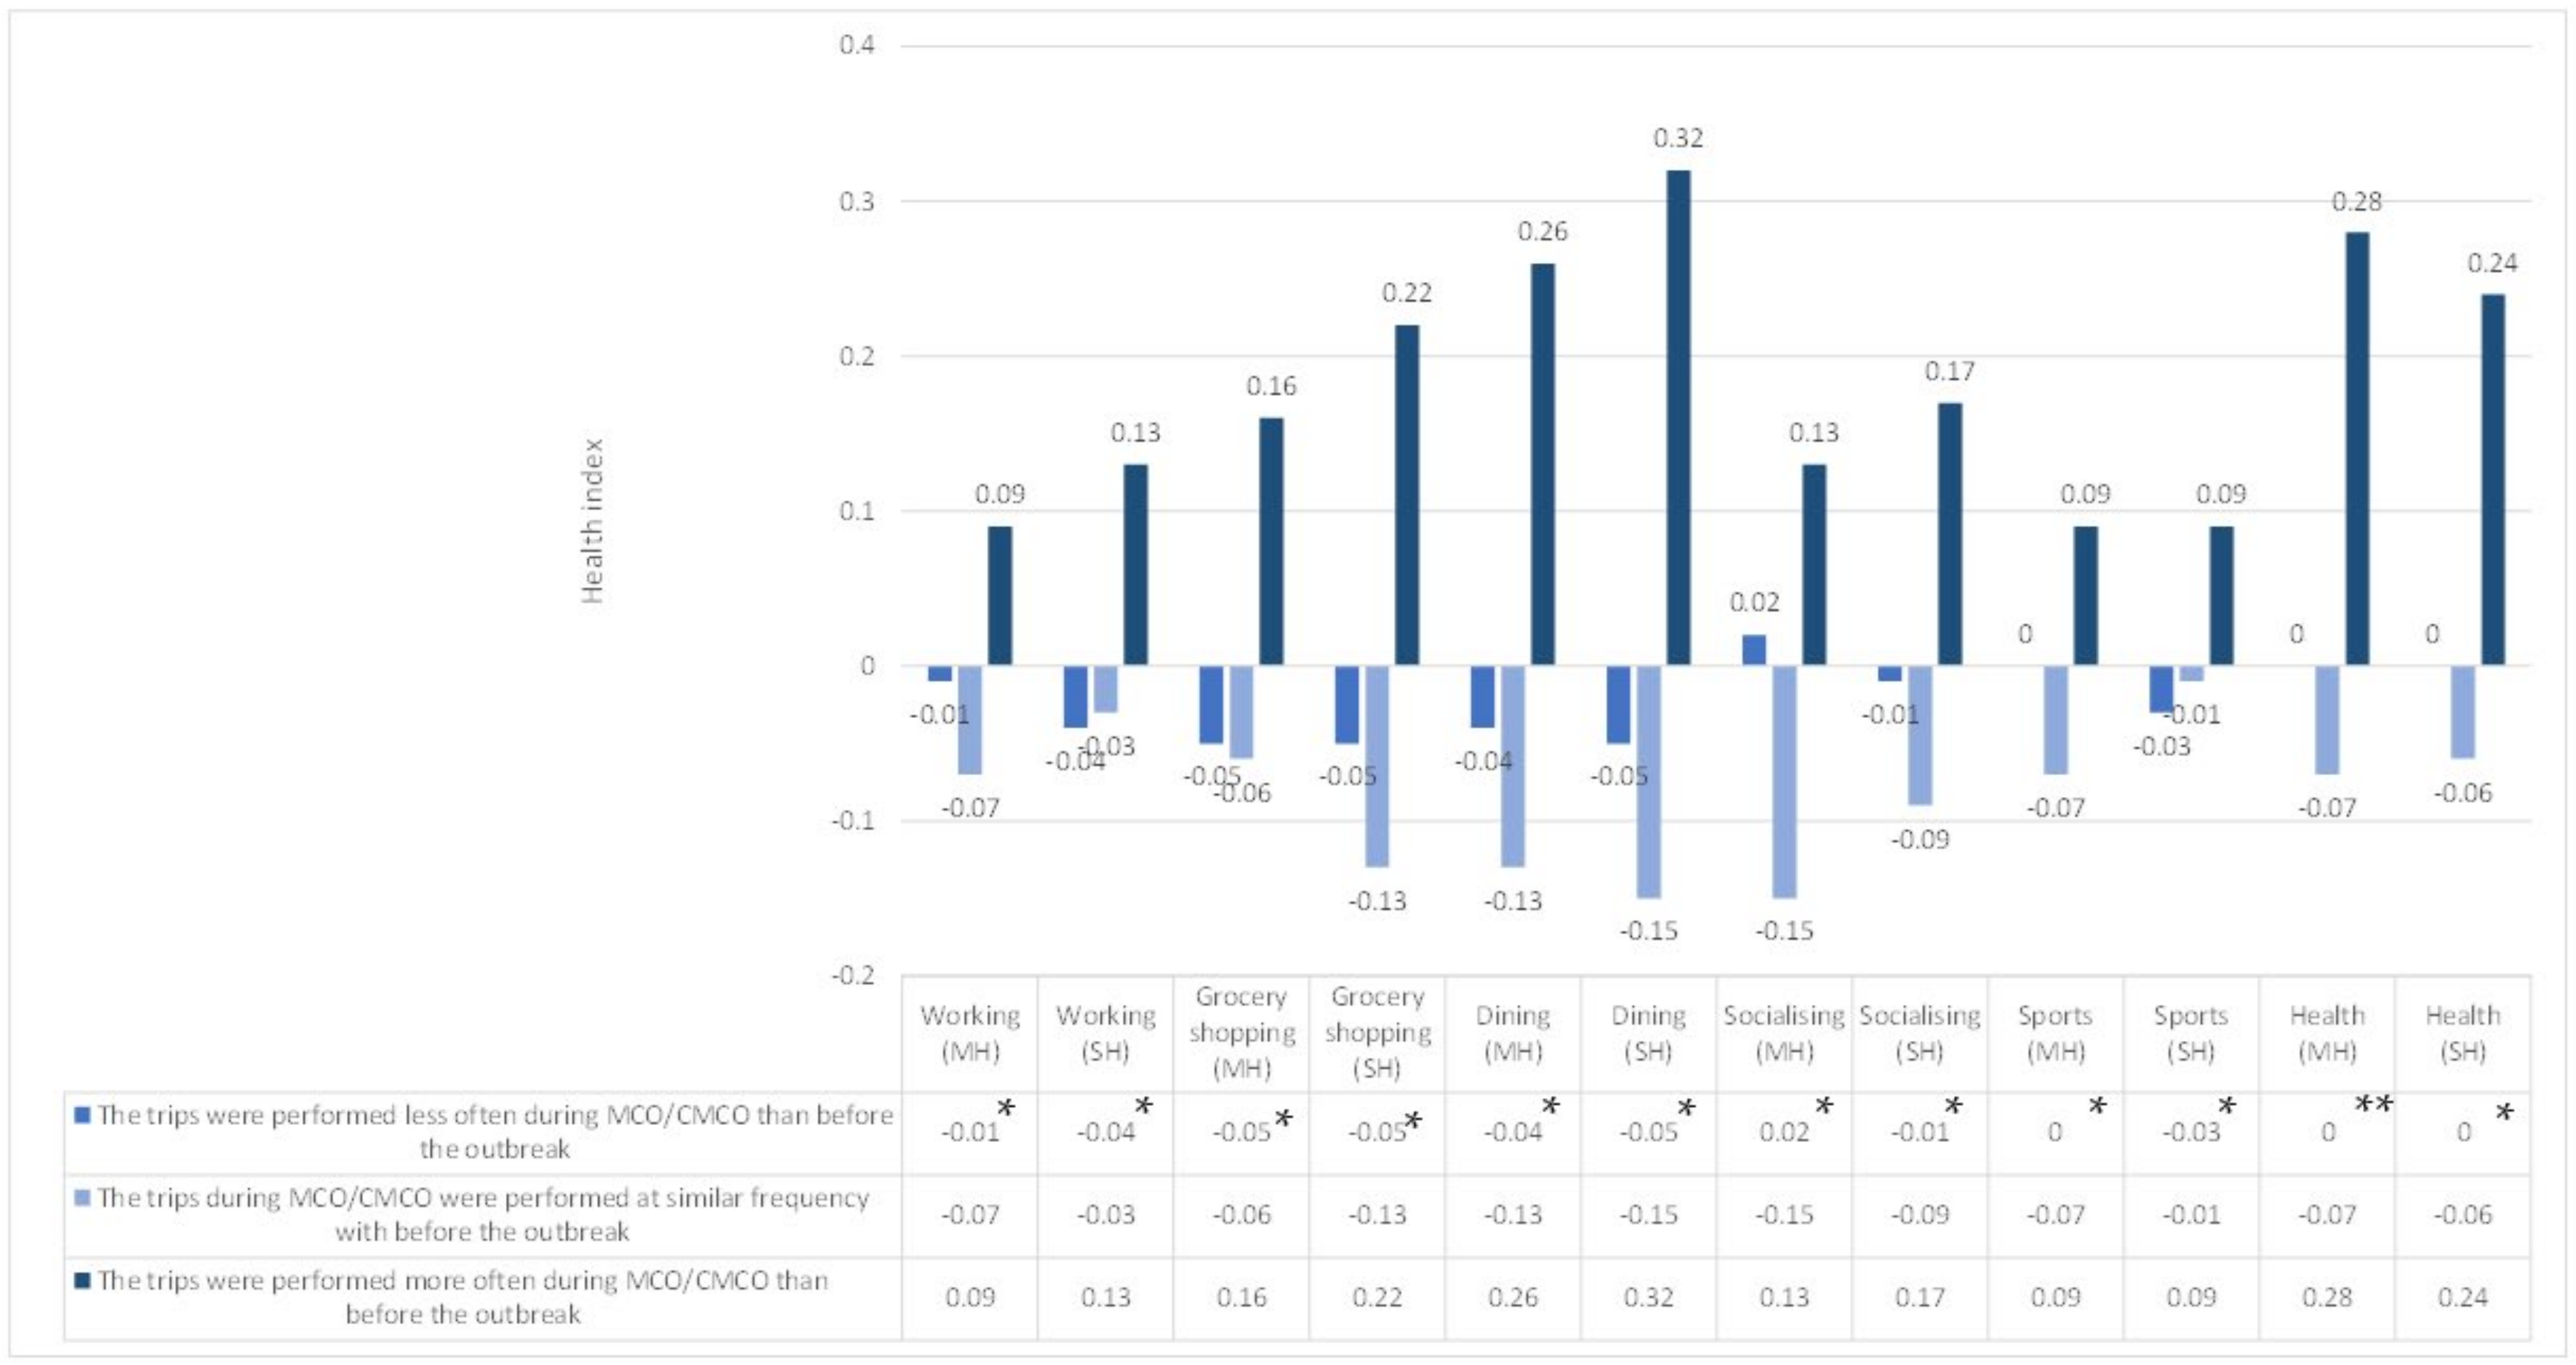
3.4. Social and Mental Health

The health variables used in this study were inspired by [79] and derived from Short Form-36 (SF-36) questions. These included broader aspects than the absence of disease and infirmity but excluded the physical, social and mental well-being or the social dimensions of health [66,79] or health-related quality of life [80]. Physical, social and mental problems due to health issues such as obesity, diabetes, asthma, heart and respiratory diseases are included in these health definitions. Previously, [79] has defined eight parameters in the SF-36, including the physical functioning (PF), limitations on role function according to physical health (RP), general health (GH) and bodily pain (BP) as observed variables of physical health. The RP, social functioning (SF) and limitations on role functioning due to emotional problems (RE) define SH, and mental health is explained by BP, SF, GH, vitality (VT) and mental health (MH). This study only used the SH and mental health (MH) parameters and omitted physical health.
A confirmatory factor analysis (CFA) was used to define the factor loading of the observed variables on the SH and MH. The factor loadings of each observed health variable are shown in Table 3. As suggested by [81], the factor scores were estimated to create a composite value for the subsequent analysis that reflected the relative contributions of each observed variable to the latent variable as a result of the CFA. The factor score is a standardised value arranging the score metric with a mean of zero and a value ranging from −3 to 3 across a sample [81,82]. Equation (1) shows how to find the factor score value ( F i ^ ) as a product of the factor loading matrix ( Λ ) as a result of a CFA, the inverse of the covariance matrix (Σ−1), and the observed variables (yi). The results of the factor score estimation (including the mean, standard deviations, and maximum and minimum values) are shown in Table 3. As also shown in Table 3, the factor loadings show different weights, and the factor scores are better at representing health variables in a regression analysis than summated scales (e.g., ‘average’ or ‘mean’ values). The Kaiser–Meyer–Olkin (KMO) measurement of sampling adequacy for the MH and SH resulted in values of 0.80 and 0.73, respectively. The KMO measurement for the MH was adequate, and that for the SH was acceptable. Each health variable in the regression analysis was represented by the factor score estimations.
F i ^ = Λ 1 y i
Figure 3 presents the overall SH and MH during the outbreak, and specifically during the MCO/CMCO and RMCO timeline. Individuals with high SH and MH had scores greater than zero (>0), while a low SH and MH referred to those with scores equal to or less than zero (<0). It appears that a positive and negative SH and MH tended to be slightly higher or better during the RMCO than at the beginning of the outbreak. The relaxation period, which allowed social engagement, might have improved the SH conditions. No statistical differences were found for the SH and MH between the MCO/CMCO and RMCO, however.
Figure 4 and Figure 5 present the SH and MH broken down by trip change behaviour during the MCO/CMCO and RMCO, respectively, compared to trip behaviour before the outbreak. The figures indicate that the SH and MH conditions could be distinguished by changes in the respondents’ trip behaviours.
Figure 4, in general, shows that undertaking fewer and similar trips during the MCO/CMCO than before the pandemic was significantly correlated with negative MH and SH. Undertaking a similar number of discretionary trips during the MCO/CMCO as before the pandemic showed the lowest SH and MH compared to undertaking discretionary trips less often than before the pandemic. Those who undertook fewer trips for work and sports at out-of-home locations during the MCO/CMCO than from before the pandemic, however, had the lowest SH, but better MH, than those who engaged in similar work and sports trips before the pandemic. Losing social rhythm [8], chronic social isolation [17,18], and no opportunities to perform out-of-home activities with a high rate of enjoyability [9,52], might be why fewer trips for various reasons compared to before the pandemic were significantly correlated with negative SH and MH. People might have felt worried, fearful, frustrated and irritated with the virus, thus, undertaking a similar number of discretionary trips as before the pandemic, and such people showed the lowest MH effects, which is in line with the findings of (16, 8).
Positive SH and MH were significant for those who performed more trips for various purposes, particularly for grocery shopping, health care and buying food in person. Undertaking more work and sports trips were found to significantly correlate with positive SH and MH, but the magnitudes tended to be lower than the effects for grocery shopping, buying food in person and health care trips. The MH of people who performed more socialising trips was significantly lower than those who undertook more trips for grocery shopping, buying food and health care. At the beginning of the pandemic, people might have perceived more socialising as being risky for transmitting the virus, but they also perceived that less out-of-home socialising significantly corresponded with much worse MH, as seen in Figure 4. People tended to shift their trips from socialising and working to grocery shopping during the MCO/CMCO to manage good MH and SH; indeed, people might have met members of their social networks during those grocery shopping activities.
During the relaxation period, it seemed that people were offered more choices to perform out-of-home discretionary activities. Taking grocery shopping trips more often tended to show a lower magnitude of SH and MH than undertaking more trips for work and out-of-home discretionary activities. Interestingly, those undertaking grocery shopping trips in a similar way to before the outbreak had significantly positive SH, unlike the results from during the MCO/CMCO. Opportunities for more trips to dine out, access health care services and engage in out-of-home socialising during the RMCO had the highest effects on SH and MH.
Figure 6 and Figure 7 illustrate the SH and MH of respondents broken down by different online activity patterns during the two different phases compared to before the pandemic. Although different changes in online activity behaviour were hypothesised to have significant effects on the MH and SH, only changes to food delivery behaviour showed significant effects on MH. Undertaking online activity patterns more or less often during the pandemic than before the pandemic were found not to improve MH and SH. Less WFH/SFH and more e-grocery shopping during the lockdown relaxation had positive effects on MH. Continuing to undertake more e-meetings, buying food online and streaming films during the RMCO were found to improve people’s MH and SH. E-meetings and buying food online might have provided more opportunities for individuals to perform other activities that fulfil their love needs (e.g., socialising and recreation), as was found in developed countries [83]. Streaming films might be seen as helping to reduce boredom during the long at-home activity period.

4. Regression Analysis

A regression analysis was used to provide a more advanced model of the effects of activity-travel behaviour change on SH and MH, with two models each for the MH and SH (Table 4). The first models only included the effects of activity and travel patterns, and the mode choice during the pandemic compared with the activity-travel patterns before the pandemic on MH and SH. The first model also included the state of residence. In addition to the activity-travel patterns during and before the pandemic, the second model also incorporated socio-demographic and other health variables. The second model showed better model parameters than the first (i.e., a better AIC, BIC and log-likelihood). It seems that the effects of the socio-demographic and other health aspects may have been more relevant than activity-travel patterns in explaining the SH and MH. The effects of the life stage and employment status had higher magnitudes than activity-travel pattern variables in both the MH and SH models. SH had the highest magnitude for MH, and MH had the strongest effects on SH. As also indicated in the bivariate analysis, the different phases during the pandemic did not appear to have a significant effect on any of the models, because the different phase error terms showed zero effects in all models. The relaxation introduced in the RMCO period did not have significant effects in improving MH and SH, or in changing activity-travel behaviour compared to the beginning of the pandemic.
The state of residence in the MH model did not show significant effects on MH. In the SH model, the residents of KLMA had the highest effects on SH compared to those who lived in the other urban areas. In both the MH and SH models, WFH/SFH and e-shopping/e-commerce were negatively associated with SH and MH, and e-meetings and e-grocery shopping had positive effects on SH and MH. These variables had insignificant effects in the second model.
Some discretionary trips had conflicting effects on the MH and SH. Grocery shopping trips were found to significantly correlate with better MH, but worse SH. Grocery shopping might be better for reducing boredom, but taking these trips was seen to limit the socialising time either physically or as e-socialising. Buying food in person and a limited socialising trip might seem able to provide an avenue for socialisation during the lockdown period. Although socialising trips created anxiety about becoming infected with the virus, such trips could fulfil people’s needs to meet with others. Streaming films were seen to reduce people’s boredom and depression caused by staying indoors for a long time during the lockdown period, as also seen in the bivariate analysis. Streaming films, however, might reduce people’s time for buying food offline and/or engaging in socialising trips. Those who ordered food deliveries online might have experienced more depression or anxiety effects during the pandemic, but ordering food delivery online might have offered more time to engage in socialising trips or to visit a workplace.
Senior citizens and baby boomers had the least MH effects, but the highest effects on SH. Gen Z experienced the best effects on MH, but the worst effects on SH. Full-time workers had the highest MH effects, but the lowest SH effects. High-income households were positively correlated with SH, but no significant effects were found for MH. Car and motorcycle ownership had no significant effects on MH and SH, and income only had effects on SH.

5. Discussion and Conclusions

This study confirms that the relaxation period provided a significant increase in discretionary trips in Malaysia; however, the increase in discretionary trips did not have any significant effects in improving MH and SH. The increase in online activities at the beginning of the COVID-19 pandemic was found to have become a new habit during the relaxation period, even though the government authority had allowed more discretionary trips to be undertaken. People living in different urban areas showed no significant difference in their MH, but people in the KL Metropolitan Area had significantly better SH. Those who had better SH were those with better MH and vice versa. Incorporating the employment status and life stage in the analysis improved the model fit.
This study explains that having no employment due to losing a job or being a homemaker contributed more to explaining negative MH than activity-travel behaviour change. Homemakers might have experienced more negative effects during the lockdown period, including the closure of daycare centres, and the need for increased SFH activities for children. On the other hand, for full- and part-time workers who still had jobs during the pandemic, there was a positive correlation with MH. Full-time workers suffered from the lowest SH due to fewer engagements with their peers than before the outbreak. Students, however, suffered the most during the pandemic. Students reported low MH and SH, particularly students from Gen Z. The pandemic tended to take a toll on student life due to a lack of engagement with peers and exhaustion from online classes, both of which worsened their SH. Workers from Gen Z—both full- or part-time—perceived better MH during the pandemic. This might be due to experiencing the least negative effects if they became infected by the virus. Full-time workers from Gen Z suffered, however, due to a lack of engagement with their peers.
This study used a disaggregate analysis and a time–space prism perspective to confirm that limited discretionary trips reduced boredom and allowed social contacts to be maintained with others during the lockdown period, which was significantly correlated with better MH and SH. Grocery shopping trips were found to help people to reduce their boredom and psychological distress through a more varied activity-travel pattern, in turn affecting MH, contrary to studies using aggregate analysis as shown by [19]. Contrary to [19], undertaking socialising trips during the two different travel restraint periods was here found to have a significantly negative effect on MH. This study reports that engaging in trips for buying food and socialising during the two different lockdown periods had positive effects on SH, while grocery shopping showed the opposite effects. Grocery shopping was seen to limit socialising time during both travel restraint periods, due to physically buying food or undertaking physical socialising or e-socialising. Grocery shopping is good for reducing boredom, however, which in turn improves MH. From a time–space prism and transport psychology perspective, food delivery services using ride-sourcing were categorised as basic needs or necessary activities to obtain food. Because buying food online had positive effects on SH, such activities might help people as a trade-off for other activities, such as socialising trips, e-socialising or movie streaming, as was also found by [83] in a developed country before the pandemic. Undertaking discretionary trips too frequently, however, could risk virus transmission. Combining online activities and one type of discretionary trip is suggested as a policy during epidemic outbreaks, to maintain MH and SH.
This study verifies that spending a long period engaging in WFH/SFH is not recommended. To maintain a more balanced life, as found in developed countries (e.g., [72]) and developing countries (e.g., [60]), by undertaking more trips or avoiding staying in one place for a longer time [11,12], the authorities should allow work from an office with a limited number of employees during epidemic outbreaks without sacrificing strict standard operating procedures. E-meetings were found to provide a good channel for socialising during the outbreak, and this correlates with better MH and SH. Regulation that is too stringent during pandemics will not help to improve people’s MH and SH, as was also found in previous studies using aggregate analysis [19]. Ridesharing more often with other household members, however, was the behaviour change variables with the highest effects on MH. Taking ridesharing more often with other household members might ensure social distancing with other people during a small break at weekends after a long engagement in an online activity on weekdays. This could have possible policy implications if facing another pandemic in the future.
Since the employment status and life stage have greater effects than behaviour change on social and mental health, this study suggests that people’s perceptions and attitudes during the pandemic, and perceived emotions during the pandemic, might better explain the effects on social and mental health. Attitudes and perceptions can differentiate people in the same socio-demographic groups [82]. This is a possible future research direction. The results also highlighted a significant geographical effect on social health; therefore, this raises another possible research direction which is to include geographical variance, particularly on social health, in the analysis. Each urban area might have different geographical conditions, such as better or worse internet connections and being close to or far from parks and other public amenities (e.g., restaurants and grocery stores), which may or may not help individuals to maintain social health during a pandemic. There is also a possibility that levels of online activity are now similar compared to those at the beginning of the pandemic. The pandemic might have increased online activity to a high level, which created a new habit that continues even now. Investigating whether the current online activity level is similar to the level seen during the pandemic might be a future direction for study.

Author Contributions

Conceptualization, A.B., N.S.A. and D.B.E.D.; Data curation, N.A.T., B.D.D., N.S.A.S. and L.E.T.; Formal analysis, A.B., N.S.A. and D.B.E.D.; Funding acquisition, D.B.E.D.; Investigation, A.B. and N.S.A.; Methodology, A.B., N.S.A. and D.B.E.D.; Supervision, N.A.T., B.D.D. and N.S.A.S.; Validation, N.A.T., B.D.D. and N.S.A.S.; Writing—original draft, A.B., N.S.A. and D.B.E.D.; Writing—review & editing, A.B., D.B.E.D., N.A.T., B.D.D., N.S.A.S. and L.E.T. All authors have read and agreed to the published version of the manuscript.

Funding

This study was funded by UTP International Research Grant of Universiti Teknologi PETRONAS of 015ME0-180.

Data Availability Statement

Data sharing not applicable.

Conflicts of Interest

The authors declare no conflict of interest.

References

  1. Fan, V.; Cheong, R. ; MahWengKwai & Associates. Malaysia: MCO, CMCO, RMCO, CMCO Again: Regulations and SOPs Movement Control Order (MCO); MahWengKwai & Associates: Petaling Jaya, Malaysia, 2020. [Google Scholar]
  2. Hashim, J.H.; Adman, M.A.; Hashim, Z.; Radi, M.F.M.; Kwan, S.C. COVID-19 Epidemic in Malaysia: Epidemic Progression, Challenges, and Response. Front. Public Heal. 2021, 9, 560592. [Google Scholar] [CrossRef] [PubMed]
  3. De Vos, J. The effect of COVID-19 and subsequent social distancing on travel behavior. Transp. Res. Interdiscip. Perspect. 2020, 5, 100121. [Google Scholar] [CrossRef] [PubMed]
  4. Van Wee, B.; Witlox, F. COVID-19 and its long-term effects on activity participation and travel behaviour: A multiperspective view. J. Transp. Geogr. 2021, 95, 103144. [Google Scholar] [CrossRef]
  5. Hartwig, L.; Hössinger, R.; Susilo, Y.O.; Gühnemann, A. The Impacts of a COVID-19 Related Lockdown (and Reopening Phases) on Time Use and Mobility for Activities in Austria—Results from a Multi-Wave Combined Survey. Sustainability 2022, 14, 7422. [Google Scholar] [CrossRef]
  6. Subramaniam, C.; Ismail, S.; Durdyev, S.; Rani, W.N.M.W.M.; Bakar, N.F.S.A.; Banaitis, A. Overcoming the project communications management breakdown amongst foreign workers during the COVID-19 pandemic in biophilia inveigled construction projects in Malaysia. Energies 2021, 14, 4790. [Google Scholar] [CrossRef]
  7. Rahmat, T.E.; Raza, S.; Zahid, H.; Abbas, J.; Sobri, F.A.M.; Sidiki, S.N. Nexus between integrating technology readiness 2.0 index and students’ e-library services adoption amid the COVID-19 challenges: Implications based on the theory of planned behavior. J. Educ. Health Promot. 2022, 11, 50. [Google Scholar] [CrossRef]
  8. Shanmugam, H.; Juhari, J.A.; Nair; Chow, S.K.; Ng, C.G. Impacts of COVID-19 Pandemic on Mental Health in Malaysia: A Single Thread of Hope. Malays. J. Psychiatry J. 2020, 29, 78–84. Available online: https://www.mjpsychiatry.org/index.php/mjp/article/view/536/415 (accessed on 1 January 2020).
  9. Kahneman, D.; Krueger, A.B.; Schkade, D.A.; Schwarz, N.; Stone, A.A. A survey method for characterizing daily life experience: The day reconstruction method. Science 2004, 306, 1776–1780. [Google Scholar] [CrossRef]
  10. Dharmowijoyo, D.A.; Cherchi, D.B.E.; Termida, E.; Samsura, A.N. On the role of subjective well-being to mediate the relationship between spatiotemporal and health variables. J. Transp. Health In press. 2022. [Google Scholar]
  11. Brooks, S.K.; Webster, R.K.; Smith, L.E.; Woodland, L.; Wessely, S.; Greenberg, N.; Rubin, G.J. The psychological impact of quarantine and how to reduce it: Rapid review of the evidence. Lancet 2020, 395, 912–920. [Google Scholar] [CrossRef] [Green Version]
  12. Campbell, A.M. An increasing risk of family violence during the Covid-19 pandemic: Strengthening community collaborations to save lives. Forensic Sci. Int. Rep. 2020, 2, 100089. [Google Scholar] [CrossRef]
  13. McKinsey and Company. Well-Being in Europe: Addressing the High Cost of COVID-19 on Life Satisfaction. no. June, 1–14, 2020. Available online: https://www.mckinsey.com/featured-insights/europe/well-being-in-europe-addressing-the-high-cost-of-covid-19-on-life-satisfaction (accessed on 1 January 2020).
  14. United Nations. Mental Health Services are an Essential Part of all Government Responses to COVID-19. 2020. Available online: https://www.un.org/en/coronavirus/mental-health-services-are-essential-part-all-government-responses-covid-19 (accessed on 1 January 2020).
  15. World Health Organisation. COVID-19 Disrupting Mental Health Services in Most Countries, WHO Survey. 2020. Available online: https://www.who.int/news-room/detail/05-10-2020-covid-19-disrupting-mental-health-services-in-most-countries-who-survey (accessed on 1 January 2020).
  16. Qiu, J.; Shen, B.; Zhao, M.; Wang, Z.; Xie, B.; Xu, Y. A nationwide survey of psychological distress among Chinese people in the COVID-19 epidemic: Implications and policy recommendations. Gen. Psychiatry 2020, 33, e100213. [Google Scholar] [CrossRef] [PubMed]
  17. Holt-Lunstad, J.; Smith, T.B.; Baker, M.; Harris, T.; Stephenson, D. Loneliness and social isolation as risk factors for mortality: A meta-analytic review. Perspect. Psychol. Sci. 2015, 10, 227–237. [Google Scholar] [CrossRef] [PubMed] [Green Version]
  18. Canady, V. COVID-19 outbreak represents a new way of mental health service delivery. Ment. Health Wkly. 2020, 30, 1–4. [Google Scholar] [CrossRef]
  19. Nanath, K.; Balasubramanian, S.; Shukla, V.; Islam, N.; Kaitheri, S. Developing a mental health index using a machine learning approach: Assessing the impact of mobility and lockdown during the COVID-19 pandemic. Technol. Forecast. Soc. Change 2022, 178, 121560. [Google Scholar] [CrossRef]
  20. Lanzendorf, M. Mobility biographies. A new perspective for understanding travel behaviour. In Proceedings of the 10th International Conference on Travel Behaviour Research (IATBR 2003), Lucerne, Switzerland, 10–15 August 2003. [Google Scholar]
  21. Scheiner, J. Mobility biographies: Elements of a biographical theory of travel demand. Erdkunde 2007, 61, 161–173. [Google Scholar] [CrossRef]
  22. Scheiner, J. Changes in travel mode use over the life course with partner interactions in couple households. Transp. Res. Part A Policy Pract. 2020, 132, 791–807. [Google Scholar] [CrossRef]
  23. Busch-Geertsema, A.; Lanzendorf, M. Mode decisions and context change—What about the attitudes? A conceptual framework. Transp. Sustain. 2015, 7, 23–42. [Google Scholar] [CrossRef] [Green Version]
  24. Müggenburg, H.; Busch-Geertsema, A.; Lanzendorf, M. Mobility biographies: A review of achievements and challenges of the mobility biographies approach and a framework for further research. J. Transp. Geogr. 2015, 46, 151–163. [Google Scholar] [CrossRef]
  25. Van Acker, V. Defining, measuring, and using the lifestyle concept in modal choice research. Transp. Res. Rec. 2015, 2525, 74–82. [Google Scholar] [CrossRef]
  26. Beige, S.; Axhausen, K. The dynamics of commuting over the life course: Swiss experiences. Transp. Res. Part A Policy Pract. 2017, 104, 179–194. [Google Scholar] [CrossRef]
  27. Scheiner, J. Why is there change in travel behaviour? In search of a theoretical framework for mobility biographies. Erdkunde 2018, 72, 41–62. [Google Scholar] [CrossRef]
  28. Noland, R.B. Mobility and the effective reproduction rate of COVID-19. J. Transp. Heal. 2021, 20, 101016. [Google Scholar] [CrossRef] [PubMed]
  29. Molloy, J.; Schatzmann, T.; Schoeman, B.; Tchervenkov, C.; Hintermann, B.; Axhausen, K.W. Observed impacts of the COVID-19 first wave on travel behaviour in Switzerland based on a large GPS panel. Transp. Policy 2021, 104, 43–51. [Google Scholar] [CrossRef]
  30. Büchel, B.; Marra, A.D.; Corman, F. COVID-19 as a window of opportunity for cycling: Evidence from the first wave. Transp. Policy 2022, 116, 144–156. [Google Scholar] [CrossRef]
  31. Kim, J.; Kwan, M. The impact of the COVID-19 pandemic on people’s mobility: A longitudinal study of the U.S. from March to September of 2020. J. Transp. Geogr. 2021, 93, 103039. [Google Scholar] [CrossRef]
  32. Anke, J.; Francke, A.; Schaefer, L.-M.; Petzoldt, T. Impact of SARS-CoV-2 on the mobility behaviour in Germany TT—Auswirkungen von SARS-CoV-2 auf das Mobilitätsverhalten in Deutschland. Eur. Transp. Res. Rev. 2021, 13, 10. Available online: http://widgets.ebscohost.com/prod/customerspecific/s9118275/vpn.php?url=https://search.ebscohost.com/login.aspx?direct=true&AuthType=ip,uid&db=pdx&AN=0378179&lang=de&site=eds-live&scope=site (accessed on 1 January 2020). [CrossRef]
  33. De Haas, W.; Hassink, J.; Stuiver, M. The Role of Urban Green Space in Promoting Inclusion: Experiences from the Netherlands. Front. Environ. Sci. 2021, 9, 618198. [Google Scholar] [CrossRef]
  34. Irawan, M.Z.; Belgiawan, F.; Joewono, T.B.; Bastarianto, F.F.; Rizki, M.; Ilahi, A. Exploring activity-travel behavior changes during the beginning of COVID-19 pandemic in Indonesia Exploring activity—Travel behavior changes during the beginning of COVID-19 pandemic in Indonesia. Transportation 2022, 49, 529–553. [Google Scholar] [CrossRef]
  35. Beck, M.J.; Hensher, D.A. Insights into the impact of COVID-19 on household travel and activities in Australia—The early days of easing restrictions. Transp. Policy 2020, 99, 95–119. [Google Scholar] [CrossRef]
  36. Hensher, D.A.; Beck, M.J.; Wei, E. Working from home and its implications for strategic transport modelling based on the early days of the COVID-19 pandemic. Transp. Res. Part A Policy Pract. 2021, 148, 64–78. [Google Scholar] [CrossRef]
  37. Chang, H.-H.; Lee, B.; Yang, F.-A.; Liou, Y.-Y. Does COVID-19 affect metro use in Taipei? J. Transp. Geogr. 2021, 91, 102954. [Google Scholar] [CrossRef] [PubMed]
  38. Almlöf, E.; Rubensson, I.; Cebecauer, M.; Jenelius, E. Who continued travelling by public transport during COVID-19? Socioeconomic factors explaining travel behaviour in Stockholm 2020 based on smart card data. Eur. Transp. Res. Rev. 2021, 13, 31. [Google Scholar] [CrossRef]
  39. Long, V.J.E.; Liu, J.C.J. Behavioural changes during the COVID-19 pandemic: Results of a nationwide survey in Singapore. Ann. Acad. Med. Singapore 2021, 50, 222–231. [Google Scholar] [CrossRef] [PubMed]
  40. Aqeel, M.; Rehna, T.; Shuja, K.H.; Abbas, J. Comparison of Students’ Mental Wellbeing, Anxiety, Depression, and Quality of Life During COVID-19’s Full and Partial (Smart) Lockdowns: A Follow-Up Study at a 5-Month Interval. Front. Psychiatry 2022, 13, 835585. [Google Scholar] [CrossRef] [PubMed]
  41. Al Halbusi, H.; Al-Sulaiti, K.; Abbas, J.; Al-Sulaiti, I. Assessing Factors Influencing Technology Adoption for Online Purchasing Amid COVID-19 in Qatar: Moderating Role of Word of Mouth. Front. Environ. Sci. 2022, 10, 1039. [Google Scholar] [CrossRef]
  42. NeJhaddadgar, N.; Toghroli, R.; Lebni, J.Y.; Melca, I.A.; Ziapour, A. Exploring the Barriers in Maintaining the Health Guidelines Amid the COVID-19 Pandemic: A Qualitative Study Approach. INQUIRY 2022, 59, 00469580221100348. [Google Scholar] [CrossRef]
  43. Shoaib, M.; Nawal, A.; Korsakienė, R.; Zámečník, R.; Rehman, A.U.; Raišienė, A.G. Performance of Academic Staff during COVID-19 Pandemic-Induced Work Transformations: An IPO Model for Stress Management. Economies 2022, 10, 51. [Google Scholar] [CrossRef]
  44. Yoosefi Lebni, J.; Abbas, J.; Moradi, F.; Salahshoor, M.R.; Chaboksavar, F.; Irandoost, S.F.; Nezhaddadgar, N.; Ziapour, A. How the COVID-19 pandemic effected economic, social, political, and cultural factors: A lesson from Iran. Int. J. Soc. Psychiatry 2021, 67, 298–300. [Google Scholar] [CrossRef]
  45. Büchel, B.; Spanninger, T.; Corman, F. Modeling Evolutionary Dynamics of Railway Delays with Markov Chains. In Proceedings of the 2021 7th International Conference on Models and Technologies for Intelligent Transportation Systems (MT-ITS), Heraklion, Greece, 16–17 June 2021; pp. 1–6. [Google Scholar] [CrossRef]
  46. Molloy, J.; Tchervenkov, C.; Axhausen, K. Estimating the external costs of travel on GPS tracks. Transp. Res. Part D Transp. Environ. 2021, 95, 102842. [Google Scholar] [CrossRef]
  47. Tyrväinen, O.; Karjaluoto, H. Online grocery shopping before and during the COVID-19 pandemic: A meta-analytical review. Telemat. Inform. 2022, 71, 101839. [Google Scholar] [CrossRef] [PubMed]
  48. Zhao, N.; Zhou, G. COVID-19 Stress and Addictive Social Media Use (SMU): Mediating Role of Active Use and Social Media Flow. Front. Psychiatry 2021, 12, 635546. [Google Scholar] [CrossRef] [PubMed]
  49. Yu, S.; Abbas, J.; Draghici, A.; Negulescu, O.H.; Ain, N.U. Social Media Application as a New Paradigm for Business Communication: The Role of COVID-19 Knowledge, Social Distancing, and Preventive Attitudes. Front. Psychol. 2022, 13, 903082. [Google Scholar] [CrossRef]
  50. Schwanen, T.; Wang, D. Well-Being, Context, and Everyday Activities in Space and Time. Ann. Assoc. Am. Geogr. 2014, 104, 833–851. [Google Scholar] [CrossRef]
  51. De Vos, J. Towards happy and healthy travellers: A research agenda. J. Transp. Health 2018, 11, 80–85. [Google Scholar] [CrossRef] [Green Version]
  52. Dharmowijoyo, D.B.; Susilo, Y.O.; Joewono, T.B. Residential locations and health effects on multitasking behaviours and day experiences. Sustainability 2021, 13, 11347. [Google Scholar] [CrossRef]
  53. Nordbakke, S.; Schwanen, T. Transport, unmet activity needs and wellbeing in later life: Exploring the links. Transportation 2015, 42, 1129–1151. [Google Scholar] [CrossRef]
  54. Maslow, A.H. Motivation and Personality; Prabhat Prakashan: New Delhi, India, 1970; p. 369. [Google Scholar]
  55. Oishi, S.; Diener, E.F.; Lucas, R.E.; Suh, E.M. Cross-cultural variations in predictors of life satisfaction: Perspectives from needs and values. Personal. Soc. Psychol. Bull. 1999, 25, 980–990. [Google Scholar] [CrossRef]
  56. Allardt, E. Having, Loving, Being: An Alternative to the Swedish Model of Welfare Research. In The Quality of Life; Clarendon Press: Oxford, UK, 1993. [Google Scholar]
  57. Cullen, I.; Godson, V. Urban networks: The structure of activity patterns. Prog. Plann. 1975, 4, 1–96. [Google Scholar] [CrossRef]
  58. Meloni, I.; Guala, L.; Loddo, A. Time allocation to discretionary in-home, out-of-home activities and to trips. Transportation 2004, 31, 69–96. [Google Scholar] [CrossRef]
  59. Akar, G.; Clifton, K.J.; Doherty, S.T. Discretionary activity location choice: In-home or out-of-home? Transportation 2011, 38, 101–122. [Google Scholar] [CrossRef]
  60. Dharmowijoyo, D.B.E.; Susilo, Y.O.; Karlström, A. Analysing the complexity of day-to-day individual activity-travel patterns using a multidimensional sequence alignment model: A case study in the Bandung Metropolitan Area, Indonesia. J. Transp. Geogr. 2017, 64, 1–12. [Google Scholar] [CrossRef]
  61. Dharmowijoyo, D.B.E.; Susilo, Y.O.; Karlström, A. Relationships among discretionary activity duration, its travel time spent and activity space indices in the Jakarta Metropolitan Area, Indonesia. J. Transp. Geogr. 2016, 54, 148–160. [Google Scholar] [CrossRef]
  62. Dijst, M.J. Social Change and Sustainable Transport; Indiana University Press: Bloomington, IN, USA, 2005. [Google Scholar]
  63. Kang, H.; Scott, D.M. Exploring day-to-day variability in time use for household members. Transp. Res. Part A Policy Pract. 2010, 44, 609–619. [Google Scholar] [CrossRef]
  64. Dharmowijoyo, D.B.E.; Susilo, Y.O.; Karlström, A. On complexity and variability of individuals’ discretionary activities. Transportation 2018, 45, 177–204. [Google Scholar] [CrossRef] [Green Version]
  65. Schwanen, T.; Kwan, M.; Ren, F. How fixed is fixed? Gendered rigidity of space-time constraints and geographies of everyday activities. Geoforum 2008, 39, 2109–2121. [Google Scholar] [CrossRef]
  66. Van Wee, B.; Ettema, D. Travel behaviour and health: A conceptual model and research agenda. J. Transp. Heal. 2016, 3, 240–248. [Google Scholar] [CrossRef] [Green Version]
  67. Dharmowijoyo, D.B.E.; Joewono, T.B. Mobility and Health: The Interaction of Activity-Travel Patterns, Overall Well-Being, Transport-Related Social Exclusion on Health Parameters. Energy Effic. Mobil. Syst. 2020, 53–83. [Google Scholar] [CrossRef]
  68. Zhang, J. Urban Forms and Health. Promotion: An Evaluation Based on Urban Forms and Health Health-Related Qol Indicators. In Proceedings of the 13th World Conference on Transport Research (WCTR) 2013, Rio de Janeiro, Brazil, 15–18 July 2013; pp. 1–20. [Google Scholar]
  69. Syahputri, J.; Dharmowijoyo, T.B.; Joewono, T.B.; Rizki, M. Effect of travel satisfaction and activity-travel patterns of other household on social and mental health. Case Stud. Transp. Policies 2022, 10, 2111–2124. [Google Scholar] [CrossRef]
  70. Wicaksono, A.; Dharmowijoyo, D.B.E.; Tanjung, L.E.; Susilo, Y.O. The effects of online and physical activities, residential locations and ride-sourcing mode on health. J. Plan. Educ. Res. 2022. submitted. [Google Scholar]
  71. Wicaksono, A.A.; Munir, A.; Dharmowijoyo, D.B.E.; Lai, F.W.; Puri. The effects of spatiotemporal variables on physical activities at workplaces and physical health. Suranaree J. Sci. Technol. 2022. submitted. [Google Scholar]
  72. Hunt, E.; McKay, E.A.; Dahly, D.L.; Fitzgerald, A.; Perry, I.J. A person-centred analysis of the time-use, daily activities and health-related quality of life of Irish school-going late adolescents. Qual. Life Res. 2015, 24, 1303–1315. [Google Scholar] [CrossRef] [PubMed] [Green Version]
  73. Li, Y.; Al-Sulaiti, K.; Dongling, W.; Abbas, J.; Al-Sulaiti, I. Tax Avoidance Culture and Employees’ Behavior Affect Sustainable Business Performance: The Moderating Role of Corporate Social Responsibility. Front. Environ. Sci. 2022, 10, 1081. [Google Scholar] [CrossRef]
  74. Department of Statistics Malaysia. Department of Statistics Malaysia Press Release: Current Population Estimates, Malaysia, 2021; Department of Statistics Malaysia: Putrajaya, Malaysia, 2021. [Google Scholar]
  75. Barter, P.A. Transport, urban structure and ‘lock-in’ in the Kuala Lumpur Metropolitan Area. Int. Dev. Plan. Rev. 2004, 26, 1–24. [Google Scholar] [CrossRef]
  76. Cromwell, E.A.; Osborne, J.C.; Unnasch, T.R.; Basáñez, M.G.; Gass, K.M.; Barbre, K.A.; Hill, E.; Johnson, K.B.; Donkers, K.M.; Shirude, S.; et al. Predicting the environmental suitability for onchocerciasis in Africa as an aid to elimination planning. PLoS Negl. Trop. Dis. 2021, 15, e0008824. [Google Scholar] [CrossRef]
  77. Schmidt, C.A.; Cromwell, E.A.; Hill, E.; Donkers, K.M.; Schipp, M.F.; Johnson, K.B.; Pigott, D.M.; Hay, S.I. The prevalence of onchocerciasis in Africa and Yemen, 2000–2018: A geospatial analysis. BMC Med. 2022, 20, 293. [Google Scholar] [CrossRef]
  78. Clark, B.; Chatterjee, K.; Melia, S.; Knies, G.; Laurie, H. Life events and travel behavior exploring the interrelationship using UK Household Longitudinal Study data. Transp. Res. Rec. 2014, 2413, 54–64. [Google Scholar] [CrossRef] [Green Version]
  79. Suzukamo, Y.; Fukuhara, S.; Green, J.; Kosinski, M.; Gandek, B.; Ware, J.E. Validation testing of a three-component model of Short Form-36 scores. J. Clin. Epidemiol. 2011, 64, 301–308. [Google Scholar] [CrossRef]
  80. Keller, S.D.; Ware Jr, J.E.; Bentler, P.M.; Aaronson, N.K.; Alonso, J.; Apolone, G.; Bjorner, J.B.; Brazier, J.; Bullinger, M.; Kaasa, S.; et al. Use of structural equation modeling to test the construct validity of the SF-36 Health Survey in ten countries: Results from the IQOLA Project. J. Clin. Epidemiol. 1998, 51, 1179–1188. [Google Scholar] [CrossRef]
  81. Hair, J.F.; Black, W.C.; Babin, B.J.; Anderson, R.E. Multivariate Data Analysis, 7th ed.; Pearson Education: Upper Saddle River, NJ, USA, 2014; p. 816. [Google Scholar]
  82. Anable, J. ‘Complacent Car Addicts’; or ‘Aspiring Environmentalists’? Identifying travel behaviour segments using attitude theory. Transp. Policy 2005, 12, 65–78. [Google Scholar] [CrossRef] [Green Version]
  83. Delbosc, A.; Mokhtarian. Face to Facebook: The relationship between social media and social travel. Transp. Policy 2018, 68, 20–27. [Google Scholar] [CrossRef]
Figure 1. Trip changes during the MCO and RMCO compared to before the pandemic.
Sustainability 14 13776 g001
Figure 2. Online activity changes during MCO and RMCO compared to before the pandemic.
Sustainability 14 13776 g002
Figure 3. Overall social and mental health during the COVID-19 outbreak. * and ** indicate significant differences at <0.05 and <0.1 between health conditions during the MCO/CMCO and RMCO, respectively; no asterisk means that no significant differences were found.
Sustainability 14 13776 g003
Figure 4. Social and mental health broken down by trip change behaviour during the MCO/CMCO. * and ** indicate significant differences at <0.05 and <0.1 between health conditions during different behaviour change patterns, respectively; no asterisk means no significant difference.
Sustainability 14 13776 g004
Figure 5. Social and mental health broken down by trip change behaviour during the RMCO. * and ** indicate significant differences at <0.05 and <0.1 between health conditions during different behaviour change patterns, respectively; no asterisk means no significant difference.
Sustainability 14 13776 g005
Figure 6. Social and mental health, broken down by online activity patterns during the MCO/CMCO. * and ** indicate significant differences at <0.05 and <0.1 between health conditions during different behaviour change patterns, respectively; no asterisk means no significant difference.
Sustainability 14 13776 g006
Figure 7. Social and mental health broken down by online activity patterns during the RMCO. * and ** indicate significant differences at <0.05 and <0.1 between health conditions during different behaviour change patterns, respectively; no asterisk means no significant difference.
Sustainability 14 13776 g007
Table 1. Respondent socio-demographic and location characteristics, n = 438.
VariablesPercentageMean (Standard Deviation)
Gender
Male33.5%
Female66.4%
Age (years old) 30.0 (8.1)
>25 years old40.4%
26–45 years old55.0%
46–60 years old3.9%
>600.7%
Education
High school or below6.6%
Diploma/Degree63.9%
Postgraduate29.4%
Occupation
Non-workers6.6%
Students30.6%
Workers 62.7%
Number of households 4.8 (2.0)
Single6.8%
Couple6.4%
3–5 members in the household53.7%
>5 members in the household33.1%
Income
Low income (<MYR 3000)20.3%
Middle income (MYR 3000–10,000)54.0%
High income (>10,000)25.7%
Number of cars in the household
No car available5.5%
1–2 cars66.0%
>2 cars28.5%
Number of motorcycles in the household
No motorcycle is available32.0%
1–2 motorcycles 56.4%
>211.6%
Residential location
KL metropolitan area33.6%
Penang metropolitan area7.8%
Johor Bahru metropolitan area 23.3%
Metropolitan areas in the Northern area (or defined as Northern Region)27.6%
Metropolitan areas in the East Coastal area (or defined as East Coast Region)7.8%
Table 2. Behaviour changes in trips and online activities before and during the pandemic.
VariablesMCO/CMCORMCO
On weekdaysMeanStandard DeviationMeanStandard Deviation
More trips for working 2.91.93.2 *1.9
More trips for grocery shopping3.51.83.7 **1.8
More trips for dining3.11.83.4 *1.7
More trips for socialising2.91.73.3 *1.7
More trips for sports3.11.73.31.7
More trips for health purposes3.21.53.4 *1.6
More total number of trips3.01.73.21.7
On weekends
More trips for working3.21.83.21.7
More trips for grocery shopping3.31.73.5 **1.7
More trips for dining3.11.73.3 *1.7
More trips for socialising3.01.73.3 *1.7
More trips for sports3.11.73.2 **1.7
More trips for health purposes3.41.53.41.6
More total number of trips3.21.73.31.6
On weekdays
More private vehicles3.82.03.81.9
More ridesharing3.51.73.61.6
More public transport3.21.63.31.5
More ride-sourcing3.41.63.51.6
More walking/cycling3.61.63.71.5
On weekends
More private vehicles3.91.93.91.9
More ridesharing3.51.63.61.6
More public transport3.31.63.31.5
More ride-sourcing3.51.53.51.6
More walking/cycling3.61.53.71.6
Online activities
More work/school from home5.21.85.31.7
More e-grocery shopping5.01.65.01.6
More e-shopping5.41.65.41.5
More e-meeting5.31.85.31.7
More food delivery using ride-sourcing5.21.75.21.6
More movie streaming5.11.75.21.6
More use of social media5.21.65.21.5
More use of computer5.31.65.31.5
More use of gadgets5.41.55.41.5
* and ** indicate significant differences at <0.05 and <0.1 between the observed behaviour changes during the MCO/CMCO and RMCO, respectively; no asterisk means no significant difference.
Table 3. Loading factors of each observed variable and factor scores of the health variables.
Observed VariablesLoading FactorsLatent Variables (Mean, Standard Deviation, Maximum and Minimum Value of Factor Scores)
Limitations of role functioning because of physical health (RP)0.436Social health/SH
(0.00, 1.00, 1.79, −2.72)
Social functioning (SF)0.326
Limitations of role functioning because of emotional problems (RE)0.422
General health (GH)0.296Mental health/MH
(0.00, 1.00, 1.88, −3.25)
Bodily pain (BP)0.254
Social functioning (SF)0.263
Vitality (VT)0.413
Mental health (MH)0.432
Table 4. The estimated results (using standardised coefficients and only significant variables with p-value < 0.1 are shown).
VariablesMHSH
Model 1Model 2Model 1Model 2
CoeffT-StatCoeffT-StatCoeffT-StatCoeffT-Stat
Intercept−0.324−1.5890.448−2.067−0.0481−0.2390.6232.947
RMCO
MCO/CMCORefRef RefRef
Penang metro area
Johor Bahru metro area −0.120−3.026−0.045−1.823
Northern region urban areas −0.071−1.775−0.0441.779
East coastal region urban areas 0.0421.793−0.063−1.718−0.055−2.419
KL metro areaRefRefRefRefRefRefRefRef
Performing working trips more often on weekdays during the pandemic compared to before the pandemic 0.144−2.342
Performing grocery shopping trips more often on weekdays during the pandemic compared to before the pandemic
Performing dining trips more often on weekdays during the pandemic compared to before the pandemic 0.0681.832
Performing socialising trips more often on weekdays during the pandemic compared to before the pandemic −0.105−2.451 0.0771.835
Performing sports trips more often on weekdays during the pandemic compared to before the pandemic
Performing health care trips more often on weekdays during the pandemic compared to before the pandemic
Performing more trips per day on weekdays during the pandemic compared to before the pandemic −0.163−2.367−0.081−1.950
Performing working trips more often on weekends during the pandemic compared to before the pandemic 0.1302.3540.0852.558
Performing grocery shopping trips more often on weekends during the pandemic compared to before the pandemic 0.0631.774 −0.073−2.095
Performing dining trips more often on weekends during the pandemic compared to before the pandemic 0.0651.606
Performing socialising trips more often on weekends during the pandemic compared to before the pandemic −0.079−1.748 0.0751.698
Performing sports trips more often on weekends during the pandemic compared to before the pandemic0.1121.681
Performing health care trips more often on weekends during the pandemic compared to before the pandemic
Performing more trips per day on weekends during the pandemic compared to before the pandemic
Performing work/study from home more often during the pandemic compared to before the pandemic−0.113−2.168 −0.083−1.691
Performing e-grocery shopping more often during the pandemic compared to before the pandemic 0.0961.818
Performing e-shopping/e-commerce more often during the pandemic compared to before the pandemic−0.159−2.775 −0.126−2.222
Performing e-meetings for mandatory and leisure purposes more often during the pandemic compared to before the pandemic0.1001.684 0.1171.995
Performing food delivery using ride-sourcing more often during the pandemic compared to before the pandemic −0.058−1.778 0.0712.230
Performing movie streaming more often during the pandemic compared to before the pandemic0.0851.7590.0742.434 −0.050−1.670
Using social media more often during the pandemic compared to before the pandemic
Using computers more often during the pandemic compared to before the pandemic
Using gadgets more often during the pandemic compared to before the pandemic0.1392.2540.0952.513
Taking private vehicles more often on weekdays during the pandemic compared to before the pandemic
Taking ridesharing more often on weekdays during the pandemic compared to before the pandemic
Taking public transport more often on weekdays during the pandemic compared to before the pandemic
Taking ride-sourcing more often on weekdays during the pandemic compared to before the pandemic 0.0661.751
Taking walking and cycling more often on weekdays during the pandemic compared to before the pandemic 0.0571.654
Taking private vehicles more often on weekends during the pandemic compared to before the pandemic
Taking ridesharing more often on weekends during the pandemic compared to before the pandemic 0.1142.714
Taking public transport more often on weekends during the pandemic compared to before the pandemic −0.077−2.002
Taking ride-sourcing more often on weekends during the pandemic compared to before the pandemic −0.112−2.758
Taking walking and cycling more often on weekends during the pandemic compared to before the pandemic
Males
Females RefRef RefRef
Generation Z (<26 years old) 0.1582.745 −0.159−2.825
Generation Y and X (26–55 years old) 0.0991.872 −0.119−2.303
Baby boomers RefRef RefRef
Part-time workers 0.0441.757 −0.068−2.775
Full-time workers 0.1052.378 −0.159−3.708
Students −0.090−2.046
Non-workers RefRef RefRef
From high-income households 0.0752.709
From middle-income households
From low-income households RefRef RefRef
Having more than 2 cars in the households
Having 1–2 car/s in the households
Having more than 2 motorcycles in the households
Having 1–2 motorcycle/s in the households
No car in the households RefRef RefRef
Social health 0.81537.728
Mental health 0.78037.728
Mean0.0000.0000.0000.000
SD0.9990.9990.9990.999
Different lockdown phase error term (ui)0.0000030.0000020.0000030.000002
ϵ i t 0.9590.5720.9470.560
AIC2475.1301606.5352452.5111568.171
BIC2675.3101873.4422652.6911835.077
Log-likelihood−1195.565−747.268−1184.256−728.085
Publisher’s Note: MDPI stays neutral with regard to jurisdictional claims in published maps and institutional affiliations.

