Article

Experimental and Theoretical Study on Mechanical Performance of a Sustainable Method to Simultaneously Generate Power and Fresh Water

1
School of Engineering, RMIT University, Melbourne 3001, Australia
2
School of Mechanical Engineering, The University of Adelaide, Docklands 3008, Australia
*
Authors to whom correspondence should be addressed.
Sustainability 2022, 14(21), 14039; https://doi.org/10.3390/su142114039
Submission received: 12 October 2022 / Revised: 23 October 2022 / Accepted: 26 October 2022 / Published: 28 October 2022

Abstract

:
Many regions around the world have limited access to clean water and power. Low-grade thermal energy in the form of industrial waste heat or non-concentrating solar thermal energy is an underutilized resource and can be used for water desalination and power generation. This paper experimentally and theoretically examines a thermoelectric-based simultaneous power generation and desalination system that can utilize low-grade thermal energy. The paper presents concept design and the theoretical analysis of the proposed system followed by experimental analysis and comparison with the theoretical estimations. Experiments were carried out at three heat loads 50, 100 and 150 W to achieve varying temperature gradients across thermoelectric generators. During the experiments, thermoelectric generators were maintained at a hot to cold side temperature difference between 20 to 60 °C. The experiments showed that the power generation flux and freshwater mass flux increased with the increase in the thermal energy source temperature. The power flux varied between 12 to 117 W/m2 of thermoelectric generator area, while freshwater mass flux varied between 4.8 to 23.7 kg/m2⋅h. The specific thermal energy consumption varied between 3.6 to 5.7 MJ/kg of freshwater; this is comparable to the single-stage conventional distillation system.

1. Introduction

Access to electricity and fresh drinking water are basic human rights, yet there are many communities around the world that lack these resources [1,2]. As a result of the steady growth in world population, water and energy resources are being stretched to a level never seen before [3]. Even though 70% of the planet is covered by water, only 3% is drinkable. Approximately two-thirds of the drinkable water are found in frozen glaciers, rendering water to be a scarcity. Alongside water scarcity, the world’s production of hydrocarbons, currently the conventional means of electrical energy, and major power provider to desalination technologies amongst other uses, is also depleting [2]. With such dire issues at hand, there is a scope to develop desalination technologies and perform further research into sustainable energy utilisation. Lack of access to efficient and clean electrical energy has significant socio-economic and environmental impacts, particularly in rural and remote regions where people are poor, and quality of life is in most need of improvement.
Desalination provides an opportunity for alleviating water scarcity [1,4]. However, the energy requirements and high initial cost of traditional technologies pose a major challenge [5]. There is a clear need for more sustainable and energy efficient systems that are higher yielding and easier to maintain. Innovation and expanded research and development are key to boosting desalination technology and achieving higher efficiency devices at lower cost [6,7].
Recovery and reuse of industrial waste heat is an important research area due to the efficiency gains required for reductions in fuel consumption and greenhouse gas emissions [8,9]. According to the U.S. Department of Energy, as much as 20 to 50% of industrial energy consumption is ultimately discharged as waste heat [10]. The power generation industries are a plentiful source of waste heat because warm combustion gasses that cannot be converted efficiently into work are often released into the atmosphere.
Traditional desalination technologies rely on thermal energy resources for large-scale water purification [11]. Conversely, desalination technologies are attractive to many industries because saline effluent resulting from industrial processes is a common trade waste issue [12]. For example, water used for cleaning utensils in the food processing industry or meat processing industry has very low TDS (Total Dissolved Solids) and it is still drained after a single use, these industries also have a large amount of waste heat available on site that could be used for treating the wastewater on-site [13].
Thermoelectric devices are increasingly being seen as a viable technology for conversion of waste heat into electricity [9,14]. Despite their low thermal efficiencies, TEG offers many advantages over traditional thermal to electric generators. They are of simple construction, contain no moving parts, complete silent, and can start generating power at considerably low temperature differences [15].
Extensive research has been conducted on systems that use low-grade heat for either thermoelectric power generation or desalination [16,17,18,19]. However, limited research has been carried out on systems that combine these two processes [20,21,22,23]. Moharram et al. [21] have studied combining of conventional Rankine cycle heat engine with multistage flash and reverse osmosis desalination. The Rankine engine operating system temperature is reported to be 350 °C. The recovery ratio of the RO system is reported to be around 30%. Gaffar et al. [22] have carried out experiments on composite membrane made of graphene oxide melanin (GOM) for simultaneous desalination and energy generation using solar energy. This type of membrane is claimed to have 95% absorption which achieves surface temperature of 65 °C. This system has solar to vapor conversion efficiency of over 93%. The freshwater mass flux of this system is between 1.05 and 1.357 kg/m2⋅h. They combined this GOM membrane system with TEG’s and were able to produce around 0.9 W/m2 of power flux. The literature provided some insight into combining desalination and power generation, but they use high-temperature sources or have very low freshwater yield when using low. This calls for further research into developing systems that can more efficiently produce freshwater and power. Some attempts have been made by us previously in this direction [23], and the present research is an extension of the studies conducted thus far. It intends to further the understanding by examining the performance of a new system configuration that will make the system more practical and simpler to operate.

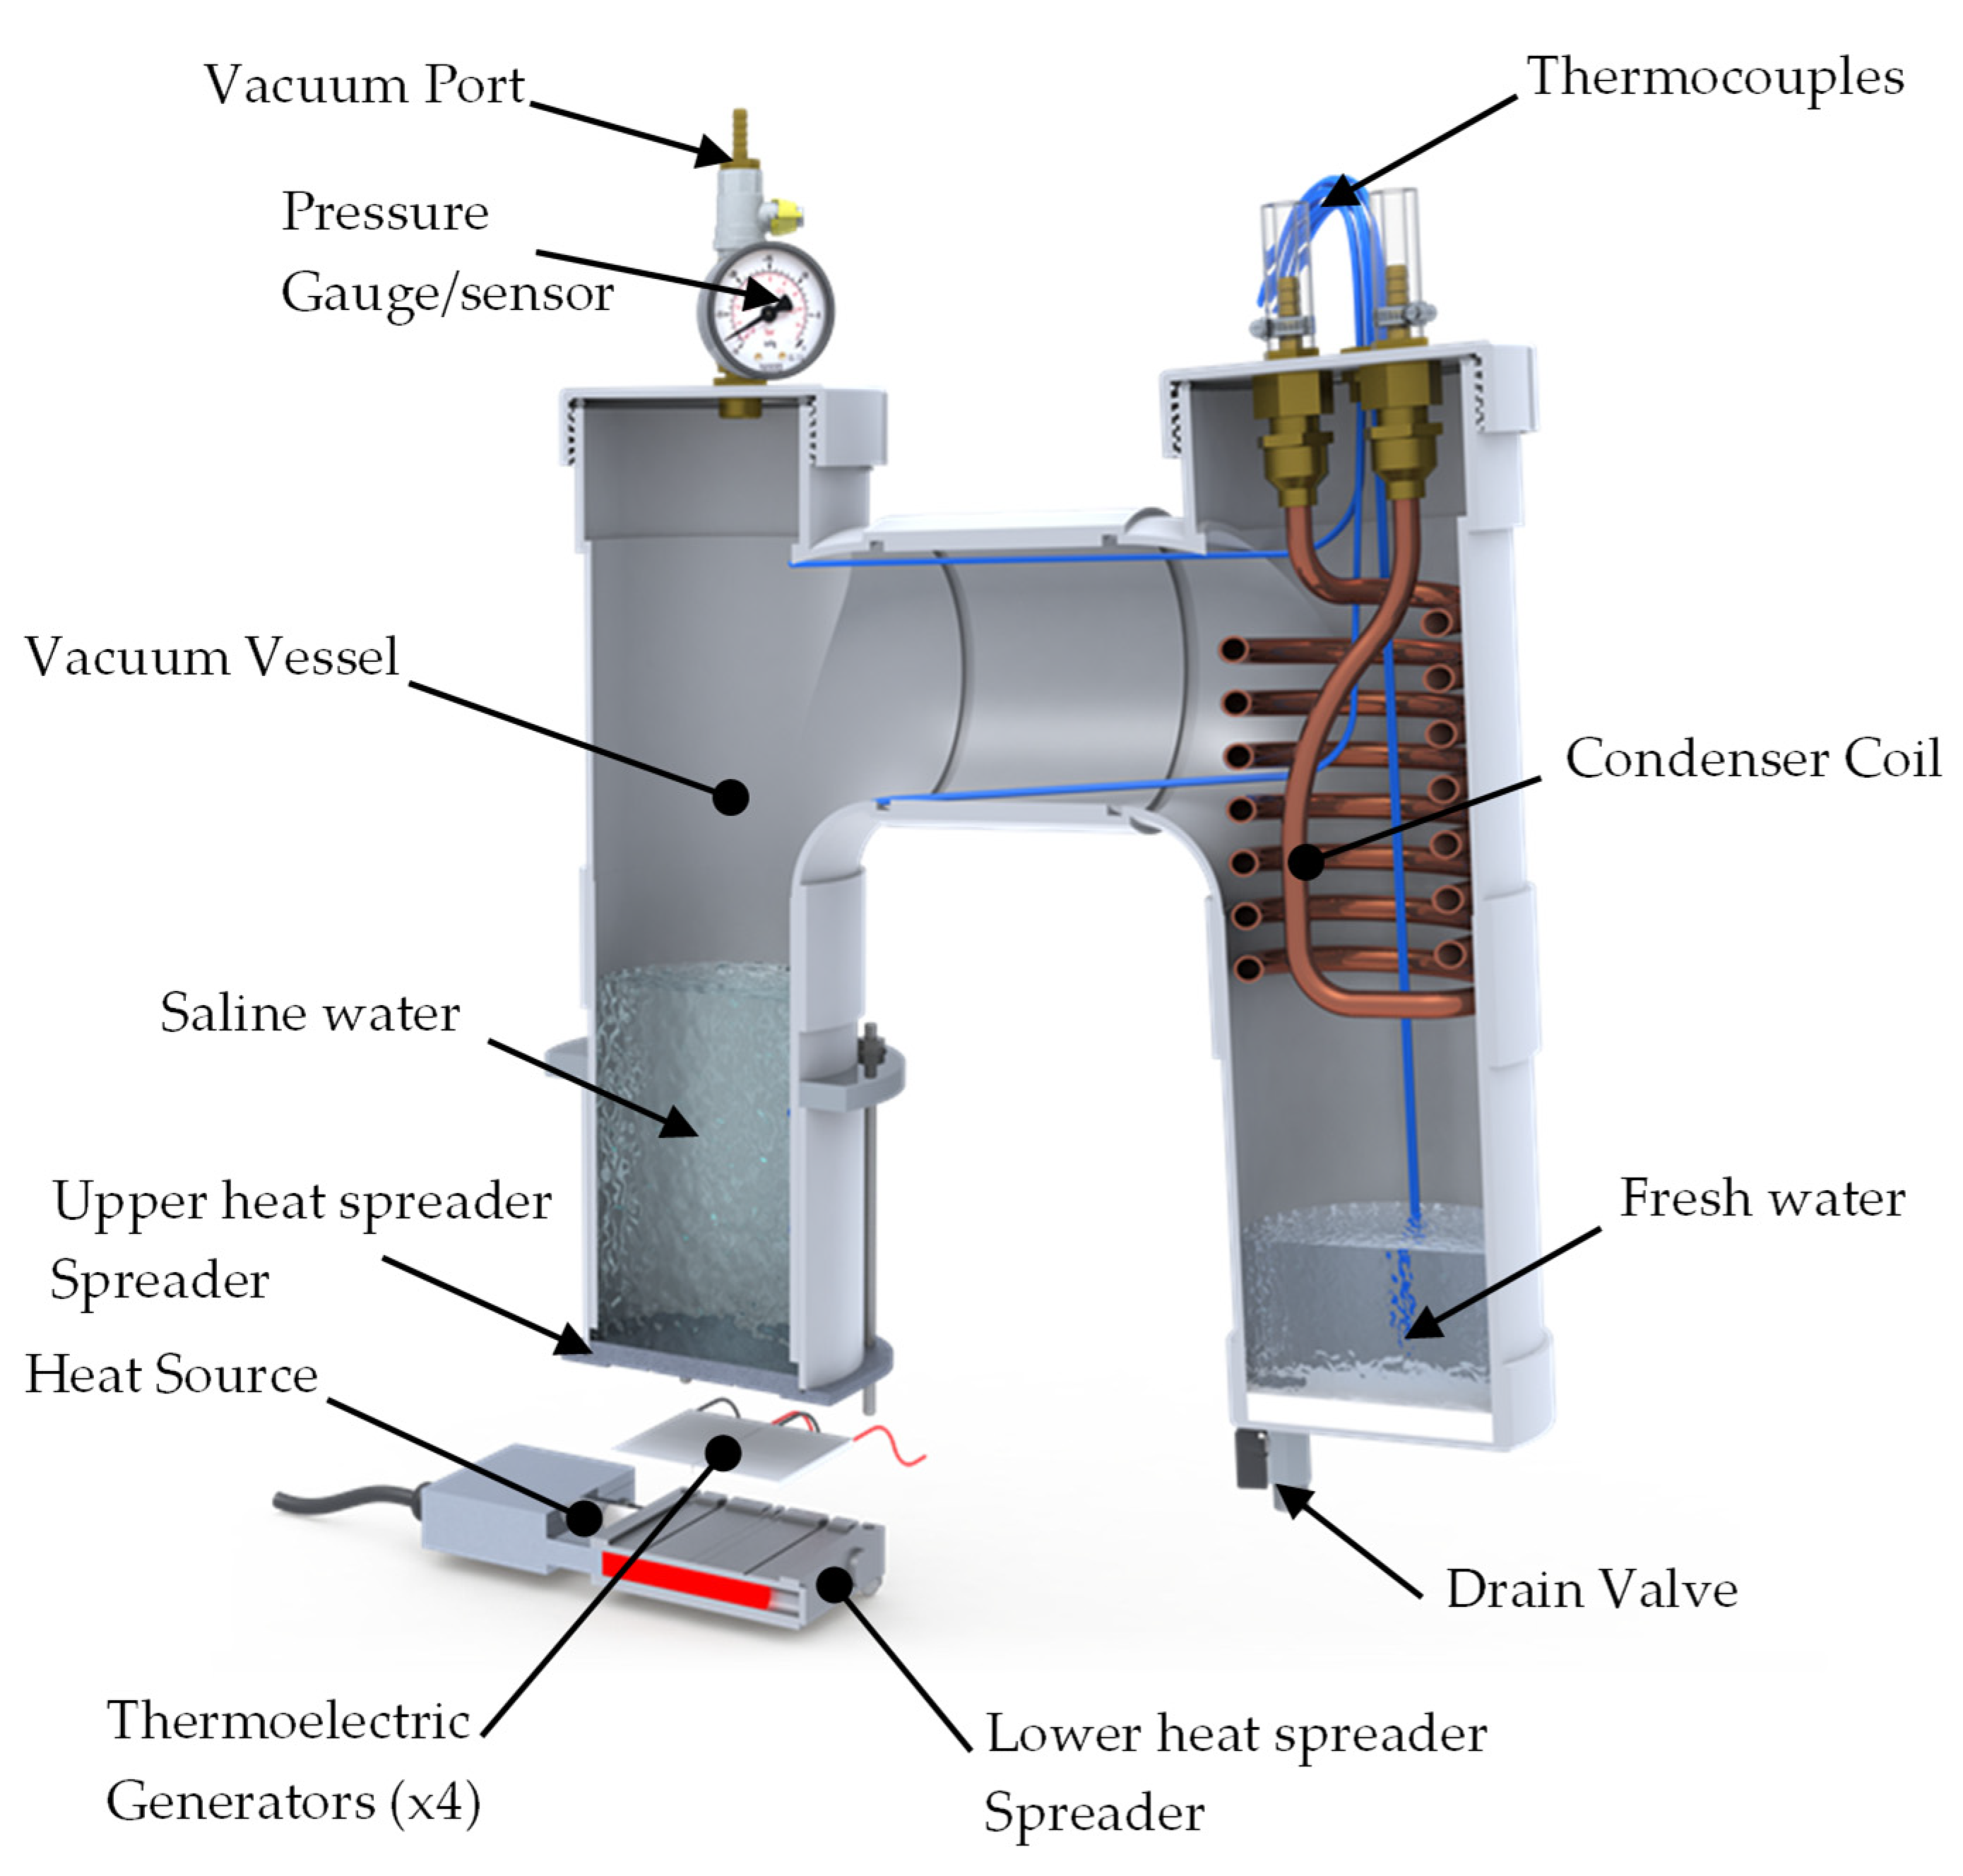
2. Simultaneous Power and Water Generation

A schematic of the proposed simultaneous power generation and water desalination system is shown in Figure 1. Electric resistance heaters act as the heat source and supply a representative low-grade thermal energy. The heaters are embedded in a lower heat spreader that distributes the heat evenly to the thermoelectric generator (TEG). The TEG is sandwiched between the lower and upper heat spreaders. The upper heat spreader also acts as the base of the chamber that is maintained under sub-atmospheric pressure. The top face of the upper heat spreader is in contact with the saline water, which is heated.
Operating the system under sub-atmospheric conditions (vacuum) allows controlling of the saturation temperature of the saline water and in turn the cold side temperature of the TEG. This maximises temperature difference across the TEG resulting in increased thermal efficiency. The water vapour produced from evaporation of the saline water is condensed on a cooling coil on the right-hand side of the section of the system. The fresh water that is collected beneath the cooling coil is still under vacuum and hence needs to be pumped out of the vacuum chamber. To avoid cavitation when extracting the fresh water, a submersible pump should be used. Alternatively, gravity assisted removal of the water should be implemented, this means that the system should be placed at an elevation proportional to vacuum pressure in the chamber.
For the experimental prototype, the heat spreaders (as shown in Figure 2) were machined from aluminium. O-ring is used to seal the assembly between the upper heat spreader and the vessel (chamber). While the top surface of the upper heat spreader has been sand blasted to increase heat transfer to saline water as suggested in the literature [24].
To simplify the manufacturing process, standard PVC pipe and fitting were used to make the vacuum vessel (100 mm diameter PVC pipe). Further to simplify the assembly and charging of the saline water into the system, the left and right-side tops were made from threaded PVC end caps. The total internal empty volume of the system is 7.46 L, and the cooling coil occupies around 0.5 L of volume. The cooling coil is made of a 10 mm nominal diameter copper tube (1.02 mm wall thickness). To reduce the film-wise condensation, the outer surface of the cooling coil has been roughened by sand blasting, rough external surface will help break and condensate film formation and improve condensation heat transfer [24]. Thermocouples and pressure transducers are used to monitor the various temperatures and pressure within the system. Temperatures are measured on the hot and cold side of TEG along with the upper spreader upper surface which is in contact with the water and the bulk water, vapour cavity and the condenser surface.
An electrical resistive load circuit has been used to measure the output power of the TEG for varying load conditions. As shown in Figure 3, the circuit comprises four TEG, a 0 to 8 Ω Rheostat (variable resistor), and a 0.1 Ω wire wound resistor. All components are connected in series. Open circuit voltage V o c is measured across the TEG to determine output voltage, and across the 0.1 Ω resistor to determine current.

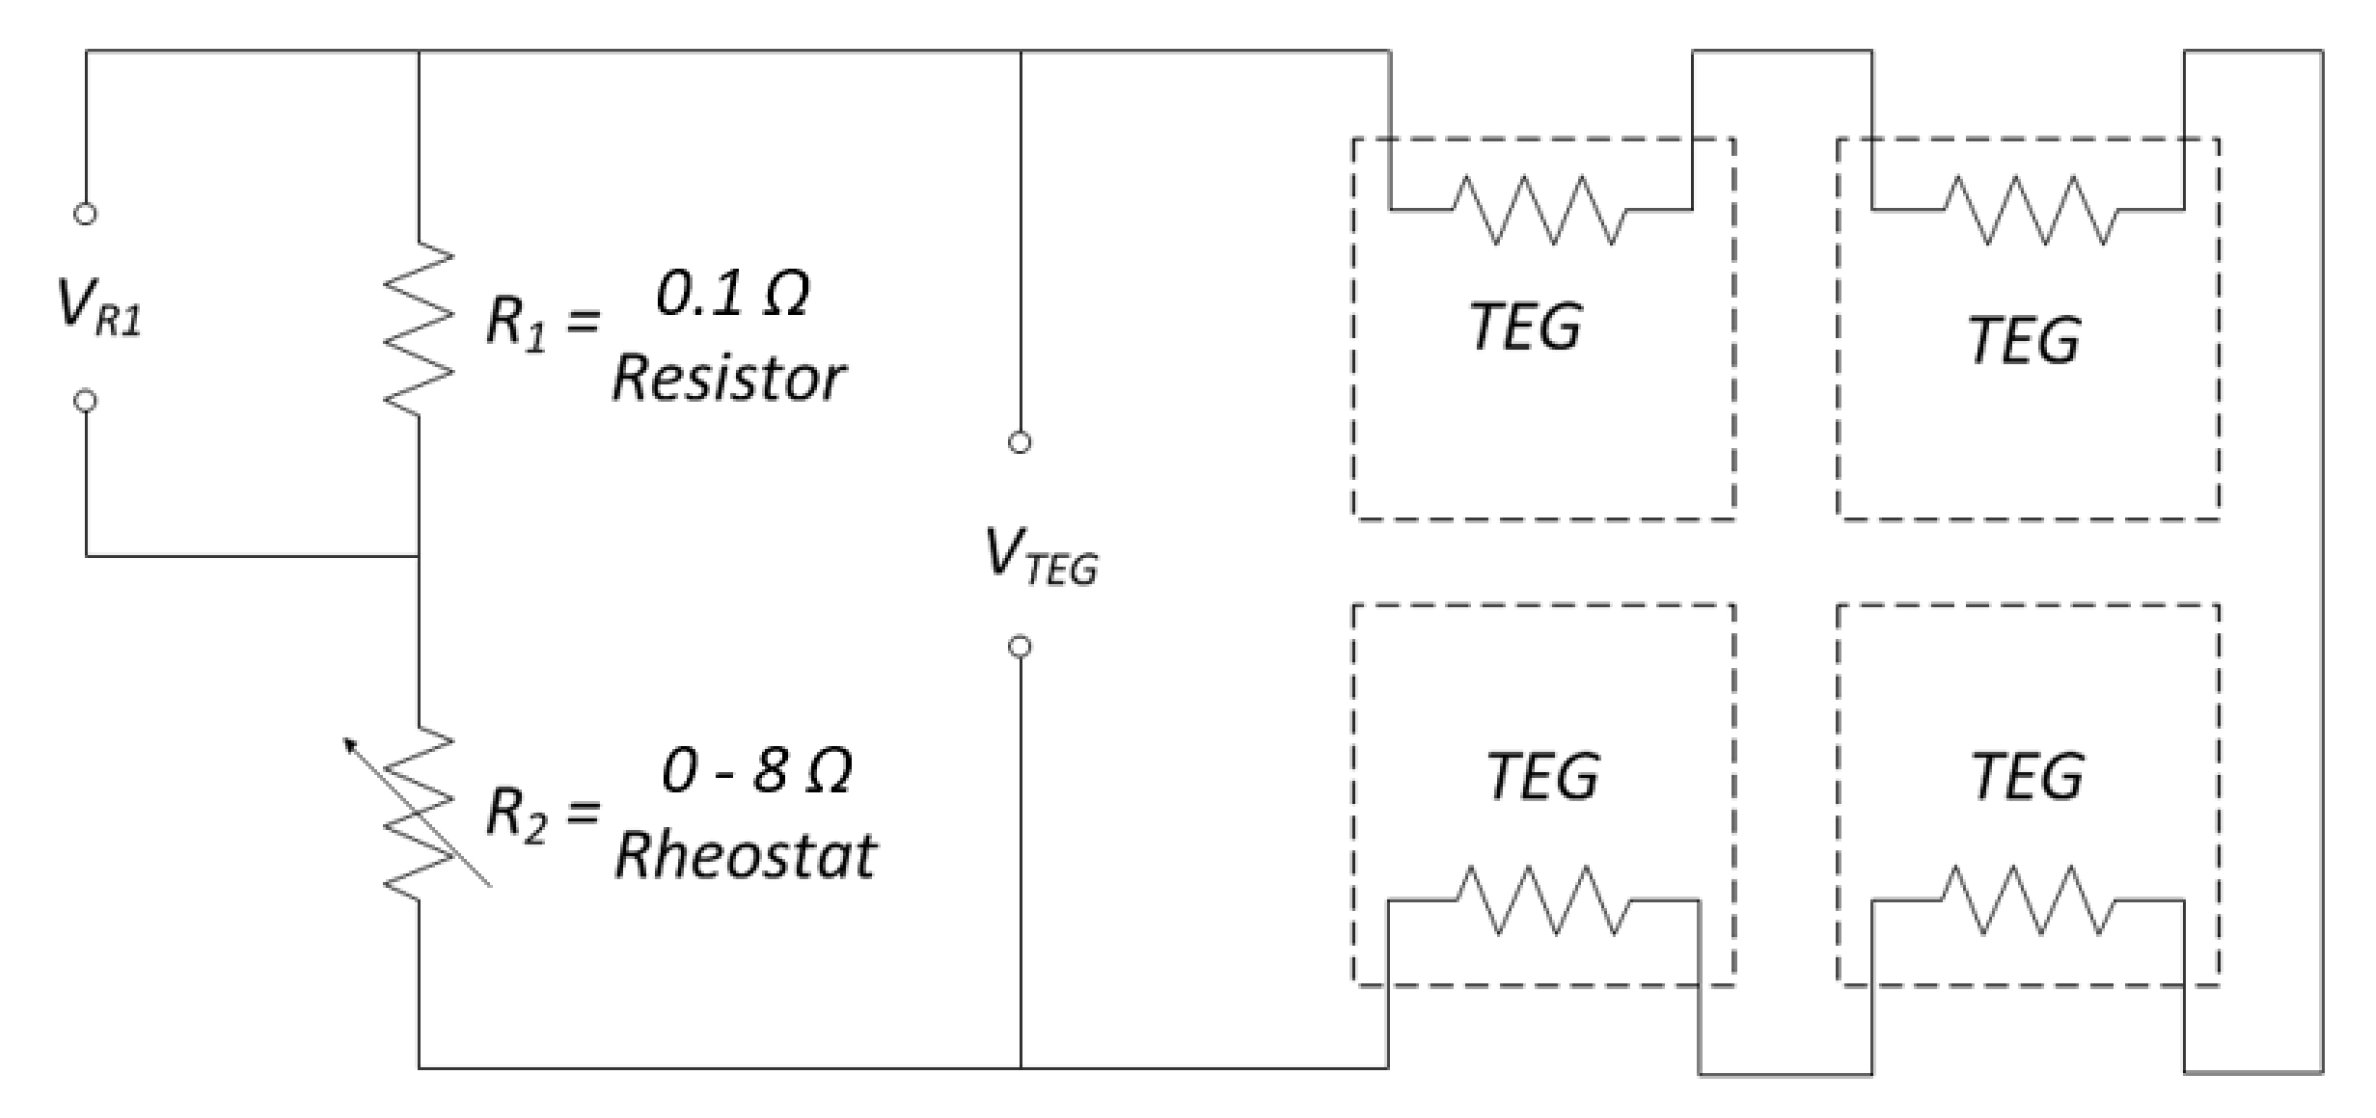
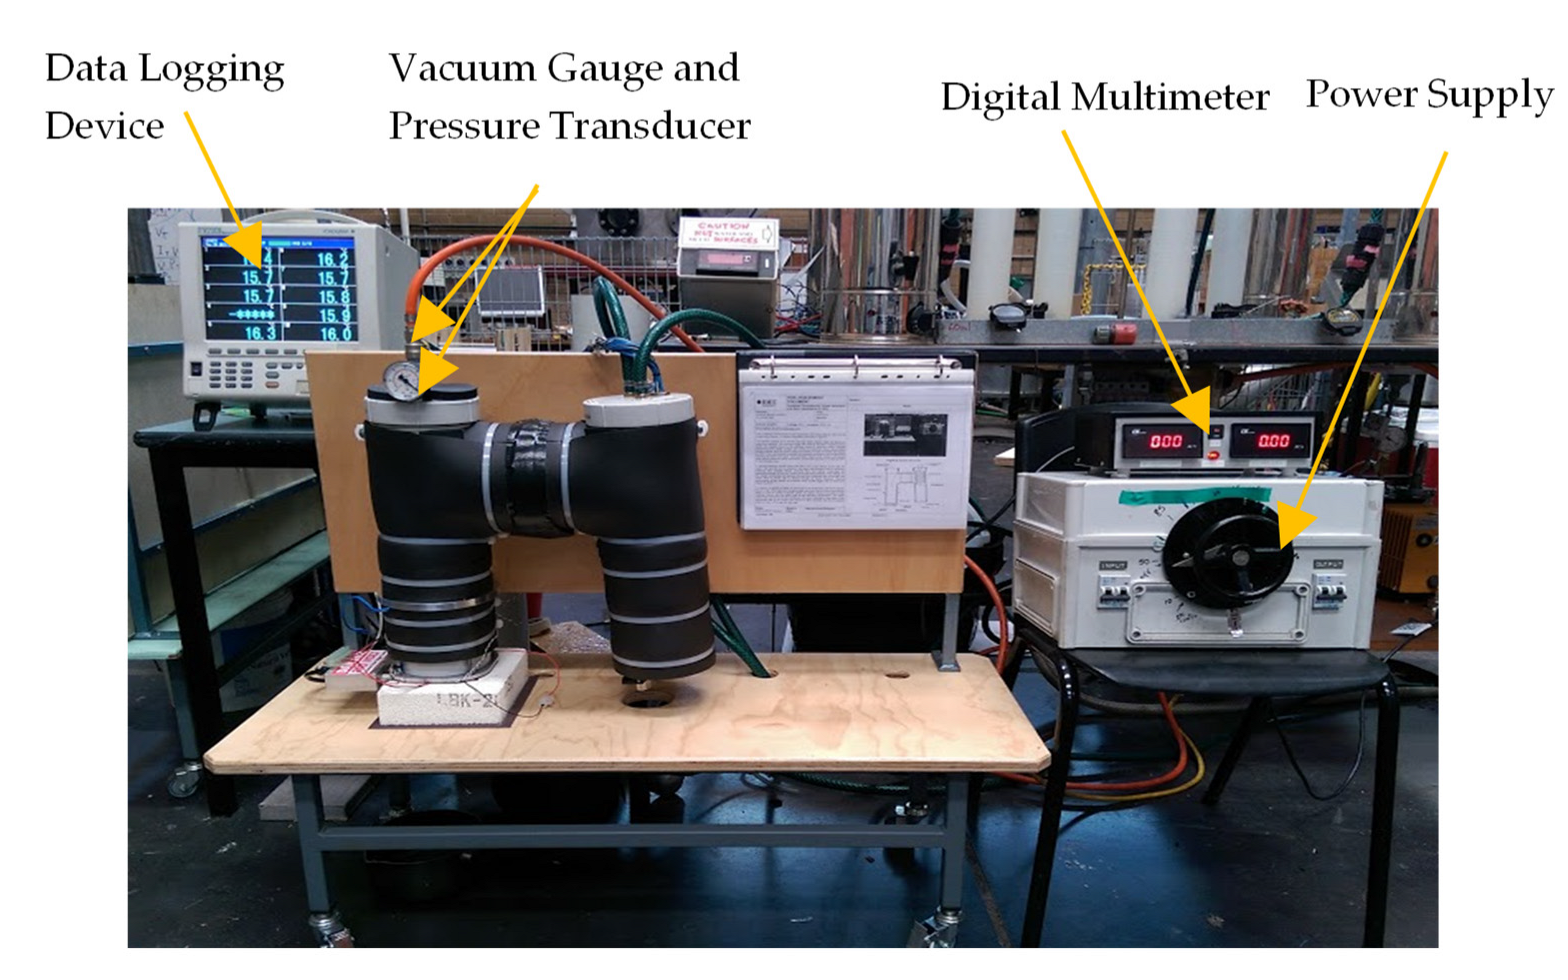
3. Experimental Set-Up and Data Acquisition System

Temperature, pressure, voltage, and current are recorded using a data logging device (Figure 4 and Table 1) which has been configured to measure temperature, pressure, current and voltage readings at 5 s intervals. Power is supplied to the resistive heaters through a variable low voltage AC power supply. A digital display module is connected to monitor voltage and current supplied to the heater. A two-stage rotary vane vacuum pump is used to create the initial vacuum in the system. In this experimental setup, the limiting factor for initial minimum obtainable vessel pressure during testing was the capability of the vacuum pump. Vacuum pressure is visually monitored using a vacuum gauge. This provides scale readings from 0 bar to −1.0 bar. More accurate readings are obtained using a diaphragm type pressure transducer. Local atmospheric pressure is recorded at the start of each test using a Fortin barometer and is used to estimate the absolute pressure in the vacuum chamber, which is then used to estimate the saturation temperature of the water.

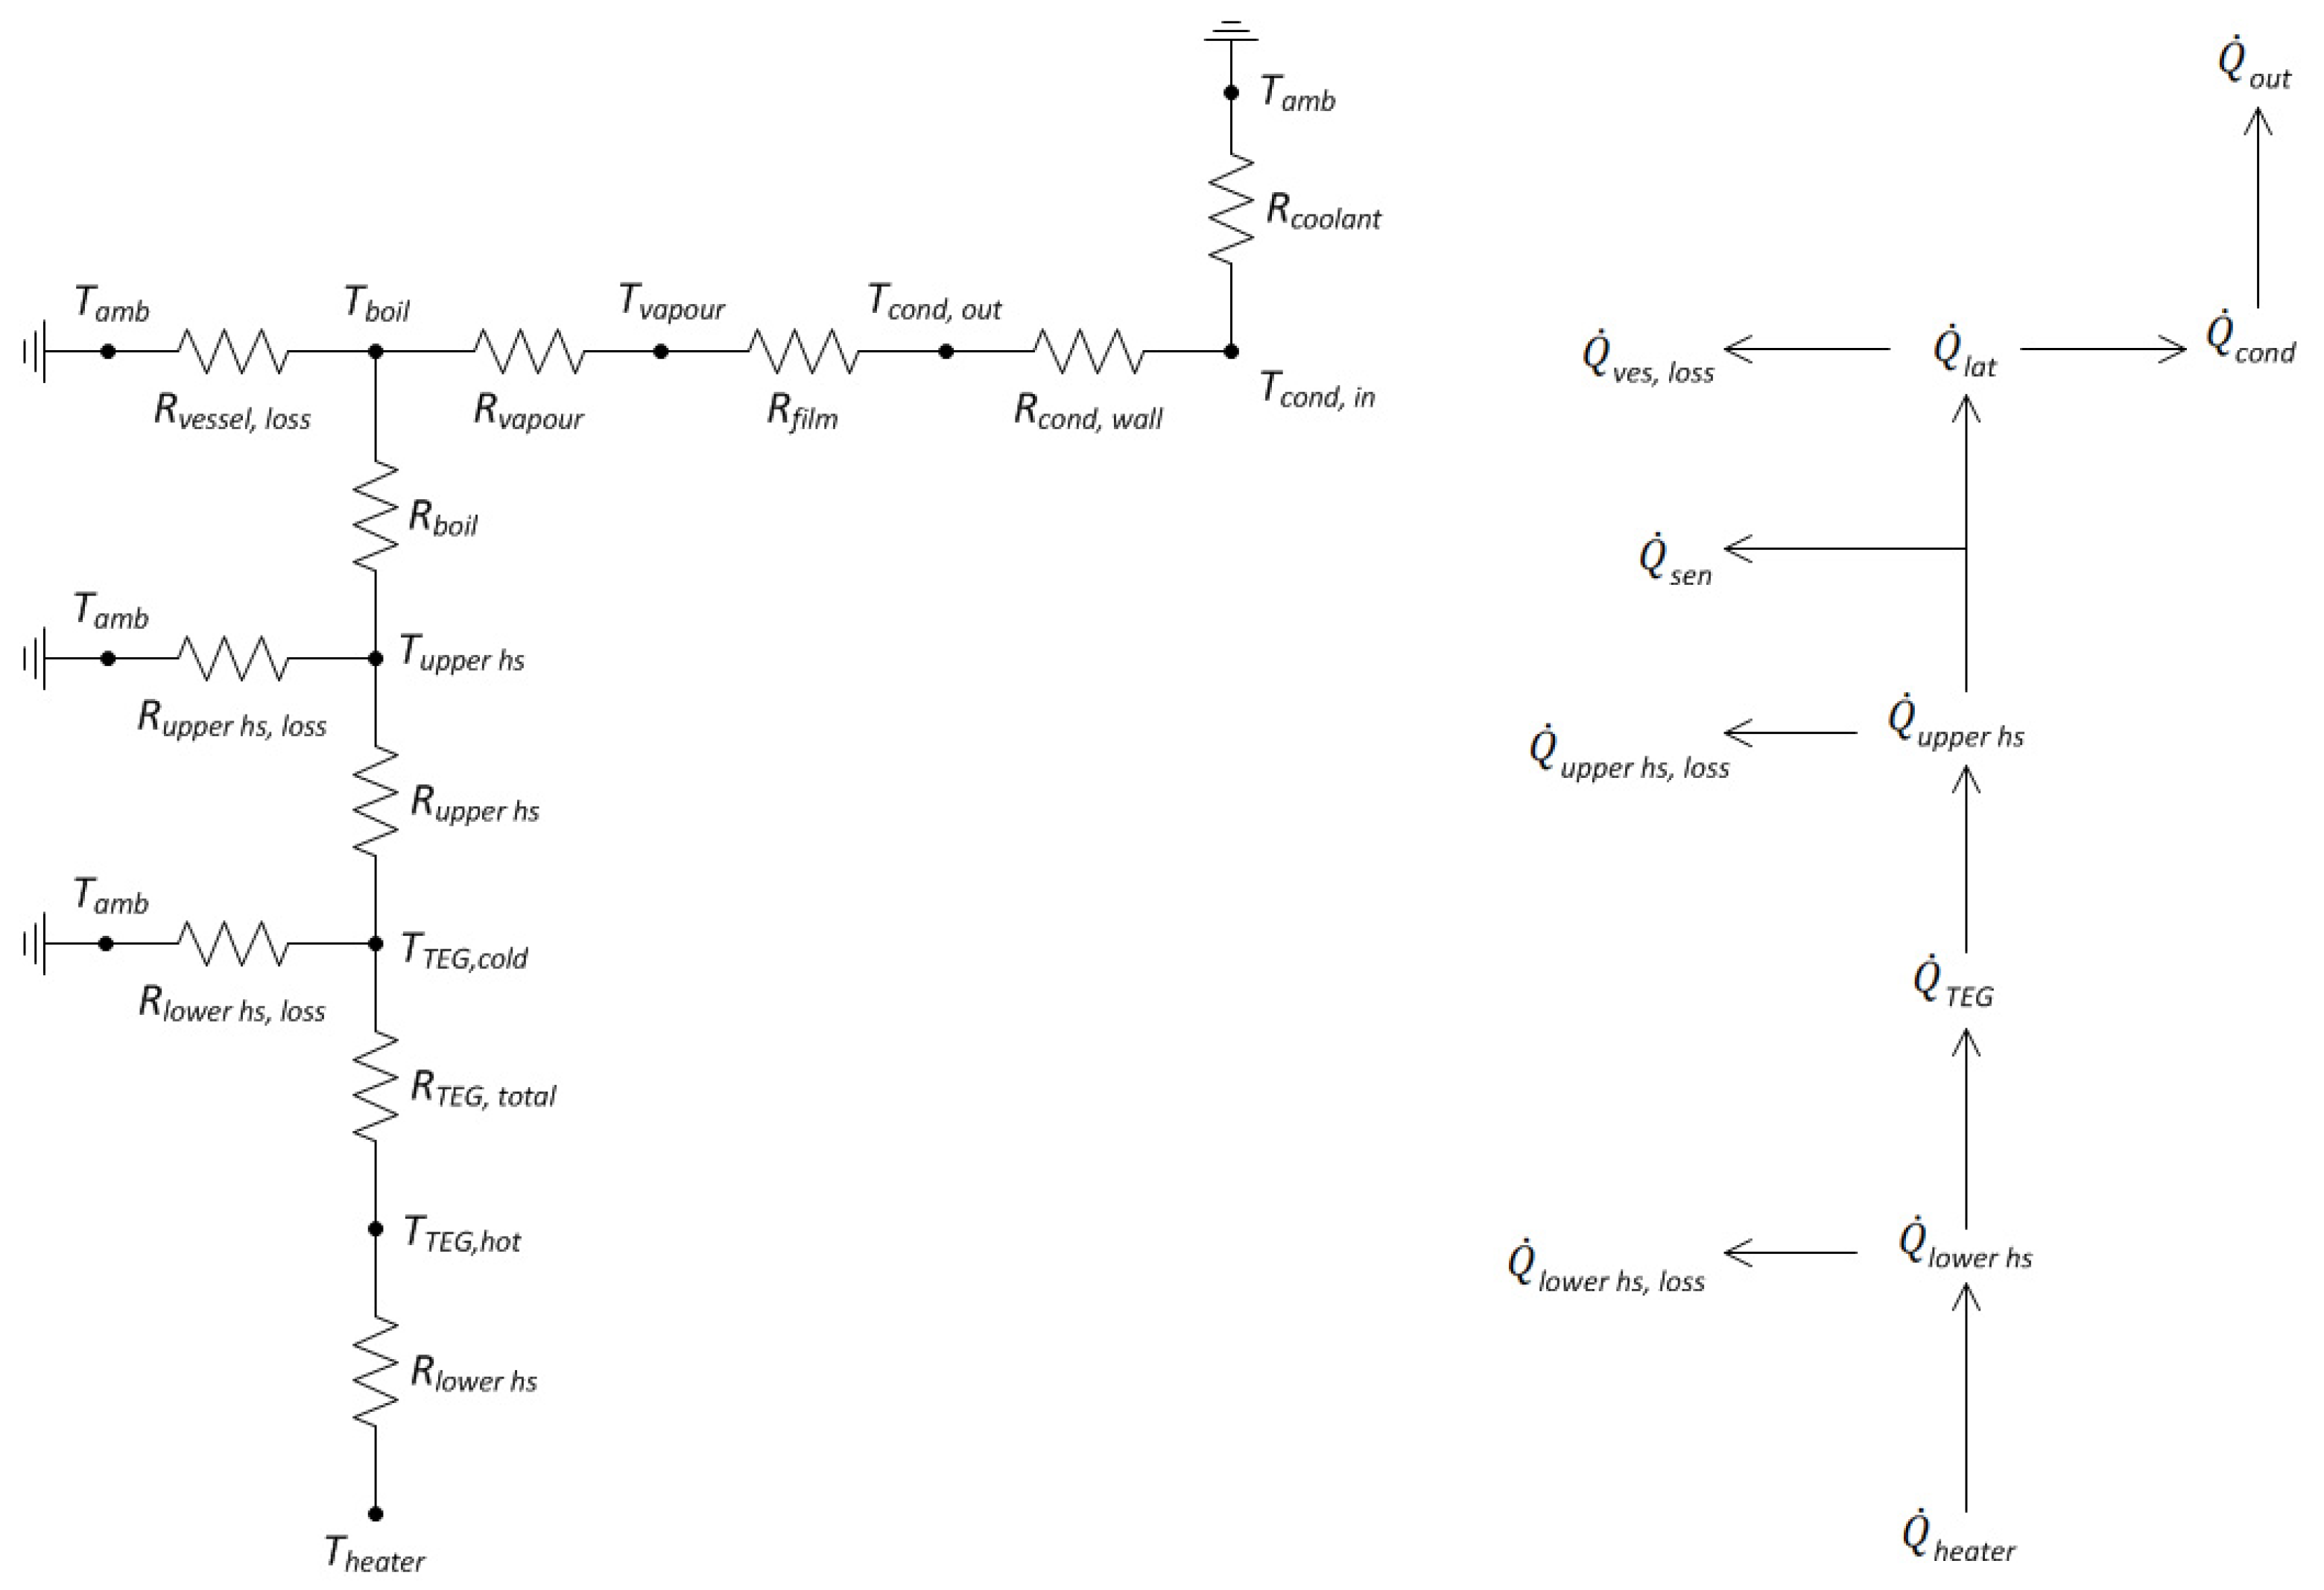
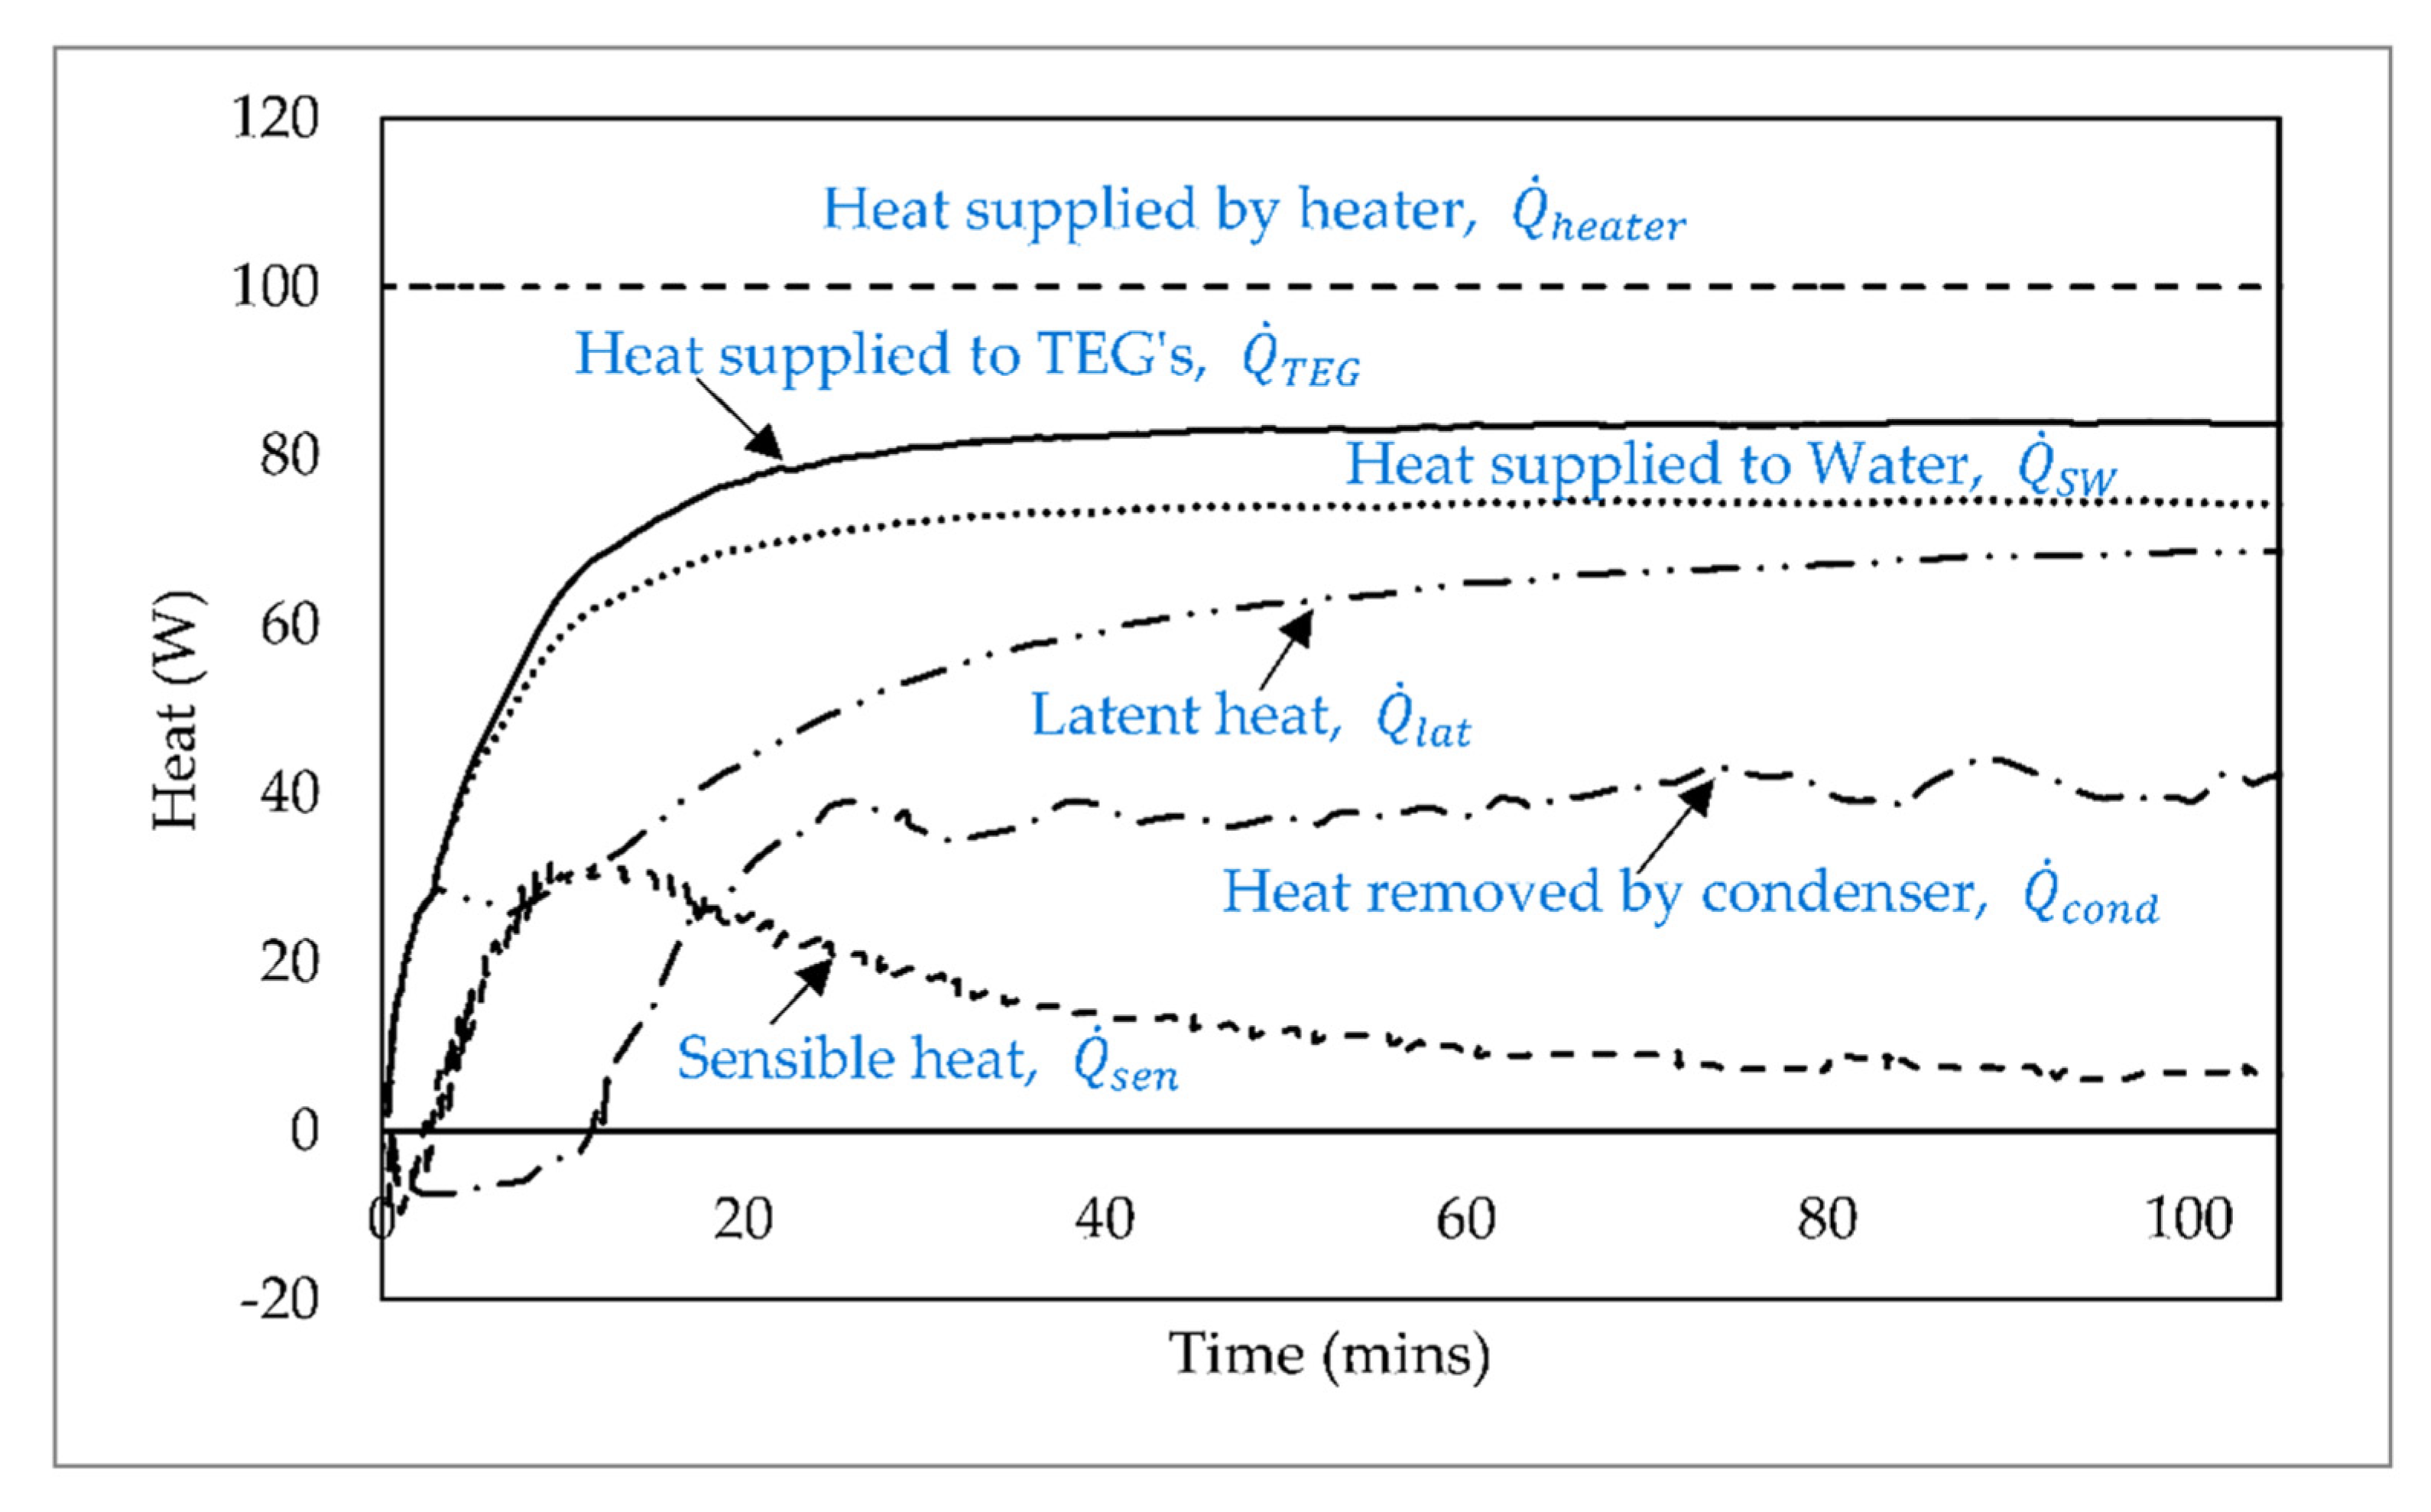
4. Energy Balance Modelling of the Proposed System

This section provides a mathematical model of the proposed system using Thermal Resistance Network (TRN) and energy balance methodologies. A TRN diagram for the proposed system is provided in Figure 5. The analytical model aims to provide a method of determining the sensible and latent heating temperatures of the saline water, the electrical power output and vapour generation (desalination).

4.1. Heating of Saline Water and Vapour Generation

Electrical resistive heaters are used to heat the heat spreaders, TEG, and the walls of the vessel. Some of this thermal energy is lost from the heat spreaders and vessel walls to the atmosphere although insulation is used to minimise these losses. Additionally, the condenser coil removes the latent heat of condensation from the water vapour. The following section presents the thermal resistance and energy balance equations used in the analytical modelling.
The thermal resistance of a single TEG is,
R T E G = t T E G k T E G   A T E G
where, A T E G is the surface area of TEG, k T E G is the thermal conductivity of the TEG, and t T E G is the TEG thickness. Given the parallel arrangement of four TEG, the total thermal resistance can be expressed as, here the number of TEG is represented by n .
R T E G ,   t o t = 1 n t T E G k T E G   A T E G
Graphite-based thermal interface material is used to improve the contact between the upper heat spreader, TEG and the lower heat spreader. For this analysis, the thermal resistance due to the interface is assumed to be very small. The thermal resistance of the heat spreaders is given from the following relation.
R h s = t h s k h s   A h s
this equation can be used to estimate the thermal resistance of the lower and upper heat spreaders. Here, t h s is the spreader thickness, k h s is the thermal conductivity and A h s is the surface area of the spreader.
To simplify the analysis, the heat spreaders are very well insulated and the thermal resistance between the heat spreaders and the surrounding air is negligible. So, the combined thermal resistance from the heater to the top surface of the upper heat spreader is given as,
R h s + T E G = R h s ,   l o + R T E G ,   t o t + R h s ,   u p
the rate of thermal energy that will reach the water can be estimated using the following equation. Here, T h e a t e r is the temperature of the heat source (in the case of this experimental study, this is the temperature of the heater) and T h s , u p is the top surface temperature of the upper heat spreader.
Q ˙ h s = T h e a t e r T h s , u p R h s + T E G
in this analysis, the heater is assumed 100% efficient in its conversion of electrical power to thermal energy. Further, it is assumed that the heat spreaders are very well insulated, while some of the thermal energy supplied by the heat source may get lost to the surrounding and never reach the TEG and water. This heat loss, Q ˙ h s ,   l o s s can be determined from the knowledge of the thermal resistance offered by the insulation and the temperature difference between the spreaders and the surroundings.
Q ˙ h s ,   l o s s = T h s T a m b R i n s u l a t i o n
here, the R i n s u l a t i o n is overall thermal resistance of the insulation around lower and upper heat spreaders.
The vacuum vessel is assumed to be very well insulated and hence the thermal energy loss to the atmosphere is assumed to be negligible for this analysis. The heat transfer fluid in the condenser coil removes latent heat from the water vapour. Applying the conservation of energy principle, the energy balance for heat addition to the saline water can be written as,
Q ˙ s e n + Q ˙ l a t = Q ˙ h s Q ˙ s w ,   l o s s
the total rate of thermal energy absorbed by the saline water is the sum of the rate of sensible heat plus the rate of latent heat required to evaporate the saline water under controlled sub-atmospheric conditions maintained in the vacuum vessel. The sensible heating is a function of the rate of change of the saline water temperature from the initial temperature d T w / d t , here d t is the corresponding change in time. The term C p ,   a v g is the average specific heat capacity of the saline water.
Q ˙ s w , l o s s = U A s T s w T a m b
the term Q ˙ s w ,   l o s s in Equation (7) is the heat loss to the surrounding through the walls. The variable U A s (W/K) in Equation (9) is the product of the overall heat transfer coefficient and the heat transfer surface area. It is specific to the configuration of the system and has been determined through primary experiments for this analysis.
Q ˙ s e n = m s w C p , a v g d T w d t
once the saline water temperature reaches the saturation temperature, the thermal energy added to the water will be used to evaporate the water and this will be the rate of latent heat.
Q ˙ l a t = Q ˙ h s Q ˙ s e n Q ˙ s w ,   l o s s
this will be proportional to the product of mass flow rate of vapour generated ( m ˙ f w ) and the specific latent heat of evaporation h f g .
Q ˙ l a t = m ˙ f w h f g  
considering further derivation work completed by Date et al. [25], the instantaneous temperature of the saline water due to sensible heating can be expressed as follows,
T s w = T s w , i Q ˙ h s + U A s T a m b U A s e x p U A s m c p , a v g t + Q ˙ h s + U A s T a m b U A s

4.2. Fresh Water Production

To maintain constant vacuum pressure, the rate of vapour generation must be equal to the rate of vapour condensation. Assuming the vessel walls to be very well insulated, the rate of latent heat must be equal to the rate of heat removal by the condenser.
Q ˙ c o n d = Q ˙ l a t
here, Q ˙ c o n d is rate of thermal energy absorbed by the heat transfer fluid in the condenser coil.
If the rate of vapour generation is greater than the rate of condensation, the pressure of the vessel will rise and lead to a subsequent rise in the saturation temperature. Pool boiling conditions may be delayed in this scenario. Conversely, it is impossible for a condition to exist such that Q ˙ c o n d > Q ˙ l a t since the condenser cannot remove more thermal energy than that which is used for vapour generation. These scenarios lead to the establishment of a new parameter termed the conversion efficiency η c o n v as follows,
η c o n v = Q ˙ c o n d Q ˙ l a t × 100
it is important that cooling water flow through the condenser is closely matched to the heat removal requirements. Excess flow of cooling water may have a cooling effect on the vessel and its contents. As a result, the saline water may reach thermal equilibrium before boiling conditions can be obtained. The thermal efficiency of the system will also be reduced due to the power requirement for pumping the excess cooling water.
The cooling capacity of the condenser coil can be obtained by considering the mass flow rate and sensible temperature rise of the cooling water under steady-state conditions. Here, C p , a v g is the average specific heat capacity of the cooling water at the inlet and outlet ports. The T c o n d , i n is the temperature of cooling water at the inlet and T c o n d , o u t is the temperature of the cooling water at the outlet of the condenser.
Q ˙ c o n d = m ˙ c o n d C p , a v g T c o n d , i n T c o n d , o u t
using Equations (10) and (11), ideal freshwater production over a specific time can be determined as follows,
m ˙ f w = 1 h f g t 1 t 2 Q ˙ l a t   dt = 1 h f g   t 1 t 2 Q ˙ h s Q ˙ s e n Q ˙ s w ,   l o s s dt

4.3. Heat Loss

To determine the overall heat transfer coefficient ( U ) from Equation (9), a test was performed to record the temperature decay of the water. Vacuum was first induced in the vessel to limit the saturation temperature of the water to a predefined upper limit. The heat source was set to supply 100 W. Once steady state conditions were achieved, the heat source was switched off and system was allowed to cool down. The temperature decay of the saline water was recorded until it reached ambient temperature as shown in Figure 6.
Referring to Equation (7), heat is delivered to the water consists of sensible and latent forms of thermal energy Q ˙ s e n and Q ˙ l a t , and heat loss through the system boundaries Q ˙ s w , l o s s . In the temperature decay test, the heat source is switched off and vapour generation ceases. Therefore, Equation (7) can be simplified and rearranged to the following.
U A s = m s w C p , a v g T s w T a m b d T w d t
here, d T w d t is the gradient of the temperature decay curve presented in Figure 6. By calculating the gradient at different points within the test temperature range, the rate of heat loss from the water per unit temperature difference can be estimated as per Table 2. For 100 W of heat supplied at the heater and a condenser mass flow rate of 0.05 kg/s, the average value of U A s was determined to be 0.47 W/K.

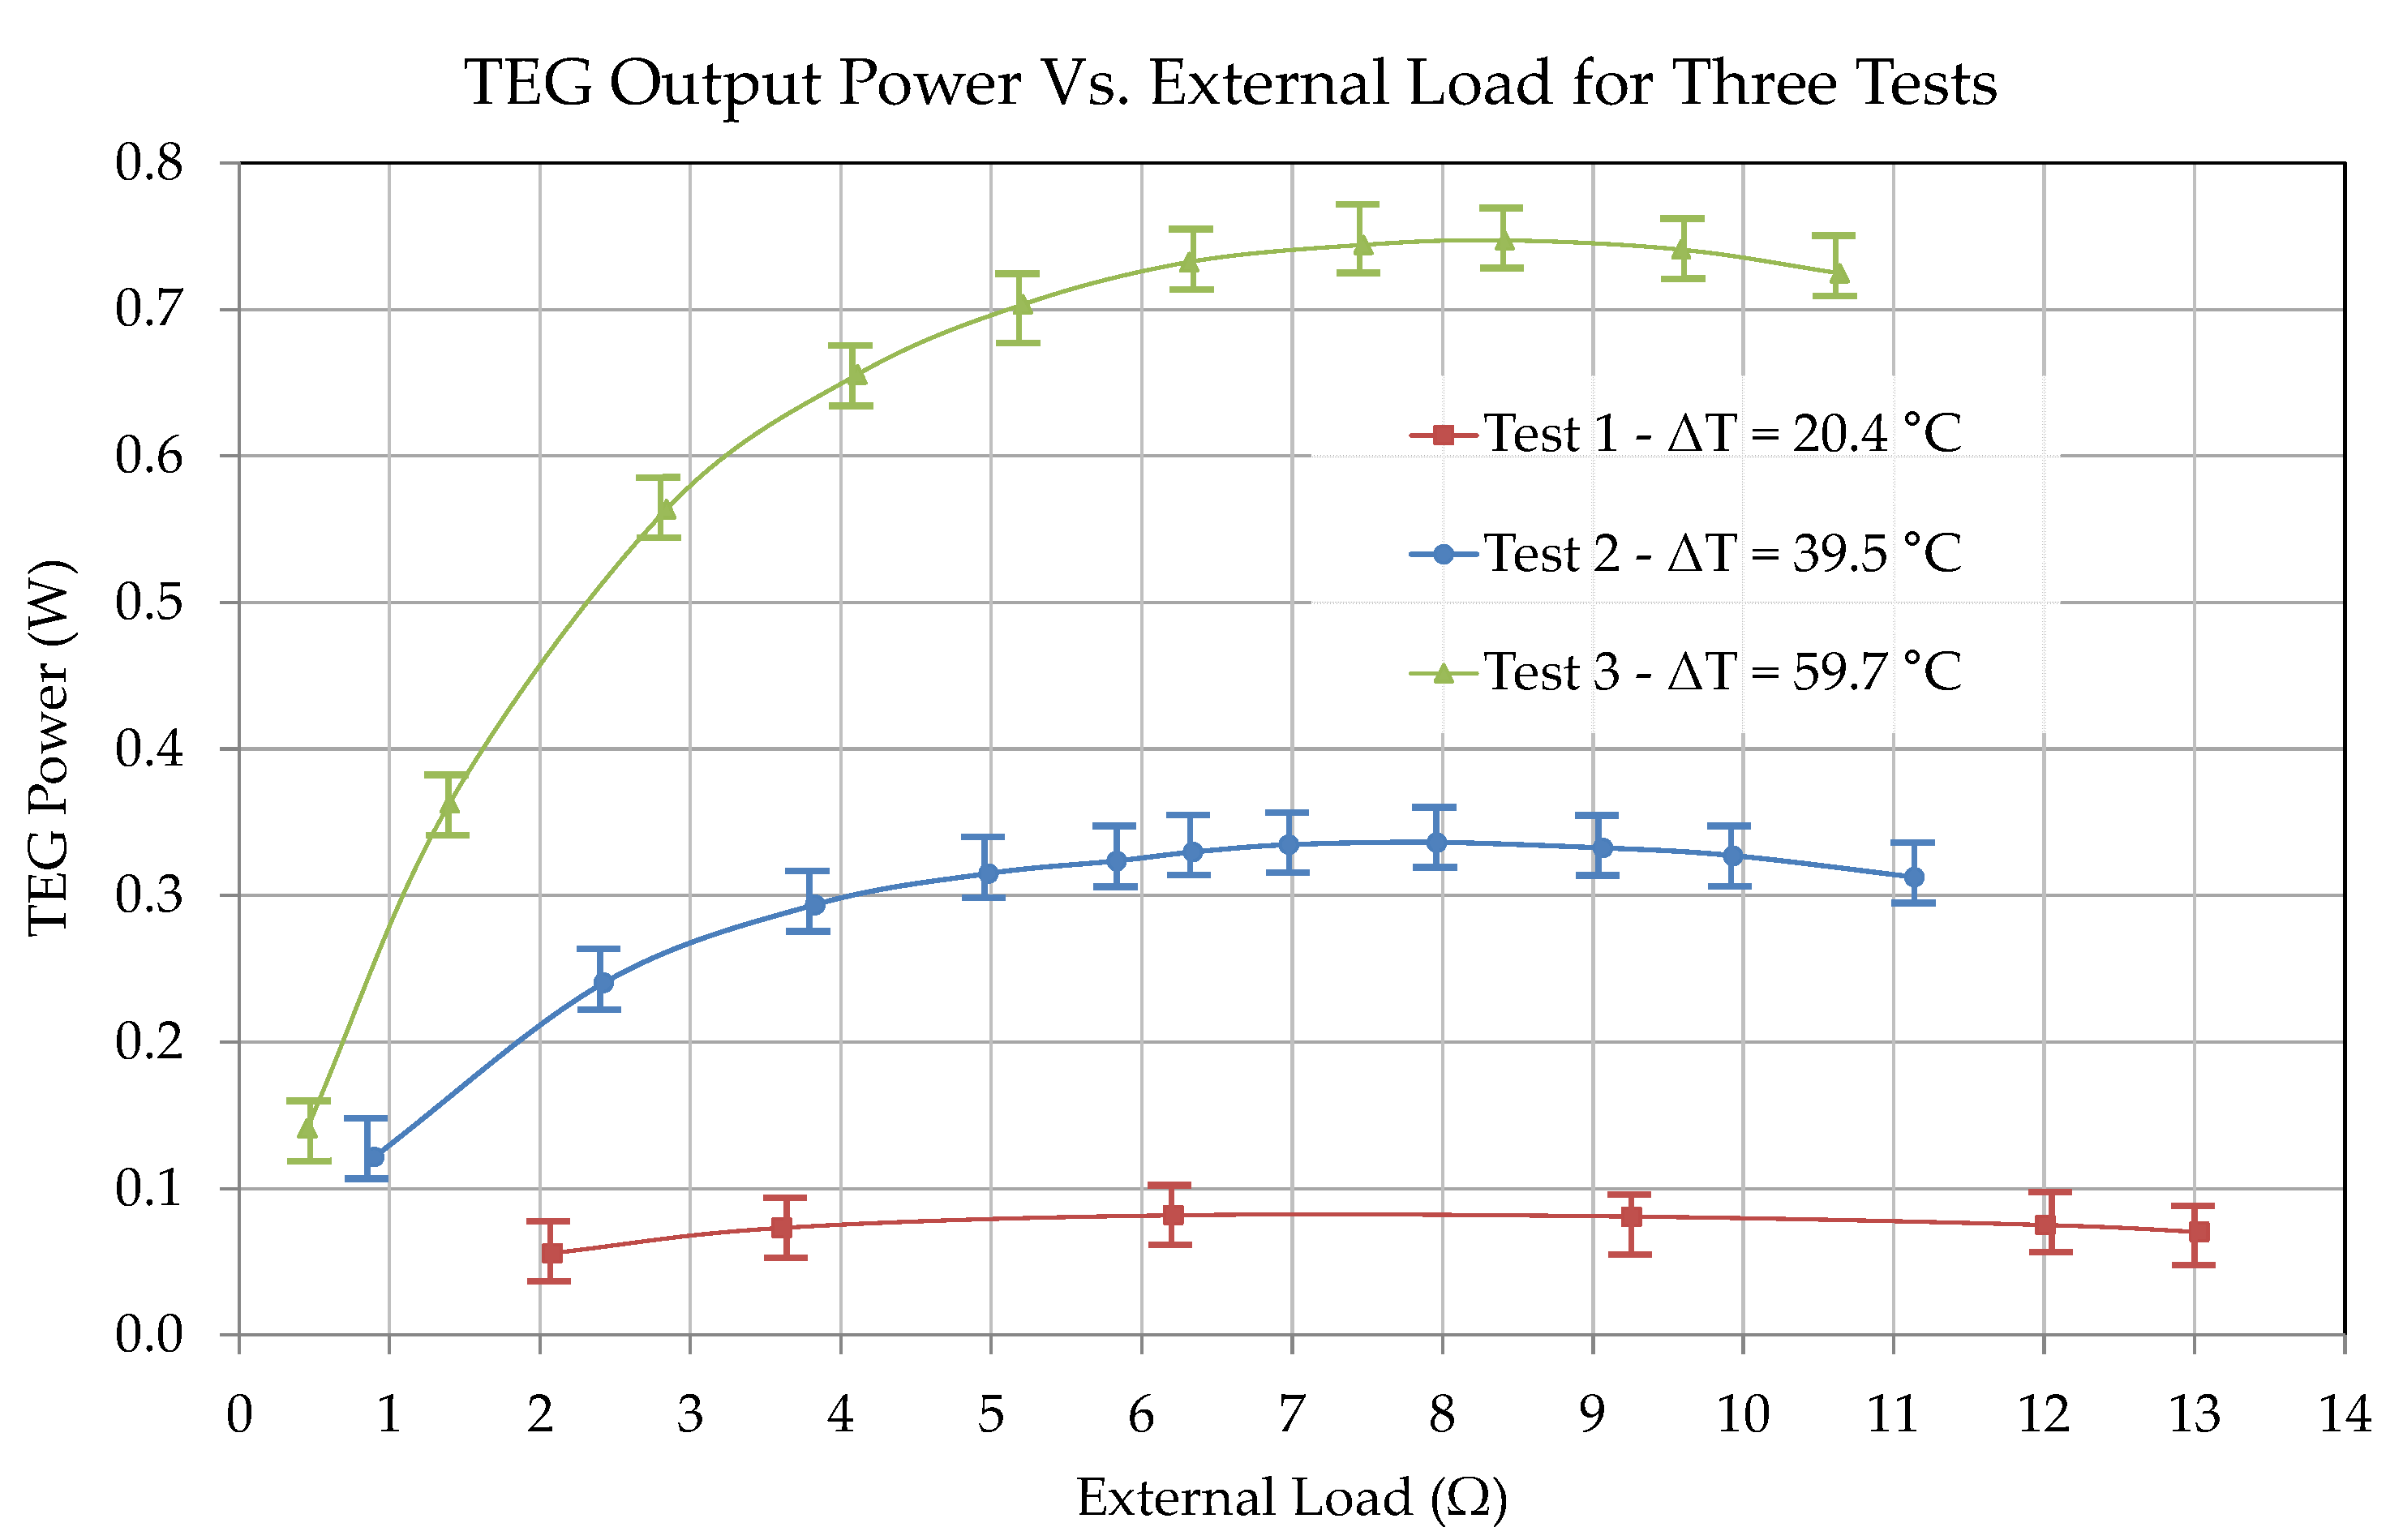
4.4. TEG Power Output

The output power of the TEG varies as the load resistance changes. This behaviour can be described by the maximum power transfer theorem which states that “Maximum power is transferred from a source to a load when the load resistance is of the same value as the internal resistance of the source” [26]. Hence, maximum output power W ˙ m a x from the TEG will occur when the external load resistance R l o a d equals the total internal resistance R T E G of the TEG.
W ˙ m a x   @   R l o a d = R T E G
Since the internal resistance of a TEG is dependent on the temperature difference across the hot and cold sides of the device, power output will change for different test conditions. Rheostat was used to provide optimal load resistance for peak power production at a set test temperature. By manually varying the load resistance, power output data can be obtained. The load resistance R l o a d is the sum of resistances of the wire wound resistor R 1 and the particular setting of the Rheostat R 2 .
R l o a d = R 1 + R 2
Current ( I ) flow through the circuit can be determined using the open circuit voltage V R 1 across resistor R 1 .
I = V R 1 R 1
The electrical power output of the TEG is the product of the TEG open circuit voltage V T E G and current flow through the circuit.
W ˙ o = V T E G × V R 1 R 1
The thermal efficiency of the proposed system can be expressed as the ratio of the net power output W ˙ n e t to heat flow across the devices Q ˙ h s , as per Equation (7). The power input to circulate the cooling water can be estimated as the product of volume flow rate of cooling heat transfer fluid and the pressure drop across the condenser coil.
η t h = W ˙ n e t Q ˙ h s = W ˙ o W ˙ i n _ c o o l i n g Q ˙ h s

5. Experimental Procedure

Artificial saline water with 1% salinity is used in place of natural brackish/sea water. Before each test, saline water to be introduced to the system is boiled in a kettle and then allowed to cool to room temperature. Pre-boiling releases non-condensable gases (NCGs) that would otherwise escape during testing and contribute to a significant increase in the vessel pressure and hence the cold side temperature of the TEG. Before the test begins the local atmospheric pressure is recorded from the Fortin barometer that is available in the lab. Once cooled to ambient temperature, the pre-boiled saline water is introduced to the evaporator side through the adjacent screw-cap. An initial mass of 500 g of saline water was determined adequate for a test duration of approximately two hours. Condenser is supplied with the cold water from a large tank, which is maintained at a constant temperature with help of a chiller. A vacuum pump is used to create the initial sub-atmospheric condition in the vacuum vessel. At vessel pressure is adjusted to achieve a pre-determined saturation temperature. For the present tests, the vacuum pressure is adjusted to around 5 kPa absolute. The Rheostat slider is gradually moved between its lower and upper limits to vary the load resistance in the TEG circuit. The temperatures, pressure, flow rates and power output from TEG is recorded from start to the end of the test. The system temperature is monitored to determine the status of the experiment. The system is allowed to reach steady state operation and then the system is allowed to operate for around 45 min at steady state. At the end of the test, the system is allowed to cool to ambient temperature before releasing the vacuum and drawing off the water that has accumulated on the condenser side. By allowing the system to cool, all vapour and water droplets can be captured. The drained water is then weighed on a set of laboratory scales to determine the freshwater production.

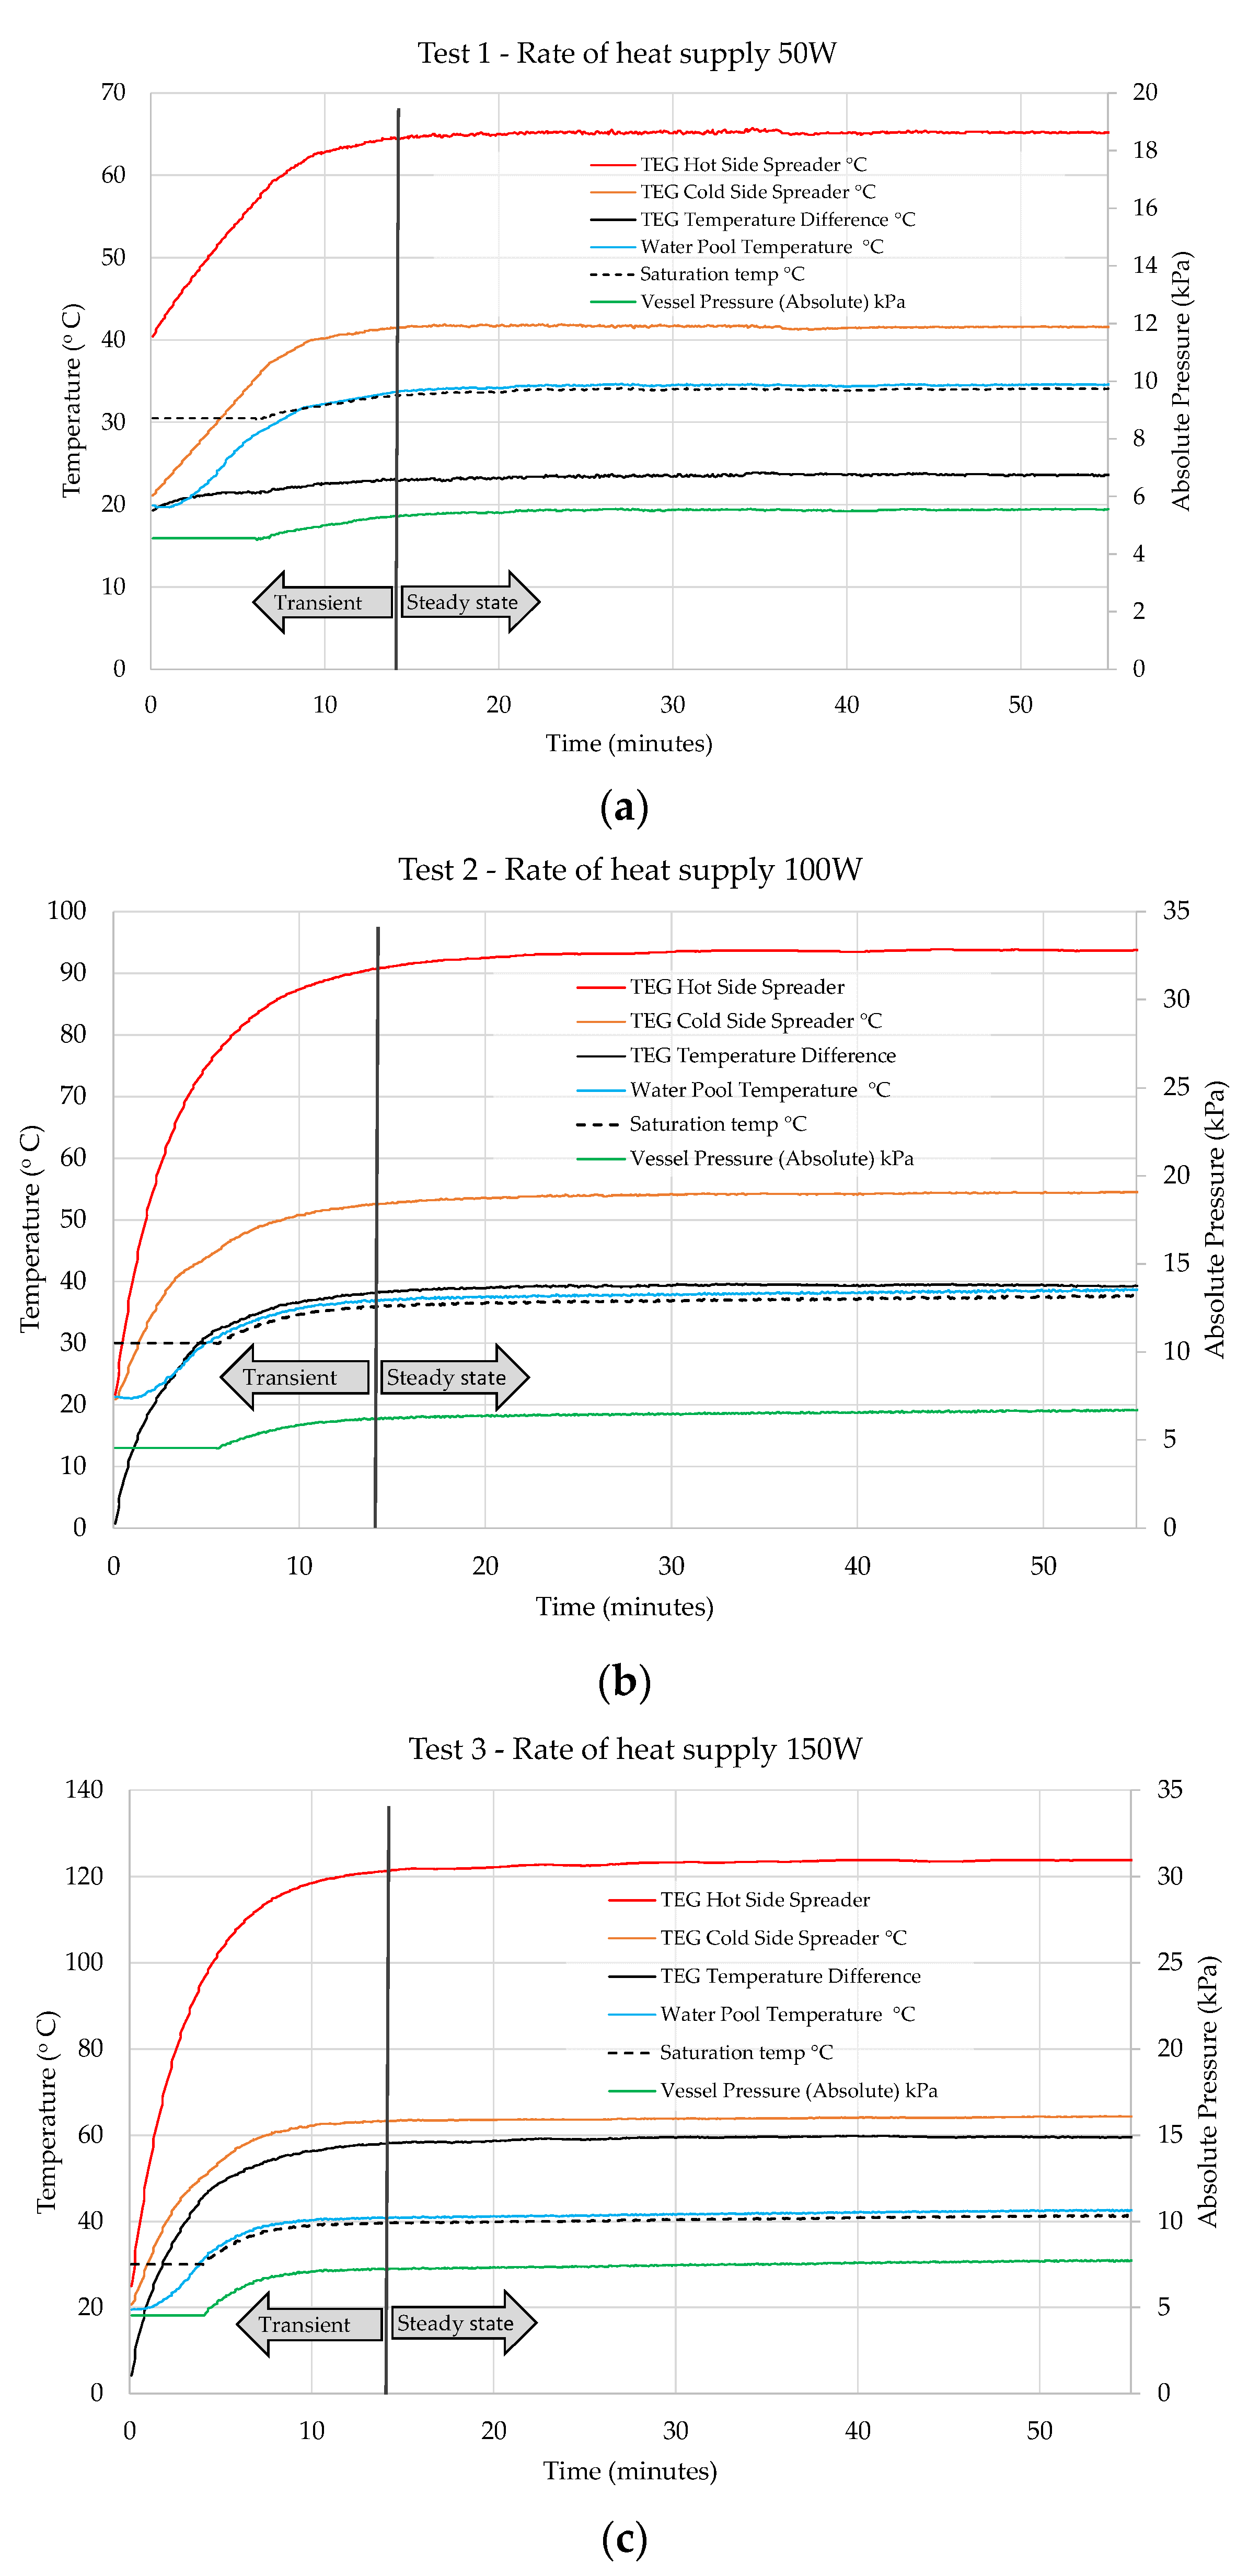
6. Results and Discussion

Three tests were conducted indoors between the dates of 10th and 24th August under the climatic conditions of Melbourne, Australia. Heat input by the heater, Q ˙ h e a t e r was the main distinguishing variable between the three tests. A comparison of test conditions with theoretical and actual freshwater output is provided in Table 3.
Experimental test conditions were used as a basis for predicting the freshwater output using the theoretical model presented in Section 4. Theoretical results over-predict freshwater production for the first test by 21% and for the second test by 7%. For the third test, the theoretical results under-predict freshwater output by 2%. The experimental freshwater mass flux is estimated by dividing the experimental freshwater output by TEG surface area (80 mm × 80 mm) and test duration and converting the units to kg/m2⋅h. The present design only allows for a batch process operation. This means that the feedwater cannot be allowed to reach salt saturation conditions as this would lead to salt precipitation on the upper surface of the upper heat spreader and inner surface of the vessel. Salt deposits will add thermal resistance to heat flow leading to decrease in the temperature difference across TEGs. For the three tests the 500 g of feed water with 1% salinity was used and the maximum freshwater output observed for test 3 was 303 g which limited the salinity rise of the feedwater to around 2.5%, which is well below the salt saturation.
In Figure 7, pressure and temperature data have been plotted for the three tests. The saturation temperature has been modelled using the Antoine equation [27], in conjunction with data collected from the pressure sensor. The upper heat spreader’s top surface temperature increases but there is a delay in water heating and vapour generation. The heat spreaders, TEG and saline water are initially within a temperature range of 19 to 23 °C. The thermal inertia of the water and vessel, delays vapour generation for approximately 5 min, after this the vessel pressure starts to rise.
Under ideal conditions, Equation (13) would be satisfied, and vessel pressure would remain constant. However, vessel pressure was observed to rise between 2.3 and 5.5% for each of the three tests. In Figure 7, the initial rise in vessel pressure coincides with an increase in the water temperature to saturation temperature. Given that no leaks were detected, and the water was pre-boiled to prevent release of NCGs, this can be attributed to combined effect of thermal expansion of air inside the vessel and any imbalance in the vapour generation and vapour condensation. The vessel pressure and temperatures proportionally increase, rising saturation temperature. The water temperature is almost equal to the saturation temperature, and the excess temperature difference between the cold side spreader and the saturation temperature is between 8 to 24 °C, which is enough for natural convection boiling in the case of test 1 and nucleate boiling in the case of test 2 and 3 [28]. Although the exact regime of pool boiling cannot be determined with the present experimental data, it is very clear from the data that vapour is generated from the saline feedwater. Due to the sub-atmospheric conditions and the column of saline water the saline water that is in contact with the cold side heat spreader (upper spreader) will have higher vapour pressure (saturation pressure) and hence the boiling regime could be subcooled boiling [29]. The subcooled boiling happens when the localised saturation temperature is higher than the bulk saline water temperature. From Figure 7, T e x c e s s for the three tests can be estimated to range between 8 to 24 °C during steady-state operation. The cold side spreader temperature T h s , u p is significantly higher than the saturation temperature, while the water pool temperature is almost equal to the saturation temperature hence pool boiling is taking place. This design of the condenser is critical for maintaining the vessel pressure, an alternative method to condenser cooling coil will be direct contact condensation. Condenser coil can be replaced by spray of cold freshwater where water vapour will directly condense in the cold-water droplets. This will enhance the heat and mass transfer and maintain the temperature.
Based on the measured temperature and the rate of thermal energy supply and using the theoretical model, heat flow balance diagram has been developed. Figure 8 shows the energy balance for test 2, here sensible heat loss is observed in the first three minutes of testing while the water and upper heat spreader temperatures equalize. This transition between heat loss and heat gain results in a momentary adjustment of the rate of latent heating at the 8 min mark. Sensible heating increases to a peak value of 32 W. Latent heating then becomes the dominant effect and vapour generation increases rapidly. This behaviour is reflected in Figure 7 as the initial rapid increase in vessel pressure. Sensible heating decays from its peak value but is unable to approach an ideal minimum of zero due to the inherited heat loss from the vessel walls which demands constant heating of saline water to maintain it at saturation temperature, this causes tiny fluctuations in the temperature of the water.
The Q ˙ c o n d curve in Figure 8 indicates that some heat is lost from the condenser in the first 10 min but, this is not the case. Temperature measurements used in the calculation of Q ˙ c o n d were taken on the external surface of brass hose fittings used for the condenser inlet and outlet ports. It takes some time before the hose fitting and condenser water temperatures equalise.
By comparing the condenser heat removal rate Q ˙ c o n d to the rate of latent heating of the water Q ˙ l a t in Figure 8 and Table 4, it can be seen that the cooling capacity of the condenser is not enough to condense all the vapour that is generated, this is also indicated by the rise in the vessel pressure. However, the conversion efficiency increases with an increase in the rate of heat supply. This trend is reflected in the results for theoretical and actual freshwater output presented in Table 3. As condenser efficiency increases, more vapour is condensed into fresh water and the experimental conditions are in closer agreement with the theoretical model.
In Figure 9, TEG Power curves have been plotted using V T E G and V R 1 voltage data, in conjunction with Equation (21). The third test generated a maximum power output of 0.75 W for 150 W of heat input and T T E G of 59.5 °C. As per Equation (18), the optimal external load R l o a d , for maximum power output P m a x , ranges between 7.3 and 8.2 Ω. As per Equation (22), this equates to a thermal efficiency of 0.6% which is low compared to tests done on similar devices [30,31,32]. Factors affecting TEG performance in this experimental setup include the location of thermocouples with respect to the TEG top and bottom faces, the thermal contact condition between the TEG and heat spreaders, and the distribution of heat in the lower heat spreader. The experimental prototype has four TEG, with each TEG size of 40 mm × 40 mm arranged in an 80 mm × 80 mm area. So, using the peak power generation and the total TEG surface area of 0.08 m × 0.08 m (i.e., 0.0064 m2), the present system is capable of generating a power flux between 12 to 117 W/m2 of the thermoelectric generator area.
As a percentage of heater power, heat across the TEG is 85% for the first test, 83% for the second test and 84% for the third test. By rearranging Equation (6), it can be seen that losses from the heat spreaders Q ˙ h s , l o s s account for just 16% of heat supplied by the heater for all three tests. The hot-side temperatures of the TEG were around 64 °C for the first test, 94 °C for the second test and 122 °C for the third test. Some typical sources of low-grade industrial waste heat in this temperature range include exhaust gasses from gas fired boilers, process steam condensate, and cooling water from internal combustion engines [10].

7. Conclusions

A novel system has been presented that can generate electricity and produce fresh water in the presence of a low-grade heat source. The system has been designed, manufactured, assembled, and tested. Theoretical analysis has discussed governing equations and mathematical modelling has been undertaken to determine the flow of heat through the system and freshwater output. Experimental results indicate the water has received around 70% of the total rate of thermal energy supplied by the heater and boiling has occurred for most of the test. A relationship has been identified between condenser flow rate and freshwater output for three tests with heat inputs. Thermal inertia of the system has been lowered as evidenced by reduced transient start-up time. NCGs release has been minimized and vacuum has been maintained for the duration of the test. These conditions are conducive to maximising TEG power generation and freshwater output for given heat input. The performance of the proposed simultaneous power generation and water desalination system increased as the rate of thermal energy input increased. At 50 W heat input the system produced the lowest power flux of 12 W/m2 and lowest freshwater mass flux of 4.8 kg/m2⋅h, while the specific thermal energy consumption was the highest at 5.7 MJ/kg of freshwater generation. On the contrary at 150 W heat input the system produced the highest power flux of 117 W/m2 and highest freshwater mass flux of 23.7 kg/m2⋅h, while the specific thermal energy consumption for this condition was lowest at 3.6 MJ/kg of freshwater generation. This shows the performance of such system will further improve with the scale. It is recommended to conduct an experimental investigation on a large-scale system with 1.5 to 15 kW thermal energy input.

Author Contributions

Conceptualization, A.D.; Data curation, A.D.; Formal analysis, A.D.; Investigation, A.D.; Methodology, A.D.; Writing—original draft, A.D., and H.K.; Supervision, H.K., Writing—review and editing, A.D., O.T., M.W., E.R., E.H. and H.K. All authors have read and agreed to the published version of the manuscript.

Funding

This research received no external funding.

Institutional Review Board Statement

Not applicable.

Informed Consent Statement

Not applicable.

Data Availability Statement

Data can be made available on request by sending email to the corresponding authors.

Conflicts of Interest

The authors declare no conflict of interest.

References

  1. van Vliet, M.T.; Jones, E.R.; Flörke, M.; Franssen, W.H.; Hanasaki, N.; Wada, Y.; Yearsley, J.R. Global water scarcity including surface water quality and expansions of clean water technologies. Environ. Res. Lett. 2021, 16, 24020. [Google Scholar] [CrossRef]
  2. Turiel, A. The Energy Crisis in the World Today: Analysis of the World Energy Outlook 2021; International Energy Agency: Paris, France, 2022; Volume 1, pp. 1–21. [Google Scholar]
  3. IEA. World Energy Outlook 2021; OECD Publishing: Paris, France, 2021; pp. 1–386. [Google Scholar]
  4. Karagiannis, I.C.; Soldatos, P.G. Water desalination cost literature: Review and assessment. Desalination 2008, 223, 448–456. [Google Scholar] [CrossRef]
  5. Elimelech, M.; Phillip, W.A. The future of seawater desalination: Energy, technology, and the environment. Science 2011, 333, 712–717. [Google Scholar] [CrossRef] [PubMed]
  6. Lior, N. Advances in Water Desalination; John Wiley & Sons, Inc.: Hoboken, NJ, USA, 2013; pp. 1–712. [Google Scholar]
  7. Khawaji, A.D.; Kutubkhanah, I.K.; Wie, J.-M. Advances in seawater desalination technologies. Desalination 2008, 221, 47–69. [Google Scholar] [CrossRef]
  8. Stijepovic, M.Z.; Linke, P. Optimal waste heat recovery and reuse in industrial zones. Energy 2011, 36, 4019–4031. [Google Scholar]
  9. Brito, F.P.; Peixoto, J.S.; Martins, J.; Gonçalves, A.P.; Louca, L.; Vlachos, N.; Kyratsi, T. Analysis and Design of a Silicide-Tetrahedrite Thermoelectric Generator Concept Suitable for Large-Scale Industrial Waste Heat Recovery. Energies 2021, 14, 5655. [Google Scholar] [CrossRef]
  10. Khayyam, H. Automation, Control and Energy Efficiency in Complex Systems; MDPI Books: Basel, Switzerland, 2020. [Google Scholar]
  11. Gude, V.G. Energy storage for desalination processes powered by renewable energy and waste heat sources. Appl. Energy 2015, 137, 877–898. [Google Scholar] [CrossRef]
  12. Duke, M. Industrial waste heat powers desalination. Membr. Technol. 2012, 5, 9. [Google Scholar] [CrossRef]
  13. Asgharnejad, H.; Khorshidi Nazloo, E.; Madani Larijani, M.; Hajinajaf, N.; Rashidi, H. Comprehensive review of water management and wastewater treatment in food processing industries in the framework of water-food-environment nexus. Compr. Rev. Food Sci. Food Saf. 2021, 20, 4779–4815. [Google Scholar] [CrossRef]
  14. Bell, L.E. Cooling, heating, generating power, and recovering waste heat with thermoelectric systems. Science 2008, 321, 1457–1461. [Google Scholar] [CrossRef] [PubMed] [Green Version]
  15. Jaziri, N.; Boughamoura, A.; Müller, J.; Mezghani, B.; Tounsi, F.; Ismail, M. A comprehensive review of Thermoelectric Generators: Technologies and common applications. Energy Rep. 2020, 6, 264–287. [Google Scholar] [CrossRef]
  16. Bhathal Singh, B.S. Power Generation from Solar Pond Using Thermoelectric Generators. Ph.D. Thesis, RMIT University, Melbourne, Australia, 21 June 2015. [Google Scholar]
  17. Gude, V.G.; Nirmalakhandan, N. Desalination at low temperatures and low pressures. Desalination 2009, 244, 239–247. [Google Scholar] [CrossRef]
  18. Kumar, R.S.; Mani, A.; Kumaraswamy, S. Analysis of a jet-pump-assisted vacuum desalination system using power plant waste heat. Desalination 2005, 179, 345–354. [Google Scholar] [CrossRef]
  19. Tay, J.H.; Low, S.C.; Jeyaseelan, S. Vacuum desalination for water purification using waste heat. Desalination 1996, 106, 131–135. [Google Scholar] [CrossRef]
  20. Moharram, N.A.; Bayoumi, S.; Hanafy, A.A.; El-Maghlany, W.M. Hybrid desalination and power generation plant utilizing multi-stage flash and reverse osmosis driven by parabolic trough collectors. Case Stud. Therm. Eng. 2021, 23, 100807. [Google Scholar] [CrossRef]
  21. Ghaffar, A.; Imran, Q.; Hassan, M.; Usman, M.; Khan, M.U. Simultaneous solar water desalination and energy generation by high efficient graphene oxide-melanin photothermal membrane. J. Environ. Chem. Eng. 2022, 10, 108424. [Google Scholar] [CrossRef]
  22. Ng, K.C.; Burhan, M.; Chen, Q.; Ybyraiymkul, D.; Akhtar, F.H.; Kumja, M.; Shahzad, M.W. A thermodynamic platform for evaluating the energy efficiency of combined power generation and desalination plants. Npj Clean Water 2021, 4, 25. [Google Scholar] [CrossRef]
  23. Date, A.; Gauci, L.; Chan, R.; Date, A. Performance review of a novel combined thermoelectric power generation and water desalination system. Renew. Energy 2015, 83, 256–269. [Google Scholar] [CrossRef]
  24. Berenson, P.J. Experiments on pool-boiling heat transfer. Int. J. Heat Mass Transf. 1962, 5, 985–999. [Google Scholar] [CrossRef]
  25. Date, A.; Date, A.; Dixon, C.; Akbarzadeh, A. Theoretical and experimental study on heat pipe cooled thermoelectric generators with water heating using concentrated solar thermal energy. Sol. Energy 2014, 105, 656–668. [Google Scholar] [CrossRef]
  26. Robertson, C.R. Further Electrical and Electronic Principles, 3rd ed.; Taylor & Francis Group: Hoboken, NJ, USA, 2010; pp. 1–280. [Google Scholar]
  27. Wisniak, J. Historical development of the vapor pressure equation from dalton to antoine. J. Phase Equilibria 2001, 22, 622–630. [Google Scholar] [CrossRef]
  28. Çengel, Y.A.; Ghajar, A.J.; Kanoglu, M. Heat and Mass Transfer Fundamentals and Applications, 4th ed.; McGraw-Hill Education: New York, NY, USA, 2011; pp. 1–924. [Google Scholar]
  29. Zajaczkowski, B.; Halon, T.; Krolicki, Z. Experimental verification of heat transfer coefficient for nucleate boiling at sub-atmospheric pressure and small heat fluxes. Heat Mass Transf. 2016, 52, 205–215. [Google Scholar] [CrossRef]
  30. Rowe, D.M.; Min, G. Evaluation of thermoelectric modules for power generation. J. Power Sources 1998, 73, 193–198. [Google Scholar] [CrossRef]
  31. Faraji, A.; Akbarzadeh, A. Design of a Compact, Portable Test System for Thermoelectric Power Generator Modules. J. Electron. Mater. 2013, 42, 1535–1541. [Google Scholar] [CrossRef]
  32. Carmo, J.P.; Antunes, J.; Silva, M.F.; Ribeiro, J.F.; Goncalves, L.M.; Correia, J.H. Characterization of thermoelectric generators by measuring the load-dependence behavior. Measurement 2011, 44, 2194–2199. [Google Scholar] [CrossRef]
Figure 1. Schematic of the proposed simultaneous power generation and water desalination system.
Sustainability 14 14039 g001
Figure 2. Pocket for TEG and thermocouple grooves on upper heat spreader.
Sustainability 14 14039 g002
Figure 3. Resistive load circuit used to obtain voltage readings V R 1 and V T E G .
Sustainability 14 14039 g003
Figure 4. Experimental setup of C-TED system.
Sustainability 14 14039 g004
Figure 5. Thermal resistance network of simultaneous power generation and water desalination system.
Sustainability 14 14039 g005
Figure 6. System temperature decay curve.
Sustainability 14 14039 g006
Figure 7. Plot of pressure and temperature data for the three tests, (a) shows results for 50 W test, (b) shows results for 100 W test, (c) shows results for 150 W test,.
Sustainability 14 14039 g007
Figure 8. Experimental results of heat flow through the system for the duration of the second test.
Sustainability 14 14039 g008
Figure 9. TEG Output power over the external load range for each of the three tests.
Sustainability 14 14039 g009
Table 1. Accuracies of instruments.
Device/SensorMeasured QuantityPotential Error
Digital Display ModuleAlternating Voltage/Current±0.1% of reading
Data LoggerTemperature±0.15% of reading +0.5 °C
Type-T ThermocoupleTemperatureGreater of 1.0 °C or 0.75%
Data LoggerDC Voltage±0.1% of reading + 2 digits
Pressure SensorPressure±0.15% Typical, ±0.25% maximum best straight line (BSL) definition
Table 2. Values of U A s with respect to water temperature T w .
Water   Temperature   T w   ( ° C ) U A s   ( W / K )
250.28
300.54
400.64
500.65
Table 3. Test conditions and freshwater output for first three tests.
ParameterTest 1Test 2Test 3
Heat power, Q ˙ h e a t e r (W)50100150
Test duration, t (min)118116120
Condenser flow rate, v ˙ c o n d (L/s)0.050.050.05
Vacuum pressure, P v a c (kPa)5.45.65.8
Theoretical freshwater output, m f w _ T h (g)77.8185.5297.5
Experimental freshwater output, m f w _ E x p (g)61.5173.3303.4
Experimental freshwater mass flux, (kg/m2·h)4.813.523.7
Experimental specific thermal energy consumption (MJ/kg)5.764.013.6
Salinity of the feed water (ppm)9000 to 10,000
Salinity of condensate—freshwater (ppm)5 to 10
Table 4. Comparison of condenser performance parameters (average values at steady state).
ParameterTest 1Test 2Test 3
Latent heating, Q ˙ l a t (W)2968102
Condenser heat removal, Q ˙ c o n d (W)103595
Conversion efficiency, η c o n v (%)345193
Publisher’s Note: MDPI stays neutral with regard to jurisdictional claims in published maps and institutional affiliations.

