
Evaluation of SWMM-LID Modeling Applicability Considering Regional Characteristics for Optimal Management of Non-Point Pollutant Sources

Abstract
:1. Introduction
2. Materials and Methods
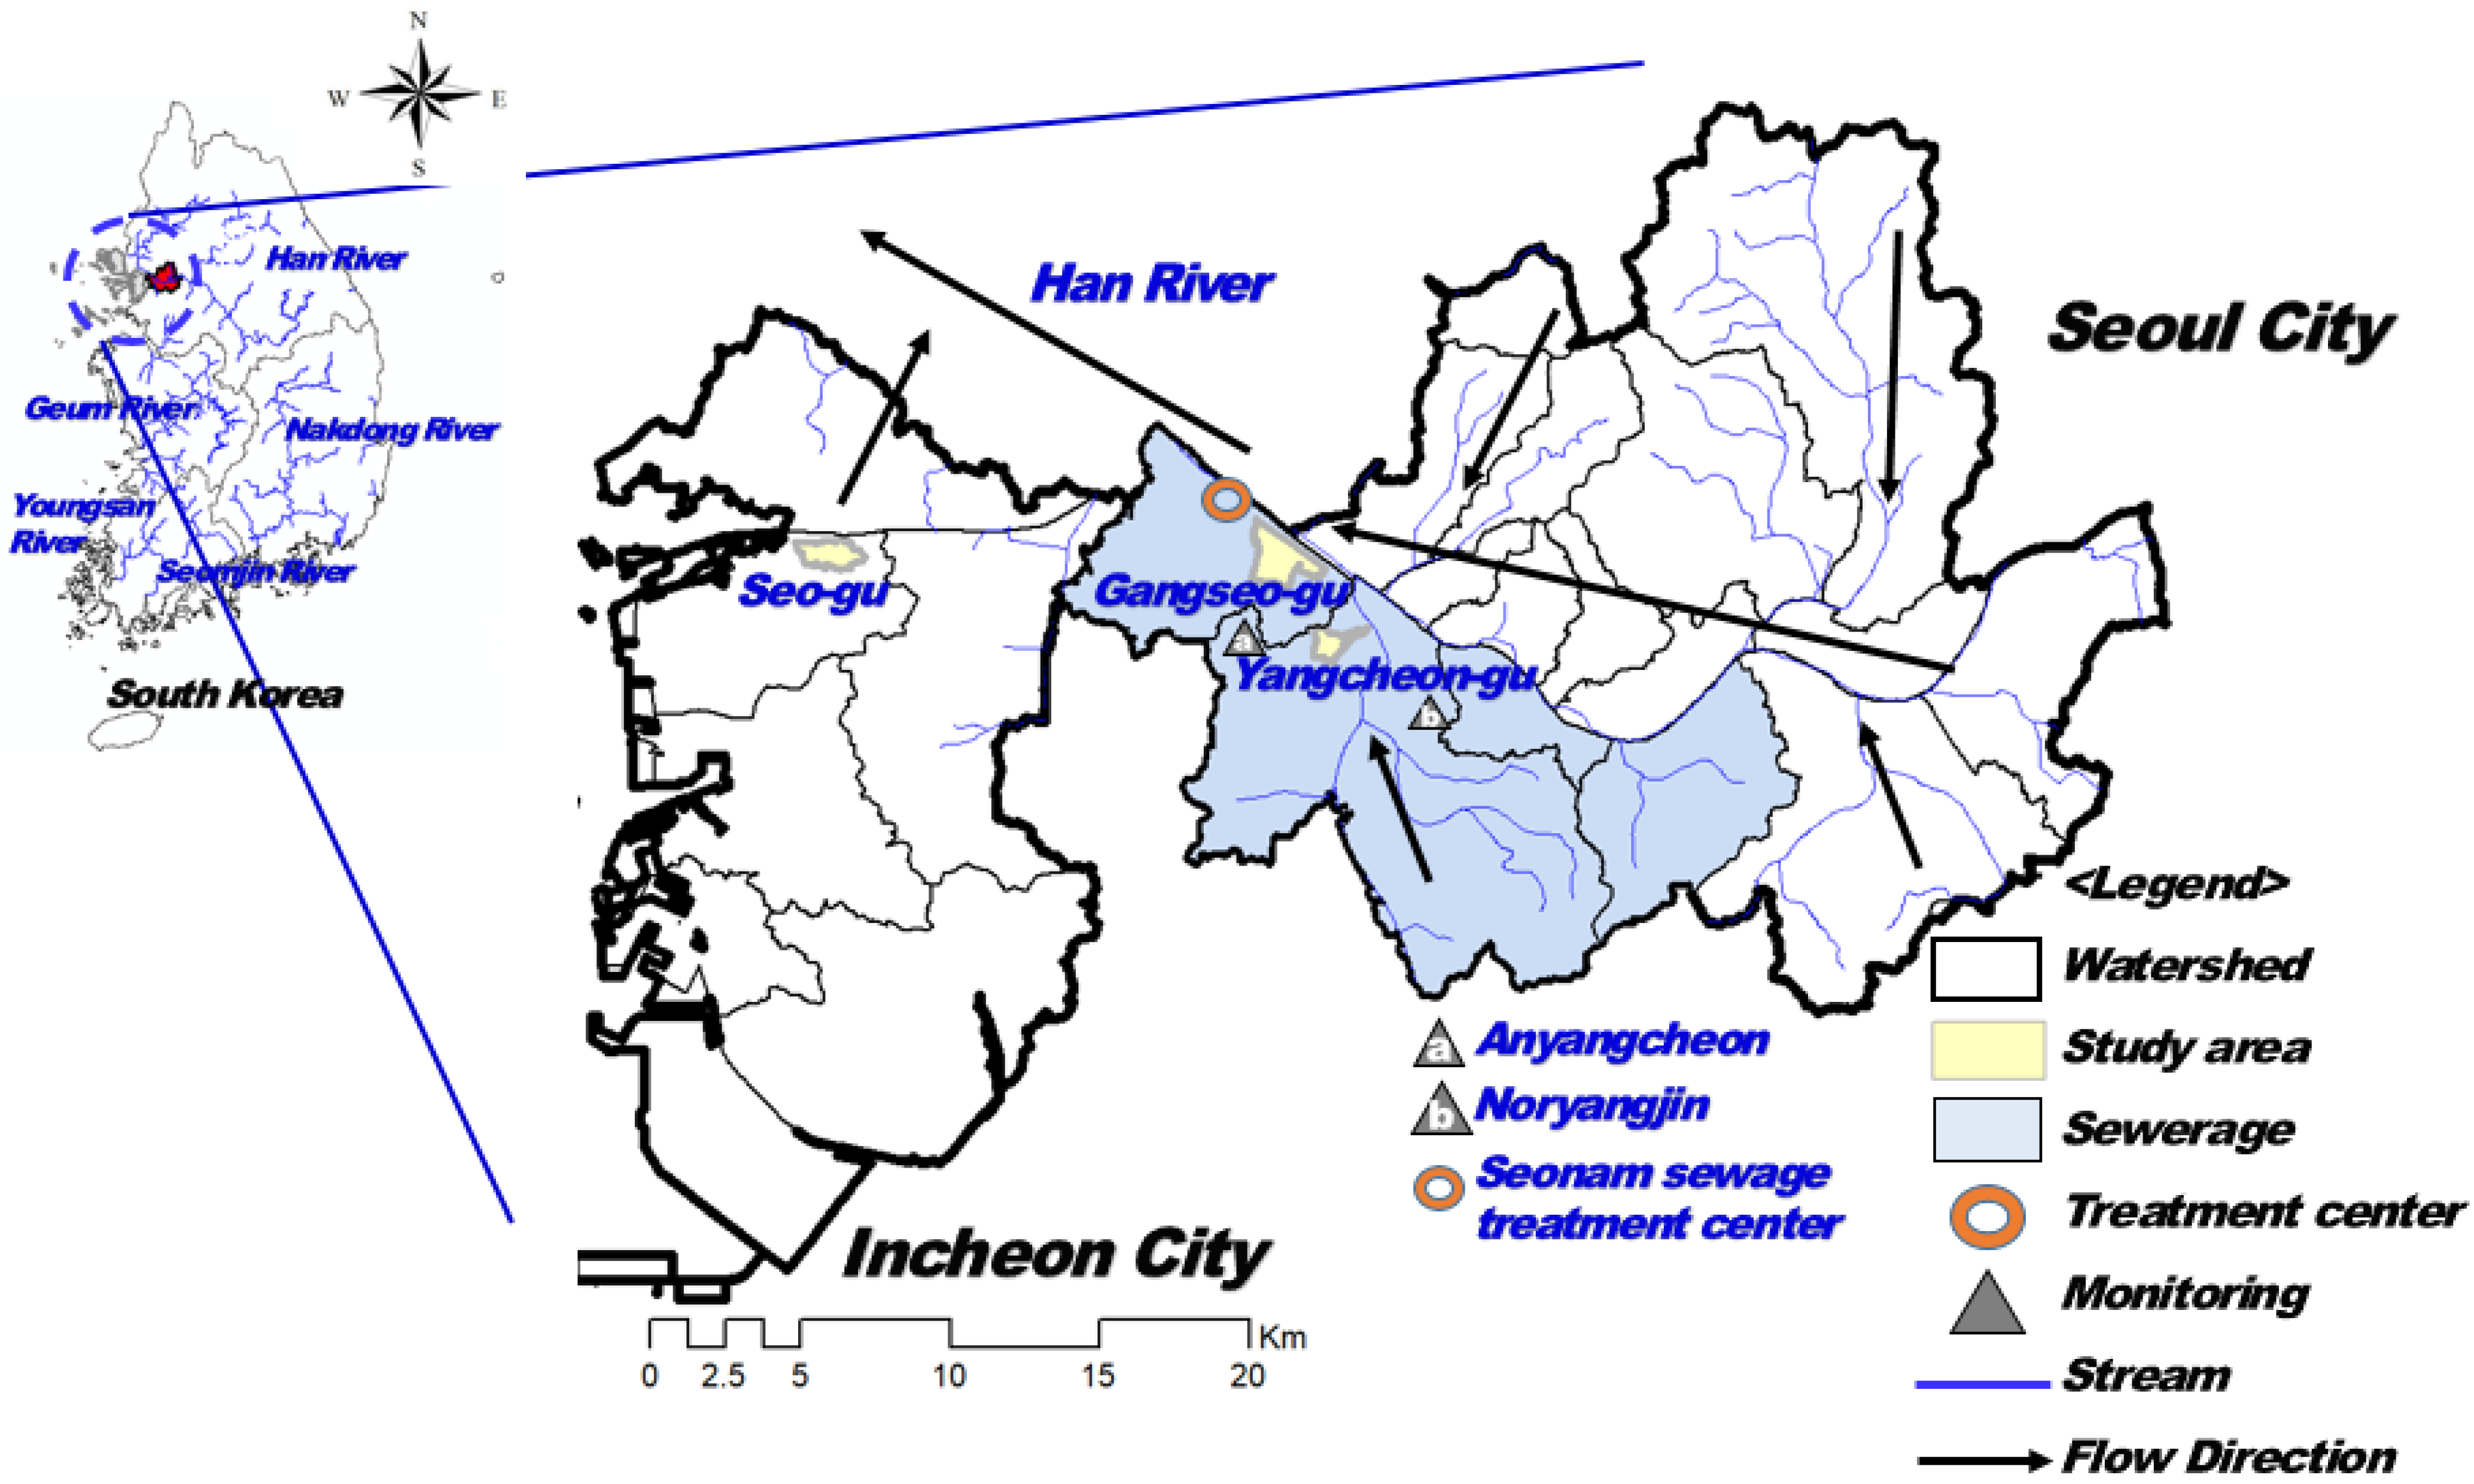
2.1. Study Area
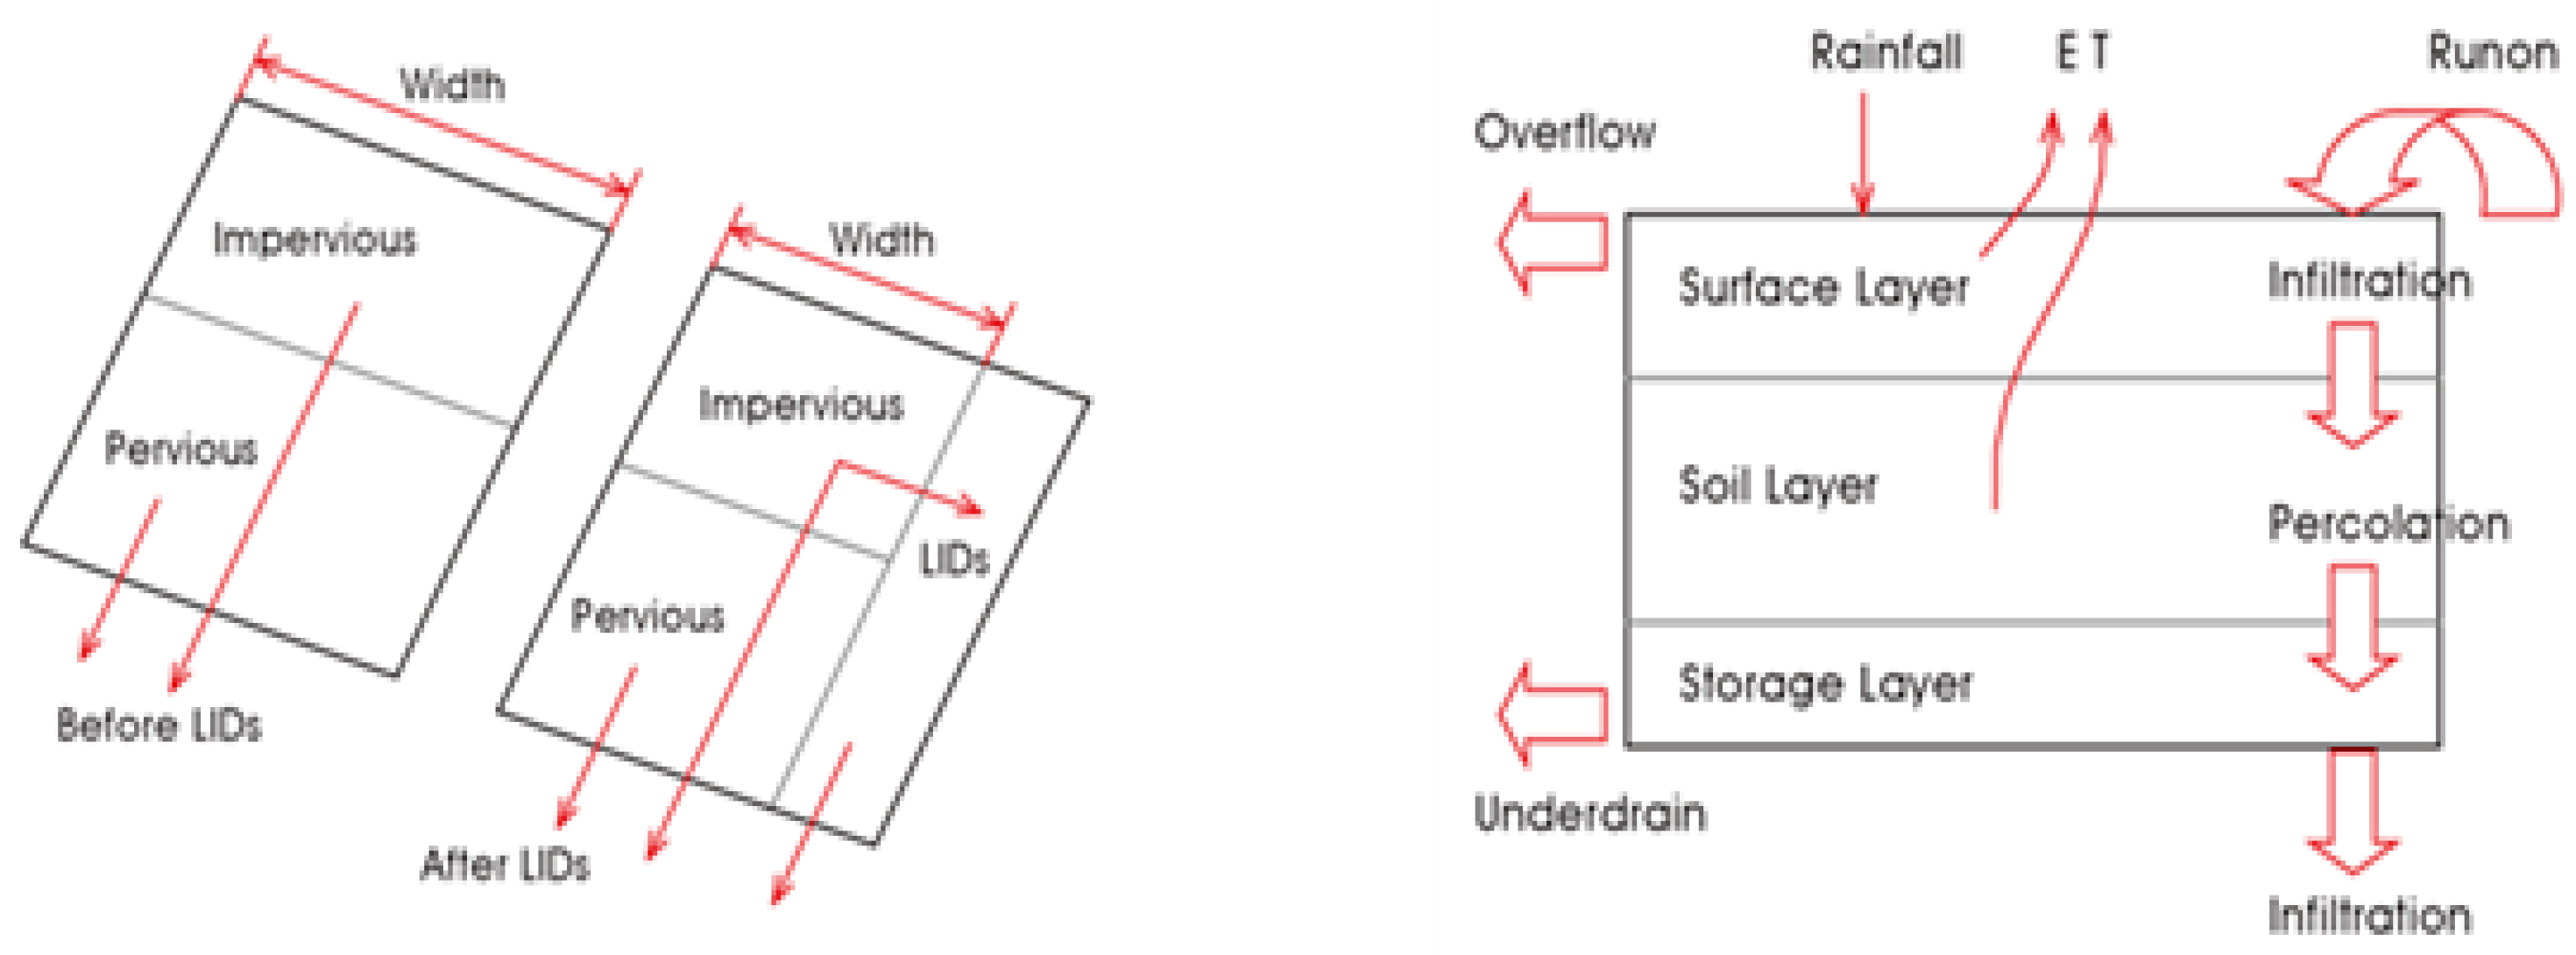
2.2. Selection of Models
2.3. Input Data for Construction of Outflow Path
2.4. Analysis of Flow and NPS Pollutatnt loads Change Sewer Characteristics
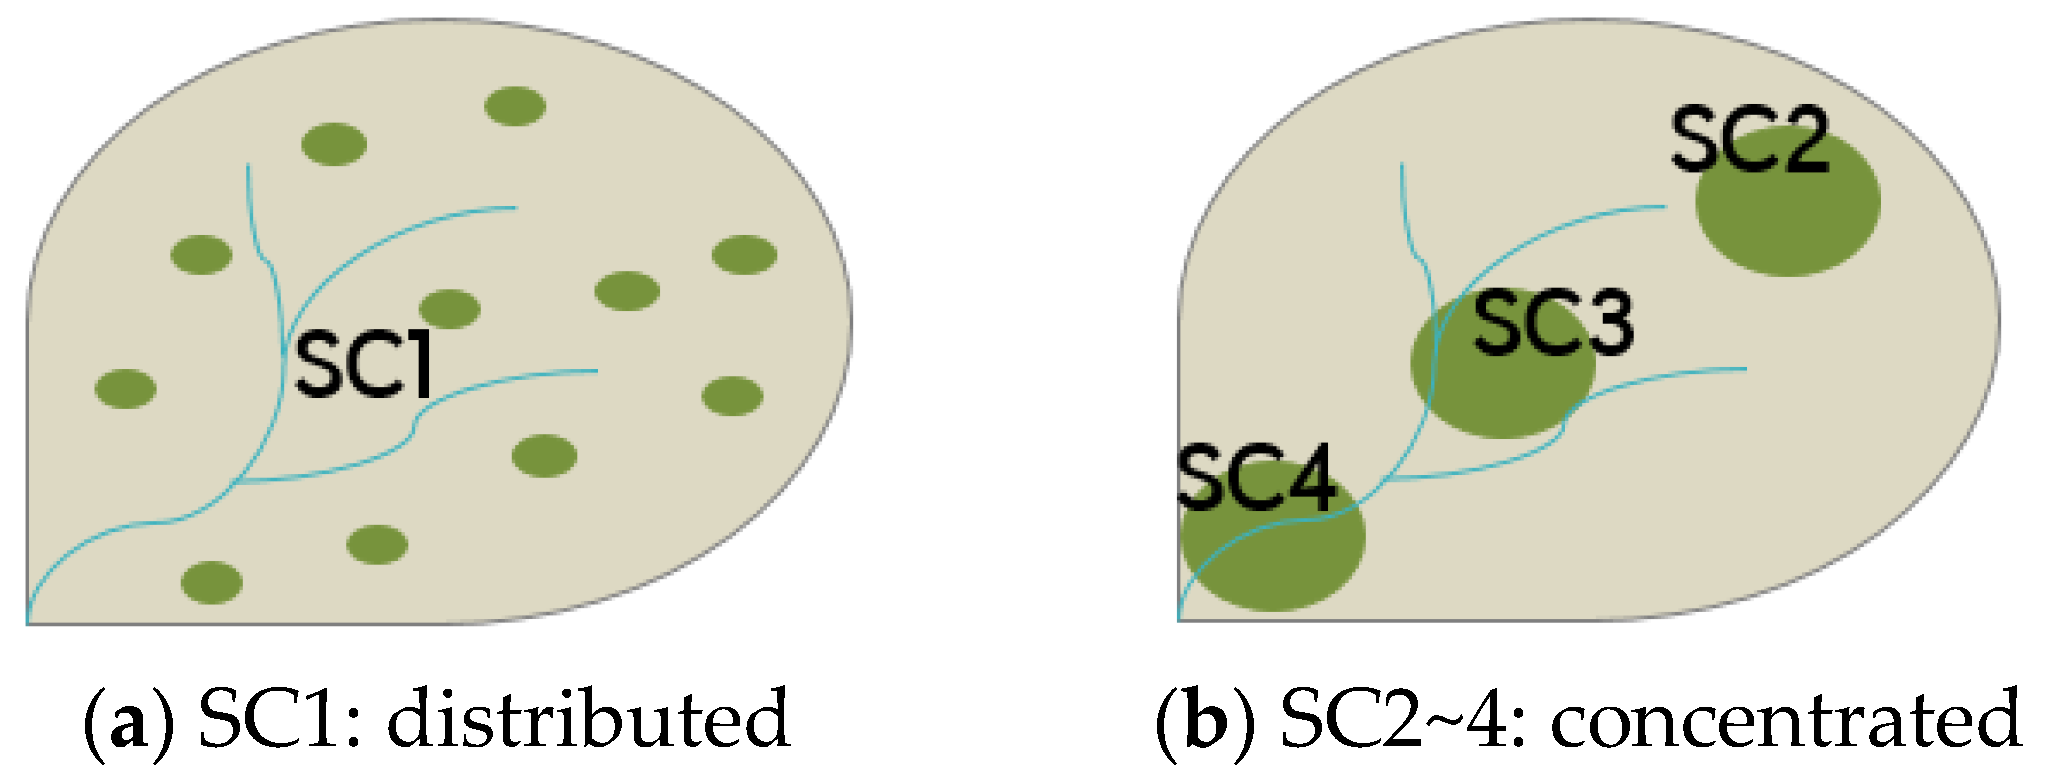
2.5. Construction of LID Scenarios to Achieve Water Circulation Goal
3. Results and Discussion
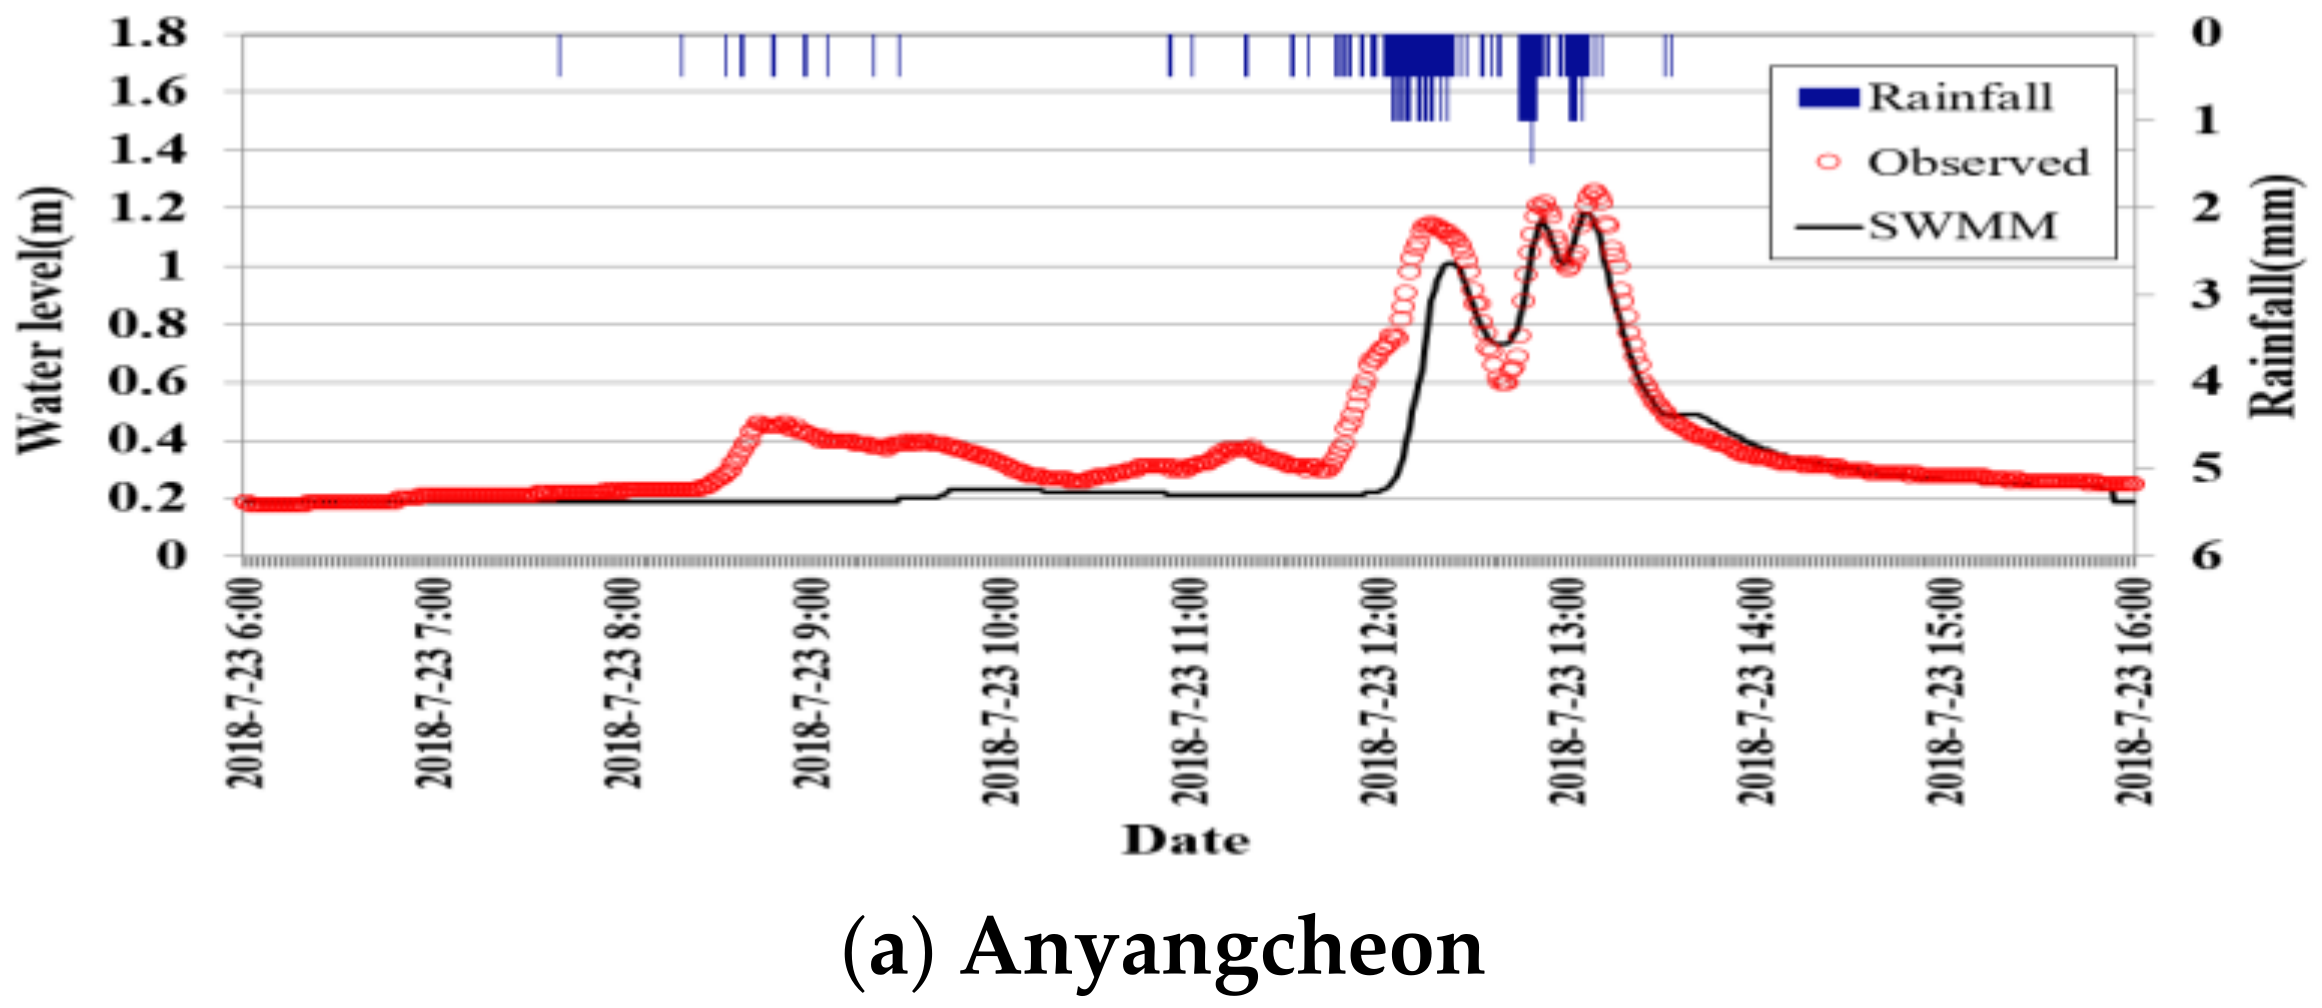
3.1. Results for Establishment of the Sewer Model
3.2. Analysis of Effluent Results by Regional Characteristics
3.3. Optimal Effects Analysis by Simulating LID Scenarios
4. Conclusions
Author Contributions
Funding
Institutional Review Board Statement
Informed Consent Statement
Data Availability Statement
Conflicts of Interest
References
- Lee, J.M.; Park, M.; Park, B.K.; Choi, J.; Kim, J.; Kim, K.; Kim, Y. Evaluation of water circulation by modeling: An example of nonpoint source management in the Yeongsan River watershed. Sustainability 2021, 13, 8871. [Google Scholar] [CrossRef]
- Sarma, A.K.; Singh, V.P.; Kartha, S.A.; Bhattacharjya, R.K. (Eds.) Urban Hydrology, Watershed Management and Socio-Economic Aspects; Springer: Berlin/Heidelberg, Germany, 2016. [Google Scholar]
- Kim, B.S.; Kim, J.M.; Kim, S.S.; Shin, G.W.; Lee, S.J. A study on the runoff reduction according to the calculation method of the LID scale considering the land use area and the application of stormwater storage basin. J. Civ. Environ. Eng. Res. 2021, 41, 229–235. [Google Scholar]
- National Institute of Environmental Research (NIER). Customized Policy Support for Nonpoint Pollution Management and Water Circulation Improvement(Ⅲ); National Institute of Environmental Research: Incheon, Korea, 2018. [Google Scholar]
- Lee, J.M.; Ryu, J.; Choi, J.; Park, J.H.; Kim, J.; Shin, D.S.; Lee, J. Predicting the effect of impervious area change on water circulation rate in the Geum River watershed using HSPF modeling. Desalin. Water Treat. 2020, 200, 337–350. [Google Scholar] [CrossRef]
- National Institute of Environmental Research (NIER). Customized Policy Support for Nonpoint Pollution Management and Water Circulation Improvement(V); National Institute of Environmental Research: Incheon, Korea, 2020. [Google Scholar]
- National Institute of Environmental Research (NIER). Policy Support Research for Non-Point Pollution Management and Water Circulation Improvement (Ⅵ); National Institute of Environmental Research: Incheon, Korea, 2021. [Google Scholar]
- Qin, H.P.; Li, Z.X.; Fu, G. The effects of low impact development on urban flooding under different rainfall characteristics. J. Environ. Manag. 2013, 129, 577–585. [Google Scholar] [CrossRef] [PubMed] [Green Version]
- Luan, Q.; Fu, X.; Song, C.; Wang, H.; Liu, J.; Wang, Y. Runoff effect evaluation of LID through SWMM in Typical mountainous, low-lying urban areas: A case study in China. Water 2017, 9, 439. [Google Scholar] [CrossRef] [Green Version]
- Bai, Y.; Zhao, N.; Zhang, R.; Zeng, X. Storm water management of low impact development in urban areas based on SWMM. Water 2019, 11, 33. [Google Scholar] [CrossRef] [Green Version]
- Shin, D.S.; Park, J.B.; Kang, D.K.; Jo, D.J. An analysis of runoff mitigation effect using SWMM-LID model for frequently inundated basin. J. KOSHAM 2013, 13, 303–309. [Google Scholar]
- Lee, J.; Kang, D.K.; Park, M.; Kim, S. Study for management of non-point source in Sooyeong River watershed using SWMM. J. Korean Soc. Hazard Mitig. 2014, 14, 327–336. [Google Scholar] [CrossRef] [Green Version]
- Zhang, K.; Chui, T.F.M.; Yang, Y. Simulating the hydrological performance of low impact development in shallow groundwater via a modified SWMM. J. Hydrol. 2018, 566, 313–331. [Google Scholar] [CrossRef]
- Bhandari, S.; Jobe, A.; Thakur, B.; Kalra, A.; Ahmad, S. Flood Damage Reduction in Urban Areas with Use of Low Impact Development Designs. In Proceedings of the World Environmental and Water Resources Congress 2018, Minneapolis, MN, USA, 3–7 June 2018; pp. 52–61. [Google Scholar]
- Zhang, K.; Chui, T.F.M. A comprehensive review of spatial allocation of LID-BMP-GI practices: Strategies and optimization tools. Sci. Total Environ. 2018, 621, 915–929. [Google Scholar] [CrossRef]
- Zhen, J.X.; Yu, S.L.; Zhai, Y. A planning tool for watershed LID-BMP implementation. In Critical Transitions in Water and Environmental Resources Management, Proceedings of the World Water and Environmental Resources Congress, Salt Lake City, UT, USA, 27 June–1 July 2004; American Society of Civil Engineers: Reston, VA, USA, 2014; pp. 1–10. [Google Scholar]
- Kuller, M.; Bach, P.M.; Ramirez-Lovering, D.; Deletic, A. The location choice of water Sensitive Urban Design within a city: A case study of Melbourne. In Proceedings of the IWA World Water Congress and Exhibition, Brisbane, Australian, 9–13 October 2016. [Google Scholar]
- Vittorio, D.D.; Ahiablame, L. Spatial translation and scaling up of low impact development designs in an urban watershed. J. Water Manag. Model. 2015. [Google Scholar] [CrossRef] [Green Version]
- Baek, S.S.; Ligaray, M.; Park, J.P.; Shin, H.S.; Kwon, Y.; Brascher, J.T.; Cho, K.H. Developing a hydrological simulation tool to design bioretention in a watershed. Environ. Modell. Softw. 2019, 122, 104074. [Google Scholar] [CrossRef]
- National Institute of Environmental Research (NIER). A Study on the Policy Implementation and Evaluation System for Achieving Hydrologic Cycle Target; National Institute of Environmental Research: Incheon, Korea, 2020. [Google Scholar]
- Rossman, L.A. Storm Water Management Model User’s Manual Version 5.1; United States Environmental Protection Agency: Washington, DC, USA; Water Supply and Water Resources Division, National Risk Management Research Laboratory: Cincinnati, OH, USA, 2015.
- Baek, S.S.; Choi, H.; Park, J. Low impact development modeling: Literature review and suggestion for future work. J. Korean Soc. Environ. Eng. 2019, 41, 292–299. [Google Scholar] [CrossRef] [Green Version]
- Woon, E.; Jang, C.L.; Lee, K. Runoff analysis according to LID facilities in climate change scenario—Focusing on Cheonggyecheon basin. J. Korea Water Resour. Assoc. 2020, 53, 583–595. [Google Scholar]
- U.S. Environmental Protection Agency (USEPA). Storm water management model User’s manual version. Water Res. 2015, 5, 72–79. [Google Scholar]
- Donigian, A.S. Watershed model calibration and validation: The HSPF experience. In Water Environment Federation, National TMDL Science and Policy; Water Environment Federation: Alexandria, VA, USA, 2002; pp. 44–73. [Google Scholar]
- U.S. Environmental Protection Agency (USEPA). Lecture. Watershed Model Calibration and Validation: Issues and Procedures-# 15; U.S. Environmental Protection Agency (USEPA): Washington, DC, USA, 2011; Volume 11.
- Shin, M.H.; Jeon, J.H. Comparison of Characteristics of Nonpoint Source Pollution from Separate and Combined Sewer System. J. Korean Soc. Water Environ. 2017, 33, 97–106. [Google Scholar]
- Arjenaki, M.O.; Sanayei, H.R.Z.; Heidarzadeh, H.; Mahabadi, N.A. Modeling and investigating the effect of the LID methods on collection network of urban runoff using the SWMM model (case study: Shahrekord City). Model. Earth Syst. Environ. 2021, 7, 1–16. [Google Scholar] [CrossRef]
- Lee, H.W.; Choi, H.J. Analysis of Rainfall-runoff characteristics in Shiwha industrial watershed using SWMM. J. Korean Soc. Environ. Eng. 2015, 37, 14–22. [Google Scholar] [CrossRef]
- Kang, T.U.; Lee, S.H. Development on an automactic calibration module of the SWMM for watershed runoff simulation and water quality simulation. J. Korea Water Resour. Assoc. 2014, 47, 343–356. [Google Scholar] [CrossRef] [Green Version]
- James, W.; Huber, W.C.; Dickinson, R.E.; Pitt, R.E.; James, W.R.C.; Roesner, L.A.; Aldrich, J.A. Users Guide to SWMM; CHI: Ontario, CA, USA, 2005. [Google Scholar]
- Mao, X.; Haifeng, J.; Shaw, L.Y. Assessing the ecological benefits of aggregate LID-BMPs through modelling. Ecol. Model. 2017, 353, 139–149. [Google Scholar] [CrossRef]
- Rodríguez, R.; María, I.; Alejandro, L.G.M. A Discussion on the Application of Terminology for Urban Soil Sealing Mitigation Practices. Int. J. Environ. Res. Public Health 2022, 19, 8713. [Google Scholar] [CrossRef] [PubMed]
- Chen, C.; Wenshan, G.; Huu, H.N. Pesticides in stormwater runoff—A mini review. Front. Environ. Sci. Eng. 2019, 13, 1–12. [Google Scholar] [CrossRef]
- Fletcher, T.D.; Shuster, W.; Hunt, W.F.; Ashley, R.; Butler, D.; Arthur, S.; Trowsdale, S.; Barraud, S.; Semadeni, D.A.; Bertrand, K.J.L.; et al. SUDS, LID, BMPs, WSUD and more the evolution and application of terminology surrounding urban drainage. Urban Water J. 2015, 12, 525–542. [Google Scholar] [CrossRef]
- Jang, Y.S.; Mun, S.H.; Yang, S.L. An analysis of flood mitigation effect applying to LID in mokgamcheon watershed using SWMM model. Highw. Eng. 2013, 15, 75–83. [Google Scholar] [CrossRef]
- Lin, W.G.; Ryu, S.W.; Park, D.G.; Lee, J.H.; Cho, Y.H. Performance evaluation of the runoff reduction with permeable pavements using the SWMM model. Int. J. Highw. Eng. 2015, 17, 11–18. [Google Scholar] [CrossRef]
- Ministry of Environment. Manual for Installation and Management of Non-Point Pollution Reduction Facilities; Ministry of Environment: Sejong, Korea, 2020.
- Kim, E.S. Analysis of runoff according to Application of SWMM-LID Element Technology (I): Parameter Sensitivity Analysis. J. Korean Soc. Hazard Mitig. 2020, 20, 437–444. [Google Scholar] [CrossRef]
- Yeon, J.S.; Kim, S.D.; Choi, H.I.; Shin, H.S.; Kim, E.S. Rainfall runoff reduction analysis for the construction and maintenace costs of LID facilities. J. Korean Soc. Hazard Mitig. 2015, 15, 281–287. [Google Scholar] [CrossRef] [Green Version]
- Lee, J.; Kim, J.; Lee, J.M.; Jang, H.S.; Park, M.; Min, J.H.; Na, E.H. Analyzing the Impacts of Sewer Type and Spatial Distribution of LID Facilities on Urban Runoff and Non-Point Source Pollution Using the Storm Water Management Model (SWMM). Water 2022, 14, 2776. [Google Scholar] [CrossRef]
- National Institute of Environmental Research (NIER). Customized Policy Support for Nonpoint Pollution Management and Water Circulation Improvement (IV); National Institute of Environmental Research: Incheon, Korea, 2019.
- Wang, M.; Zhang, Y.; Zhang, D.; Zheng, Y.; Li, S.; Tan, S.K. Life-cycle cost analysis and resilience consideration for coupled grey infrastructure and low impact development practices. Sustain. Cities Soc. 2021, 75, 103358. [Google Scholar] [CrossRef]
- Lee, J.; Lee, Y.; Choi, J. Analysis of water cycle effect according to application of LID techniques. J. Wetl. Res. 2014, 16, 411–421. [Google Scholar] [CrossRef] [Green Version]
- Darnthamrongkul, W.; Mozingo, L.A. Toward sustainable storm water management: Understanding public appreciation and recognition of urban Low Impact Development (LID) in the San Francisco Bay Area. J. Environ. Manag. 2021, 300, 113716. [Google Scholar] [CrossRef] [PubMed]


| Category | Urban Area (Seoul) | Complex Area (Incheon) | ||||
|---|---|---|---|---|---|---|
| Gangseo-gu (Separated Sewer)– Region A | Yangcheon-gu (Combined Sewer)– Region B | Seo-gu (Combined Sewer)– Region C | ||||
| Area (km2) | Ratio (%) | Area (km2) | Ratio (%) | Area (km2) | Ratio (%) | |
| Public area | 0.1 | 3.6 | 0.02 | 2.5 | 0.03 | 1.9 |
| Industrial area | 0.05 | 1.9 | - | - | - | - |
| Traffic area | 1.37 | 50.1 | 0.31 | 34.0 | 0.48 | 30.4 |
| Commercial area | 0.35 | 12.8 | 0.09 | 9.7 | 0.07 | 4.4 |
| Residential area | 0.23 | 8.5 | 0.39 | 42.4 | 0.14 | 8.9 |
| Sports facilities | 0.06 | 2.3 | 0.02 | 1.9 | 0.01 | 0.6 |
| Cultivation site | 0.14 | 5.1 | 0.01 | 0.8 | 0.05 | 3.2 |
| Forest | 0.43 | 15.7 | 0.08 | 8.88 | 0.38 | 24.1 |
| Rice field | - | - | - | - | 0.10 | 6.3 |
| Field | - | - | - | - | 0.24 | 15.2 |
| Bare land | - | - | - | - | 0.08 | 5.1 |
| Total | 2.73 | 100 | 0.91 | 100 | 1.58 | 100 |
| Category | Input Parameters |
|---|---|
| Weather data | Hourly data of rainfall in 2018 (Seoul Meteorological Observatory) |
| Pipeline data | Name of the pipeline, upstream manhole, downstream manhole, pipeline shape, circular pipeline tubule, spherical pipeline width/height, pipeline extension, upstream ground height, upstream invert level, downstream invert level, downstream ground height, pipe slope, and roughness coefficient |
| Manhole data | Manhole name, manhole specification, ground level, invert level, and small basin information |
| Basin data | Name of small basin, basin area (area by small basin), basin width, basin slope, water permeability (water permeability coefficient), water permeability surface storage, water permeability roughness coefficient, and water permeability loss factor |
| Interior drainage facility (restrictions) | Drawings and specifications of connection status with existing pipelines to interior drainage facilities such as sewage storage facilities and rainwater pumping stations |
| Layer | Parameters | GI Strategy | LID Strategy |
|---|---|---|---|
| Permeable Pavement | Tree Box Filter | ||
| Surface | Storage depth (mm) | 100 | 100 |
| Vegetation | 0.0 | 0.0 | |
| Surface roughness (Mannings n) | 0.012 | 0.13 | |
| Surface slope (%) | 2 | 1 | |
| Soil | Thickness (mm) | 200 | 800 |
| Porosity | 0.437 | 0.437 | |
| Field capacity | 0.062 | 0.062 | |
| Wilting point | 0.024 | 0.024 | |
| Conductivity (mm/hr) | 120 | 120 | |
| Conductivity slope | 30 | 30 | |
| Suction Head (mm) | 49 | 49 | |
| Pavement | Thickness (mm) | 60 | - |
| Void ratio | 0.2 | ||
| Impervious surface fraction | 0 | ||
| Permeability (mm/hr) | 13 | ||
| Storage | Thickness (mm) | 200 | 300 |
| Void ratio | 0.5 | 0.5 | |
| Conductivity (mm/hr) | 13 | 13 | |
| Clogging factor | 0 | 0 |
| Scenarios | GI Strategy | LID Strategy | ||
|---|---|---|---|---|
| Permeable Pavement | Tree Box Filter | |||
| SC1 | distributed | 3% area reduction in impermeable area * | ||
| SC2 | concentrated | upstream | ||
| SC3 | midstream | |||
| SC4 | downstream | |||
| Category | Sewer System Type | Area (km2) | Sewer Length (km) | Number of Sub-catchments | Number of Sewers | Manhole, Number of Spills |
|---|---|---|---|---|---|---|
| Urban areas | Separated sewer (region A) | 2.73 | 30.3 | 470 | 498 | 483 |
| Combined sewer (region B) | 0.91 | 16.9 | 276 | 310 | 279 | |
| Complex areas | Combined sewer (region C) | 1.58 | 18.5 | 438 | 446 | 444 |
| Separated | R2 | NSE | Correlation |
|---|---|---|---|
| Anyangcheon | 0.81 (Very good) | 0.72 (Good) | 0.90 (Very good) |
| Noryangjin | 0.69 (Good) | 0.64 (Fair) | 0.83 (Very good) |
| Category | Scenario | Urban Area (Seoul) | Complex Area (Incheon) | ||||||
|---|---|---|---|---|---|---|---|---|---|
| Region A | Region B | Region C | |||||||
| GI | LID | GI | LID | GI | LID | ||||
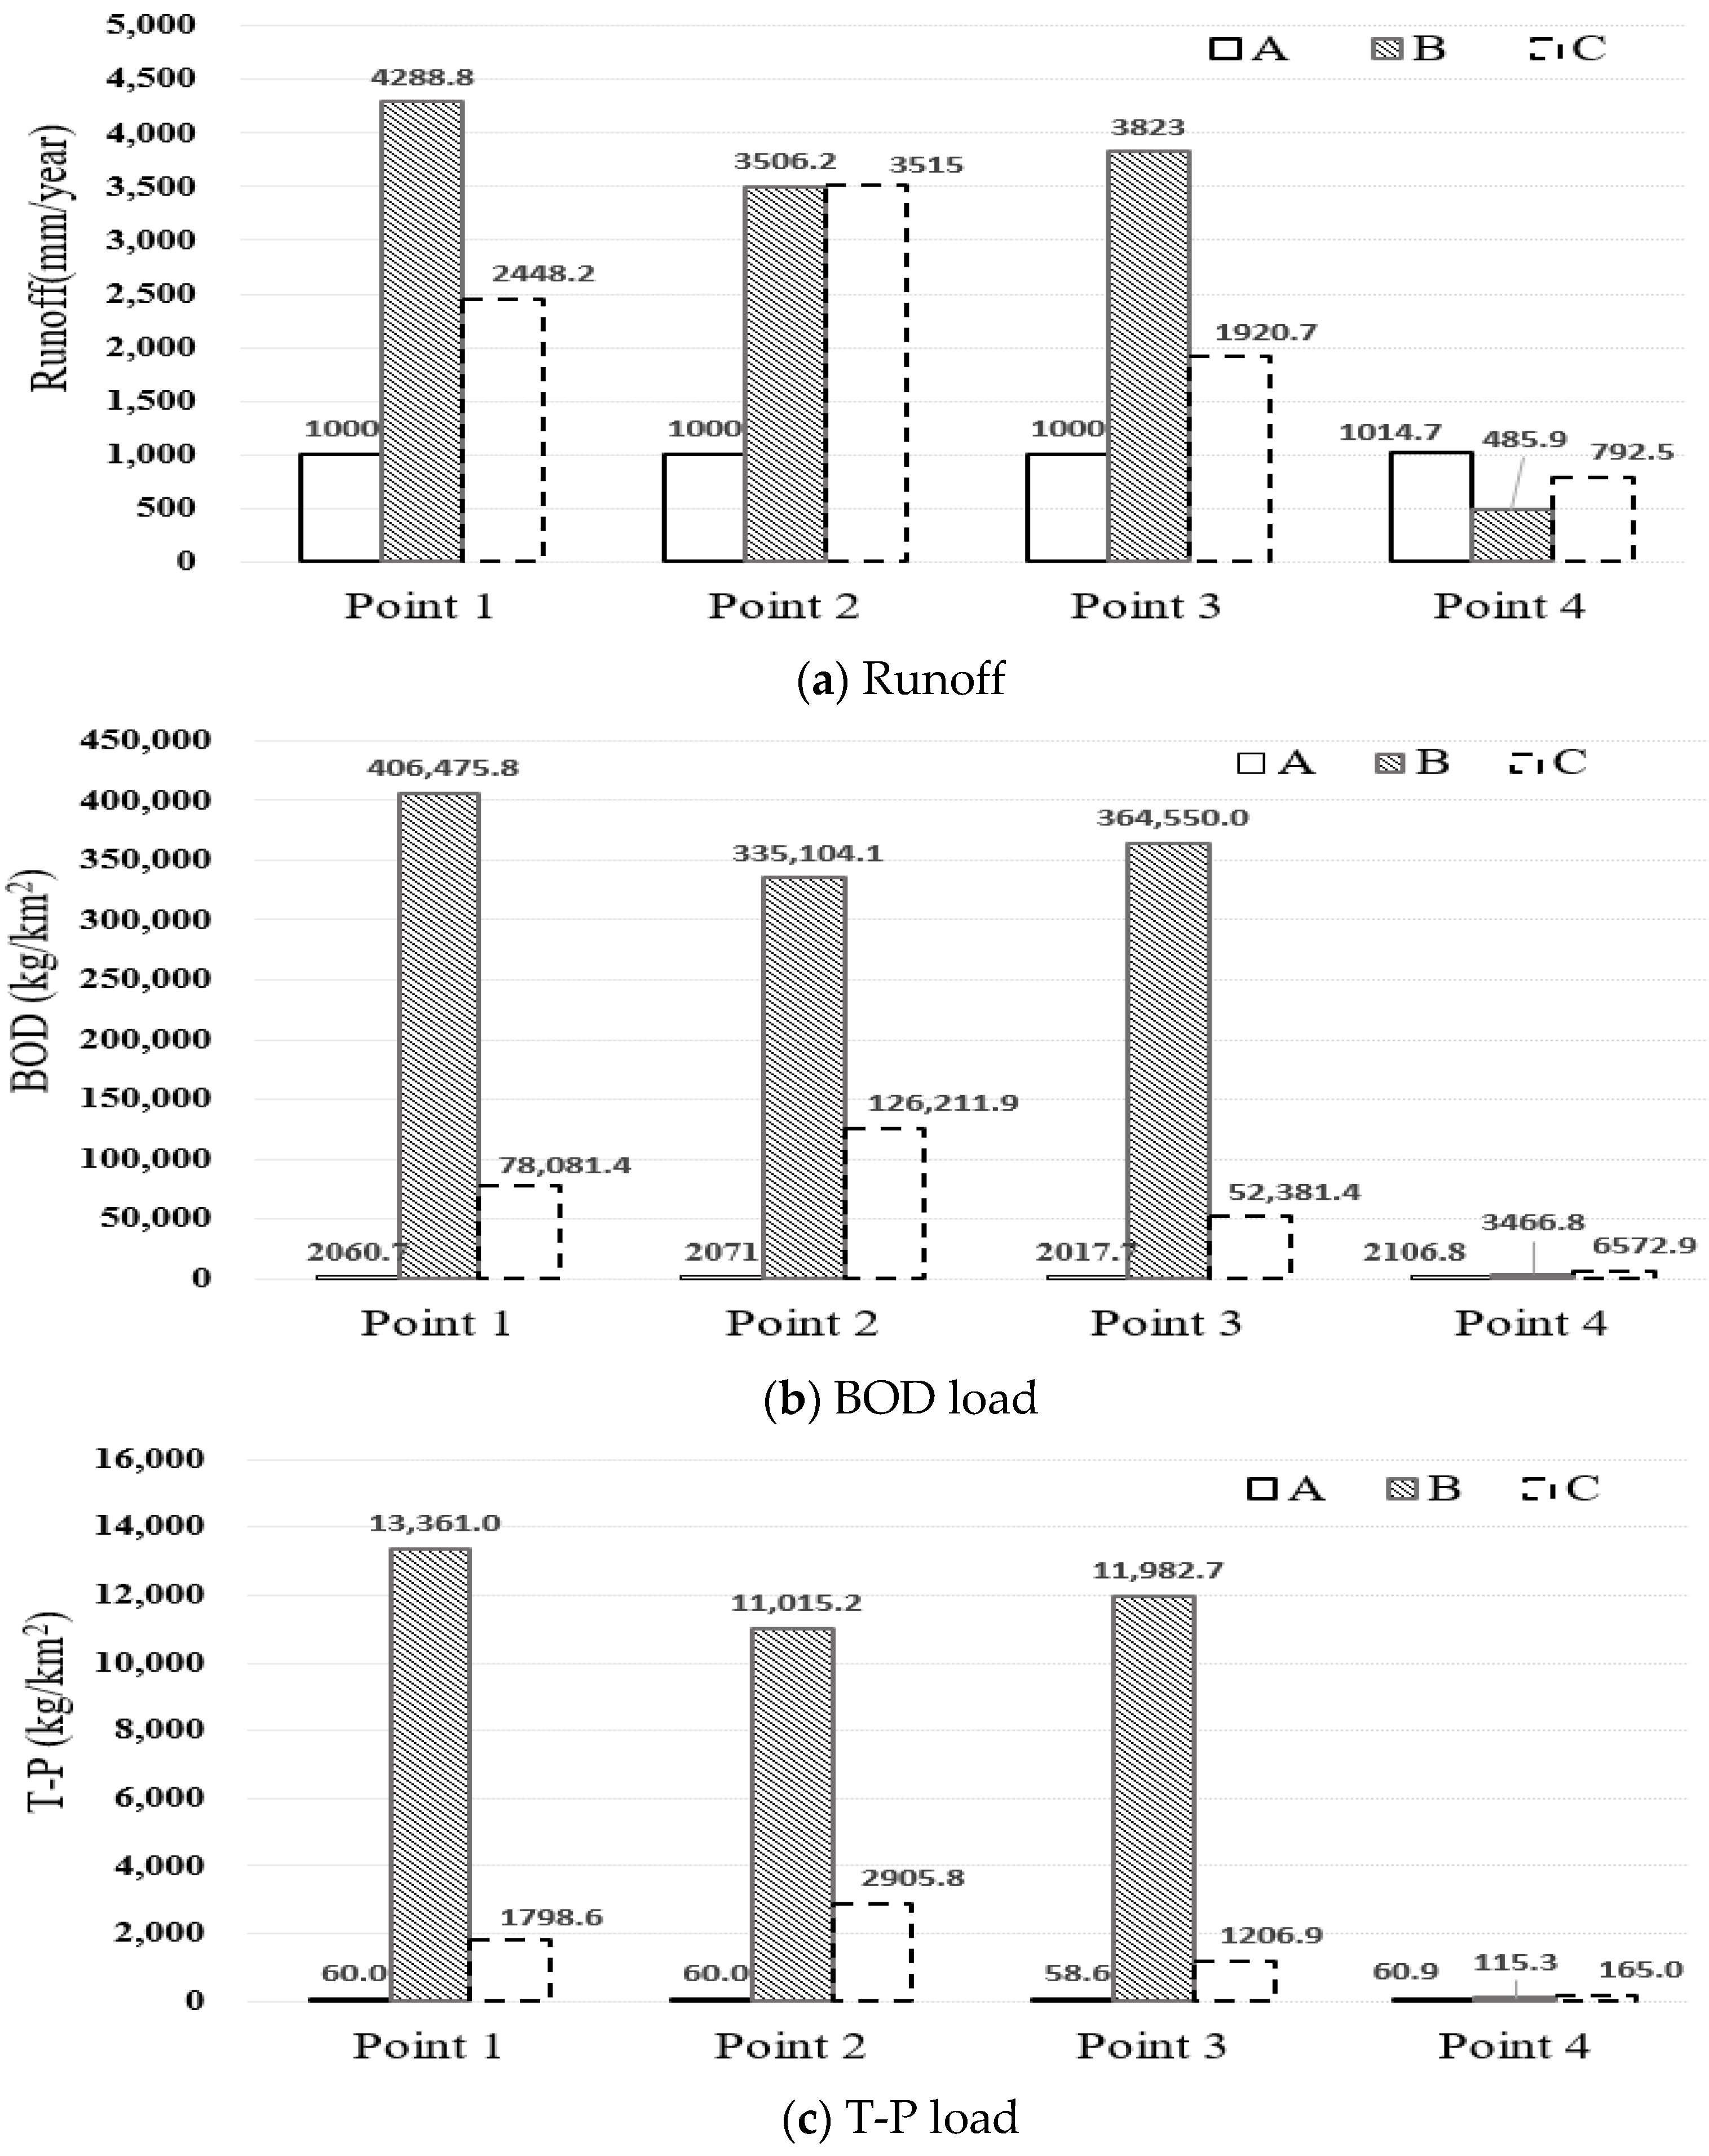
| Runoff | Base | 1014.7 | 485.9 | 792.5 | |||||
| SC1 | Distribution | 897.7 (−11.5%) | 891.5 (−12.1%) | 394.7 (−18.8%) | 386.0 (−20.6%) | 715.9 (−9.7%) | 713.4 (−10%) | ||
| SC2 | Conc. * | Upstream | 932.7 (−8.1%) | 454.9 (−6.4%) | 760 (−4.1%) | ||||
| SC3 | Midstream | 946.3 (−6.7%) | 457.0 (−6%) | 763.2 (−3.7%) | |||||
| SC4 | Downstream | 943.3 (−7%) | 456.3 (−6.1%) | 758.5 (−4.3%) | |||||
| B O D | Base | 2106.8 | 3466.8 | 6572.9 | |||||
| SC1 | Distribution | 1863.4 (−11.6%) | 1850.3 (−12.2%) | 2925 (−15.7%) | 2905.2 (−16.2%) | 6095.4 (−7.26%) | 6092.4 (−7.31%) | ||
| SC2 | Conc. * | Upstream | 1936.0 (−8.1%) | 3254.3 (−6.2%) | 6377.7 (−3%) | ||||
| SC3 | Midstream | 1964.5 (−6.8%) | 3263.8 (−5.9%) | 6408.9 (−2.5%) | |||||
| SC4 | Downstream | 1958.3 (−7%) | 3269.2 (−5.8%) | 6362.6 (−3.2%) | |||||
| T-P | Base | 60.9 | 115.3 | 165 | |||||
| SC1 | Distribution | 53.8 (−11.5%) | 53.5 (−12.2%) | 97.2 (−15.7%) | 96.6 (−16.3%) | 153.1 (−7.2%) | 152.9 (−7.4%) | ||
| SC2 | Conc. * | Upstream | 55.9 (−8.1%) | 108.5 (−5.9%) | 160.2 (−2.9%) | ||||
| SC3 | Midstream | 56.8 (−6.7%) | 108.9 (−5.6%) | 160.8 (−2.5%) | |||||
| SC4 | Downstream | 56.6 (−7%) | 109.0 (−5.5%) | 159.8 (−3.1%) | |||||
| Scenario | Urban Area | Complex Area | |||||||
|---|---|---|---|---|---|---|---|---|---|
| Separated Sewer System (Region A) | Combined Sewer System (Region B) | Combined Sewer System (Region C) | |||||||
| Flow | BOD | T-P | Flow | BOD | T-P | Flow | BOD | T-P | |
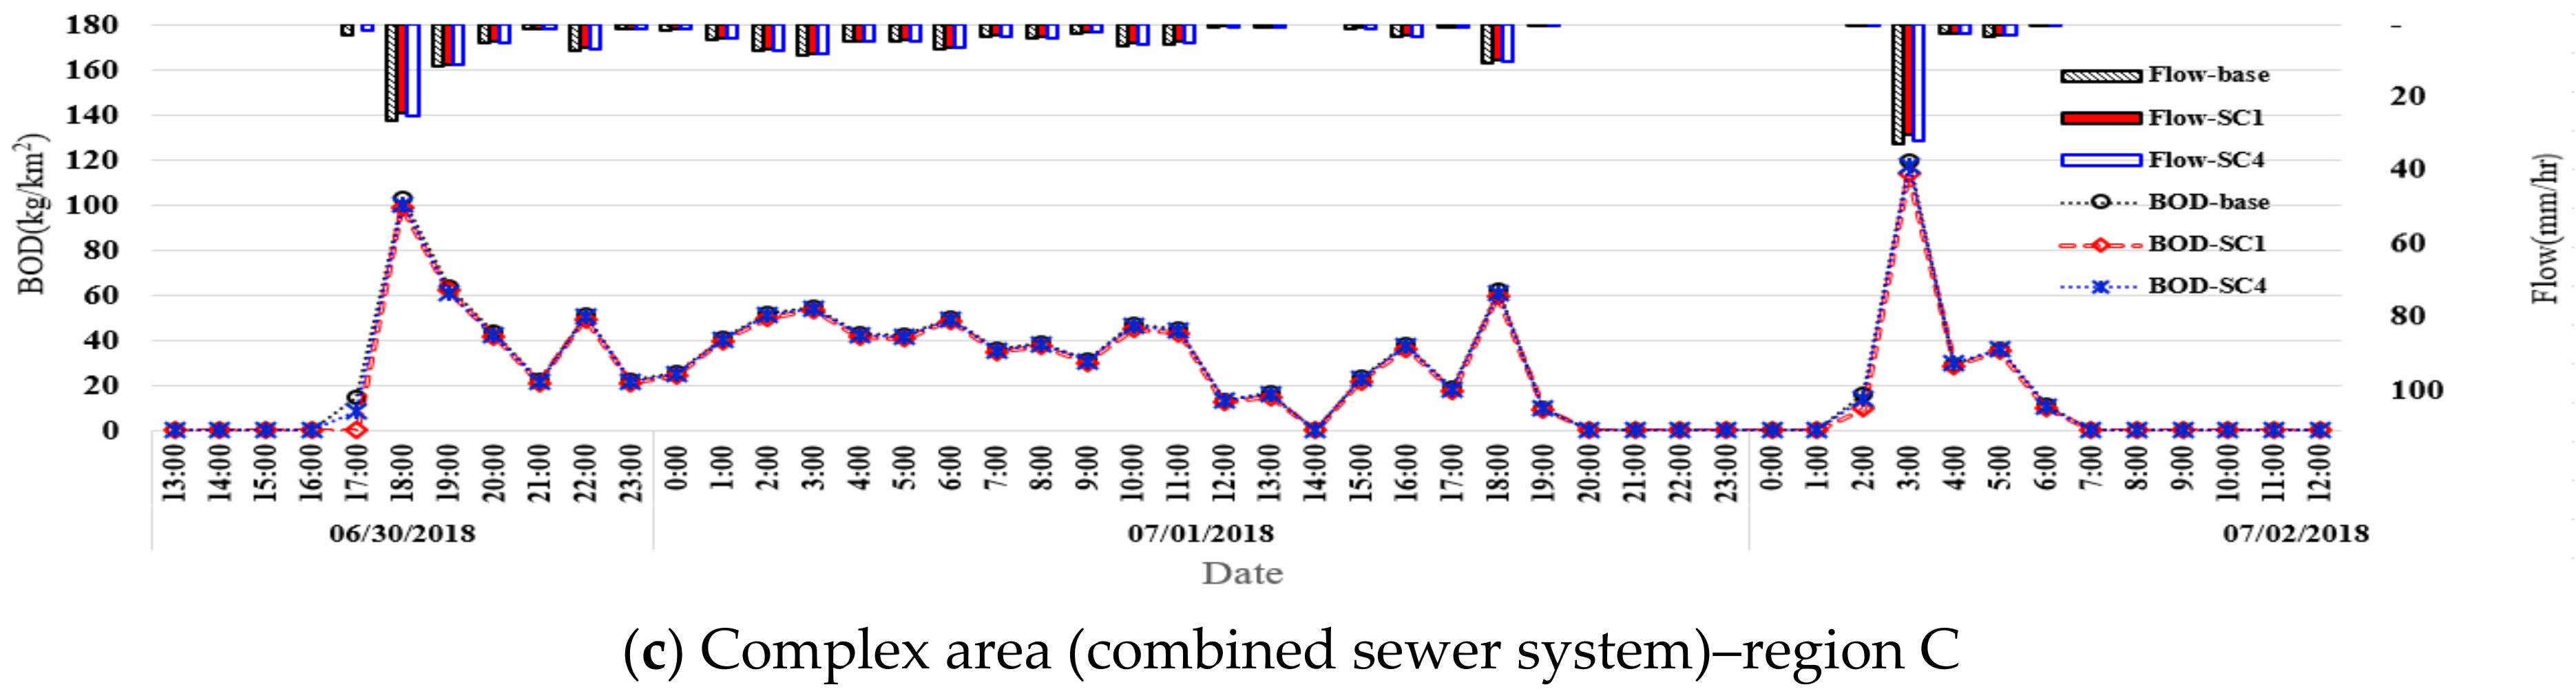
| Base | 127.4 | 415.8 | 12.021 | 100.9 | 836 | 27.849 | 123.3 | 1442.9 | 36.442 |
| SC1 | 112.8 (−11.4%) | 368.1 (−11.5%) | 10.647 (−11.4%) | 85.7 (−15%) | 763.4 (−8.7%) | 25.293 (−9.2%) | 113.2 (−8.2%) | 1373.6 (−4.8%) | 34.895 (−4.2%) |
| SC2 | 125.2 (−1.7%) | 408.4 (−1.8%) | 11.813 (−1.7%) | 96.9 (−4%) | 813.5 (−2.7%) | 27.093 (−2.7%) | 118.9 (−3.6%) | 1411.5 (−2.2%) | 35.621 (−2.3%) |
| SC3 | 125.2 (−1.7%) | 408.6 (−1.7%) | 11.817 (−1.7%) | 97.3 (−3.6%) | 815.1 (−2.5%) | 27.156 (−2.5%) | 118.5 (−4%) | 1410.4 (−2.3%) | 35.596 (−2.3%) |
| SC4 | 124 (−2.7%) | 404.6 (−2.7%) | 11.697 (−2.7%) | 97.2 (−3.7%) | 816.9 (−2.3%) | 27.163 (−2.5%) | 118.6 (−3.8%) | 1410.2 (−2.3%) | 35.632 (−2.2%) |
Publisher’s Note: MDPI stays neutral with regard to jurisdictional claims in published maps and institutional affiliations. |
© 2022 by the authors. Licensee MDPI, Basel, Switzerland. This article is an open access article distributed under the terms and conditions of the Creative Commons Attribution (CC BY) license (https://creativecommons.org/licenses/by/4.0/).
Share and Cite
Lee, J.M.; Park, M.; Min, J.-H.; Kim, J.; Lee, J.; Jang, H.; Na, E.H. Evaluation of SWMM-LID Modeling Applicability Considering Regional Characteristics for Optimal Management of Non-Point Pollutant Sources. Sustainability 2022, 14, 14662. https://doi.org/10.3390/su142114662
Lee JM, Park M, Min J-H, Kim J, Lee J, Jang H, Na EH. Evaluation of SWMM-LID Modeling Applicability Considering Regional Characteristics for Optimal Management of Non-Point Pollutant Sources. Sustainability. 2022; 14(21):14662. https://doi.org/10.3390/su142114662
Chicago/Turabian StyleLee, Jong Mun, Minji Park, Joong-Hyuk Min, Jinsun Kim, Jimin Lee, Heeseon Jang, and Eun Hye Na. 2022. "Evaluation of SWMM-LID Modeling Applicability Considering Regional Characteristics for Optimal Management of Non-Point Pollutant Sources" Sustainability 14, no. 21: 14662. https://doi.org/10.3390/su142114662