

Feasibility Study on Concrete Made with Substitution of Quarry Dust: A Review
 ,
,  , , ,
, , ,  ,
,
Abstract
:1. Introduction
2. Physical and Chemical Properties
3. Fresh Concrete
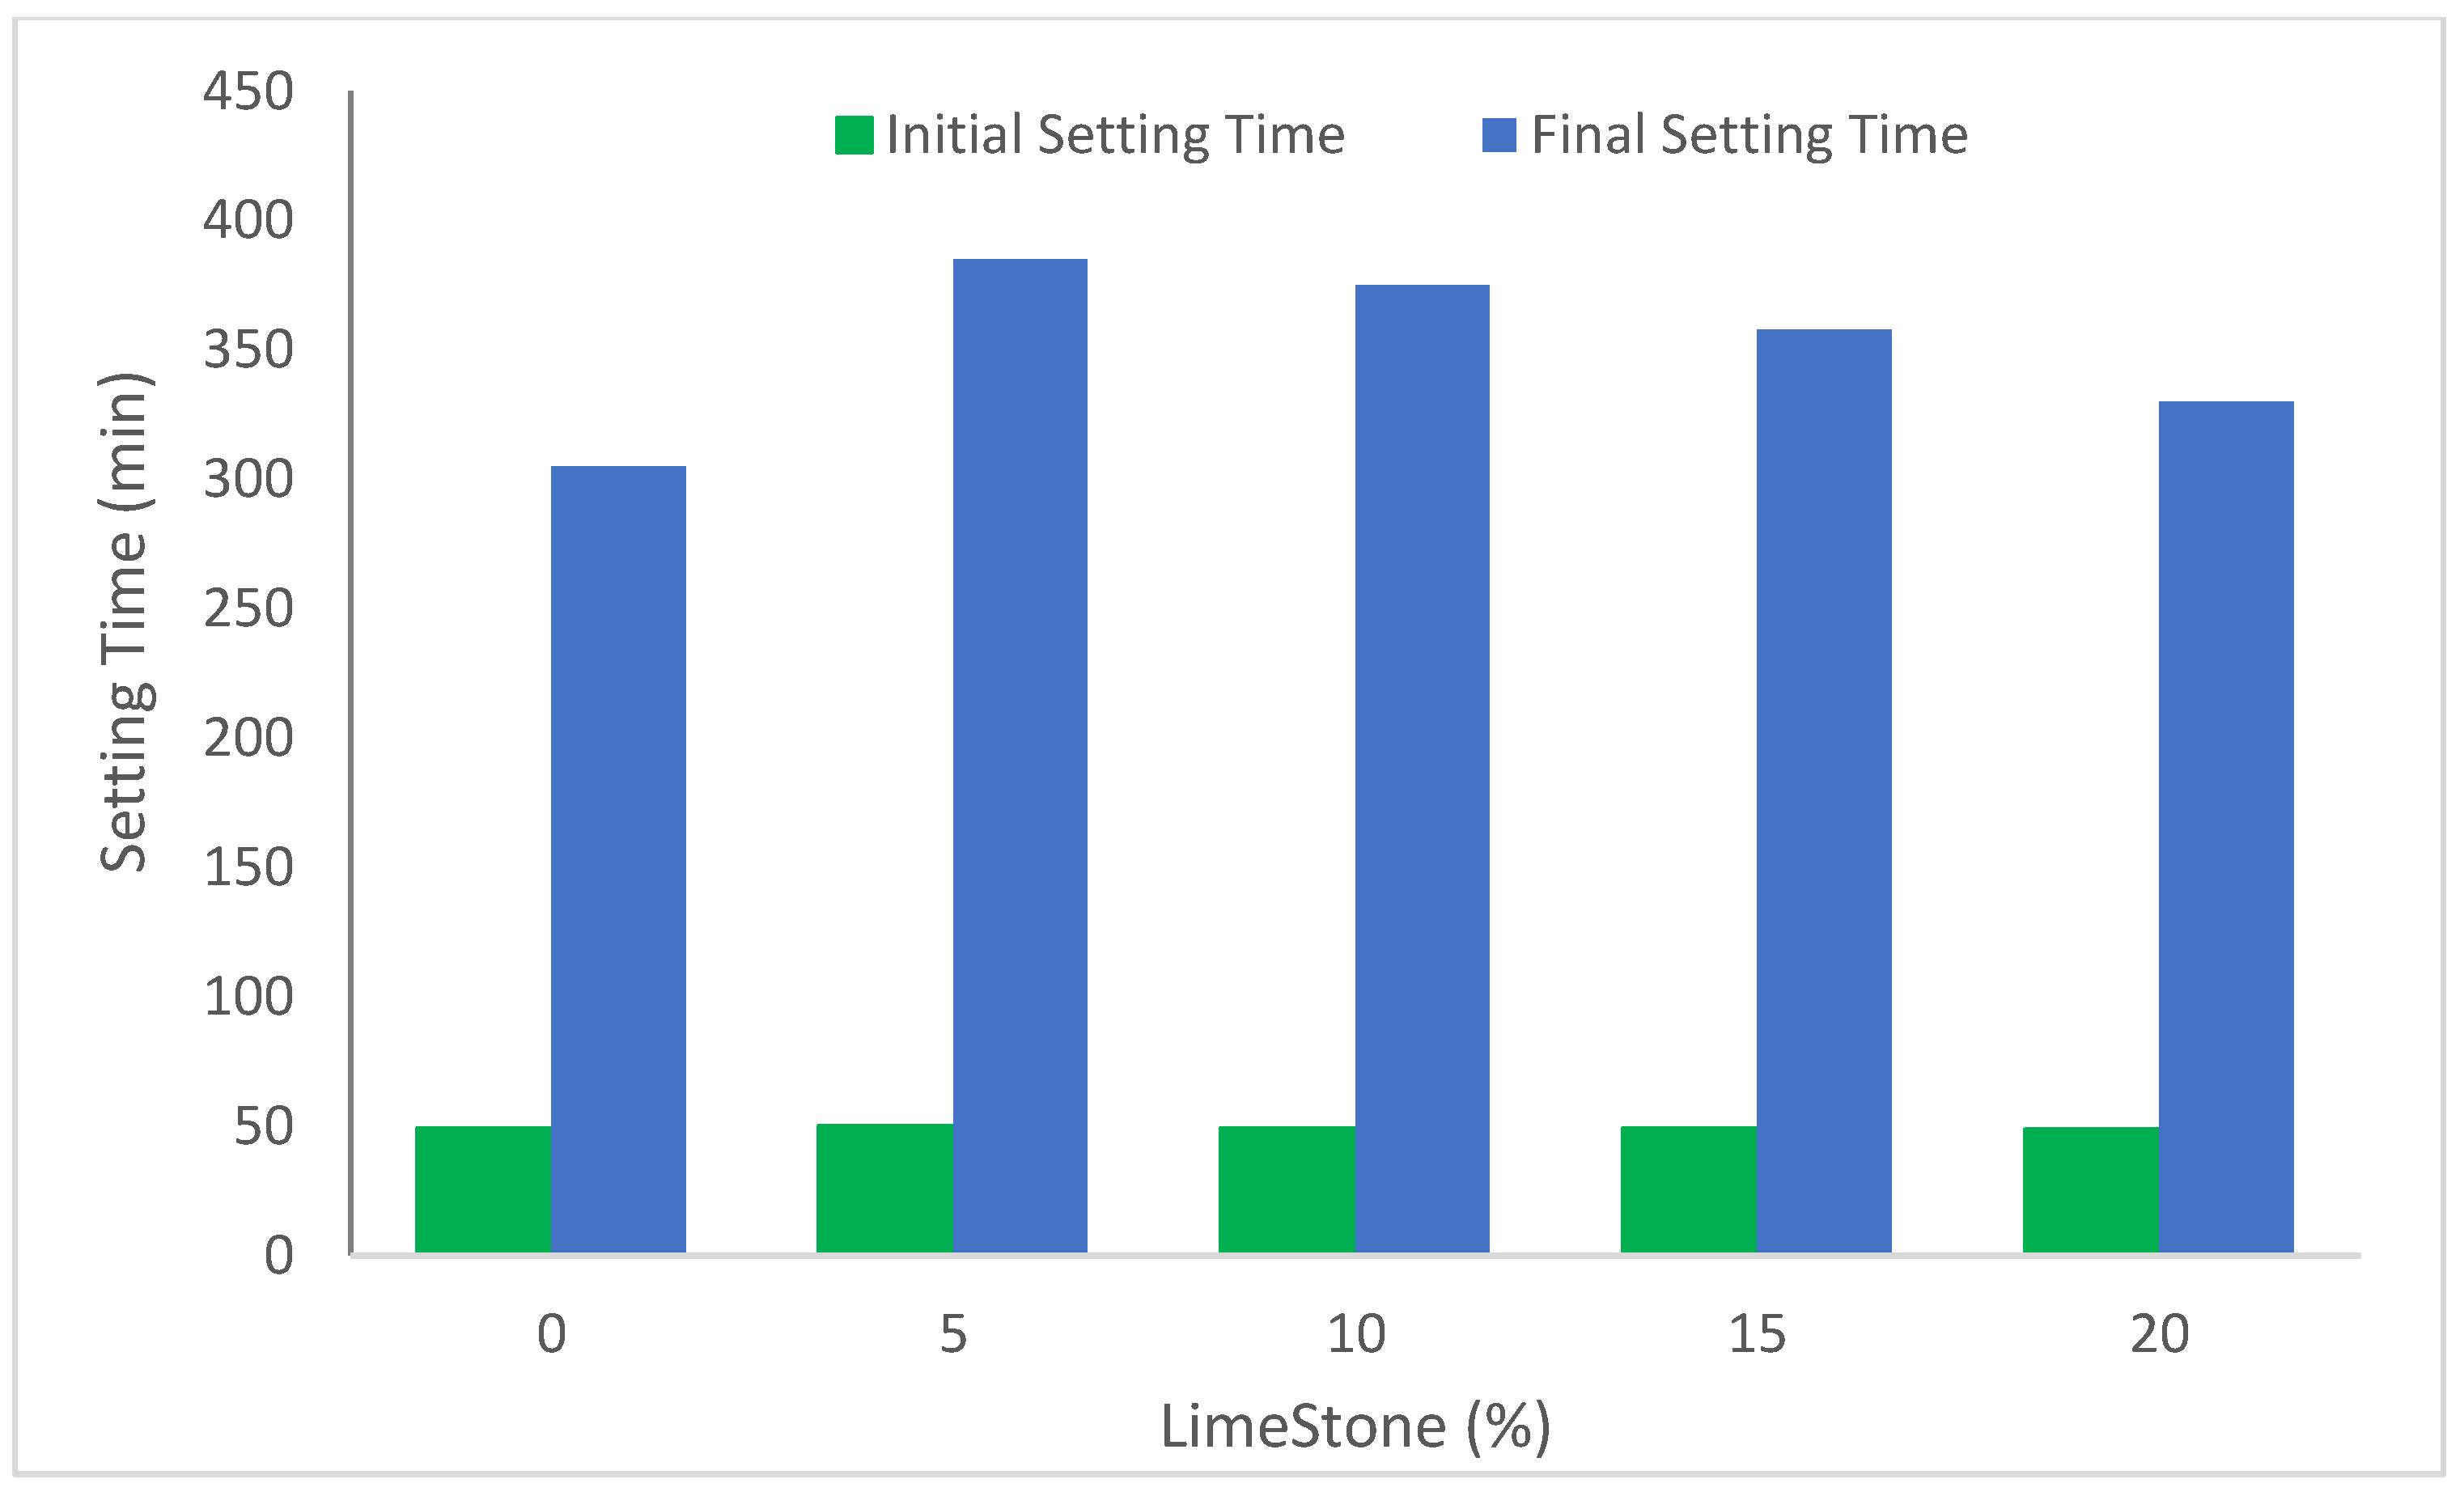
3.1. Setting Time
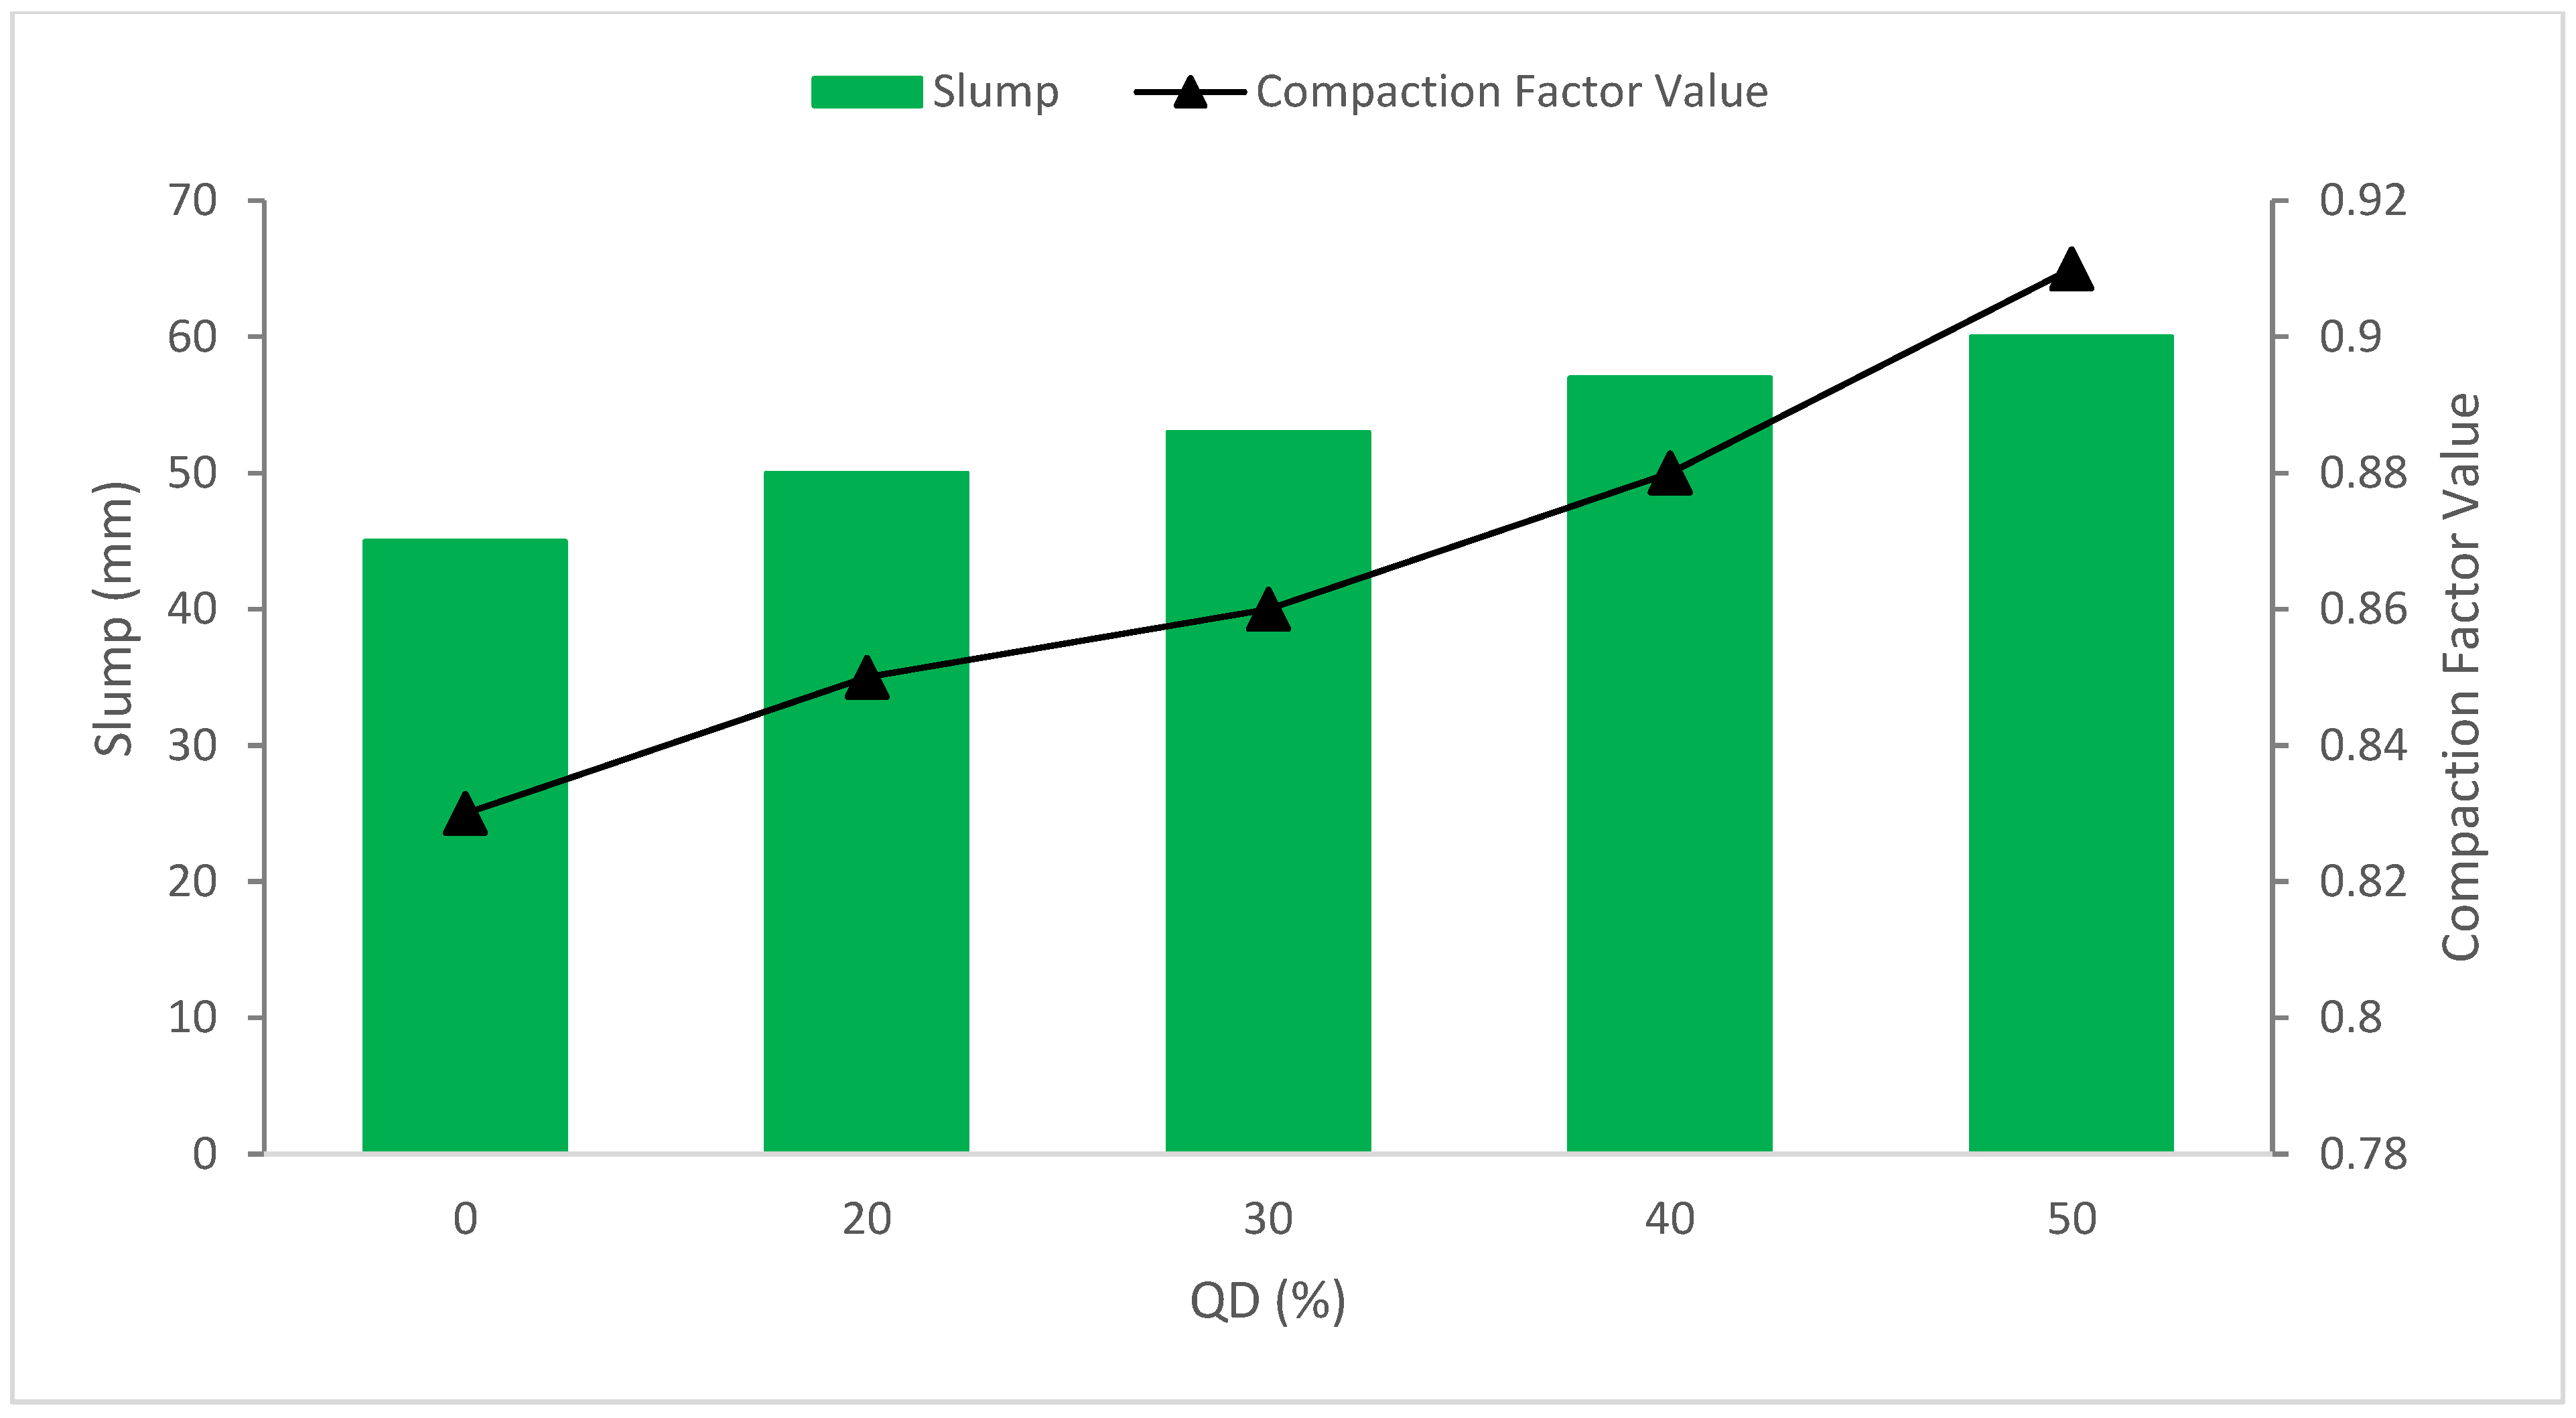
3.2. Slump Flow and Compaction Factor
4. Strength Properties
4.1. Compressive Strength (CS)

| Reference | QD | Water to Binder Ratio | Optimum | Compression Strength (MPa) |
|---|---|---|---|---|
| [56] | 0%, 10%, 20%, 30% and 40% | 0.45 | 20% | 7 Days 18, 22, 24, 19 and 18 28 Days 28, 34, 35, 30 and 28 |
| [74] | 0%, 25%, 50%, 75% and 100% | 0.47 | - | 7 Days 35, 24, 30, 31, 32 and 33 28 Days 41, 30, 32, 39, 39 and 40 |
| [57] | 0%, 50% and 100% | 0.53 | 50% | 7 Days 31.06, 38.44 and 38.10 14 Days 33.17, 41.99 and 39.03 28 Days 44.24, 45.83 and 45.32 |
| [58] | 0%, 20%, 25%, 30% and 35% | 0.44 | 30% | 14 Days 31, 32, 33, 33 and 32 28 Days 36, 37, 39, 39 and 36 |
| [72] | 0%, 20%, 30%, 40% and 50% | 0.55 | 30% | 7 Days 23, 25, 27, 24 and 22 28 Days 30, 34, 31, 24 and 26 91 Days 37, 36, 37, 35 and 33 |
| [50] | 0%, 20%, 40%, 60% and 80% | 0.56 | 60% | 7 Days 7, 10, 17, 19 and 15 28 Days 10, 10, 20, 27 and 20 |
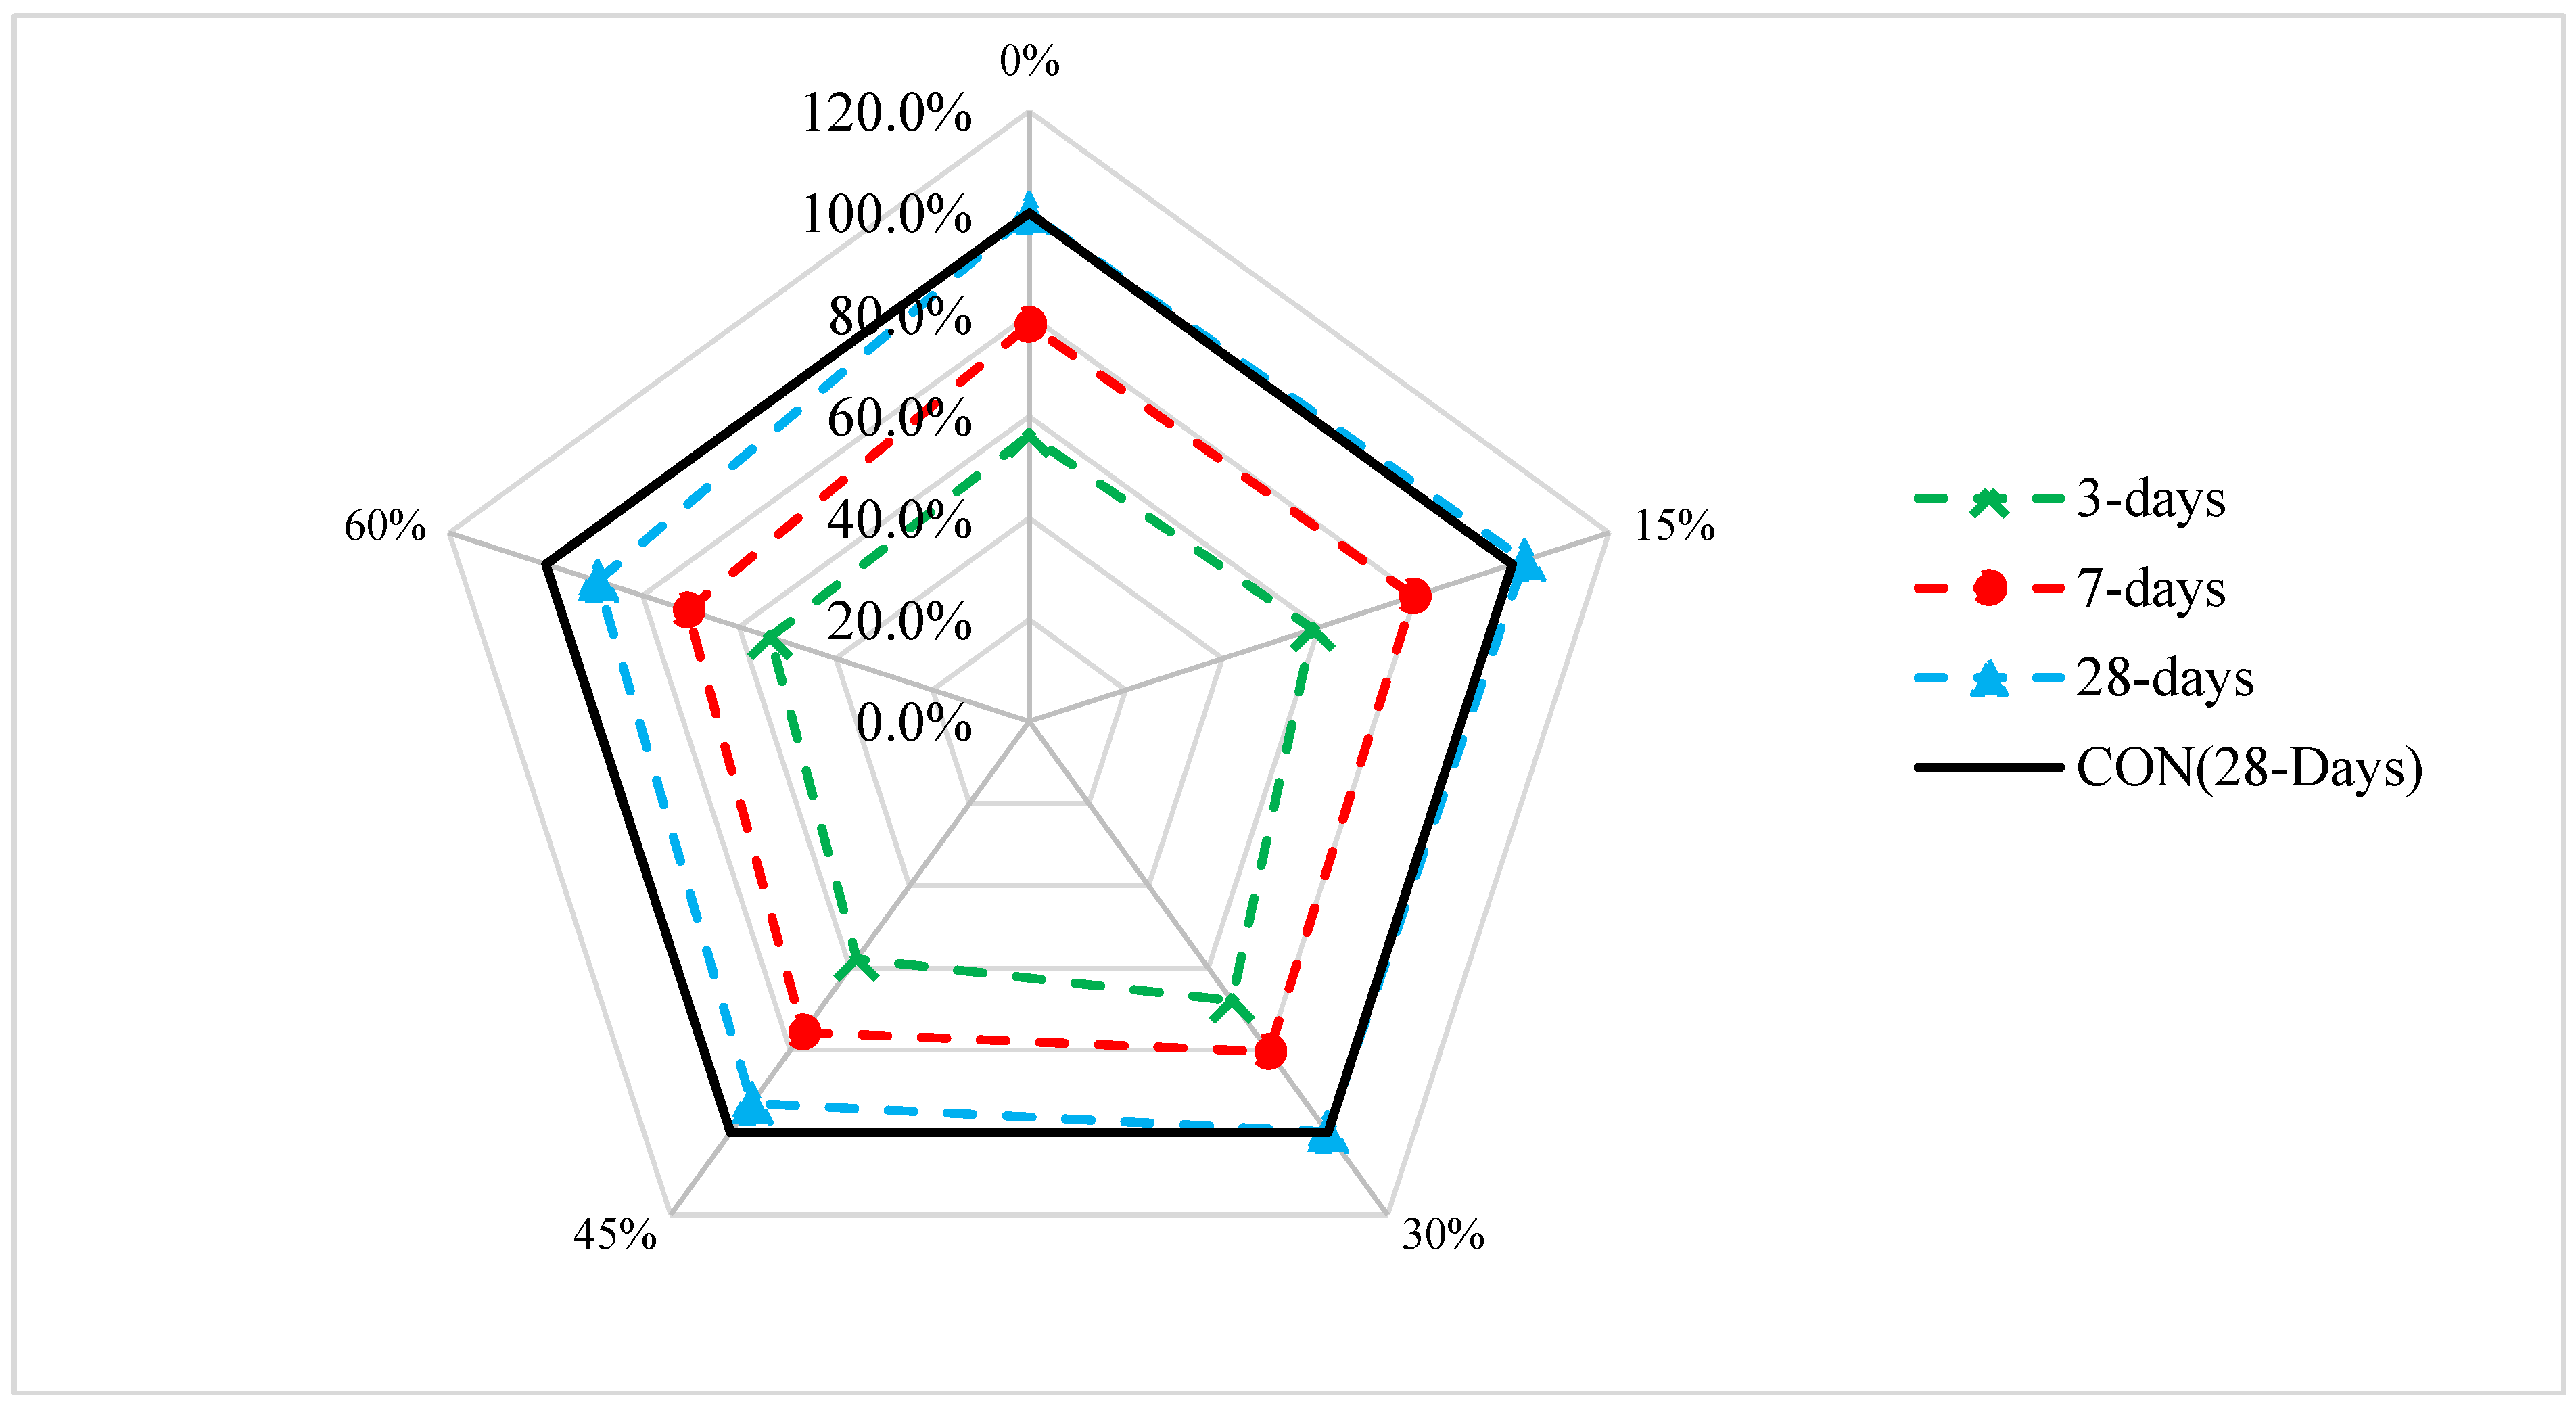
| [48] | 0%, 20%, 25% and 30% | 0.45 | 30% | 3 Days 18.9, 17.93, 17.85 and 20.74 7 Days 28.44, 29.63, 30.81 and 28.89 28 Days 38.66, 41.19, 44.30 and 44.30 60 Days 47.85, 47.26, 48 and 48.59 |
| [47] | 0%, 20%, 50% and 100% | 0.44 | 20% | 28 Days 41, 44, 42 and 36 50 Days 42, 45, 43 and 38 |
| [62] | 0%, 25%, 50%, 75% and 100% | 0.45 | 50% | 7 Days 30, 30, 35, 31 and 35 14 Days 29, 33, 36, 33 and 36 28 Days 33, 36, 38, 36 and 38 |
| [46] | 0%, 10%, 20%, 30% and 40% | 0.50 | 40% | 28 Days 45, 50, 50, 60 and 65 |
| [44] | 0%, 20%, 30%, 40% and 50% | 0.45 | 40% | M25 37.3, 37.7, 37.4, 39.7 and 38.4 M30 36.5, 38.3, 37.9, 40.1 and 39.2 |
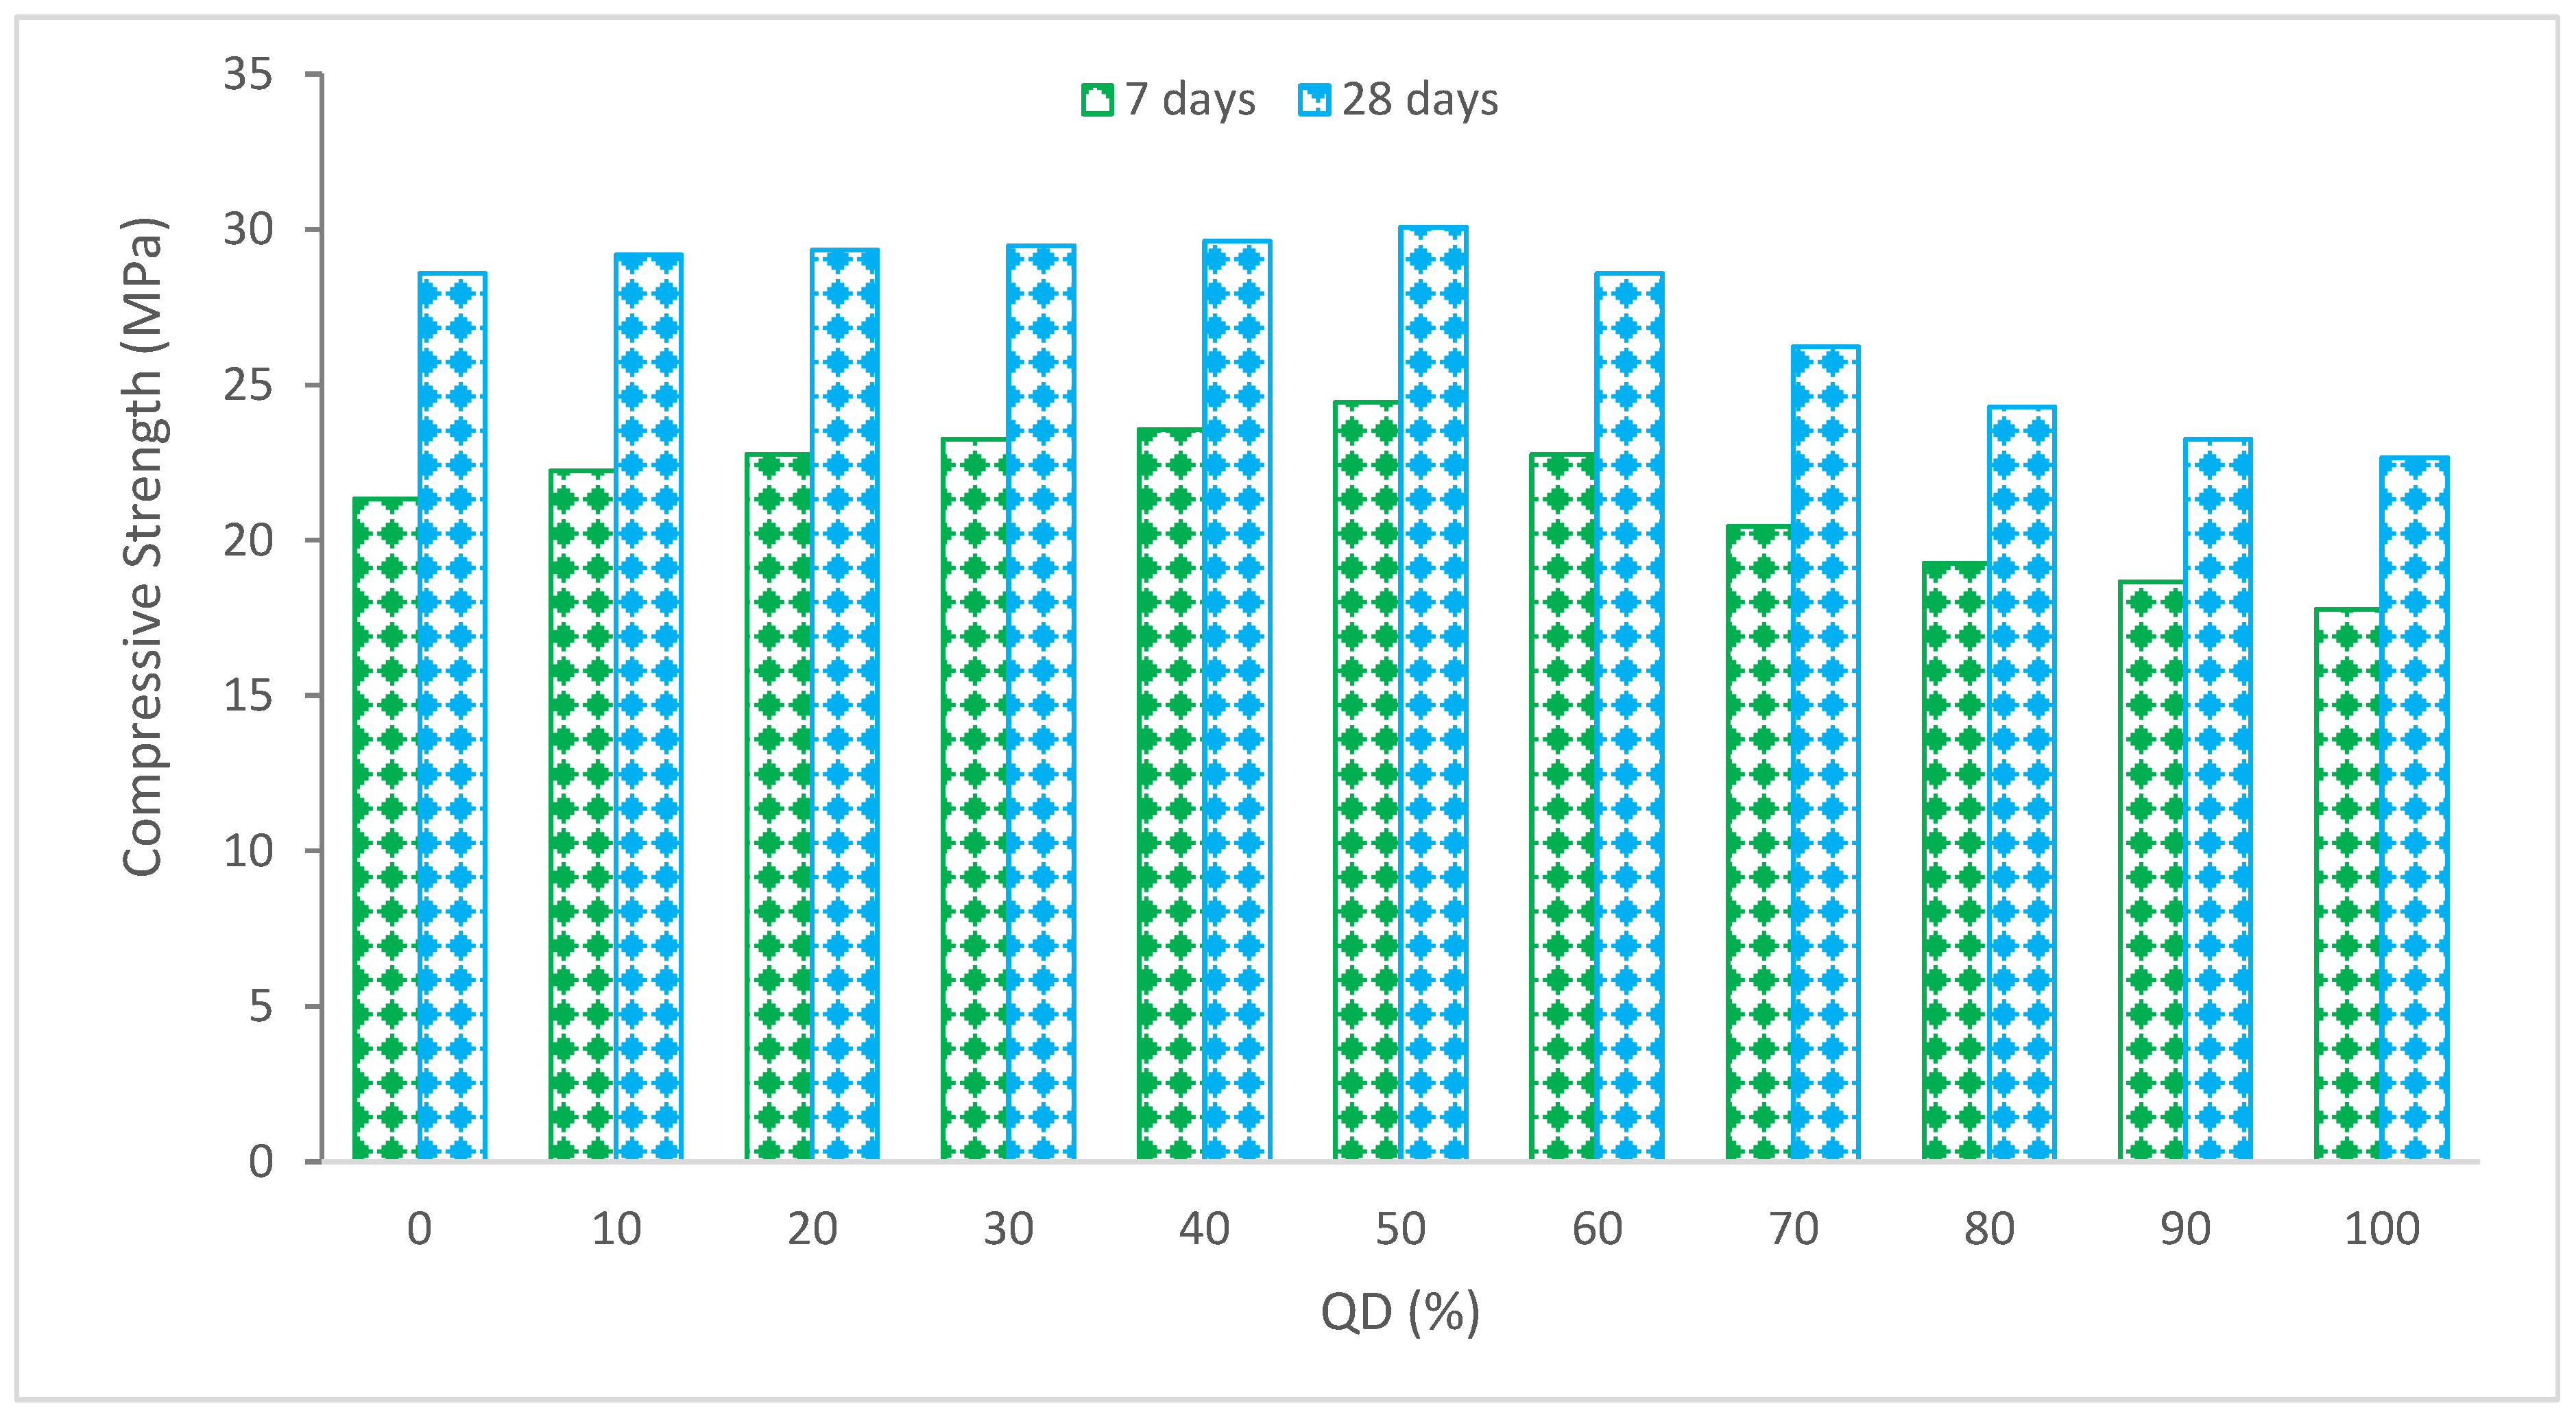
| [79] | 0%, 10%, 20%, 30%, 40%, 50%, 60%, 70%, 80%, 90% and 100% | 0.48 | 50% | 7 Days 21.33, 22.22, 22.76, 23.25, 23.56, 24.43, 22.76, 20.44, 19.25, 18.66 and 17.78 28 Days 28.58, 29.18, 29.33, 29.48, 29.62, 30.07, 28.58, 26.22, 24.29, 23.25 and 22.66 |
| [63] | 0%, 15, 20% and 25% | 0.40 | 15% | 7 Days 33, 25, 24 and 23 28 Days 42, 46, 35 and 33 |
| [83] | 0%, 10%, 20%, 30%, 40% and 50% | 0.40 | - | 3 Days 3.56, 3.46, 3.25, 3.12, 3.08 and 2.98 7 Days 4.50, 4.25, 4.05, 3.90, 3.75 and 3.55 14 Days 6.50, 5.50, 5.10, 4.80, 5.00 and 4.80 28 Days 8.82, 7.80, 6.70, 6.00, 5.45 and 5.30 |
| [64] | 0%, 10%, 20%, 30% and 40% | 0.45 | 30% | 7 Days 24.67, 24.85, 25.33, 26.44 and 23.55 28 Days 28.00, 33.11, 33.77, 35.33 and 27.55 |
| [75] | 0%, 15%, 35%, 55% and 75% | 0.40 | 35% | 3 Days 24.78, 25.85, 29.91, 25.44 and 23.61 7 Days 34.39, 35.05, 35.39, 33.31 and 31.13 28 Days 44.05, 45.18, 43.97, 40.91 and 39.32 |
4.2. Flexural Strength (FS)
4.3. Tensile Strength (TS)
5. Durability
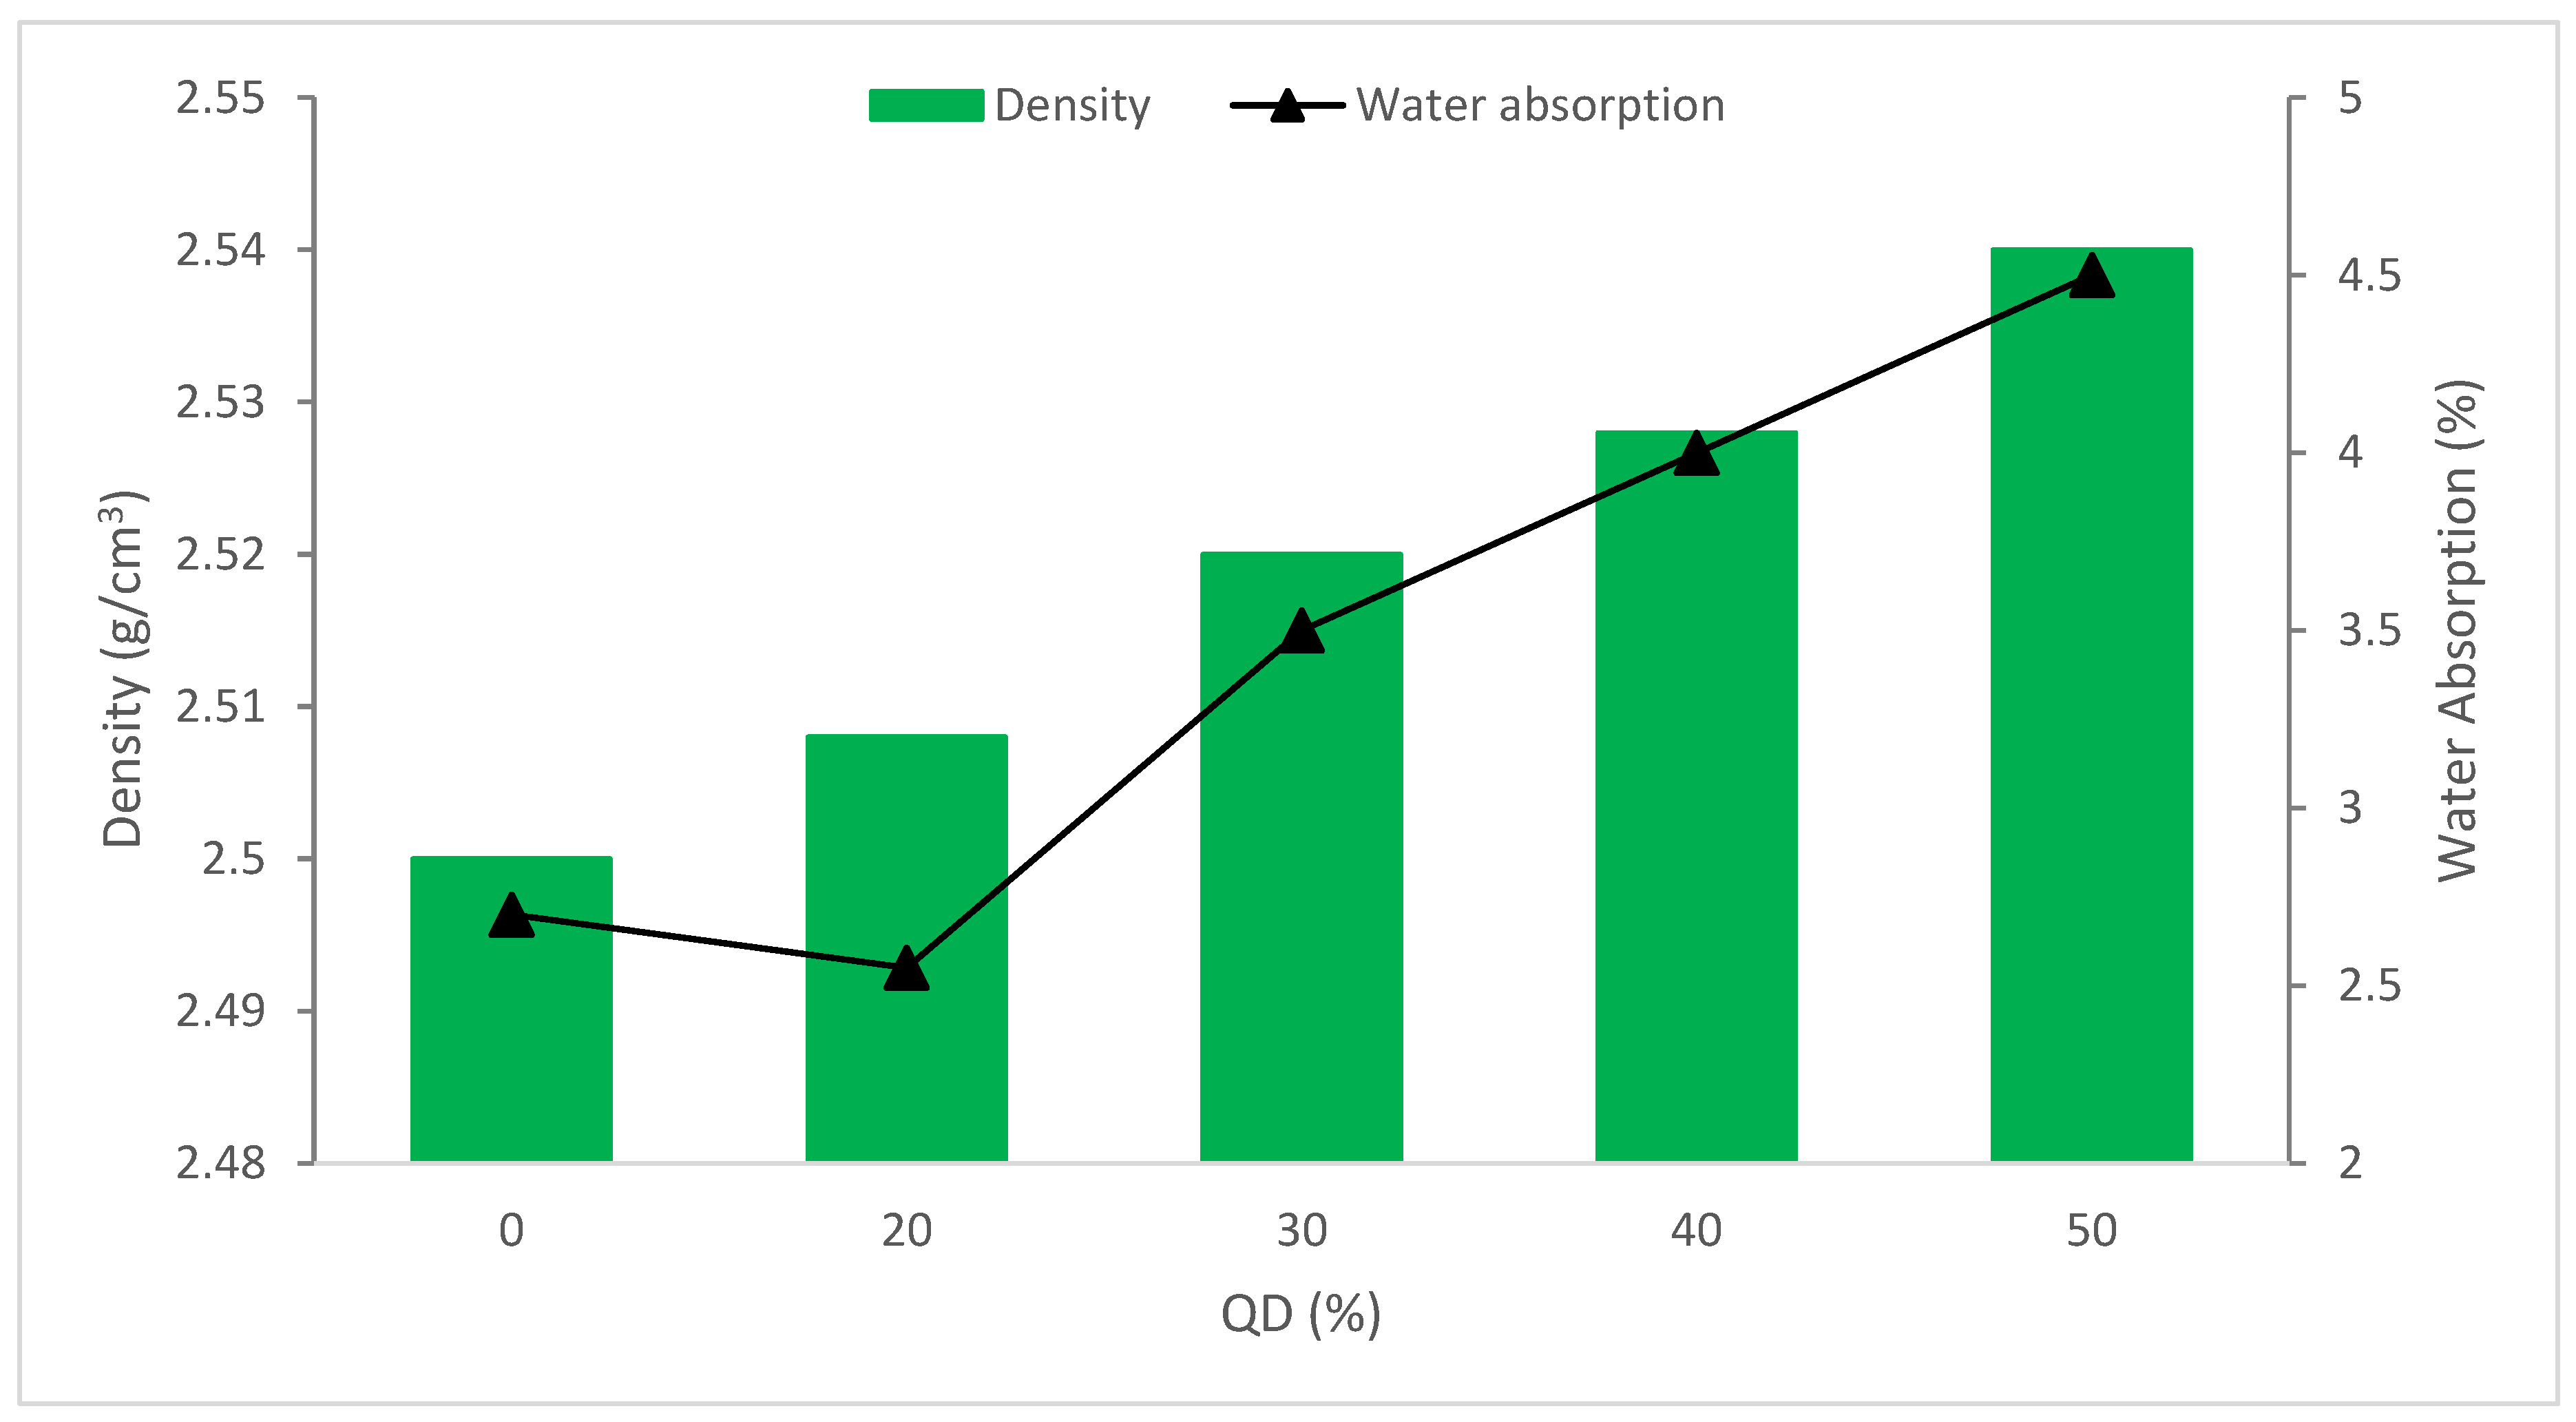
5.1. Density and Water Absorption
5.2. Permeability
5.3. Rapid Chloride Permeability Test (RCPT)
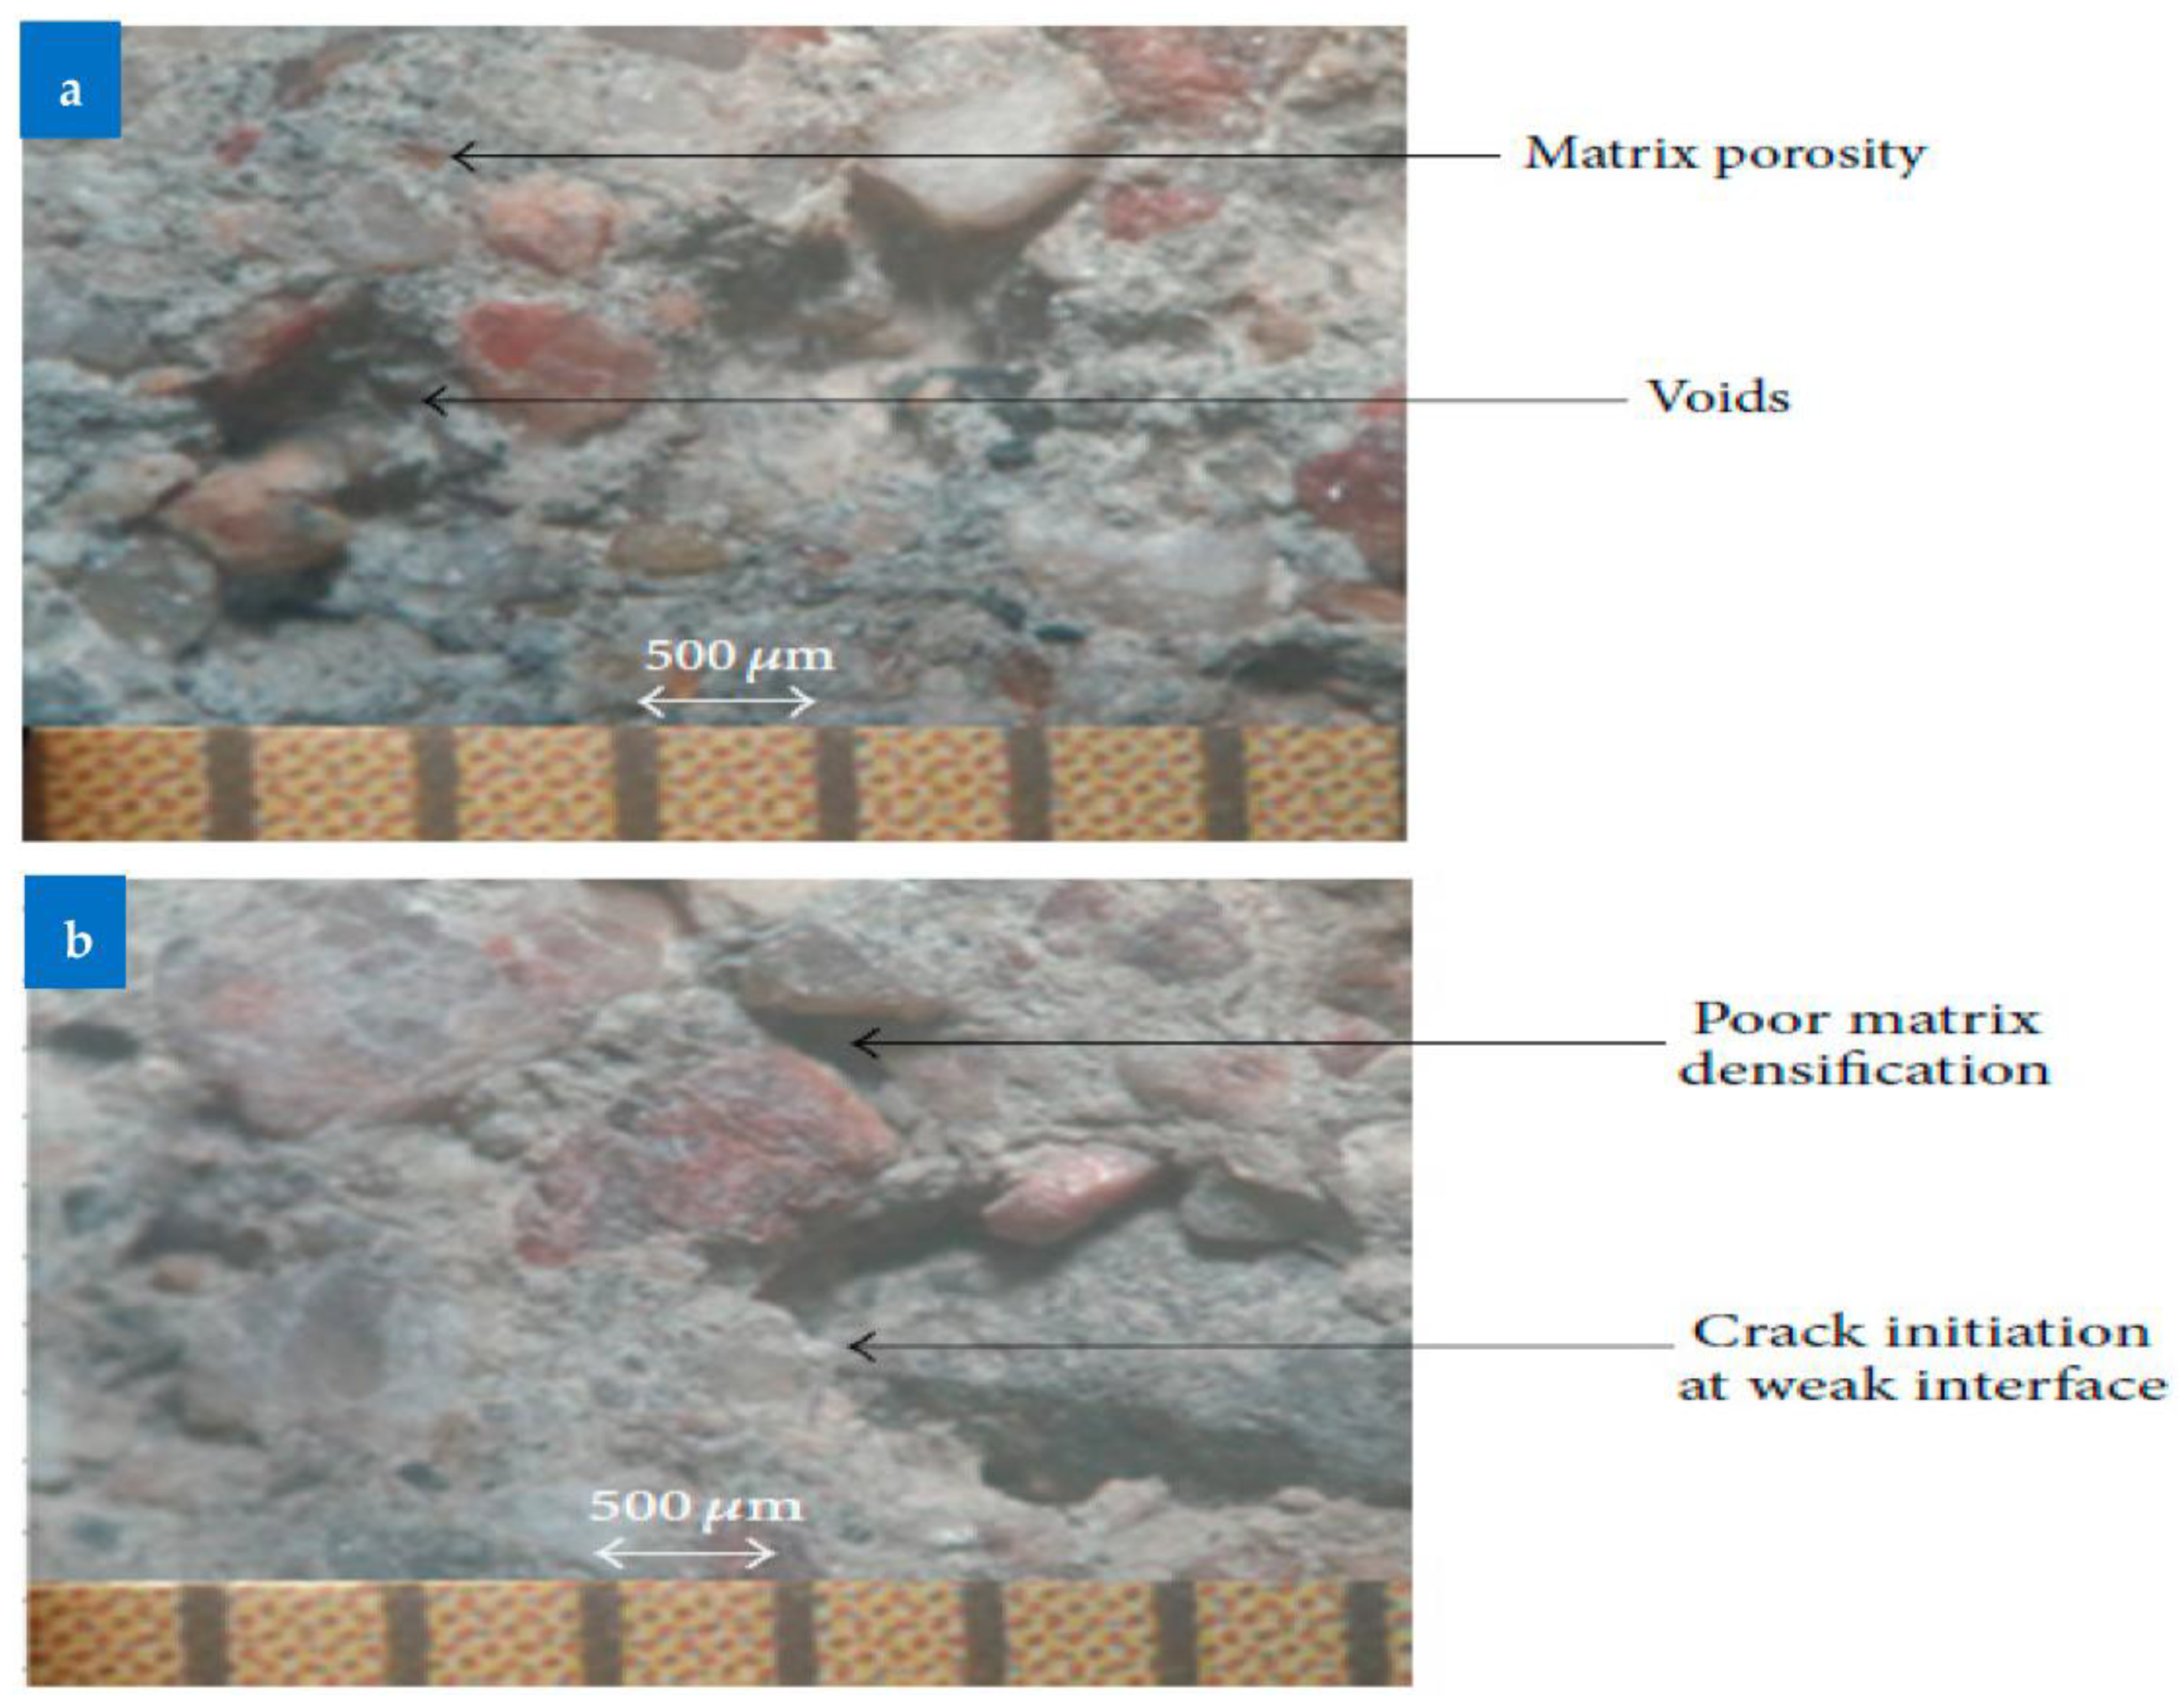
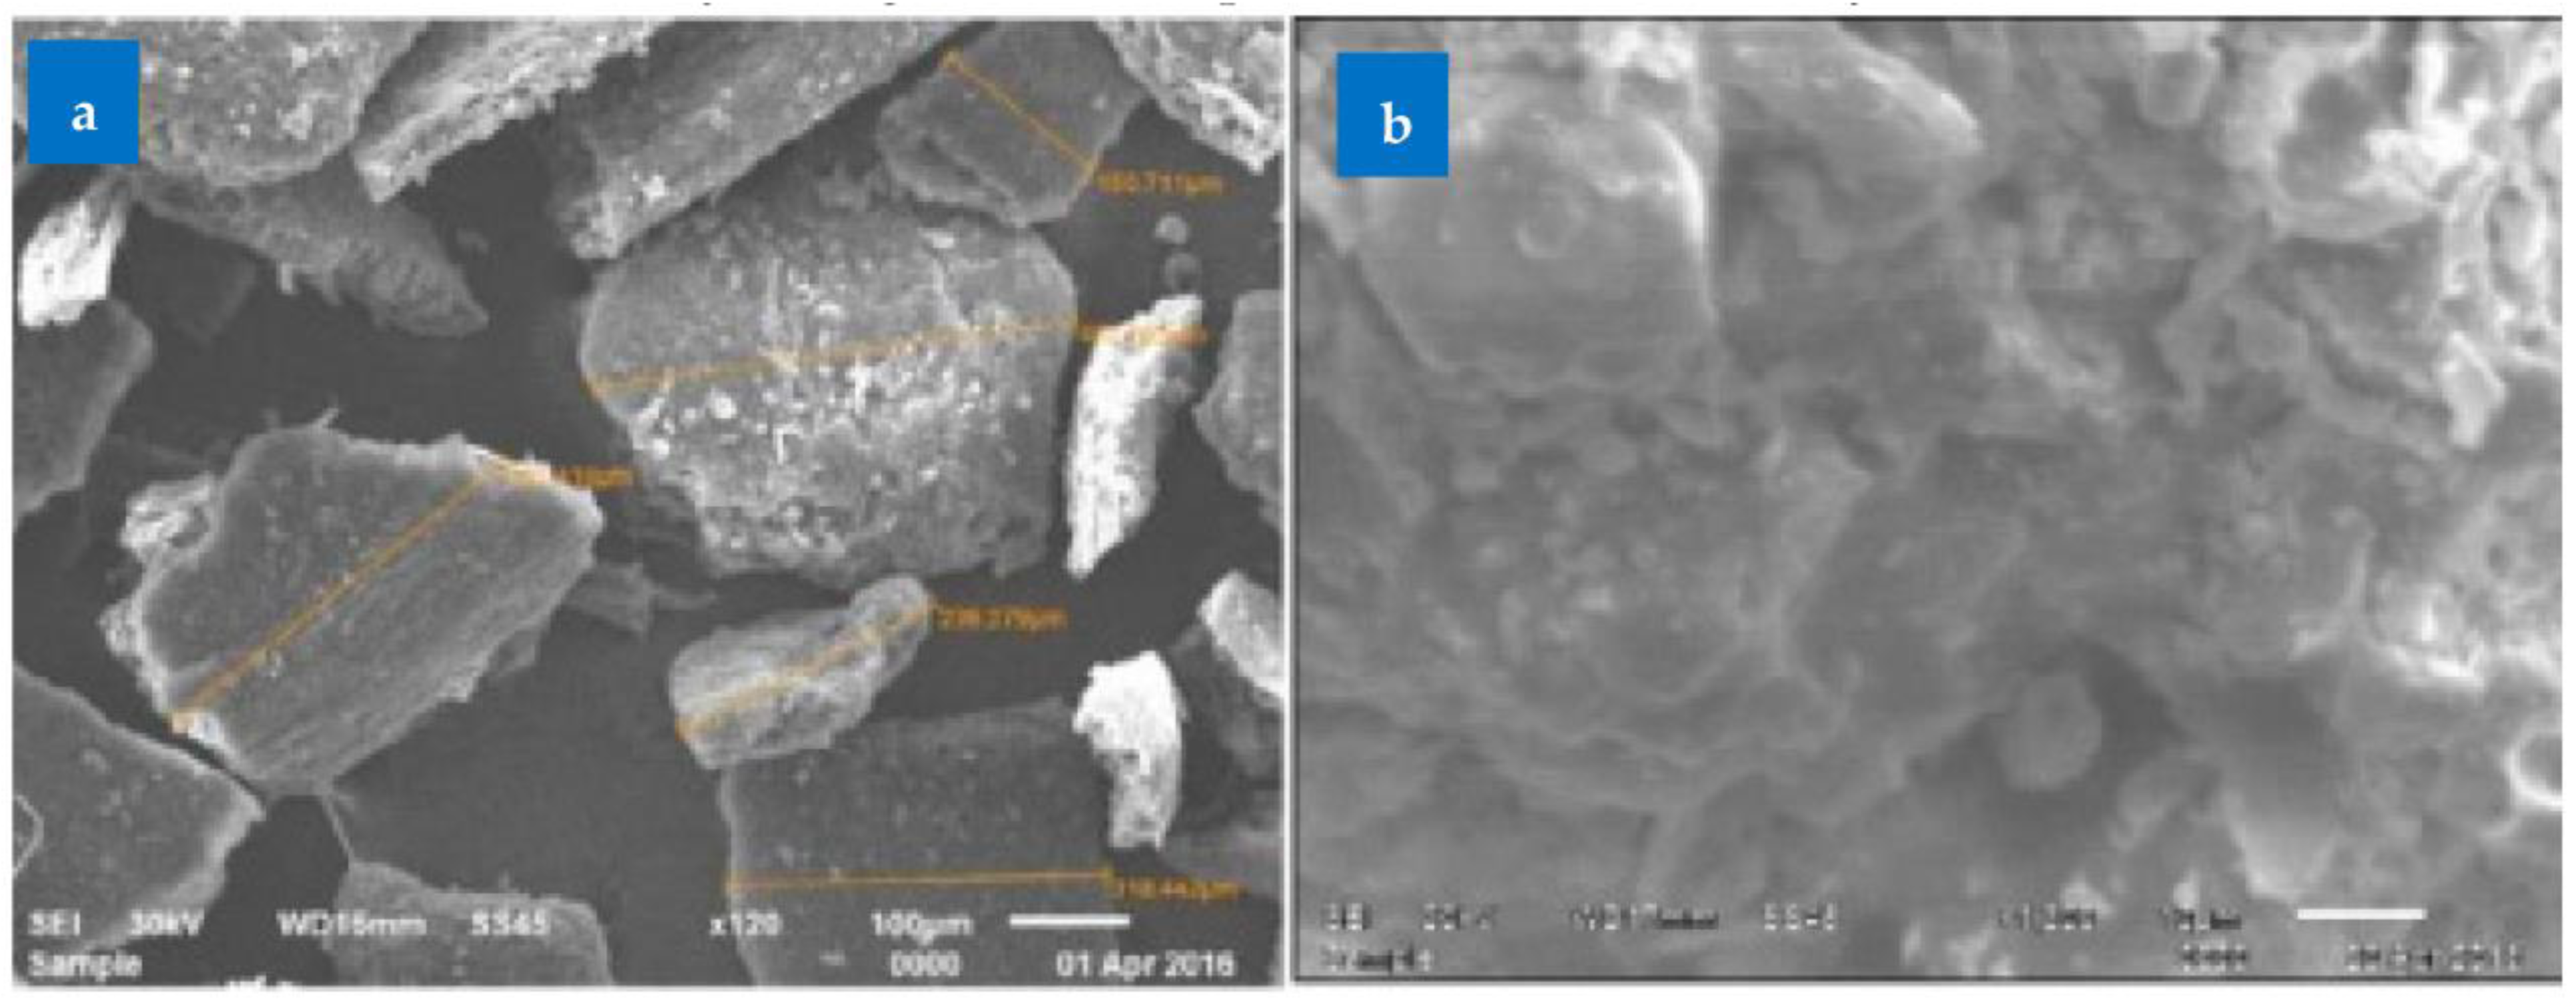
6. Scan Electronic Microscopy SEM
7. Conclusions
8. Recommendation
Author Contributions
Funding
Institutional Review Board Statement
Informed Consent Statement
Data Availability Statement
Conflicts of Interest
References
- Du Plessis, C. A Strategic Framework for Sustainable Construction in Developing Countries. Constr. Manag. Econ. 2007, 25, 67–76. [Google Scholar] [CrossRef]
- Kansal, K.G.R. Waste Glass Powder as a Partial Replacement of PPC. Int. J. Sci. Res. 2016, 5, 1414–1418. [Google Scholar]
- Oh, D.-Y.; Noguchi, T.; Kitagaki, R.; Park, W.-J. CO2 Emission Reduction by Reuse of Building Material Waste in the Japanese Cement Industry. Renew. Sustain. Energy Rev. 2014, 38, 796–810. [Google Scholar] [CrossRef]
- Lee, H.; Hanif, A.; Usman, M.; Sim, J.; Oh, H. Performance Evaluation of Concrete Incorporating Glass Powder and Glass Sludge Wastes as Supplementary Cementing Material. J. Clean. Prod. 2018, 170, 683–693. [Google Scholar] [CrossRef]
- Anwar, A. The Influence of Waste Glass Powder as a Pozzolanic Material in Concrete. Int. J. Civ. Eng. Technol. 2016, 7, 131–148. [Google Scholar]
- Alvee, A.R.; Malinda, R.; Akbar, A.M.; Ashar, R.D.; Rahmawati, C.; Alomayri, T.; Raza, A.; Shaikh, F.U.A. Experimental Study of the Mechanical Properties and Microstructure of Geopolymer Paste Containing Nano-Silica from Agricultural Waste and Crystalline Admixtures. Case Stud. Constr. Mater. 2022, 16, e00792. [Google Scholar] [CrossRef]
- Althoey, F.; El-Aal, A.K.A.; Shoukry, H.; Hakeem, I. Performance of Cement Mortars Containing Clay Exposed to High Temperature. Arab. J. Sci. Eng. 2021, 47, 1–9. [Google Scholar] [CrossRef]
- Naik, T.R. Sustainability of Concrete Construction. Pract. Period. Struct. Des. Constr. 2008, 13, 98–103. [Google Scholar] [CrossRef] [Green Version]
- Vigneshpandian, G.V.; Shruthi, E.A.; Venkatasubramanian, C.; Muthu, D. Utilisation of Waste Marble Dust as Fine Aggregate in Concrete. In IOP Conference Series: Earth and Environmental Science; IOP Publishing: Bristol, UK, 2017. [Google Scholar] [CrossRef] [Green Version]
- Ahmad, J.; Majdi, A.; Babeker Elhag, A.; Deifalla, A.F.; Soomro, M.; Isleem, H.F.; Qaidi, S. A Step towards Sustainable Concrete with Substitution of Plastic Waste in Concrete: Overview on Mechanical, Durability and Microstructure Analysis. Crystals 2022, 12, 944. [Google Scholar] [CrossRef]
- Althoey, F.; Farnam, Y. The Effect of Using Supplementary Cementitious Materials on Damage Development Due to the Formation of a Chemical Phase Change in Cementitious Materials Exposed to Sodium Chloride. Constr. Build. Mater. 2019, 210, 685–695. [Google Scholar] [CrossRef]
- Imbabi, M.S.; Carrigan, C.; McKenna, S. Trends and Developments in Green Cement and Concrete Technology. Int. J. Sustain. Built Environ. 2012, 1, 194–216. [Google Scholar] [CrossRef]
- Singh Shekhawat, B.; Aggarwal, V. Utilisation of Waste Glass Powder in Concrete-A Literature Review. Int. J. Innov. Res. Sci. Eng. Technol. 2007, 3297, 2319–8753. [Google Scholar]
- Nelson, J.; Grayson, D. World Business Council for Sustainable Development (WBCSD). In Corporate Responsibility Coalitions; Routledge: London, UK, 2017; pp. 300–317. [Google Scholar] [CrossRef]
- Humphreys, D. Long-Run Availability of Mineral Commodities. Miner. Econ. 2013, 26, 1–11. [Google Scholar] [CrossRef]
- Müller, N.; Harnisch, J. How to Turn Around the Trend of Cement Related Emissions in the Developing World. WWF—Lafarge Conserv. Partnersh. Gland. Switz. 2008. Available online: https://scholar.google.com/scholar?hl=en&as_sdt=0%2C5&q=16.%09Müller%2C+N.%3B+Harnisch%2C+J.+How+to+Turn+Around+the+Trend+of+Cement+Related+Emissions+in+the+Developing+World.+WWF—Lafarge+Conserv.+Partnersh.+Gland.+Switz.+2008.&btnG= (accessed on 2 September 2022).
- Smith, R.A.; Kersey, J.R.; Griffiths, P.J. The Construction Industry Mass Balance: Resource Use, Wastes and Emissions. Construction 2002, 4, 680. [Google Scholar]
- Sundaresan, S.; Ramamurthy, V.; Meyappan, N. Improving Mechanical and Durability Properties of Hypo Sludge Concrete with Basalt Fibres and SBR Latex. Adv. Concr. Constr. 2021, 12, 327–337. [Google Scholar]
- Prakash, R.; Thenmozhi, R.; Raman, S.N. Mechanical Characterisation and Flexural Performance of Eco-Friendly Concrete Produced with Fly Ash as Cement Replacement and Coconut Shell Coarse Aggregate. Int. J. Environ. Sustain. Dev. 2019, 18, 131–148. [Google Scholar] [CrossRef]
- Luhar, S.; Cheng, T.-W.; Nicolaides, D.; Luhar, I.; Panias, D.; Sakkas, K. Valorisation of Glass Wastes for the Development of Geopolymer Composites–Durability, Thermal and Microstructural Properties: A Review. Constr. Build. Mater. 2019, 222, 673–687. [Google Scholar] [CrossRef]
- Arshad, H.; Mansoor, M.S.; Shah, S.A.R.; Khan, M.M.; Raza, S.S.; Imtiaz, S.; Mansoor, J. Study of Mechanical Properties of Concrete Developed Using Metamorphosed Limestone Powder (MLSP), Burnt Clay Pozzolana (BCP) & Wood Ash (WA) as Partial Replacement of Cement. In Proceedings of the 1st Conference on Sustainability in Civil Engineering, Islamabad, Pakistan, 1 August 2019; Volume 1. [Google Scholar]
- Mehta, P.K. Greening of the Concrete Industry for Sustainable Development. Concr. Int. 2002, 24, 23–28. [Google Scholar]
- Ahmad, J.; Majdi, A.; Deifalla, A.F.; Isleem, H.F.; Rahmawati, C. Concrete Made with Partially Substitutions of Copper Slag (CPS): State of the Art Review. Materials 2022, 15, 5196. [Google Scholar] [CrossRef]
- Manasseh, J. Use of Crushed Granite Fine as Replacement to River Sand in Concrete Production. Leonardo Electron. J. Pract. Technol. 2010, 17, 85–96. [Google Scholar]
- Smirnova, O.M.; Menéndez Pidal de Navascués, I.; Mikhailevskii, V.R.; Kolosov, O.I.; Skolota, N.S. Sound-Absorbing Composites with Rubber Crumb from Used Tires. Appl. Sci. 2021, 11, 7347. [Google Scholar] [CrossRef]
- Dolamary, P.Y.; Dilshad, J.A.F.; Arbili, M.M.; Karpuzcu, M. Validation of Feret Regression Model for Fly Ash Based Geopolymer Concrete. Polytech. J. 2018, 8, 173–189. [Google Scholar]
- Jiang, Y.; Ling, T.-C.; Mo, K.H.; Shi, C. A Critical Review of Waste Glass Powder–Multiple Roles of Utilization in Cement-Based Materials and Construction Products. J. Environ. Manag. 2019, 242, 440–449. [Google Scholar] [CrossRef] [PubMed]
- Arel, H.Ş. Recyclability of Waste Marble in Concrete Production. J. Clean. Prod. 2016, 131, 179–188. [Google Scholar] [CrossRef]
- Mallum, I.; Lim, N.H.A.S.; Omolayo, N. Sustainable Utilization of Waste Glass in Concrete: A Review. Silicon 2021, 14, 3199–3214. [Google Scholar] [CrossRef]
- Feng, Y.; Zhang, Q.; Chen, Q.; Wang, D.; Guo, H.; Liu, L.; Yang, Q. Hydration and Strength Development in Blended Cement with Ultrafine Granulated Copper Slag. PLoS ONE 2019, 14, e0215677. [Google Scholar] [CrossRef]
- Taskin, A.; Fediuk, R.; Grebenyuk, I.; Elkin, O.; Kholodov, A. Effective Cement Binders on Fly and Slag Waste from Heat Power Industry of the Primorsky Krai, Russian Federation. Int. J. Sci. Technol. Res. 2020, 9, 3509–3512. [Google Scholar]
- Abdelgader, H.; Fediuk, R.; Kurpińska, M.; Elkhatib, J.; Murali, G.; Baranov, A.V.; Timokhin, R.A. Mechanical Properties of Two-Stage Concrete Modified by Silica Fume. Mag. Civ. Eng. [Инженернo-стрoительный журнал (Inzhenerno-stroitelnyy zhurnal)] 2019, 89, 26–38. [Google Scholar]
- Tchakouté, H.K.; Rüscher, C.H.; Hinsch, M.; Djobo, J.N.Y.; Kamseu, E.; Leonelli, C. Utilization of Sodium Waterglass from Sugar Cane Bagasse Ash as a New Alternative Hardener for Producing Metakaolin-Based Geopolymer Cement. Chem. Erde 2017, 77, 257–266. [Google Scholar] [CrossRef]
- Ahmad, J.; Kontoleon, K.J.; Majdi, A.; Naqash, M.T.; Deifalla, A.F.; Ben Kahla, N.; Isleem, H.F.; Qaidi, S.M.A. A Comprehensive Review on the Ground Granulated Blast Furnace Slag (GGBS) in Concrete Production. Sustainability 2022, 14, 8783. [Google Scholar] [CrossRef]
- Musa, M.F.; Mohammad, M.F.; Mahbub, R.; Yusof, M.R. Enhancing the Quality of Life by Adopting Sustainable Modular Industrialised Building System (IBS) in the Malaysian Construction Industry. Procedia-Soc. Behav. Sci. 2014, 153, 79–89. [Google Scholar] [CrossRef] [Green Version]
- Smirnova, O. Compatibility of Shungisite Microfillers with Polycarboxylate Admixtures in Cement Compositions. ARPN J. Eng. Appl. Sci. 2019, 14, 600–610. [Google Scholar]
- Ahmad, J.; Aslam, F.; Martinez-Garcia, R.; De-Prado-Gil, J.; Qaidi, S.M.A.; Brahmia, A. Effects of Waste Glass and Waste Marble on Mechanical and Durability Performance of Concrete. Sci. Rep. 2021, 11, 21525. [Google Scholar] [CrossRef] [PubMed]
- Xiao, Y.; Reuter, M.A.; Boin, U.D.O. Aluminium Recycling and Environmental Issues of Salt Slag Treatment. J. Environ. Sci. Health 2005, 40, 1861–1875. [Google Scholar] [CrossRef] [PubMed]
- Du, H.; Tan, K.H. Concrete with Recycled Glass as Fine Aggregates. ACI Mater. J. 2014, 111, 47–57. [Google Scholar] [CrossRef]
- Abdelli, H.E.; Mokrani, L.; Kennouche, S.; de Aguiar, J.B. Utilization of Waste Glass in the Improvement of Concrete Performance: A Mini Review. Waste Manag. Res. J. Sustain. Circ. Econ. 2020, 38, 1204–1213. [Google Scholar] [CrossRef] [PubMed]
- Tamanna, N.; Tuladhar, R.; Sivakugan, N. Performance of Recycled Waste Glass Sand as Partial Replacement of Sand in Concrete. Constr. Build. Mater. 2020, 239, 117804. [Google Scholar] [CrossRef]
- Lenka, B.P.; Majhi, R.K.; Singh, S.; Nayak, A.N. Eco-Friendly and Cost-Effective Concrete Utilizing High-Volume Blast Furnace Slag and Demolition Waste with Lime. Eur. J. Environ. Civ. Eng. 2021, 26, 5351–5373. [Google Scholar] [CrossRef]
- Mahinroosta, M.; Allahverdi, A. Hazardous Aluminum Dross Characterization and Recycling Strategies: A Critical Review. J. Environ. Manag. 2018, 223, 452–468. [Google Scholar] [CrossRef]
- Jagadeesh, P.; Kumar, P.S.; Prakash, S.S. V Influence of Quarry Dust on Compressive Strength of Concrete. Indian J. Sci. Technol. 2016, 9. [Google Scholar] [CrossRef]
- Sudheer, P.; Reddy, M.G.M.; Adiseshu, S. An Experimental Study on Strength of Hybrid Mortar Synthesis with Epoxy Resin, Fly Ash and Quarry Dust under Mild Condition. Adv. Mater. Res. 2016, 5, 171. [Google Scholar] [CrossRef]
- Cohen, E.; Peled, A.; Bar-Nes, G. Dolomite-Based Quarry-Dust as a Substitute for Fly-Ash Geopolymers and Cement Pastes. J. Clean. Prod. 2019, 235, 910–919. [Google Scholar] [CrossRef]
- Rai, B.; Kumar, S.; Satish, K. Effect of Fly Ash on Mortar Mixes with Quarry Dust as Fine Aggregate. Adv. Mater. Sci. Eng. 2014, 2014, 626425. [Google Scholar] [CrossRef] [Green Version]
- Shyam Prakash, K.; Rao, C.H. Study on Compressive Strength of Quarry Dust as Fine Aggregate in Concrete. Adv. Civ. Eng. 2016, 2016, 1742769. [Google Scholar] [CrossRef] [Green Version]
- Galetakis, M.; Soultana, A. A Review on the Utilisation of Quarry and Ornamental Stone Industry Fine By-Products in the Construction Sector. Constr. Build. Mater. 2016, 102, 769–781. [Google Scholar] [CrossRef]
- Febin, G.K.; Abhirami, A.; Vineetha, A.K.; Manisha, V.; Ramkrishnan, R.; Sathyan, D.; Mini, K.M. Strength and Durability Properties of Quarry Dust Powder Incorporated Concrete Blocks. Constr. Build. Mater. 2019, 228, 116793. [Google Scholar] [CrossRef]
- Cheah, C.B.; Lim, J.S.; Ramli, M.B. The Mechanical Strength and Durability Properties of Ternary Blended Cementitious Composites Containing Granite Quarry Dust (GQD) as Natural Sand Replacement. Constr. Build. Mater. 2019, 197, 291–306. [Google Scholar] [CrossRef]
- Chitlange, M.R.; Pajgade, P.S. Strength Appraisal of Artificial Sand as Fine Aggregate in SFRC. ARPN J. Eng. Appl. Sci. 2010, 5, 34–38. [Google Scholar]
- Mir, A.H. Improved Concrete Properties Using Quarry Dust as Replacement for Natural Sand. Int. J. Eng. Res. Dev. 2015, 11, 46–52. [Google Scholar]
- Devi, M.; Kannan, K. Analysis of Strength and Corrosion Resistance Behavior of Inhibitors in Concrete Containing Quarry Dust as Fine Aggregate. J. Eng. Appl. Sci. 2011, 6, 124–135. [Google Scholar]
- Ephraim, M.E.; Akobo, I.Z.S.; Ukpata, J.O.; Akeke, G.A. Structural Properties of Concrete Containing Lateritic Sand and Quarry Dust as Fine Aggregates. Adv. Civ. Eng. Build. Mater 2012, 325–328. [Google Scholar]
- Elseknidy, M.H.; Salmiaton, A.; Nor Shafizah, I.; Saad, A.H. A Study on Mechanical Properties of Concrete Incorporating Aluminum Dross, Fly Ash, and Quarry Dust. Sustainability 2020, 12, 9230. [Google Scholar] [CrossRef]
- Subbulakshmi, T.; Vidivelli, B. Mechanical Properties of High Performance Concrete in Corporating with Quarry Wastes. IJEAT 2014, 3, 231–236. [Google Scholar]
- Kapgate, S.S.; Satone, S.R. Effect of Quarry Dust as Partial Replacement of Sand in Concrete. Indian streams Res. J. 2013, 3, 1–8. [Google Scholar]
- Safiddine, S.; Amokrane, K.; Debieb, F.; Soualhi, H.; Benabed, B.; Kadri, E.-H. How Quarry Waste Limestone Filler Affects the Rheological Behavior of Cement-Based Materials. Appl. Rheol. 2021, 31, 63–75. [Google Scholar] [CrossRef]
- Zhao, S.; Fan, J.; Sun, W. Utilization of Iron Ore Tailings as Fine Aggregate in Ultra-High Performance Concrete. Constr. Build. Mater. 2014, 50, 540–548. [Google Scholar] [CrossRef]
- Dehwah, H.A.F. Mechanical Properties of Self-Compacting Concrete Incorporating Quarry Dust Powder, Silica Fume or Fly Ash. Constr. Build. Mater. 2012, 26, 547–551. [Google Scholar] [CrossRef]
- Bahoria, B.V.; Parbat, D.K.; Nagarnaik, P.B.; Waghe, U.P.; Principal, Y. Sustainable Utilization of Quarry Dust and Waste Plastic Fibers as a Sand Replacement in Conventional Concrete. In Proceedings of the International Conference on Sustainable Civil Infrastructure, ICSCI, Hyderabad, India, 17–18 October 2014. [Google Scholar]
- Manimaran, A.; Somasundaram, M.; Ravichandran, P.T. Experimental Study on Partial Replacement of Coarse Aggregate by Bamboo and Fine Aggregate by Quarry Dust in Concrete. Int. J. Civ. Eng. Technol. 2017, 8, 1019–1027. [Google Scholar]
- Malik, M.I.; Jan, S.R.; Peer, J.A.; Nazir, S.A.; Mohammad, K.F. Study of Concrete Involving Use of Quarry Dust as Partial Replacement of Fine Aggregates. IOSR J. Eng. 2015, 5, 8–13. [Google Scholar] [CrossRef]
- Ahmad, J.; Zaid, O.; Shahzaib, M.; Abdullah, M.U.; Ullah, A.; Ullah, R. Mechanical Properties of Sustainable Concrete Modified by Adding Marble Slurry as Cement Substitution. AIMS Mater. Sci. 2021, 8, 343–358. [Google Scholar] [CrossRef]
- Shalabi, F.I.; Mazher, J.; Khan, K.; Alsuliman, M.; Almustafa, I.; Mahmoud, W.; Alomran, N. Cement-Stabilized Waste Sand as Sustainable Construction Materials for Foundations and Highway Roads. Materials 2019, 12, 600. [Google Scholar] [CrossRef] [PubMed] [Green Version]
- Ahmad, J.; Martínez-García, R.; De-Prado-Gil, J.; Irshad, K.; El-Shorbagy, M.A.; Fediuk, R.; Vatin, N.I. Concrete with Partial Substitution of Waste Glass and Recycled Concrete Aggregate. Materials 2022, 15, 430. [Google Scholar] [CrossRef]
- Heikal, M.; El-Didamony, H.; Morsy, M.S. Limestone-Filled Pozzolanic Cement. Cem. Concr. Res. 2000, 30, 1827–1834. [Google Scholar] [CrossRef]
- Barker, A.; Cory, H.P. The Early Hydration of Limestone-Filled Cements. In Proceedings of the International Conference on Blended Cements in Construction, Sheffield, UK, 9–12 September 1991. [Google Scholar]
- Taylor, H.F.W. High Temperature Chemistry. Cement Chemistry; Academic Press Ltd.: New York, NY, USA, 1990; pp. 28–32. [Google Scholar]
- Senff, L.; Labrincha, J.A.; Ferreira, V.M.; Hotza, D.; Repette, W.L. Effect of Nano-Silica on Rheology and Fresh Properties of Cement Pastes and Mortars. Constr. Build. Mater. 2009, 23, 2487–2491. [Google Scholar] [CrossRef]
- Lohani, T.K.; Padhi, M.; Dash, K.P.; Jena, S. Optimum Utilization of Quarry Dust as Partial Replacement of Sand in Concrete. Int. J. Appl. Sci. Eng. Res 2012, 1, 391–404. [Google Scholar]
- Krishnamoorthi, A.; Kumar, G.M. Properties of Green Concrete Mix by Concurrent Use of Fly Ash and Quarry Dust. IOSR J. Eng. 2013, 3, 48–54. [Google Scholar] [CrossRef]
- Ponnada, S.; Cheela, V.R.S.; Raju, S.G. Investigation on Mechanical Properties of Composite Concrete Containing Untreated Sea Sand and Quarry Dust for 100% Replacement of Fine Aggregate. Mater. Today Proc. 2020, 32, 989–996. [Google Scholar] [CrossRef]
- Jamale, A.H.; Kawade, U.R. Effect of Quarry Dust and Fly Ash Mix on Strength Properties of M40 Grade Concrete. Int. J. Eng. Res. Gen. Sci. 2015, 3, 391–397. [Google Scholar]
- Zhu, W.; Gibbs, J.C. Use of Different Limestone and Chalk Powders in Self-Compacting Concrete. Cem. Concr. Res. 2005, 35, 1457–1462. [Google Scholar] [CrossRef]
- Collepardi, M. Mechanical Properties of Self-Compacting and Flowing Concretes. In Proceedings of the Terence C. Holland Symposium on Advances in Concrete Technology, Warsaw, Poland, May 2007; pp. 379–384. Available online: https://www.encosrl.it/OLDSITE/pubblicazioni-scientifiche/pdf/scc/17.pdf (accessed on 2 September 2022).
- Aliyu, I.; Sulaiman, T.A.; Mohammed, A.; Kaura, J.M. Effect of Sulphuric Acid on the Compressive Strength of Concrete with Quarry Dust as Partial Replacement of Fine Aggregate. FUDMA J. Sci. 2020, 4, 553–559. [Google Scholar]
- Balamurugan, G.; Perumal, P. Behaviour of Concrete on the Use of Quarry Dust to Replace Sand–an Experimental Study. IRACST–Eng. Sci. Technol. An Int. J. 2013, 3, 2250–3153. [Google Scholar]
- Hameed, M.S.; Sekar, A.S.S. Properties of Green Concrete Containing Quarry Rock Dust and Marble Sludge Powder as Fine Aggregate. ARPN J. Eng. Appl. Sci 2009, 4, 83–89. [Google Scholar]
- Muhit, I.B.; Raihan, M.T.; Nuruzzaman, M.D. Determination of Mortar Strength Using Stone Dust as a Partially Replaced Material for Cement and Sand. Adv. Concr. Constr. 2014, 2, 249. [Google Scholar] [CrossRef]
- Saiyad, A.; Prajapati, K.; Chaudhari, D.; Kauswala, T. Experimental Study on Use of Quarry Dust and Fly Ash with Partial Replacement of Fine Aggregates and Cement in Concrete. Glob. Res. Dev. J. Eng. 2016, 1, 92–96. [Google Scholar]
- Gopalakrishnan, R.; Sounthararajan, V.M.; Mohan, A.; Tholkapiyan, M. The Strength and Durability of Fly Ash and Quarry Dust Light Weight Foam Concrete. Mater. Today Proc. 2020, 22, 1117–1124. [Google Scholar] [CrossRef]
- Ahmad, J.; Kontoleon, K.J.; Al-Mulali, M.Z.; Shaik, S.; Hechmi El Ouni, M.; El-Shorbagy, M.A. Partial Substitution of Binding Material by Bentonite Clay (BC) in Concrete: A Review. Buildings 2022, 12, 634. [Google Scholar] [CrossRef]
- Meisuh, B.K.; Kankam, C.K.; Buabin, T.K. Effect of Quarry Rock Dust on the Flexural Strength of Concrete. Case Stud. Constr. Mater. 2018, 8, 16–22. [Google Scholar] [CrossRef]
- Al Bakri, A.M.M.; Norazian, M.N.; Mohamed, M.; Kamarudin, H.; Ruzaidi, C.M.; Liyana, J. Strength of Concrete with Ceramic Waste and Quarry Dust as Aggregates. In Proceedings of the Applied Mechanics and Materials, Hong Kong, China, 17–18 August 2013; Trans Tech Publications: Stafa-Zurich, Switzerland, 2013; Volume 421, pp. 390–394. Available online: https://scholar.google.com/scholar?hl=en&as_sdt=0%2C5&q=86.%09Al+Bakri%2C+A.M.M.%3B+Norazian%2C+M.N.%3B+Mohamed%2C+M.%3B+Kamarudin%2C+H.%3B+Ruzaidi%2C+C.M.%3B+Liyana%2C+J.+Strength+of+Concrete+with+Ceramic+Waste+and+Quarry+Dust+as+Aggregates.+In+Proceedings+of+the+Applied+Mechanics+and+Materials%3B+Trans+Tech+Publ%3A+2013%3B+Volume+421%2C+pp.+390–394.&btnG= (accessed on 2 September 2022).
- Neville, A.M.; Brooks, J.J. Concrete Technology; Longman Scientific & Technical England: London, UK, 1987; Volume 438. [Google Scholar]
- Mehta, P.K. Concrete. Structure, Properties and Materials; Prentice Hall: Hoboken, NJ, USA, 1986. [Google Scholar]
- Rao, K.B.; Desai, V.B.; Mohan, D.J. Experimental Investigations on Mode II Fracture of Concrete with Crushed Granite Stone Fine Aggregate Replacing Sand. Mater. Res. 2012, 15, 41–50. [Google Scholar] [CrossRef] [Green Version]
- Khan, M.N.A.; Liaqat, N.; Ahmed, I.; Basit, A.; Umar, M.; Khan, M.A. Effect of Brick Dust on Strength and Workability of Concrete. In Proceedings of the IOP Conference Series: Materials Science and Engineering, Kuala Lumpur, Malaysia, 13–14 August 2018; IOP Publishing: Bristol, UK, 2018; Volume 414, p. 12005. [Google Scholar]
- Gunasekaran, K.; Praksah Chandar, S.; Annadurai, R.; Satyanarayanan, K.S. Augmentation of Mechanical and Bond Strength of Coconut Shell Concrete Using Quarry Dust. Eur. J. Environ. Civ. Eng. 2017, 21, 629–640. [Google Scholar] [CrossRef]
- Wellala, D.P.K.; Saha, A.K.; Sarker, P.K.; Rajayogan, V. Fresh and Hardened Properties of High-Strength Concrete Incorporating Byproduct Fine Crushed Aggregate as Partial Replacement of Natural Sand. Front. Struct. Civ. Eng. 2021, 15, 124–135. [Google Scholar] [CrossRef]
- Khan, N.; Chandrakar, R. An Experimental Study on Uses of Quarry Dust to Replace Sand in Concrete. Int. Res. J. Eng. Technol. 2017, 4, 1215–1217. [Google Scholar]
- Ahmad, J.; Aslam, F.; Zaid, O.; Alyousef, R.; Alabduljabbar, H. Mechanical and Durability Characteristics of Sustainable Concrete Modified with Partial Substitution of Waste Foundry Sand. Struct. Concr. 2021, 22, 2775–2790. [Google Scholar] [CrossRef]
- Humayun, M.; Ahad, M.Z.; Naveed, A.; Ahmad, F.; Arif, M.; Afridi, S.; Sadiq, M.; Jan, S.U.; Asif, M. Physical and Mechanical Characterization of Sand Replaced Stone Dust Concrete. Mater. Res. Express 2021, 8, 85507. [Google Scholar] [CrossRef]
- Sounthararajan, V.M.; Sivakumar, A. Durability Evaluation in Concrete Using Cracked Permeability and Chloride Permeability Tests. Adv. Mater. Sci. Eng. 2013, 2013, 754027. [Google Scholar] [CrossRef] [Green Version]
- Thomas, M.D.A.; Bamforth, P.B. Modelling Chloride Diffusion in Concrete: Effect of Fly Ash and Slag. Cem. Concr. Res. 1999, 29, 487–495. [Google Scholar] [CrossRef]
- 1202, A.C. Standard Test Method for Electrical Indication of Concrete’s Ability to Resist Chloride Penetration. In Annual Book of ASTM Standards; American Society of Testing and Materials West Conshohocken: West Conshohocken, PA, USA, 2009.


| Reference | [56] | [57] | [58] | [50] | [20] |
|---|---|---|---|---|---|
| Specific gravity | 2.75 | 2.83 | 2.50 | 1.74 | 2.60 |
| Water Absorption (%) | 2.91 | 1.50 | 0.50 | 2.34 | 1.3 |
| Fineness Modulus | 2.40 | 2.46 | 2.90 | - | - |
| Moisture Content (%) | 1.23 | - | - | - | - |
| Bulk density (kg/m3) | 1730 | 1695 | - | 1550 | 1750 |
| Reference | [61] | [62] | [46] | [63] | [64] |
|---|---|---|---|---|---|
| SiO2 | 11.79 | 62.48 | 3.70 | 65.73 | 62.48 |
| Al2O3 | 2.17 | 18.72 | 1.7 | 19.31 | 18.72 |
| Fe2O3 | 0.68 | 6.54 | 0.96 | 1.39 | 6.54 |
| MgO | 1.80 | 2.56 | 18.30 | 1.47 | 2.56 |
| CaO | 45.7 | 4.83 | 74.8 | 2.79 | 4.83 |
| Na2O | 1.72 | - | 0.07 | 1.63 | - |
| K2O | 0.84 | 3.18 | 0.22 | 1.81 | 3.18 |
| Reference | Quarry Dust | Water to Binder Ratio | Optimum | Slump (mm) | Remarks |
|---|---|---|---|---|---|
| [56] | 0%, 10%, 20%, 30% and 40% | 0.45 | 20% | 88, 109, 110, 94 and 89 | Increased |
| [74] | 0%, 25%, 50%, 75% and 100% | 0.47 | - | 85, 60, 65, 70 and 70 | Decreased |
| [58] | 0%, 20%, 25%, 30% and 35% | 0.44 | 30% | 45, 50, 52, 58 and 60 | Increased |
| [72] | 0%, 20%, 30%, 40% and 50% | 0.55 | 30% | 37, 45, 50, 54 and 60 | Increased |
| [44] | 0%, 20%, 30%, 40% and 50% | 0.45 | 40% | M25 8, 9, 8, 8 and 7 M30 6, 9, 6, 6 and 6 | No effect |
| [64] | 0%, 10%, 20%, 30% and 40% | 0.45 | 30% | 60, 55, 35, 27 and 20 | Decreased |
| [75] | 0%, 15%, 35%, 55% and 75% | 0.40 | 35% | 95, 89, 78, 67 and 55 | Decreased |
| Reference | QD | Water to Binder Ratio | Optimum | Flexure Strength (MPa) |
|---|---|---|---|---|
| [56] | 0%, 10%, 20%, 30% and 40% | 0.45 | 20% | 7 Days 3.2, 5.0, 5.2, 4.5 and 4.0 28 Days 6.0, 7.0, 7.5, 6.5 and 6.0 |
| [74] | 0%, 25%, 50%, 75% and 100% | 0.47 | - | 28 Days 3.9, 2.9, 3.1, 3.5, 3.6 and 3.8 |
| [57] | 0%, 50% and 100% | 0.53 | 50% | 28 Days 6.25, 6.41 and 6.30 60 Days 6.60, 7.32 and 6.68 |
| [58] | 0%, 20%, 25%, 30% and 35% | 0.44 | 30% | 7 Days 4.4, 4.2, 4.1, 3.5 and 3.1 28 Days 5.1, 5.0, 4.4, 4.3 and 3.5 |
| [72] | 0%, 20%, 30%, 40% and 50% | 0.55 | 30% | 7 Days 3.8, 3.5, 2.7, 2.2 and 1.9 28 Days 5.0, 4.8, 4.4, 3.5 and 2.9 91 Days 5.4, 5.1, 4.8, 4.7 and 3.4 |
| [79] | 0%, 10%, 20%, 30%, 40%, 50%, 60%, 70%, 80%, 90% and 100% | 0.48 | 50% | 28 Days 3.66, 3.78, 3.84, 3.92, 4.05, 4.10, 4.03, 3.88, 3.85, 3.70, and 3.54 |
| [63] | 0%, 15, 20% and 25% | 0.40 | 15% | 7 Days 12, 11, 9.0 and 8.5 28 Days 12, 12.5, 11.5 and 10.5 |
| [75] | 0%, 15%, 35%, 55% and 75% | 0.40 | 35% | 28 Days 5.52, 6.25, 5.65, 5.48 and 5.18 |
| Reference | QD | Water to Binder Ratio | Optimum | Split Tensile Strength (MPa) |
|---|---|---|---|---|
| [56] | 0%, 10%, 20%, 30% and 40% | 0.45 | 20% | 7 Days 1.8, 2.2, 2.4, 2.2 and 2.1 28 Days 2.8, 3.2, 3.3, 3.2 and 3.1 |
| [74] | 0%, 25%, 50%, 75% and 100% | 0.47 | - | 28 Days 4.2, 3.2, 3.5, 3.8, 4.0 and 4.1 |
| [58] | 0%, 20%, 25%, 30% and 35% | 0.44 | 30% | 7 Days 2.5, 2.3, 2.2, 2.0 and 2.0 28 Days 2.7, 2.5, 2.3, 2.2 and 2.1 |
| [72] | 0%, 20%, 30%, 40% and 50% | 0.55 | 30% | 7 Days 2.2, 2.0, 1.7, 1.6 and 1.6 28 Days 2.6, 2.5, 2.4, 2.3 and 2.3 91 Days 3.4, 3.5, 3.2, 3.1 and 3.1 |
| [50] | 0%, 20%, 40%, 60% and 80% | 0.56 | 60% | 28 Days 2.7, 3.3, 2.6, 2.4 and 1.7 |
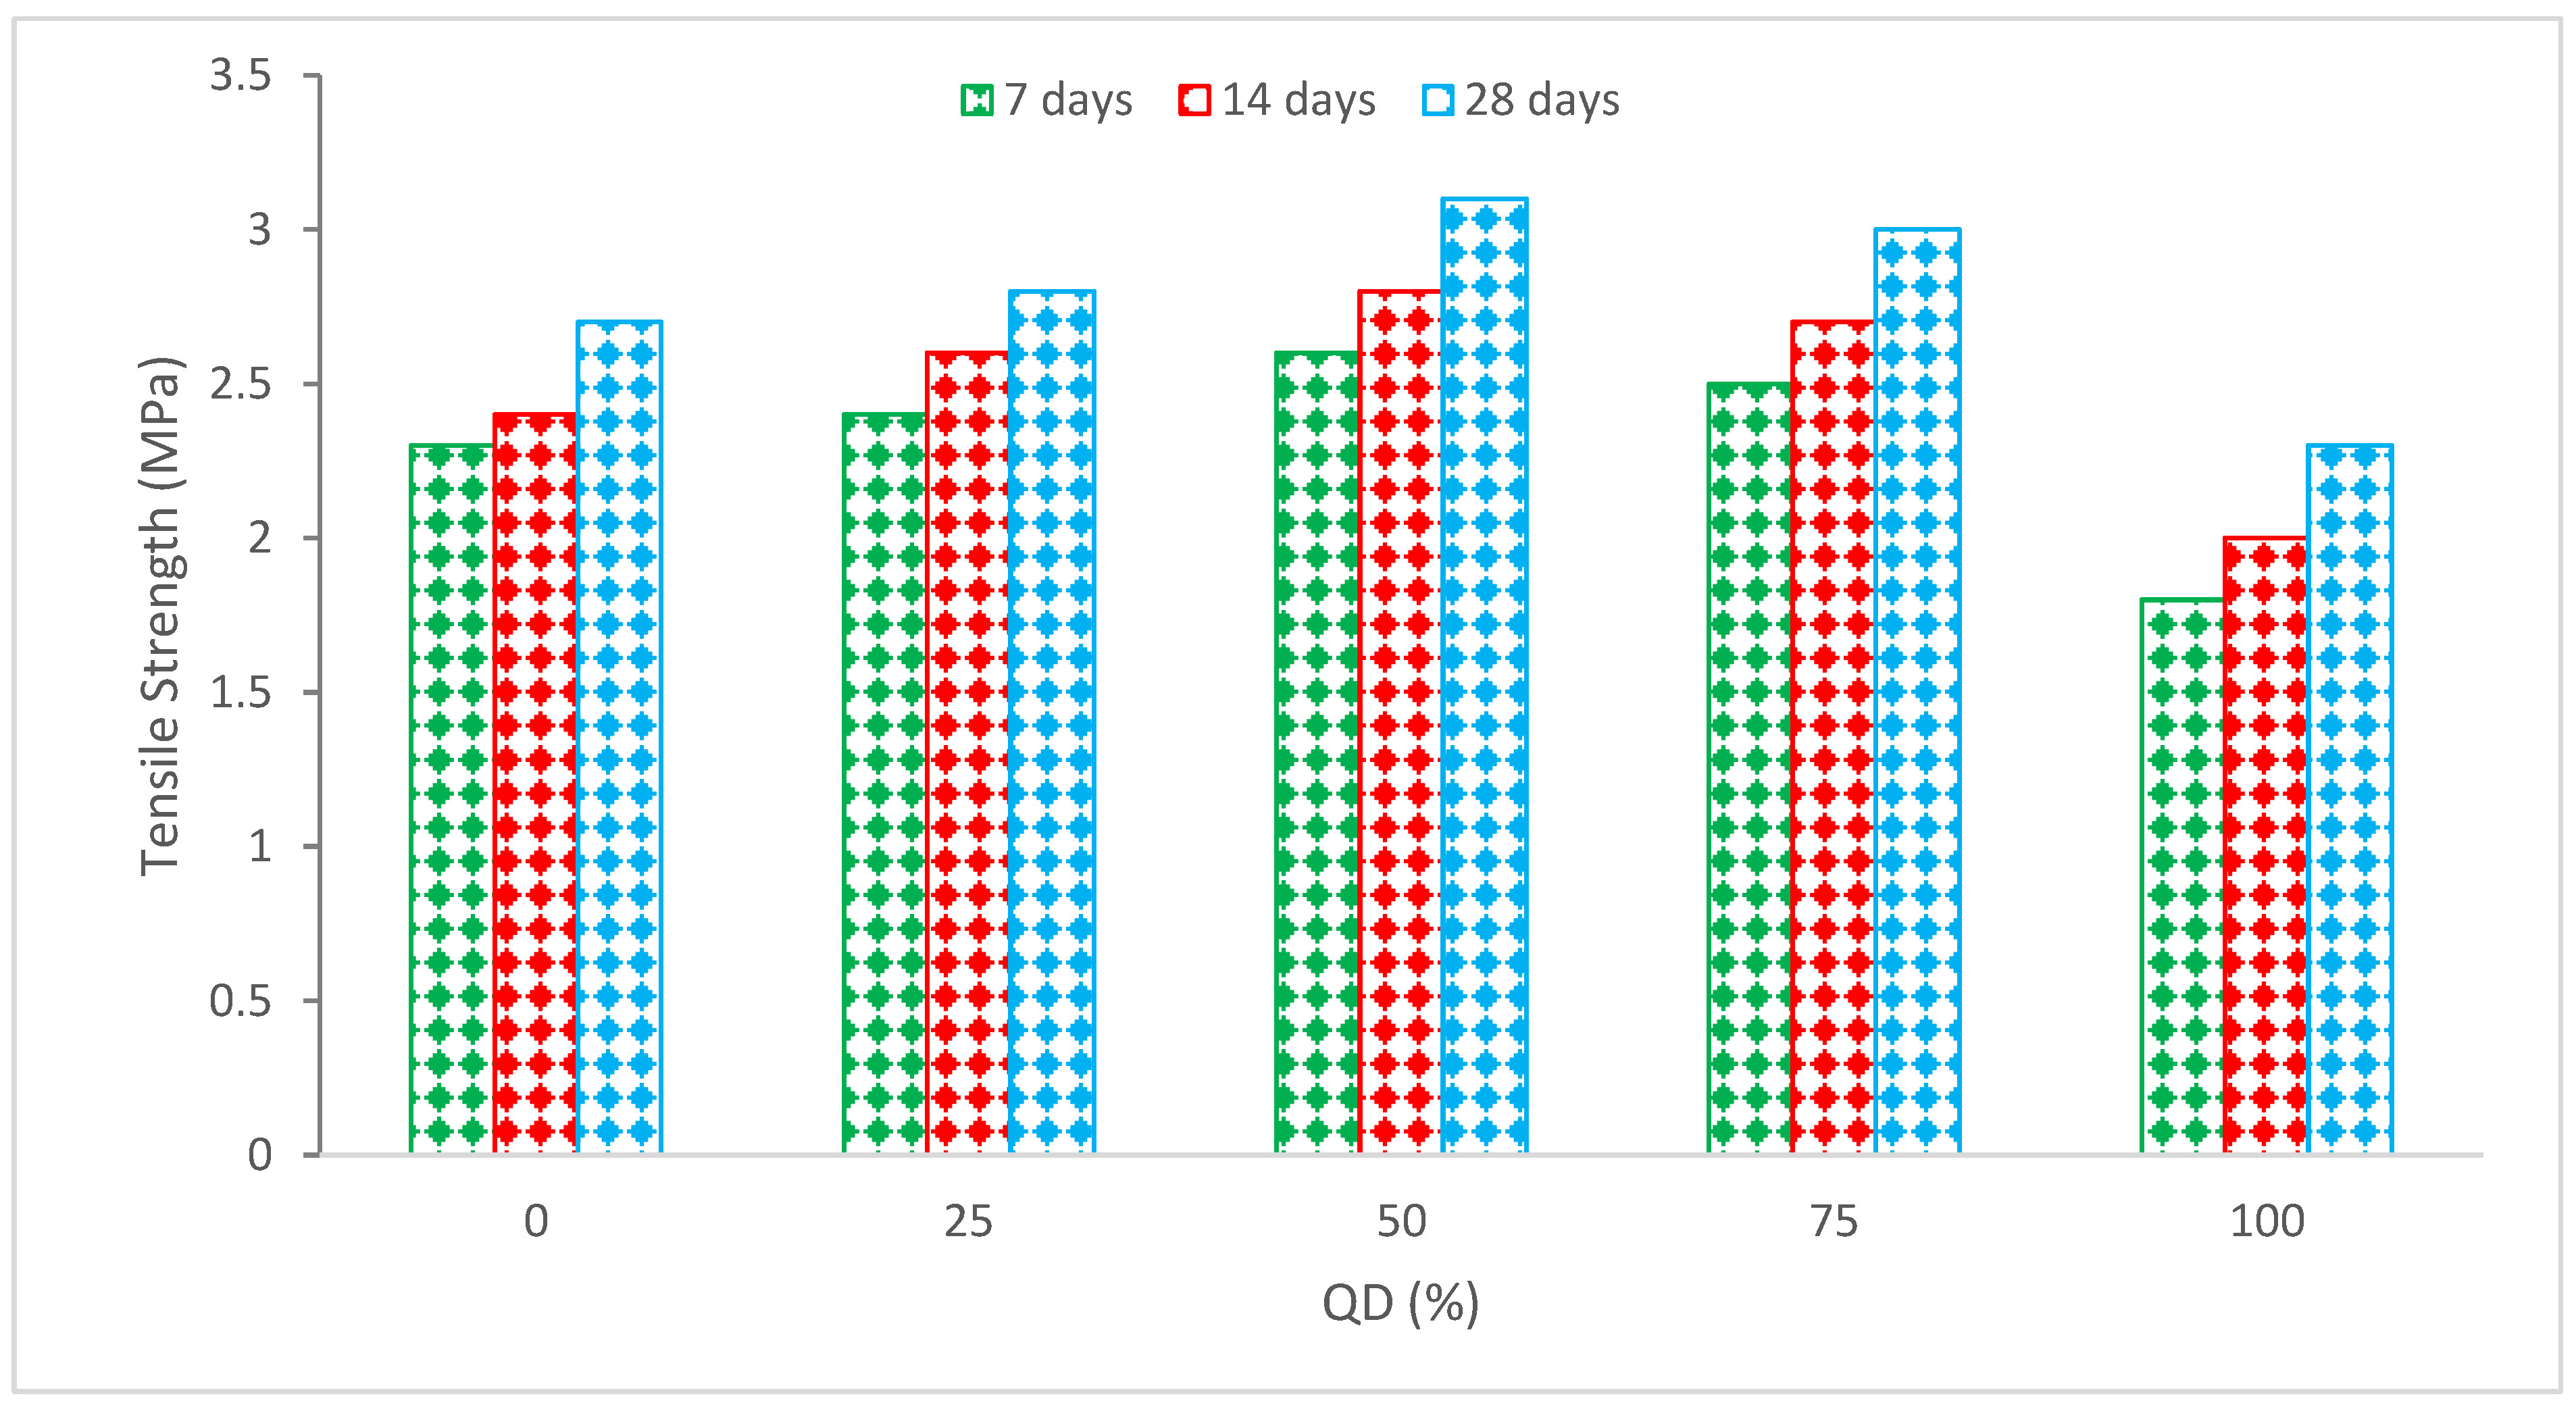
| [62] | 0%, 25%, 50%, 75% and 100% | 0.45 | 50% | 7 Days 2.3, 2.4, 2.6, 2.5 and 1.8 14 Days 2.4, 2.6, 2.8, 2.7 and 2.0 28 Days 2.7, 2.8, 3.1, 3.0 and 2.3 |
| [79] | 0%, 10%, 20%, 30%, 40%, 50%, 60%, 70%, 80%, 90% and 100% | 0.48 | 50% | 28 Days 3.17, 3.29, 3.35, 3.44, 3.58, 3.63, 3.56, 3.40, 3.36, 3.20 and 3.03 |
| [63] | 0%, 15, 20% and 25% | 0.40 | 15% | 7 Days 5.0, 4.2, 3.8 and 3.3 28 Days 5.3, 5.2, 4.8 and 3.8 |
| [83] | 0%, 10%, 20%, 30%, 40% and 50% | 0.40 | - | 7 Days 1.2, 1.05, 0.75, 0.45, 0.41 and 0.39 28 Days 1.67, 1.35, 1.02, 0.87, 0.78 and 0.70 |
| [75] | 0%, 15%, 35%, 55% and 75% | 0.40 | 35% | 28 Days 4.24, 5.35, 4.74, 4.60, and 4.38 |
Publisher’s Note: MDPI stays neutral with regard to jurisdictional claims in published maps and institutional affiliations. |
© 2022 by the authors. Licensee MDPI, Basel, Switzerland. This article is an open access article distributed under the terms and conditions of the Creative Commons Attribution (CC BY) license (https://creativecommons.org/licenses/by/4.0/).
Share and Cite
AL-Kharabsheh, B.N.; Moafak Arbili, M.; Majdi, A.; Ahmad, J.; Deifalla, A.F.; Hakamy, A.; Majed Alqawasmeh, H. Feasibility Study on Concrete Made with Substitution of Quarry Dust: A Review. Sustainability 2022, 14, 15304. https://doi.org/10.3390/su142215304
AL-Kharabsheh BN, Moafak Arbili M, Majdi A, Ahmad J, Deifalla AF, Hakamy A, Majed Alqawasmeh H. Feasibility Study on Concrete Made with Substitution of Quarry Dust: A Review. Sustainability. 2022; 14(22):15304. https://doi.org/10.3390/su142215304
Chicago/Turabian StyleAL-Kharabsheh, Buthainah Nawaf, Mohamed Moafak Arbili, Ali Majdi, Jawad Ahmad, Ahmed Farouk Deifalla, A. Hakamy, and Hasan Majed Alqawasmeh. 2022. "Feasibility Study on Concrete Made with Substitution of Quarry Dust: A Review" Sustainability 14, no. 22: 15304. https://doi.org/10.3390/su142215304