
Road Tunnels Operation: Effectiveness of Emergency Teams as a Risk Mitigation Measure


1
Mobility and Transport Laboratory, Design Department, Politecnico di Milano, Via Candiani 72, 20158 Milano, Italy
2
Department of Chemistry, Materials and Chemical Engineering, Politecnico di Milano, Piazza Leonardo da Vinci 32, 20133 Milano, Italy
3
Strada dei Parchi S.p.A, Via G.V. Bona 105, 00156 Roma, Italy
*
Author to whom correspondence should be addressed.
Sustainability 2022, 14(23), 15491; https://doi.org/10.3390/su142315491
Submission received: 18 October 2022
/
Revised: 16 November 2022
/
Accepted: 18 November 2022
/
Published: 22 November 2022
(This article belongs to the Special Issue Human and Organizational Factors in Complex Systems)
Abstract
:Managing a major event in a road tunnel requires more resources than an open-air event. In the case of fire, the confined environment of road tunnels can represent a critical situation for both users and rescuers. The safety level of a tunnel can be estimated by using dedicated risk models that consider, on the one hand, the traffic (type, quantity and distribution) of a tunnel and, on the other hand, the structural and plant safety measures. According to the European Directive, road tunnel managers can adopt additional safety measures aimed at increasing the level of safety for users exposed to the consequences of an accidental event. One of these measures is the rapid intervention of emergency teams located in the proximity of the tunnel. These teams use pick-up and scooter vehicles properly equipped to cope with a fire event and have detailed knowledge of the specific tunnel system. A further advantage of the emergency teams is the possibility of supporting the evacuation of tunnel users by providing indications on emergency exits, bypasses and safe places considering the evolution of the specific event. In this perspective, the present research contributes to the evaluation of the emergency teams’ effectiveness. Thus, the emergency team was included as a safety measure within a risk analysis model for road tunnels developed by the authors in previous works. After an analysis of the technical and scientific literature, we focused on 15 interventions carried out on some highway tunnels in Italy between the year 2019 and the year 2021. The intervention times of the teams were analyzed using data provided by Strada dei Parchi S.p.A., a company that manages 14 highway tunnels in Italy. These 14 tunnels range in length from 589 m to 10,121 m and are subject to the European Directive. The observed intervention times of the emergency teams range between 2 min and 10 min with an average value of 5.9 min. Such a short intervention time is possible because emergency teams are in the proximity of the different tunnels. Because of the short intervention time and the training of the personnel, all the fires were properly managed by the teams. Furthermore, considering the results of the scientific literature and the data presented in this work, it was possible to estimate and validate an effectiveness value (higher than 90%) of the emergency teams to be used within the risk analysis model developed by the authors and which can also be used in other risk analysis models.
1. Introduction
Road tunnels are elements of a route that allow an improvement of the plano-altimetric coordination of road sections, reducing, for example, slopes, distances to be covered and fuel consumption, but, at the same time, they can represent a safety problem in the case of a major accidental event. Tunnels also play an important role in urban areas: they allow us to reorganize traffic in the city and thus to rethink city spaces, making them more people friendly [1].
In Europe, after the event in the Mont Blanc Tunnel in 1999, which caused 39 deaths and considerable structural damage, the European Community issued Directive 2004/54/EC on minimum safety requirements for tunnels in the TERN (Trans European Road Network) longer than 500 m [2]. Other tragic events took place in european tunnels, such as in the Gotthard (Switzerland), the Tauern (Austria) and the Fréjus (Italy–France) Road Tunnels in years 2001, 2002 and 2005, respectively. These events have further raised public and political awareness of the importance of a proper management of these infrastructures, underlining their importance on a human, economic and cultural level.
It is important to underline the fact that some European road tunnels entered into service many years ago. These tunnels were designed at a time when transport conditions were less challenging, but also knowledge and technical possibilities were very different from today. The regulations and technical standards for tunnel design and construction were also different from the current ones. Traffic volumes have grown significantly, and types of vehicles and the percentage of heavy vehicles have also changed: in some cases, the number of heavy vehicles accounts for as much as 50% of total vehicles.
The increase in traffic volume (light and heavy vehicles) can increase the likelihood of an accidental event while the presence of heavy vehicles can affect the consequences of the event: in general, heavy vehicles are characterized by large fire loads and thus have the potential to pose serious safety risks to tunnel users and to cause damage to the infrastructure.
Accidents in tunnels are rarer than on other open sections of the road network because the tunnel itself calms traffic [3]. In general, drivers passing through a tunnel reduce speed and increase the distance from the tunnel wall. Along short tunnels, with reduced driving speed, drivers’ vigilance and attention are higher than in longer tunnels because, in this case, monotonous driving can lead to boredom and fatigue [4,5,6,7,8]. The probability of an accident occurring in a tunnel is less (about half) than on open road sections [4]. However, the severity of the consequences of an accident in a tunnel can be significantly higher than on open sections of highway, as also reported by [9,10]. In addition, due to the confined environment, accidents in tunnels are often more difficult for rescue services to manage [11].
For this reason, the European Directive 2004/54/EC introduces the concept of a “tunnel system” that includes the interactions between (i) traffic, (ii) structural and plant equipment, (iii) management procedures, (iv) structural elements and (v) surroundings. In this regard, this paper is concerned with management procedures with a focus on emergency teams during a relevant event. An important element is the surrounding environment that could affect the accessibility of a tunnel by emergency services: for example, a tunnel located between two viaducts may not have alternate access routes. The accessibility of rescue vehicles must be taken into account when designing road tunnels [4].
The directive also requires risk analysis as a quantitative tool to evaluate the consequences of the fire scenarios that could occur as a result of accidental events. Therefore, risk analysis can be summarized as an analytical process that consists in identifying the answers to the following three questions [12,13]:
- What could happen inside the tunnel system?
- What is the probability of occurrence of the event?
- Having established that the event occurs, what are its possible consequences?
The various safety measures should allow potentially affected users to react immediately to avoid more serious consequences, for example, by escaping (evacuation), and at the same time ensure the effective action of the emergency services.
According to a report of the Ministry of Transport [14], more than 50% of Italian road tunnels belong to the TERN network [15]. The situation is multifaceted because there are new tunnels (built in the last decade), but also several tunnels designed and built decades ago. This situation implies that the modernization process of tunnels at national level requires enormous efforts from both organizational and economic points of view.
A major accident in a tunnel not only affects the users (exposed population) inside the tunnel but can also have short- or long-term social and economic effects that occur in a larger area (region or state) following the closure of the tunnel. These effects may be associated with the reduction in freight and passenger traffic (including tourists) and the increase in travel time caused by the detour of traffic to other alternative modes of transport. It is important to consider the potential impacts on the socio-economic system of one or several countries, depending on the relevance and location of a tunnel, which might be part of an interregional or cross-border corridor. In particular, direct and indirect economic losses should be considered in the event of an infrastructure disruption [16,17,18].
Consequently, by knowing the characteristics of a tunnel system it is possible to assess its resilience in the case of a major event, not only with reference to potential damage to tunnel users, but also to the effects of the more or less prolonged closure period necessary to return to normal traffic conditions.
The resilience of a transport infrastructure after a major event has been investigated in numerous studies, in some cases with specific reference to the assessment of the resilience of a road tunnel [19,20].
In the scientific literature, there are several definitions of resilience. One of these defines resilience as “the ability of an entity—for example, asset, organization, community, region—to anticipate, resist, absorb, respond, adapt and recover from a disruption” [21]. In fact, the resilience of a system can be defined through the analysis of the four components illustrated in Table 1.
With reference to a road tunnel, it is possible to study the resilience as shown in Figure 1. Following a relevant event (e.g., fire) the tunnel system is interrupted until the event is solved and the infrastructure is recovered for the safe passage of vehicles. The blue line represents the operation of the tunnel. The first horizontal section concerns a normal situation in which it is possible to implement the actions related to efficient preparedness [22].
The red symbol identifies the moment in which an unwanted event (accident) occurs: it can be observed that the blue curve goes down because the tunnel operation is influenced by the event. The traffic will be reduced or blocked, and the tunnel will not be available for a certain period of time.
During the management of the event, and mainly during the mitigation and response phases, emergency teams are activated and can provide a relevant contribution, especially in the case of fire: their intervention concerns the control/extinguishing of the fire and the assistance to users in the evacuation process [23]. In fact, one of the main factors related to emergency response is the proximity of the firefighter brigades [24]. More generally, for risk analysis, it is necessary to consider both the users’ human behavior and the effect of several safety measures available in the tunnel: these two aspects contribute to reduce or avoid the possibility that the evolution of the scenario may worsen, causing damage to people and infrastructure. Some authors investigated the behavior of tunnel users in presence of a fire inside road tunnels and developed models to investigate how occupants respond to a fire emergency [25,26,27].
In the present work, the aim is to analyze the effectiveness of emergency teams by taking into account two components of resilience: response and recovery. The emergency teams represent management measures that can be adopted to ensure an adequate level of safety. This kind of measure was adopted by some Italian tunnel managers during the tunnels’ modernization process to ensure an adequate level of safety. For instance, in the study of [28], a computational fluid dynamics (CFD) modeling is adopted to assess the effectiveness of emergency teams equipped with a micronized water system. Specifically, the process of evacuating users from a tunnel in the event of a fire was simulated to evaluate the use of an emergency vehicle equipped with a micronized water system to cope with a fire. The results of the study showed that the use of the micronized water system could improve environmental conditions during the egress by increasing visibility and reducing temperature, radiative heat flux and concentration of CO and CO2.
With reference to the concept of resilience, a computational fluid dynamics (CFD) model is developed in the work of [31] to analyze the effects of a tunnel serviceability recovery strategy that could affect user safety. Specifically, the user egress process is simulated to assess the level of risk for different types of fires; such fires could occur on the undisrupted lane of a partially closed tube tunnel because of a traffic accident or in the parallel tube if used for bidirectional traffic, i.e., in the case of complete closure of the tube involved in the accident.
The main aim of this work is to analyze and verify the value of the emergency teams’ effectiveness adopted in the risk analysis model developed by the authors [32,33,34]. In fact, in this model, the presence of emergency teams is also considered as a safety measure (thus it is included in the event tree). This work is done by considering and comparing the literature data and data collected on 14 Italian highway tunnels. The main novelty of this research is in the critical analysis of real data of emergency team interventions to quantitatively evaluate the effectiveness in the case of fires. In this way, it is possible to validate the developed risk analysis model and specifically to propose a value for the effectiveness of emergency teams that can also be used in other models. As better discussed in the next sections, the effectiveness of emergency teams depends on: (i) training of the personnel, (ii) quality and reliability of the equipment and (iii) intervention time. The training of the personnel includes not only the knowledge of firefighting methods but also of the specific tunnel system. A very important issue is the intervention time of the teams: it is the sum of activation and travel times, with the second contribution representing the time needed to reach the place where the accident occurred. The activation time depends on the type of detection systems available inside the tunnel. The travel time depends on the distance between the position of the accidental event (fire) inside the tunnel and location of the emergency teams (facility); this time could be affected by the traffic congestion that can reduce the speed of emergency teams. This work demonstrates that if the intervention time is limited (under specific thresholds) the effectiveness of well-equipped and trained emergency teams is very high. Under these assumptions, it is possible to adopt such value in a quantitative risk assessment model.
Moreover, from a practical point of view, the use of emergency teams must be evaluated according to the specific needs of the tunnel manager. For example, the emergency teams can be adopted at two typical cases: (i) during the process of modernizing a tunnel and thus during a road work when risk factors may increase and (ii) for tunnels characterized by specific risk factors (e.g., length, traffic, etc.), thus requiring additional safety measures.
The paper is organized as follows: (i) Section 2 (background), which deals with the analysis of the technical-scientific literature with reference to emergency team effectiveness and to the concept of resilience applied to road tunnels; (ii) Section 3, which analyzes and discusses the effectiveness of 15 emergency team interventions that occurred in tunnels belonging to the A24/A25 highways in central Italy; (iii) Section 4, in which there is a comparison of the acquired data on emergency team effectiveness with the literature data; and (iv) conclusions and further developments of the work.
2. Background
In a previous work, the authors analyzed the effect of the adoption of emergency teams as a measure to significantly reduce the societal risk of a representative highway road tunnel; the resulting F-N curves (i.e., representing the cumulated frequency of occurrence as a function of the predicted number of casualties) were compared to the ALARP (as low as reasonably practicable) acceptance criterion [35].
In the work of [36], safety in rescue operations is considered. In one-way tunnels, the tube not affected by an event can be used for the accessibility of rescue vehicles. In bidirectional tunnels, on the contrary, rescue service vehicles are forced to use the tunnel portals to reach the point where the event occurred. For all tunnels, the rescue service must arrive and start the emergency operation quickly, within 7 min, and then support the evacuation process of the users [36].
In the model proposed by Austrian Research Association for Roads, Railways and Transport (FSV), the fire service arrival time is considered. The arrival time is the lag time between the perception of an event and the arrival of the first emergency services in the location. This time is composed of the signaling time, alarming time and travel time. The impact of emergency teams in the FSV risk analysis is taken into account, considering average conditions: starting from practical experience the average arrival time of fire service is 15 min [37].
The PIARC (Permanent International Association of Road Congresses), within the Technical Committee C3.3 Road Tunnel Operations, dealt with the management of tunnel emergencies. The studies and analyses carried out on fires in road tunnels in recent decades indicate that it is possible to classify the development of fires in three categories:
- Category 1: even without external intervention, the power of these fires is unlikely to cause injury to tunnel users;
- Category 2: these fires are likely to cause casualties among tunnel users. Although they present considerable difficulties, the fire and rescue services are still able to intervene;
- Category 3: the power of these fires is so high that even well-equipped firefighters cannot risk an approach.
The heat release rate of a developing fire is related to its duration. Regardless of the duration of the fire, it is reasonable to estimate that a motorcycle or small car fire will remain in category 1 even without the intervention of the fire brigade. A truck fire may, for example, remain in category 1 for the first 3 or 4 min. Then, as the fire develops, it can move to category 2 for the next 8–10 min before moving to category 3 as shown in Figure 2. It should be noted that a major accident could instantly give rise to a fire category 2 or 3 [38].
Regarding the causes of fires in road tunnels, several researchers have addressed the topic. In the study by [39,40], it emerges that out of 69 road tunnel fires analyzed, 48 (69.6%) were single fires and 21 (30.4%) were collision-caused fires. This percentage is in line with a preliminary study conducted by [35] on 14 Italian highway tunnels.
ASFiNAG, the Austrian operator of highways and motorways, performed a study in the period 2006–2012 showing that about 90% of fires can be classified as spontaneous ignition, while 7% were caused by collisions [41].
The features of vehicle fires in Norwegian road tunnels that occurred from 2008 to 2011 are described in [42]. Specifically, the study analyzed the locations along the tunnel where fires occurred and showed that technical failures were the most frequent cause of fires and smoke cases (without fire) in heavy vehicles. Single-vehicle crashes and collisions are the most frequent cause of fires in vehicles weighing less than 3.5 tons.
A PIARC analysis [43] summarizes that vehicle failures (e.g., mechanical and electrical) are the leading cause of vehicle fires. The study also highlights the importance of considering the slope of the tunnel, the length of the sloping section and the slope of the sections leading into the tunnel as important characteristics able to affect the probability of a fire.
A statistical study on fires in Chinese road tunnels during 2000–2016 was performed [44] by considering causes, characteristics and consequences. The analysis showed that 62% of the fires were caused by vehicle technical failures (specifically, 22.2% were caused by engine fire, 17.7% by tire fire, 6.5% by electrical circuit fire and 15.7% by other vehicle technical problems). As for fires caused by collisions, the authors stated that this cause accounted for 18.3%, while 7.2% of fires were caused by spontaneous combustion of goods loaded on the vehicles. Finally, 12.4% were caused by undetermined causes.
A very recent study [45] analyzed 78 fires that occurred in Australian road tunnels longer than 1000 m and also confirmed that fires are often caused by mechanical failures. In fact, about 40% of the fires were caused by mechanical or engine failures (12% engine compartment and 28% mechanical). When looking at the types of vehicles involved in the fires, the study showed that 53.9% involved passenger cars, 18.4% light vehicles, 26.3% heavy vehicles and 1.3% multiple vehicles.
As described in several studies, one possible cause of fire involves the failure of the turbocharger in thermal engines. This component is characterized by two important aspects: high turbine rotation speed and high temperatures. It follows that a possible failure is sudden and, in most cases, there are no preliminary signs of failure. Figure 3 shows, as an example, a short time sequence of the fire of a heavy vehicle occurred in the alpine Fréjus Tunnel (Italy–France border) on29 November 2010. The left figure shows the presence of white smoke indicating a failure in the engine compartment of the truck. After one minute and 20 s, the fire seems to have developed and, after about 4 ½ min, the fire is clearly visible and smoke stratification in the upper part of the tunnel is also observed.
Several international studies confirm that placing emergency teams near tunnel portals (thus enabling their very rapid intervention) has significant benefits in terms of the effectiveness of the teams in controlling and possibly extinguishing a tunnel fire [39,46,47].
Analysis conducted within the work of [48] related to European and Japanese tunnels, in addition to CFD (Computational Fluid Dynamics) simulations, concluded that emergency teams should intervene within 7 min.
Emergency teams are effective if their intervention occurs in less than 10 min, according to the European Thematic Network FIT (Fire in Tunnels) [46]. This report also specifies that it is important that emergency teams have a clear understanding of the situation to conduct their operations in an effective way. This knowledge is more easily acquired by teams that are dedicated to a specific tunnel and that appropriately communicate with the control center [45]. The control center helps them by monitoring the development of the emergency scenario and by managing the ventilation system to facilitate their rapid intervention. An additional contribution of these emergency teams, beside their rapid intervention, is associated to their detailed knowledge of the tunnel system in terms of safety equipment, infrastructure and management procedures. Teams can thus operate to control or extinguish fires before they evolve into larger ones [47]. Emergency teams can also effectively support the egress of tunnel users, for example indicating the safest pathway to reach the nearest exit [46]. They can eventually support other rescue teams (i.e., fire brigades) during their intervention by providing specific information on the tunnel infrastructure and relevant indications on the evolution of the emergency scenario, thanks to their specific knowledge of the tunnel and the support provided by the control center via radio communication [46,47].
Another interesting issue is addressed in the study of [49]; the use of human reliability analysis (HRA) allows the estimation of human reliability with the aim of evaluating the performance of the tunnel operator in critical situations. Considering the organizational and human factors, it is possible, on one hand, to improve the studies of risk analysts, but more importantly, on the other hand, it is possible to estimate the uncertainty related to the variability of human performance. The result includes human factors, technical factors, physical environmental factors and socioeconomic environmental factors, all related to the prerequisites for emergency response. The authors state that to optimize survival rates and the health of the injured, as well as to provide a safe and effective working environment for emergency services, the event phase needs to be explored.
The evaluation of emergency preparedness and response in road tunnels is addressed in the work of [50]. The research proposes a quantitative approach for evaluating the effectiveness of emergency preparedness and management activities for accidents in road tunnels, considering the system from different points of view. Specifically, the authors propose the analytic hierarchy process (AHP) methodology that allows for quantitative comparison and evaluation of different variables and criteria.
In the study of [51], the response to mass casualty accidents in tunnels is addressed by considering the perspective of prehospital emergency medical services (EMS). The goal of the research concerns (i) classification of prerequisites for emergency response in the tunnel environment based on the Haddon matrix and (ii) identification of the specific knowledge of prehospital emergency medical services.
The study of [52] aims to investigate and analyze the level of knowledge and experience of medical services in the event of an event in the tunnel. The research included 11 interview participants from emergency service organizations and government and municipal organizations in Sweden. The results highlighted the importance of creating and improving networks among the stakeholders of the organizations involved and indicate that emergency medical personnel should also be more involved in the planning stages and exercises.
In the work of [39], several cases of tunnel fires were analyzed to evaluate the intervention time of the emergency teams. Furthermore, the effectiveness of the teams was evaluated with reference to their ability to control or extinguish the fires, and the intervention strategies were analyzed for different types of tunnels (e.g., one-way, two-way, type of ventilation strategies etc.). In addition, the study reports a historical analysis of road tunnel fires and analyzes the dynamics of the emergency scenario, the intervention teams’ effectiveness and the presence of victims.
On the basis of this historical analysis of the incidents, a classification of tunnels (I, II, III and IV) was proposed [39]. It allows the estimation of the maximum intervention times for the various cases of fire and for different types of tunnels and incidents, as described in Table 2. To guarantee that the intervention time is below a specific threshold, it is necessary to consider the tunnel’s length and the speed of the teams with the aim to identify the optimal location of the emergency teams. If the tunnel is very long, it is necessary to also place several emergency teams inside the tunnel (i.e., the Mont Blanc Tunnel) and/or to use an available carriageable bypass.
Considering the accident and fire data in tunnels analyzed by [39], fires that “self-develop” from the vehicle are more frequent (~70%), while 30% occur as a result of collisions, as shown in Table 3.
Based on this analysis, [39] developed the four fire scenario curves described in Table 4: A, B, C and D. These curves classify fires on the basis of their characteristics and the relative intervention strategies of emergency teams. Specifically, fires caused by collisions typically have more rapid development and, therefore, typically require less intervention time to be successfully controlled and possibly extinguished.
Figure 4 represents the time evolution of the four fire curves (A, B, C and D) and shows that the emergency teams must arrive and intervene in a sufficiently short time so that the fire does not reach large power, i.e., an HRR (heat release rate) that exceeds 20–30 MW. The fire curves named C and A in Figure 4 represent small fires that do not cause any fire spread and can be extinguished by the teams or even by some of the tunnel users. Fire curves C and A represent the evolution of scenarios D and B, respectively, following the intervention of the emergency teams.
Thus, Figure 4 identifies two characteristic times of emergency team intervention for fast-developing fires (curves C and D) and slow-developing fires (curves B and A). As shown in Table 3, fast-developing fires account for 30.4% of the total while slower-developing fires account for 69.6%. For fast-developing fires, emergency crews must respond within 8 min, while for other fires the response time must be less than 13 min.
Referring to the Mont Blanc Tunnel fire in 1999, it is reported that the fire was accessible up to 10 m after 13 min by a patrol officer. Although the fire developed into a catastrophic one (maximum HRR (heat release rate) of 200 MW), the fire could have been controlled if appropriate preparations were made.
With reference to the fire curves of Figure 4, in the work by [53], six full-scale fire experiments with HRR between 18 and 33 MW were conducted to evaluate the effectiveness of teams equipped with different fire control and extinguishing systems. It was observed that while the teams reached the fires in times ranging from 11 to 29 min, they were able to quickly extinguish the fires in times ranging from 15 s to 3 min.
With reference to the historical analysis of some events carried out by [39], there are cases in the literature of fires that occurred, even important ones, in which, although the time of intervention of the teams was greater than 15 min, it was still possible to extinguish the fire [39].
To better understand the evolution of a fire, two events that occurred in the San Rocco Tunnel (Italy) on 8 August 2016 and in the Gran Sasso Tunnel (Italy) on 16 April 2016 are shown as examples. In particular, Figure 5 and Figure 6 show the diagrams related to the position of the vehicles inside the tunnels; Figure 7 and Figure 8 show some TVCC images useful to describe the evolution of the event. Figure 7 clearly shows the prompt and effective intervention of the emergency team with a pick-up.
In terms of estimating impacts following an accident (relevant event), it is possible, for example, to consider the average daily traffic of each tunnel, as shown in Figure 9 for the San Rocco and Gran Sasso tunnels.
A tunnel accident, depending on the type of scenario, may result in a reduction (one or more closed lanes) or even a disruption in traffic (a closed tunnel). Considering the hourly traffic distribution in Figure 9 and the duration of the disruption, it is possible to estimate the mobility impacts in terms of vehicles potentially involved, as shown in Figure 10 and Figure 11 for the San Rocco and Gran Sasso tunnel events. These vehicles will need to be managed (e.g., directed to alternative routes or stopped at appropriate service areas) depending on the time of the event (e.g., rush hour). For both cases, the real traffic flow was considered, starting at the time when the accidental event occurred up to the recovery of the tunnel (all lanes open to traffic).
3. Analysis of the Interventions Carried out by the Emergency Teams of Strada dei Parchi S.p.A.
A comparison between the intervention times proposed in the scientific literature and those related to 14 Italian motorway tunnels analyzed in this work allows to identify a proper value for the emergency teams’ effectiveness that can be used in risk analysis models.
Strada dei Parchi S.p.A. manages the A24/A25 motorways located in central Italy for a total of about 281 km from Rome to Teramo and Pescara, across the Apennine Mountain range. The motorway network is characterized by two carriageways, each consisting of two lanes, traffic lane and overtaking, and a third emergency lane in the open-air sections. There are 14 tunnels longer than 500 m, for a total of 28 one-way tubes, as shown in Figure 12.
Table 5 shows the list of 28 single tubes and their respective lengths. It should be noted that 18 of these tubes are longer than 1000 m and 8 of them have lengths varying between about 2000 and 10,000 m.
To ensure a higher level of safety during the modernization work, emergency teams have been established near the tunnels since May 2019. Generally, each team consists of two operators under cover 24 h a day, 7 days a week, equipped with one scooter and one pick-up equipped for fire control and possible fire extinguishing. The personnel have specific qualifications such as “Emergency and first aid workers in confined tunnels/environments” (https://www.grupposerviziassociati.it (accessed on 17 November 2022)). The intervention of the personnel allows for prompt intervention on the site of the event with the possibility to control or extinguish a possible fire and support the egress of tunnel users. Figure 13 shows, as an example, the fire-fighting equipment and vehicles used by emergency teams and Figure 14 illustrates an example of a team located close to a tunnel entrance.
Table 6 shows a summary of the intervention times of emergency teams related to the events that occurred since May 2019 in some tunnels. For each event, it is possible to observe the time of detection of the event, the time of activation of the emergency team and the time of arrival of the emergency team on site. The intervention time of the emergency teams is calculated as the difference between the time of detection of the event and the time of arrival on site. It is noted that the average value recorded is about 5.9 min. Such a short intervention time is possible because emergency teams are in the proximity of the different tunnels.
The intervention time is indicative as it could be subject to variations related to the accident scenario and the subjectivity of the operational personnel who must communicate their arrival on site in an emergency. However, this time represents a valid reference for estimating the effectiveness of emergency teams for interventions in fire scenarios occurring in road tunnels that are carried out by properly trained and equipped personnel. Unfortunately, not all data are always available. All fires were managed by emergency teams, in some cases with the support of the fire brigade. Other important data concern the time needed to extinguish the fire; available data indicate an average time of about 14 min.
Figure 15 shows the different times to handle an event in the tunnel with reference to the traffic capacity. The event resolution time, i.e., the total period of time in which the tunnel is closed to traffic (capacity = 0), is important for estimating the impact of the event on the transportation network (e.g., alternate routes, heavy vehicle storage, etc.) [54]. With reference to the data in Table 6, it is worth noting that the average event resolution time is approximately 97 min.
A further analysis of the intervention times of the emergency teams was performed to evaluate the performance of the emergency teams. Figure 16 shows that out of 15 interventions performed, 80% were characterized by an intervention time of less than 8 min, while 20% of interventions required a time between 8 and 10 min.
4. Emergency Teams’ Effectiveness Evaluation
In the case of the 14 tunnels of the A24 and A25 highways in which the risk analysis was carried out, there are different situations depending on the type of tunnel (e.g., length and access for the transport of dangerous goods). The Gran Sasso Tunnel, where the transport of dangerous goods is prohibited, can be classified as Class I (see Table 2) as proposed by [39]. To classify the other tunnels with lengths between 589 m and 4557 m, it is necessary to consider the expected intervention times, the fast-developing fires, the slower-developing fires and their respective probabilities of occurrence, as shown in Figure 17.
Figure 17 shows that by adopting an intervention time limit of 10 min, two different situations arise in the risk analysis of the tunnels under study:
- Slower-developing fires, characterized by a probability of occurrence of about 70% (see Table 3), are always controlled/extinguished, as the time limit of 13 min is higher than the time limit adopted in the risk analysis (10 min);
- Fast-developing fires, which represent about 30%, are characterized by an intervention time limit of 8 min, lower than the time limit adopted in the risk analysis (10 min). It follows that about 80% of fast-developing fires can be controlled/extinguished.
With reference to Table 2 and Figure 17, the tunnels under study (with the exception of Gran Sasso, which belongs in Class I) can be classified according to the criterion of [38] in Class II and Class III. Class II includes all slower-developing fires and 80% of fast-developing (controlled/extinct) fires. Therefore, calculating the weighted average with the probability of occurrence of slow and rapid fires, proposed by [39] and reported in Table 3, about 94% of the cases of the tunnels under study are Class II. The remaining 6% belong to Class III. This value is obtained as follows:
where
Class II = FF × FFCE + SF × SFCE
- Class II is the percentage of tunnels in Class II;
- FF is the percentage of fast-developing fires;
- FFCE is the percentage of fast-developing fires controlled or extinguished;
- SF is the percentage of slow-developing fires;
- SFCE is the percentage of slow-developing fires controlled or extinguished.
Using these data, the percentage of tunnels in Class II is:
Class II = FF × FFCE + SF × SFCE = 30.4% × 80% + 69.6% × 100% = 94%
With respect to the classification of tunnels in Class III, it should be noted that noncontrollable fires are only rapid fires whose probability of occurrence, compared to slow fires, is 30.4%. It follows that noncontrollable fires are equal to:
where
NCF = Class III × FF = 6% × 30.4% = 1.8%
- NCF is the percentage of noncontrollable fires;
- Class III is the percentage of tunnels in Class III (100% − Class II = 100% − 94% = 6%);
- FF is the percentage of fast-developing fires.
This means that almost all (98.2%) fires can be potentially controlled or extinguished. This agrees with the data shown in Table 6: all 15 events were successfully managed by emergency teams.
According to the risk analysis model adopted in the 15 tunnels under study, two safety measures are considered in the fire event tree: (i) the presence of an emergency team and (ii) the availability of a water supply. The risk analysis model considers four different cases associated to a fire scenario, depending on the availability of two safety measures, as shown in Figure 18.
Figure 18 shows the evolution of an initial fire event (fire principle). Specifically, the probability that an initial fire evolves into larger fires is:
- CASE 1: 0.05 (5%) if the emergency team and water supply measures are present;
- CASE 2: 0.15 (15%) if the emergency team measure is not present, but the water supply measure is available;
- CASE 3: 0.10 (10%) if the emergency team measure is present, but the water supply measure is not available;
- CASE 4: 0.33 (33%) if both safety measures are not present.
By adopting an emergency team the probability of controlling or even extinguishing a fire principle reaches the highest value (i.e. 95%) if water supply is available (Case 1) or becomes 90% if water supply is not available (Case 3). Thus, in these two cases only 5% and 10% of fire principles will evolve into fires with a peak HRR ranging between 8 and 150 MW, as shown in Figure 19. This value represents the power during the fully developed fire phase. In the risk model, proper HHR curves [34] are adopted to describe the fire growth, fully developed and decay phases. Consequences are calculated by modeling the egress of the users and the effect of the safety measures on the evolution of the different scenarios. Our existing model for tunnel risk analysis is thus extended in this work to include the effect of emergency teams. In this way, it is possible to quantify the reduction in risk when emergency teams are adopted.
The utilization of the risk analysis model on the Stonio Tunnel is discussed in the following, as an example, to illustrate the effect of emergency teams on the F-N curve and on the EDV (expected damage value). Table 7 and Table 8 show the main data and safety measures of the Stonio Tunnel.
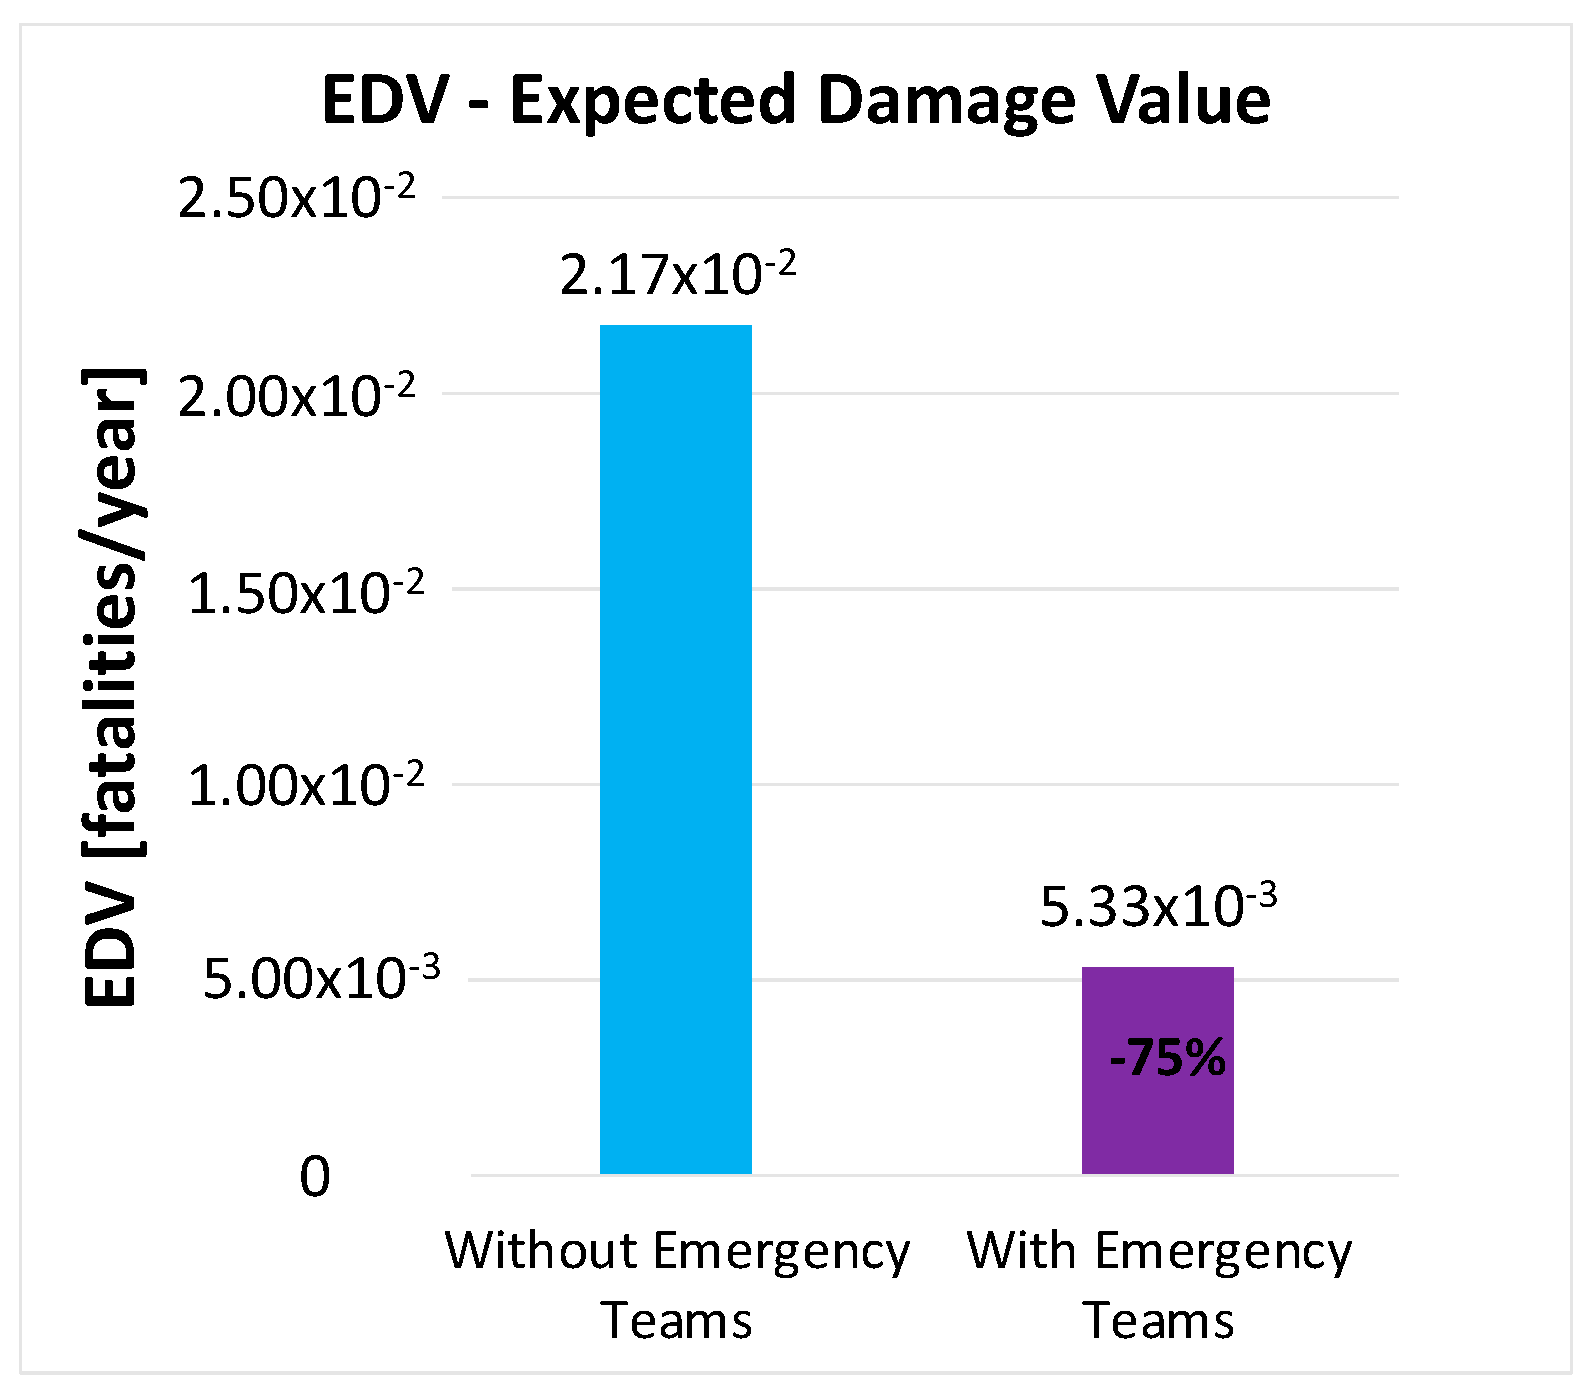
Figure 20 and Figure 21 show the significant effect on the F-N curve, and thus on the expected damage value (EDV) of the intervention of the emergency team. It is noted that both curves fall within the ALARP zone (according to Italian legislation) and the purple curve (where the emergency team is present) is lower than the blue curve. Regarding the EDV, it is observed in Figure 21 that the emergency team contributes to a 75% reduction.
It is important to underline that the probability values adopted in the risk analysis model and reported in Figure 18 can be used for emergency teams that:
- Guarantee intervention within 10 min;
- Have specific and proven training;
- Have suitable equipment and facilities;
- Possess a detailed knowledge regarding the tunnel system in which they operate;
- Are in constant communication with the control center, which provides information on the evolution of the accident scenario.
On the basis of the above considerations and of the data acquired for the 15 events that occurred in some tunnels of the A24 and A24 highways, it emerges that the risk analysis model adopted is in line with the literature studies. In particular, the probability of controlling/extinguishing the fires by the emergency teams was assumed in the calculation model to be 95% (Figure 18). Considering the literature studies and what was reported by [39], it emerges that the expected probability of controlling/extinguishing fires is 98.2%. Future fire events that will occur in the next years in the same tunnels will be analyzed and discussed to acquire more data and to observe possible differences related to the changes in traffic conditions and vehicles’ technologies. However, the information acquired during the past two years already constitutes a first statistically meaningful dataset, which allows us to confirm that placing well-trained and equipped rescue teams close to the tunnels is an appropriate and relevant safety measure. The observed very high value of effectiveness against fires can thus be adopted in risk analysis models.
5. Conclusions and Possible Developments
Road tunnel safety can be assessed using specific analytical risk models as indicated by European Directive 2004/54/EC. In general, these models consider several elements, including traffic (type, quantity and daily distribution), accident frequency and safety measures present in the tunnel, which include equipment, infrastructural and procedural type measures. Hence, there is the opportunity to adopt a safety measure that consists of emergency teams located near the tunnels. These teams, suitably trained and equipped, can intervene quickly in the tunnel following an event. In addition to controlling or extinguishing a fire, they can provide support to users during the evacuation phase by indicating the direction to follow to reach bypasses, emergency exits and safe places. It is necessary to study and evaluate the effectiveness of emergency teams that can be adopted in risk models. Starting from different studies and analysis of the technical and scientific literature, several categories of tunnels and fires were defined. Subsequently, 15 interventions occurred between the year 2019 and the year 2021 in some tunnels located on the A24 and A25 highways in Italy and managed by Strada dei Parchi S.p.A. were considered. Overall, Strada dei Parchi S.p.A. manages 14 tunnels with lengths ranging from around 590 m to about 10,000 m and falling within the area of application of European Directive 2004/54/EC. Analysis of the 15 interventions carried out by the emergency teams shows that the average intervention time is around 5.9 min. Out of the 15 interventions analyzed, 80% were characterized by an intervention time of less than 8 min, while 20% were by an intervention time between 8 min and 10 min. In addition to the intervention time of the teams, other data were analyzed, including the average time needed to extinguish the fire (not always available), equal to about 14 min, and the average time needed to recover the road network, equal to about 97 min. From a statistical point of view, only one event involved a heavy vehicle; in all other cases, light vehicles were involved. A total of 62% of the events were classified as failure + fire and 38% as accidents with injuries. In this way, it was possible to compare the effectiveness of the emergency teams with the corresponding value reported in the literature and then use it within a risk analysis model developed by the authors. In this model, the effectiveness of the teams is considered in the event tree as the question: Is the fire rapidly extinguished? If the emergency team is available, the probability to extinguish or control a fire principle is 95% or 90% depending on the availability of a water supply system inside the tunnel. In these two cases, only 5% and 10% of fire principles will evolve into dangerous fires with peak HRRs between 8 MW and 150 MW. Considering the studies in the technical-scientific literature and what was reported by [39], it appears that the expected probability of controlling/extinguishing fires is 98.2%. It follows that the probability value (95%) adopted in the risk analysis model proposed by the authors [34] is in line with the probability value calculated based on the literature studies (98.2%). This probability value can also be adopted as a reference by other analysts for the risk assessment of road tunnels. Further developments of the work may concern two issues: (i) increase in the event database with the aim of consolidating the analysis carried out and (ii) apply HRA (human reliability analysis) techniques with the aim of studying in a quantitative way the human factor with reference to the probability of failure during the management of an intervention. With reference to the increase in the events’ database, it is possible to further verify the activation and travel times, and the training of the emergency teams. A further analysis should be performed, taking into account the quality and reliability of safety systems inside the tunnel.
Finally, this study modeled the risk of fire in a tunnel according to an analytical approach. More refined models may be developed by specifying multivariable functions, including several intermediate factors and exposure factors, as predictors of the frequency and severity of dangerous events in tunnels. This type of analysis aims to show that the most significant predictors can explain dangerous events with the aim of reducing the effects [56].
Author Contributions
Conceptualization, F.B.; data curation, I.L. and C.T.; formal analysis, F.B., A.F. and M.D.; methodology, F.B., A.F. and M.D.; resources, M.D.; supervision, F.B.; visualization, F.B. and A.F.; writing—original draft, F.B., A.F. and M.D.; writing—review and editing, F.B., A.F. and M.D. All authors have read and agreed to the published version of the manuscript.
Funding
This research received no external funding.
Institutional Review Board Statement
Not applicable.
Informed Consent Statement
Informed consent was obtained from all subjects involved in the study.
Data Availability Statement
Not applicable.
Acknowledgments
The authors would like to thank SITAF S.p.A., the company that manages the Fréjus Tunnel, for providing images of the event that occurred in November 2010.
Conflicts of Interest
The authors declare no conflict of interest.
References
- Król, A.; Król, M. Numerical investigation on fire accident and evacuation in a urban tunnel for different traffic conditions. Tunn. Undergr. Space Technol. 2021, 109, 103751. [Google Scholar] [CrossRef]
- European Union. Directive 2004/54/EC on Minimum Safety Requirements for Tunnels in the TRANS-European Road Network; European Union: Brussels, Belgium, 2004. [Google Scholar]
- Król, A.; Król, M. The factors determining the number of the endangered people in a case of fire in a road tunnel. Fire Saf. J. 2020, 111, 102942. [Google Scholar] [CrossRef]
- Bassan, S. Overview of traffic safety aspects and design in road tunnels. IATSS Res. 2016, 40, 35–46. [Google Scholar] [CrossRef] [Green Version]
- Ma, Z.; Shao, C.; Zhang, S. Characteristics of traffic accidents in Chinese freeway tunnels. Tunn. Undergr. Space Technol. 2009, 24, 350–355. [Google Scholar] [CrossRef]
- Lemke, K. Road safety in tunnels. Transp. Res. Rec. 2000, 1740, 170–174. [Google Scholar] [CrossRef]
- Mashimo, H. State of the road tunnel safety technology in Japan. Tunn. Undergr. Space Technol. 2002, 17, 145–152. [Google Scholar] [CrossRef]
- Amundsen, F.H.; Ranes, G. Studies on Traffic Accidents in Norwegian Road Tunnels II. An Analysis of Traffic Accidents on Road Tunnels 2001–2006; Road and Traffic Depatment Traffic Safety Section, Statens Vegvesen: Oslo, Norway, 2009. [Google Scholar]
- Nussbaumer, C. Austrian Road Safety Board Comparative Analysis of Safety in Tunnels. In Proceedings of the 3rd Young Researchers Seminar, Brno, Czech Republic, 27–30 May 2007; Available online: https://www.semanticscholar.org/paper/COMPARATIVE-ANALYSIS-OF-SAFETY-IN-TUNNELS-Cornelia-Board/07637e882f31873daad4e1dac92751581a18a00e (accessed on 11 November 2022).
- Caliendo, C.; De Guglielmo, M.L. Accident rates in road tunnels and social costs evaluation. SIIV—5 International Congress—Sustainability of Road Infrastructures. Procedia Soc. Behav. Sci. 2012, 53, 166–177. [Google Scholar] [CrossRef] [Green Version]
- Pervez, A.; Huang, H.; Han, C.; Wang, J.; Li, Y. Revisiting freeway single tunnel crash characteristics analysis: A six-zone analytic approach. Accid. Anal. Prev. 2020, 142, 105542. [Google Scholar] [CrossRef]
- Kaplan, S.; Garrick, B.J. On the quantitative definition of risk. Risk Anal. 1981, 1, 11–27. [Google Scholar] [CrossRef]
- Kaplan, S. The words of risk analysis. Risk Anal. 1997, 17, 407–417. [Google Scholar] [CrossRef]
- Senato della Repubblica Italiana. Relazione Concernente lo Stato di Attuazione Degli Interventi Relative All’adeguamento Delle Gallerie Stradali Della Rete Transeuropea; Ministero Delle Infrastrutture e dei Trasporti: Rome, Italy, 2013. (In Italian) [Google Scholar]
- Pastori, E.; Brambilla, M.; Apicella, D.; Jarvis, A. Study on the Implementation and Effects of Directive 2004/54/EC on Minimum Safety Requirements for Road Tunnels in the Trans-European Road Network. Final Report; European Commission Directorate General for Mobility and Transport: Brussels, Belgium, 2015. [Google Scholar]
- Abbasnejadfard, M.; Bastami, M.; Abbasnejadfard, M.; Borzoo, S. Novel deterministic and probabilistic resilience assessment measures for engineering and infrastructure systems based on the economic impacts. Int. J. Disaster Risk Reduct. 2022, 75, 102956. [Google Scholar] [CrossRef]
- Wei, D.; Rose, A.; Koc, E.; Chen, Z.; Soibelman, L. Socioeconomic impacts of resilience to seaport and highway transportation network disruption. Transp. Res. Part D Transp. Environ. 2022, 106, 103236. [Google Scholar] [CrossRef]
- Ansari Esfeh, M.; Kattan, L.; Lam, W.H.K.; Salari, M.; Ansari Esfe, R. Road network vulnerability analysis considering the probability and consequence of disruptive events: A spatiotemporal incident impact approach. Transp. Res. Part C Emerg. Technol. 2022, 136, 103549. [Google Scholar] [CrossRef]
- Mattsson, L.; Jenelius, E. Vulnerability and resilience of transport systems—A discussion of recent research. Transp. Res. Part A Policy Pract. 2015, 81, 16–34. [Google Scholar] [CrossRef]
- Reggiani, A. Network resilience for transport security: Some methodological considerations. Transp. Policy 2013, 28, 63–68. [Google Scholar] [CrossRef]
- Carlson, J.L.; Haffenden, R.A.; Bassett, G.W.; Buehring, W.A.; Collins, M.J.; Folga, S.M.; Petit, F.D.; Phillips, J.A.; Verner, D.R.; Whitfield, R.G. Resilience: Theory and Application; No. ANL/DIS-12-1; Argonne National Lab.: Argonne, IL, USA, 2012. [Google Scholar]
- Bjelland, H.; Njå, O.; Heskestad, A.W.; Braut, G.S. Emergency preparedness for tunnel fires—A systems-oriented approach. Saf. Sci. 2021, 143, 105408. [Google Scholar] [CrossRef]
- Alvear, D.; Abreu, O.; Cuesta, A.; Alonso, V. Decision support system for emergency management: Road tunnels. Tunn. Undergr. Space Technol. 2013, 34, 13–21. [Google Scholar] [CrossRef]
- Dubois, H.; Lamontagne, M. Engineering Analysis to Improve Safety of the Melocheville Tunnel as Recommended in the NFPA 50. In Proceedings of the Seventh International Symposium on Tunnel Safety and Security, ISTSS, Montréal, QC, Canada, 16–18 March 2016; pp. 229–238. [Google Scholar]
- Bosco, D.; Lovreglio, R.; Frassoldati, A.; Derudi, M.; Borghetti, F. Queue formation and evacuation modelling in road tunnels during fires. Chem. Eng. Trans. 2018, 67, 805–810. [Google Scholar] [CrossRef]
- Lovreglio, R.; Ronchi, E.; Nilsson, D. An Evacuation Decision Model based on perceived risk, social influence and behavioural uncertainty. Simul. Model. Pract. Theory 2016, 66, 226–242. [Google Scholar] [CrossRef]
- Lovreglio, R.; Fonzone, A.; dell’Olio, L.; Borri, D. A Study of Herding Behavior in Exit Choice during Emergencies based on Random Utility Theory. Saf. Sci. 2016, 82, 421–431. [Google Scholar] [CrossRef]
- Caliendo, C.; Genovese, G.; Russo, I. A numerical study for assessing the risk reduction using an emergency vehicle equipped with a micronized water system for contrasting the fire growth phase in road tunnels. Appl. Sci. 2021, 11, 5248. [Google Scholar] [CrossRef]
- Ayyub, B.M. Systems resilience for multihazard environments: Definition, metrics, and valuation for decision making. Risk Anal. 2013, 34, 340–355. [Google Scholar] [CrossRef] [PubMed]
- Borghetti, F.; Petrenj, B.; Trucco, P.; Calabrese, V.; Ponti, M.; Marchionni, G. Multi-level approach to assessing the resilience of road network infrastructure. Int. J. Crit. Infrastruct. 2021, 17, 97–132. [Google Scholar] [CrossRef]
- Caliendo, C.; Genovese, G.; Russo, I. A simultaneous analysis of the user safety and resilience of a twin-tube road tunnel. Appl. Sci. 2022, 12, 3357. [Google Scholar] [CrossRef]
- Borghetti, F.; Derudi, M.; Gandini, P.; Frassoldati, A.; Tavelli, S. Safety in Road Tunnels. In Tunnel Fire Testing and Modeling; Springer: Cham, Switzerland, 2017. [Google Scholar] [CrossRef]
- Derudi, M.; Borghetti, F.; Favrin, S.; Frassoldati, A. TRAM: A New Quantitative Methodology for Tunnel Risk Analysis. In Chemical Engineering Transactions; AIDIC: Milan, Italy, 2018; pp. 811–816. ISBN 978-88-95608-64-8. [Google Scholar] [CrossRef]
- Borghetti, F.; Cerean, P.; Derudi, M.; Frassoldati, A. Road Tunnels Risk Analysis. In Road Tunnels; Springer: Cham, Switzerland, 2019. [Google Scholar] [CrossRef]
- Borghetti, F.; Derudi, M.; Frassoldati, A.; Lai, I.; Trinchini, C. Tunnel risk analysis: A quantitative evaluation of the effectiveness of emergency teams inside the A24 and A25 motorway tunnels. Chem. Eng. Trans. 2020, 82, 277–282. [Google Scholar] [CrossRef]
- Gehandler, J. Evaluation of Road Tunnel Fire Safety and Risk. In Proceedings of the 7th International Symposium on Tunnel Safety and Security, ISTSS, Montréal, QC, Canada, 16–18 March 2016; pp. 217–228. [Google Scholar]
- FSV. Methodology of Tunnel Risk Analysis. Austrian Association for Research on Road, Rail and Transport. Guideline RVS 09.03.11. 2015. Available online: http://www.fsv.at/shop/produktdetail.aspx?IDProdukt=fabe3274-1ec7-4963-ac28-c3c5804c3126 (accessed on 11 November 2022).
- Technical Committee C 3.3 Road Tunnel Operations. Management of the Operator—Emergency Teams Interface in Road Tunnels; 2008R03; PIARC: La Défense, France, 2008. [Google Scholar]
- Kim, H.K.; Lönnermark, A.; Ingason, H. Effective Firefighting Operations in Road Tunnels; SP Technical Research Institute of Sweden: Borås, Sweden, 2010. [Google Scholar]
- Ingason, H.; Li, Y.Z.; Lönnermark, A. Tunnel Fire Dynamics; Springer: New York, NY, USA, 2015. [Google Scholar]
- Rattei, G.; Lentz, A.; Kohl, B. How Frequent are the Fire in Tunnels—Analysis from Austrian Tunnel Incident Statistics? In Proceedings of the Seventh International Conference on Tunnel Safety and Ventilation, Graz, Austria, 12–13 May 2014; pp. 5–11. [Google Scholar]
- Nævestad, T.; Meyer, S. A survey of vehicle fires in Norwegian road tunnels 2008–2011. Tunn. Undergr. Space Technol. 2014, 41, 104–112. [Google Scholar] [CrossRef] [Green Version]
- Technical Committee 3.3 Road Tunnel Operation. Experience with Significant Incidents in Road Tunnels; 2016R35EN; PIARC: La Défense, France, 2017; ISBN 978-2-84060-444-0. [Google Scholar]
- Ren, R.; Zhou, H.; Hu, Z.; He, S.; Wang, X. Statistical analysis of fire accidents in Chinese highway tunnels 2000–2016. Tunn. Undergr. Space Technol. 2019, 83, 452–460. [Google Scholar] [CrossRef]
- Casey, N. Fire incident data for australian road tunnels. Fire Saf. J. 2020, 111, 102909. [Google Scholar] [CrossRef]
- Rhodes, N.; MacDonald, M. European Thematic Network Fire in Tunnels; Fire Response Management (Technical Report Part 3); FIT: Brussels, Belgium, 2005. [Google Scholar]
- Beard, A.; Carvel, R. The Handbook of Tunnel Fire Safety; Thomas Telford Services Ltd.: London, UK, 2005. [Google Scholar]
- Chen, F.; Chien, S.; Lee, Y.; Lin, C.; Sie, H. The integrated strategies for fire safety of long road tunnels in Taiwan. Pap. Presented Procedia Eng. 2013, 62, 36–45. [Google Scholar] [CrossRef] [Green Version]
- Kirytopoulos, K.; Konstandinidou, M.; Nivolianitou, Z.; Kazaras, K. Embedding the human factor in road tunnel risk analysis. Process Saf. Environ. Prot. 2014, 92, 329–337. [Google Scholar] [CrossRef]
- Manca, D.; Brambilla, S. A methodology based on the analytic hierarchy process for the quantitative assessment of emergency preparedness and response in road tunnels. Transp. Policy 2011, 18, 657–664. [Google Scholar] [CrossRef]
- Holgersson, A.; Eklund, A.; Gyllencreutz, L.; Saveman, B.-I. Emergency medical response in mass casualty tunnel incidents-with emphasis on prehospital care. J. Hum. Secur. 2020, 16, 3–15. [Google Scholar] [CrossRef]
- Doohan, I.S.; Saveman, B.-I.; Gyllencreutz, L. Limited medical perspective at a strategic level in relation to mass casualty incidents in swedish tunnels. Int. J. Emerg. Manag. 2019, 15, 360–374. [Google Scholar] [CrossRef]
- Palm, A.; Kumm, M.; Ingason, H. Full scale firefighting tests in the Tistbrottet Mine. Fire Technol. 2016, 52, 1519–1537. [Google Scholar] [CrossRef]
- Borghetti, F.; Frassoldati, A.; Derudi, M.; Lai, I.; Trinchini, C. Resilience and Emergency Management of Road Tunnels: The Case Study of the San Rocco and Stonio Tunnels in Italy. WIT Trans. Built Environ. 2021, 206, 81–92. [Google Scholar] [CrossRef]
- Borghetti, F.; Cerean, P.; Derudi, M.; Frassoldati, A. Road Tunnels An Analytical Model for Risk Analysis; PoliMI Springer Briefs; Springer: Cham, Switzerland, 2019; ISBN 978-3-319-49516-3. ISSN 2282-2577. [Google Scholar] [CrossRef]
- Barabino, B.; Bonera, M.; Maternini, G.; Olivo, A.; Porcu, F. Bus crash risk evaluation: An adjusted framework and its application in a real network. Accid. Anal. Prev. 2021, 159, 106258. [Google Scholar] [CrossRef]
Figure 1.
Tunnel performance and resilience components of a tunnel system before, during and after an accidental event. Adapted from [21,29,30].

Figure 2.
Categories of fires inside tunnels. Adapted from [38].
Figure 2.
Categories of fires inside tunnels. Adapted from [38].

Figure 3.
Fire in the alpine Fréjus Tunnel in November 2010. Adapted from SITAF S.p.A.
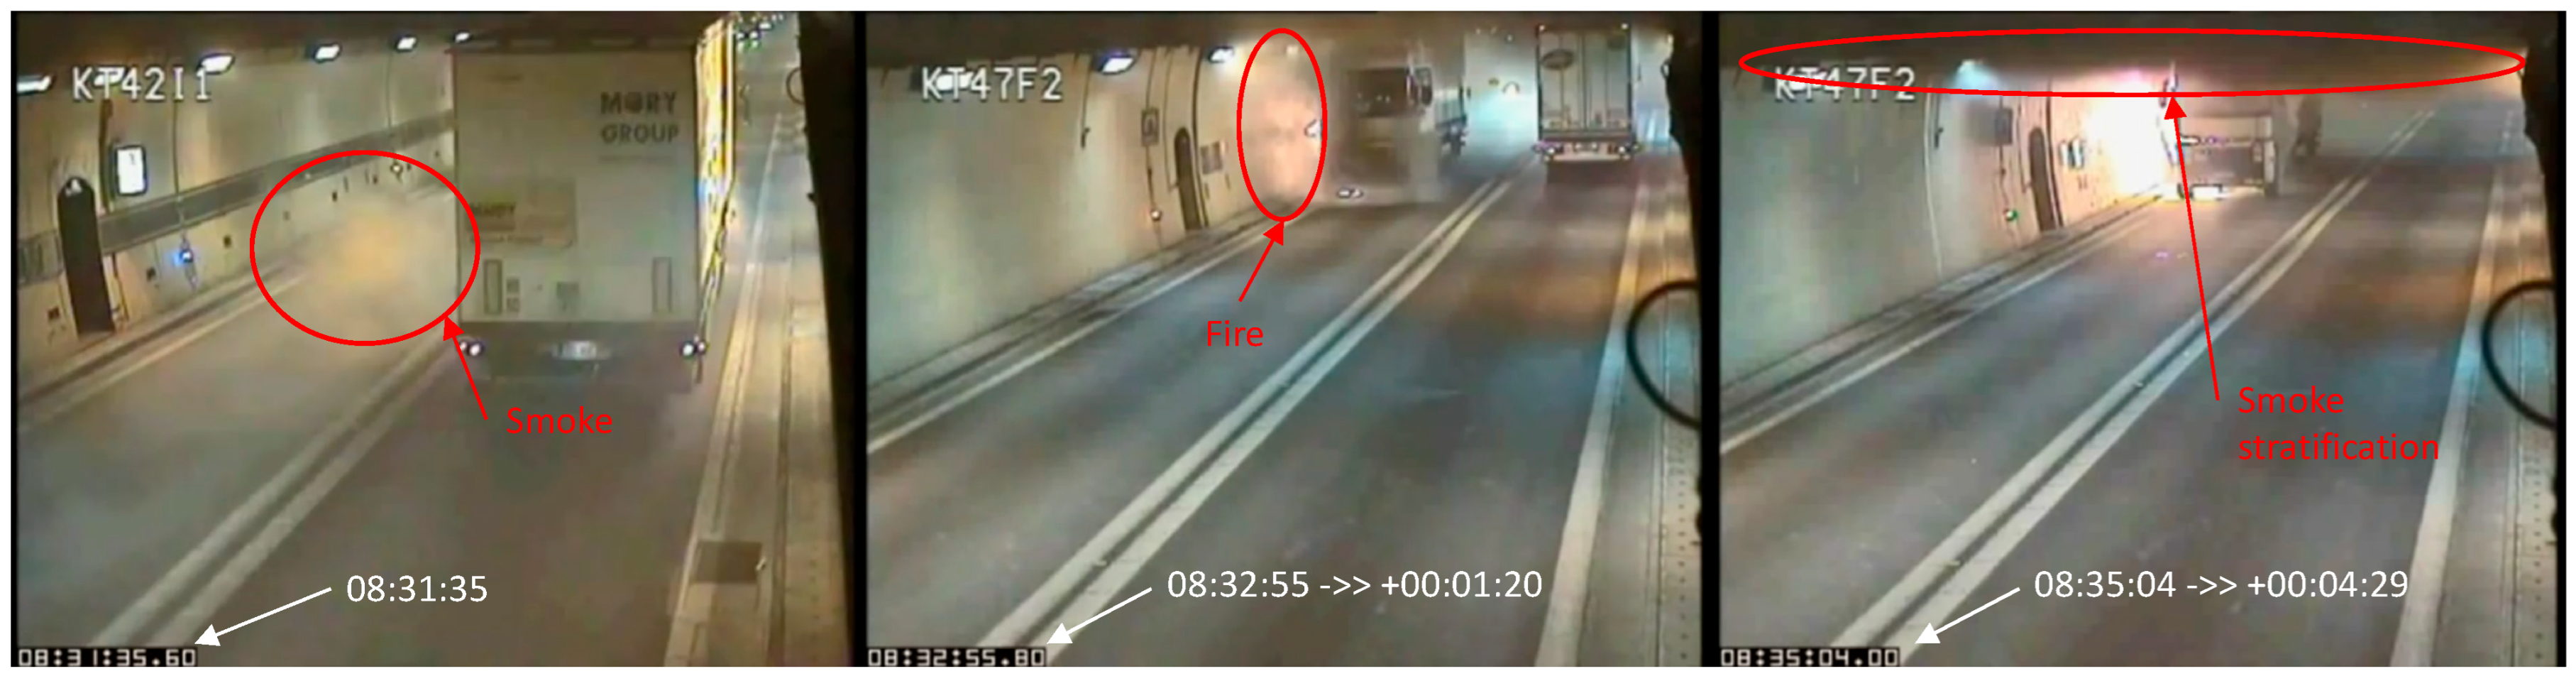
Figure 4.
Trend of the four fire curves over time and the maximum response times for emergency teams. Adapted from [39].
Figure 4.
Trend of the four fire curves over time and the maximum response times for emergency teams. Adapted from [39].
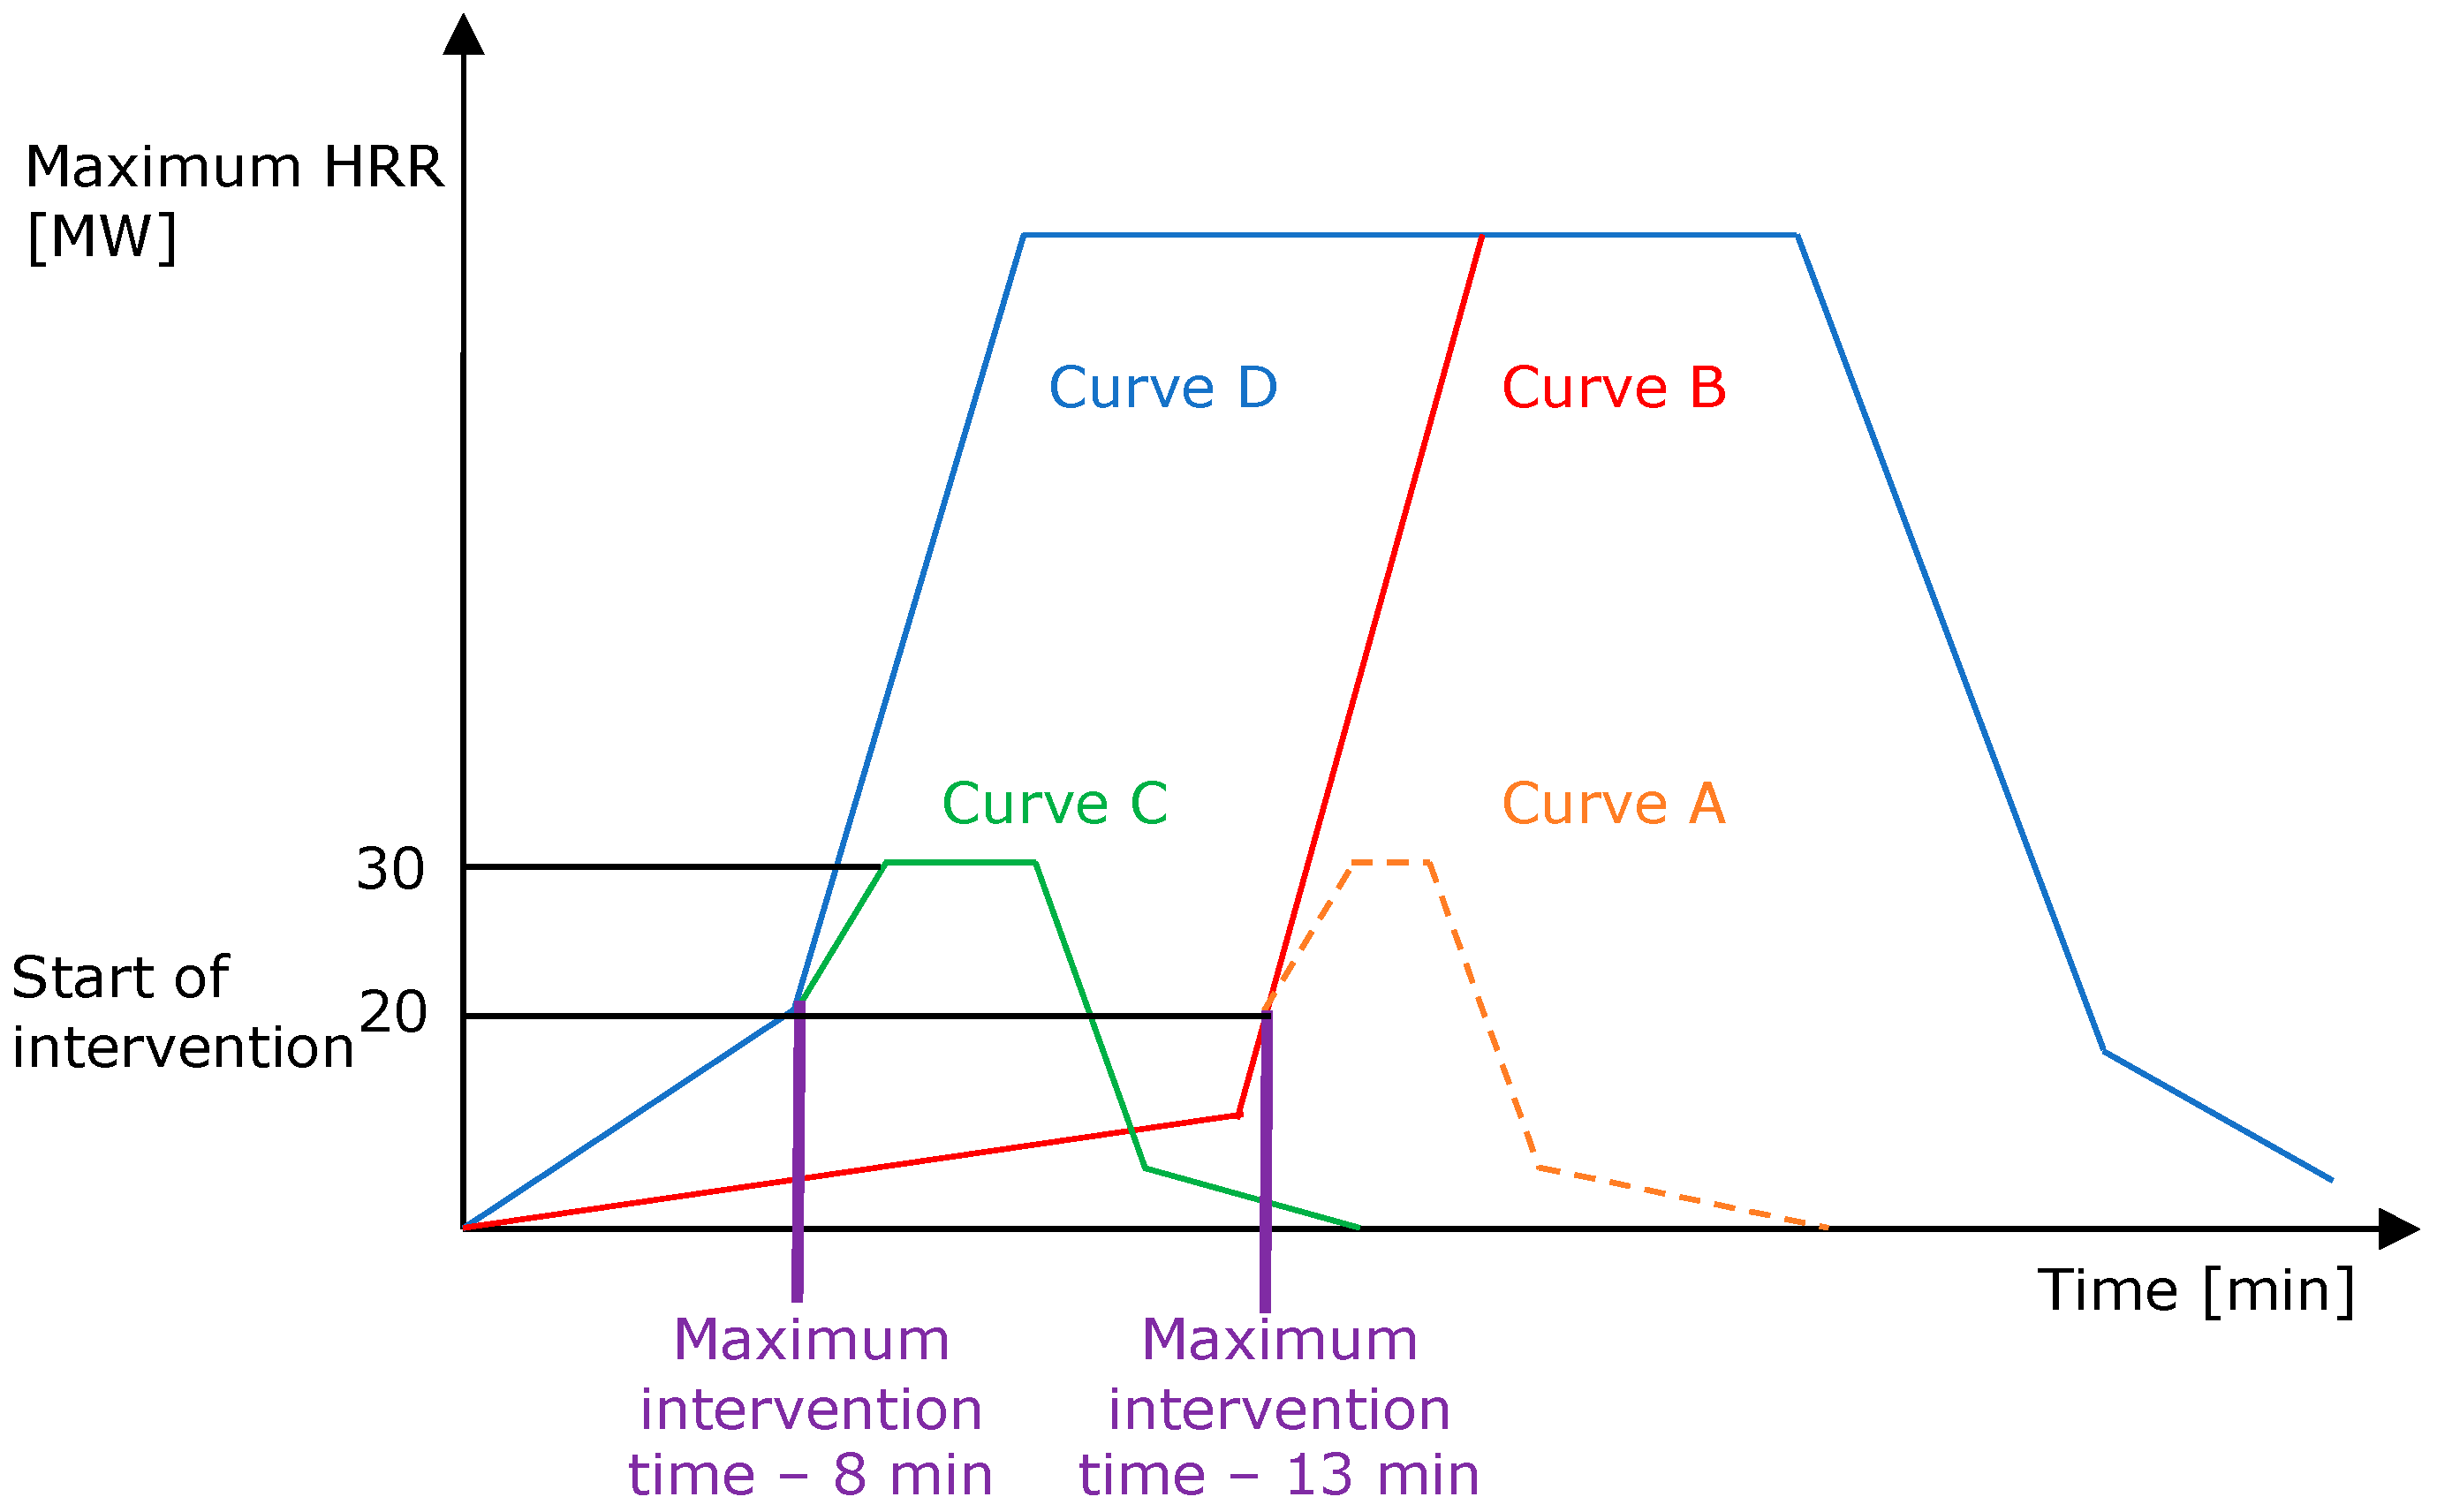
Figure 5.
Graphical representation of the accidental scenario in the San Rocco Tunnel (Italy).
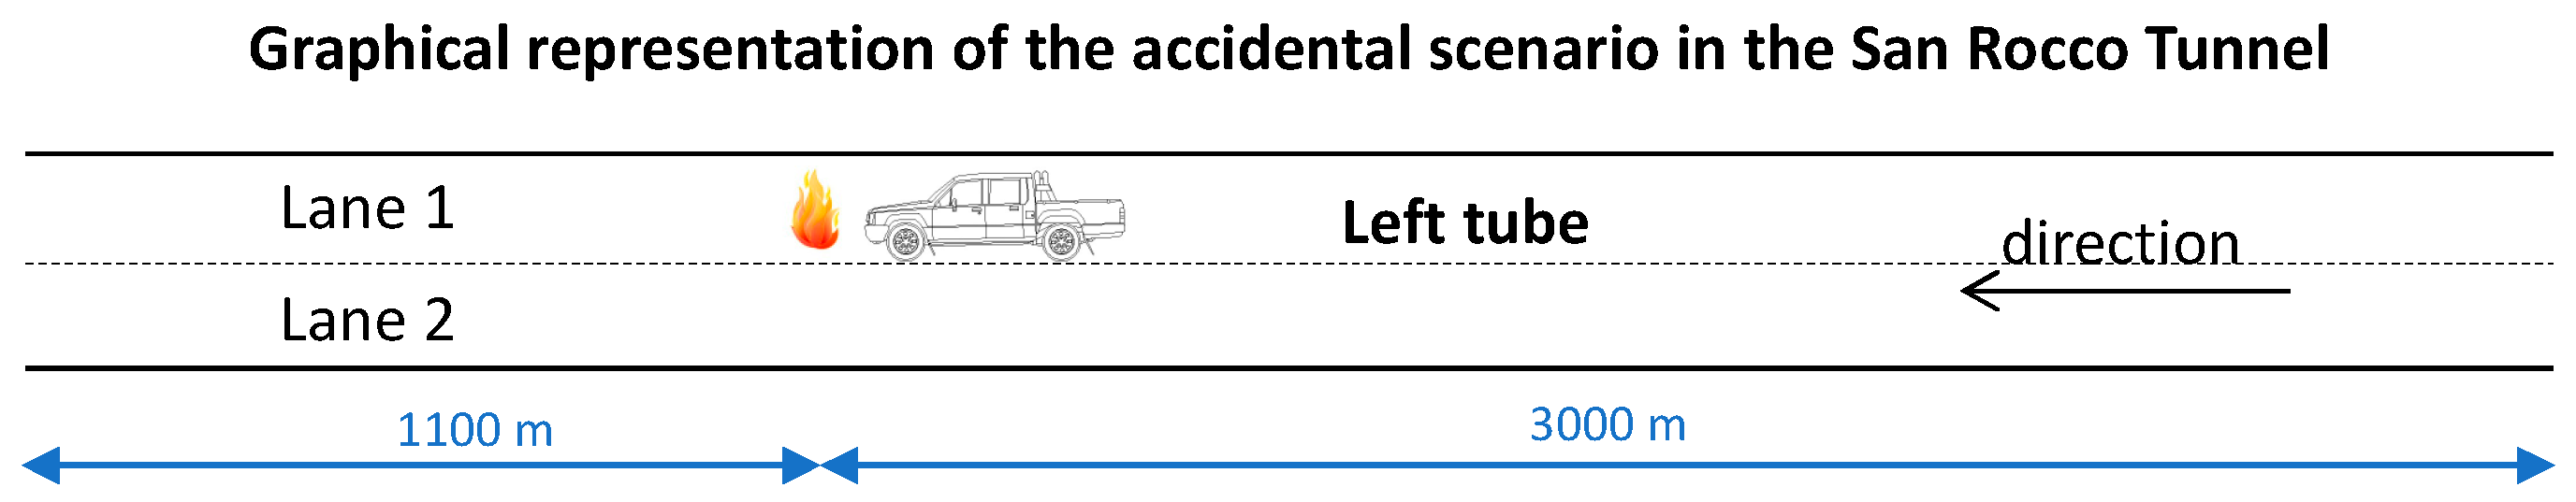
Figure 6.
Graphical representation of the accidental scenario in the Gran Sasso Tunnel (Italy).
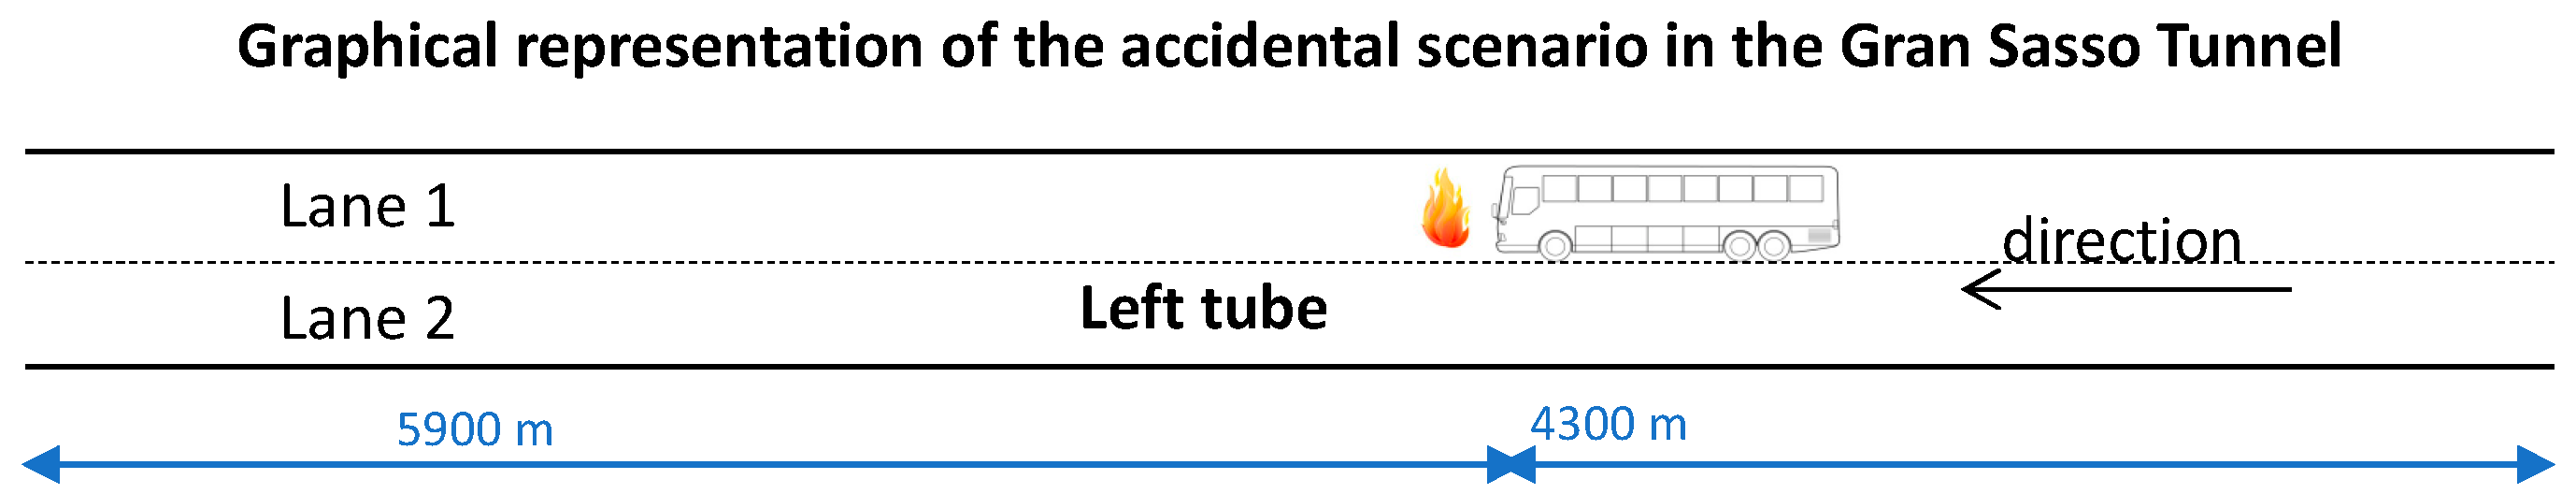
Figure 7.
Scenario of the event recorded by the TVCC of the San Rocco Tunnel (Italy) on 8 August 2016. Source: Strada dei Parchi S.p.A.
Figure 7.
Scenario of the event recorded by the TVCC of the San Rocco Tunnel (Italy) on 8 August 2016. Source: Strada dei Parchi S.p.A.

Figure 8.
Scenario of the event recorded by the TVCC of the Gran Sasso Tunnel (Italy) on 16 April 2016. Source: Strada dei Parchi S.p.A.
Figure 8.
Scenario of the event recorded by the TVCC of the Gran Sasso Tunnel (Italy) on 16 April 2016. Source: Strada dei Parchi S.p.A.

Figure 9.
Average daily traffic trends for the San Rocco Tunnel (left tube) and the Gran Sasso Tunnel (left tube) (Italy).
Figure 9.
Average daily traffic trends for the San Rocco Tunnel (left tube) and the Gran Sasso Tunnel (left tube) (Italy).
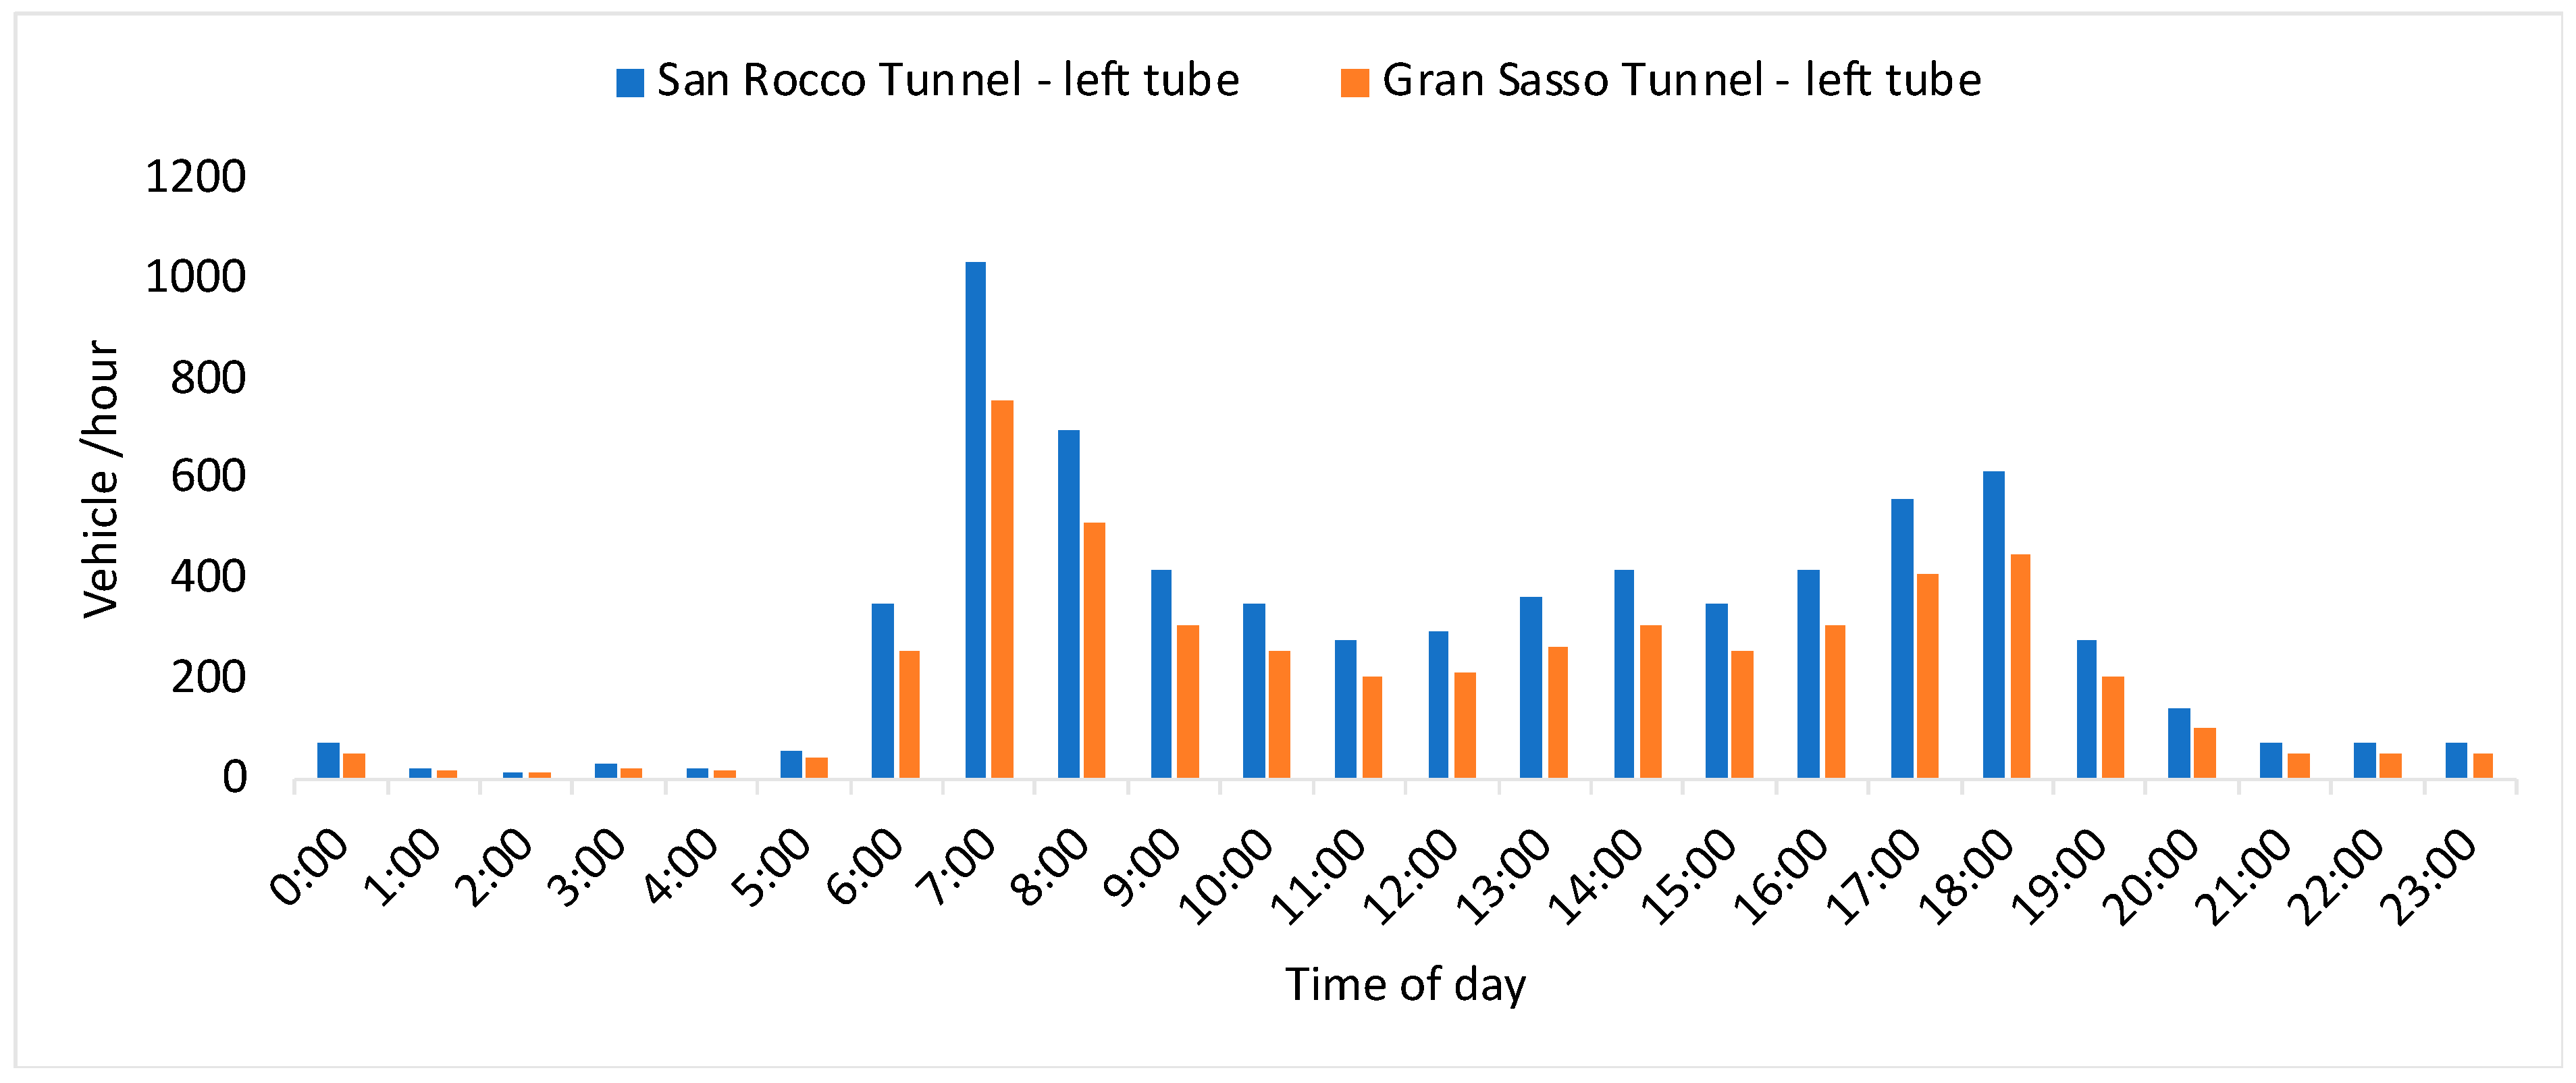
Figure 10.
Timeline of traffic accident elements and transport demand not satisfied (TDNS) inside the San Rocco Tunnel—left tube (Italy).
Figure 10.
Timeline of traffic accident elements and transport demand not satisfied (TDNS) inside the San Rocco Tunnel—left tube (Italy).

Figure 11.
Timeline of traffic accident elements and transport demand not satisfied (TDNS) inside the Gran Sasso Tunnel—left tube (Italy).
Figure 11.
Timeline of traffic accident elements and transport demand not satisfied (TDNS) inside the Gran Sasso Tunnel—left tube (Italy).
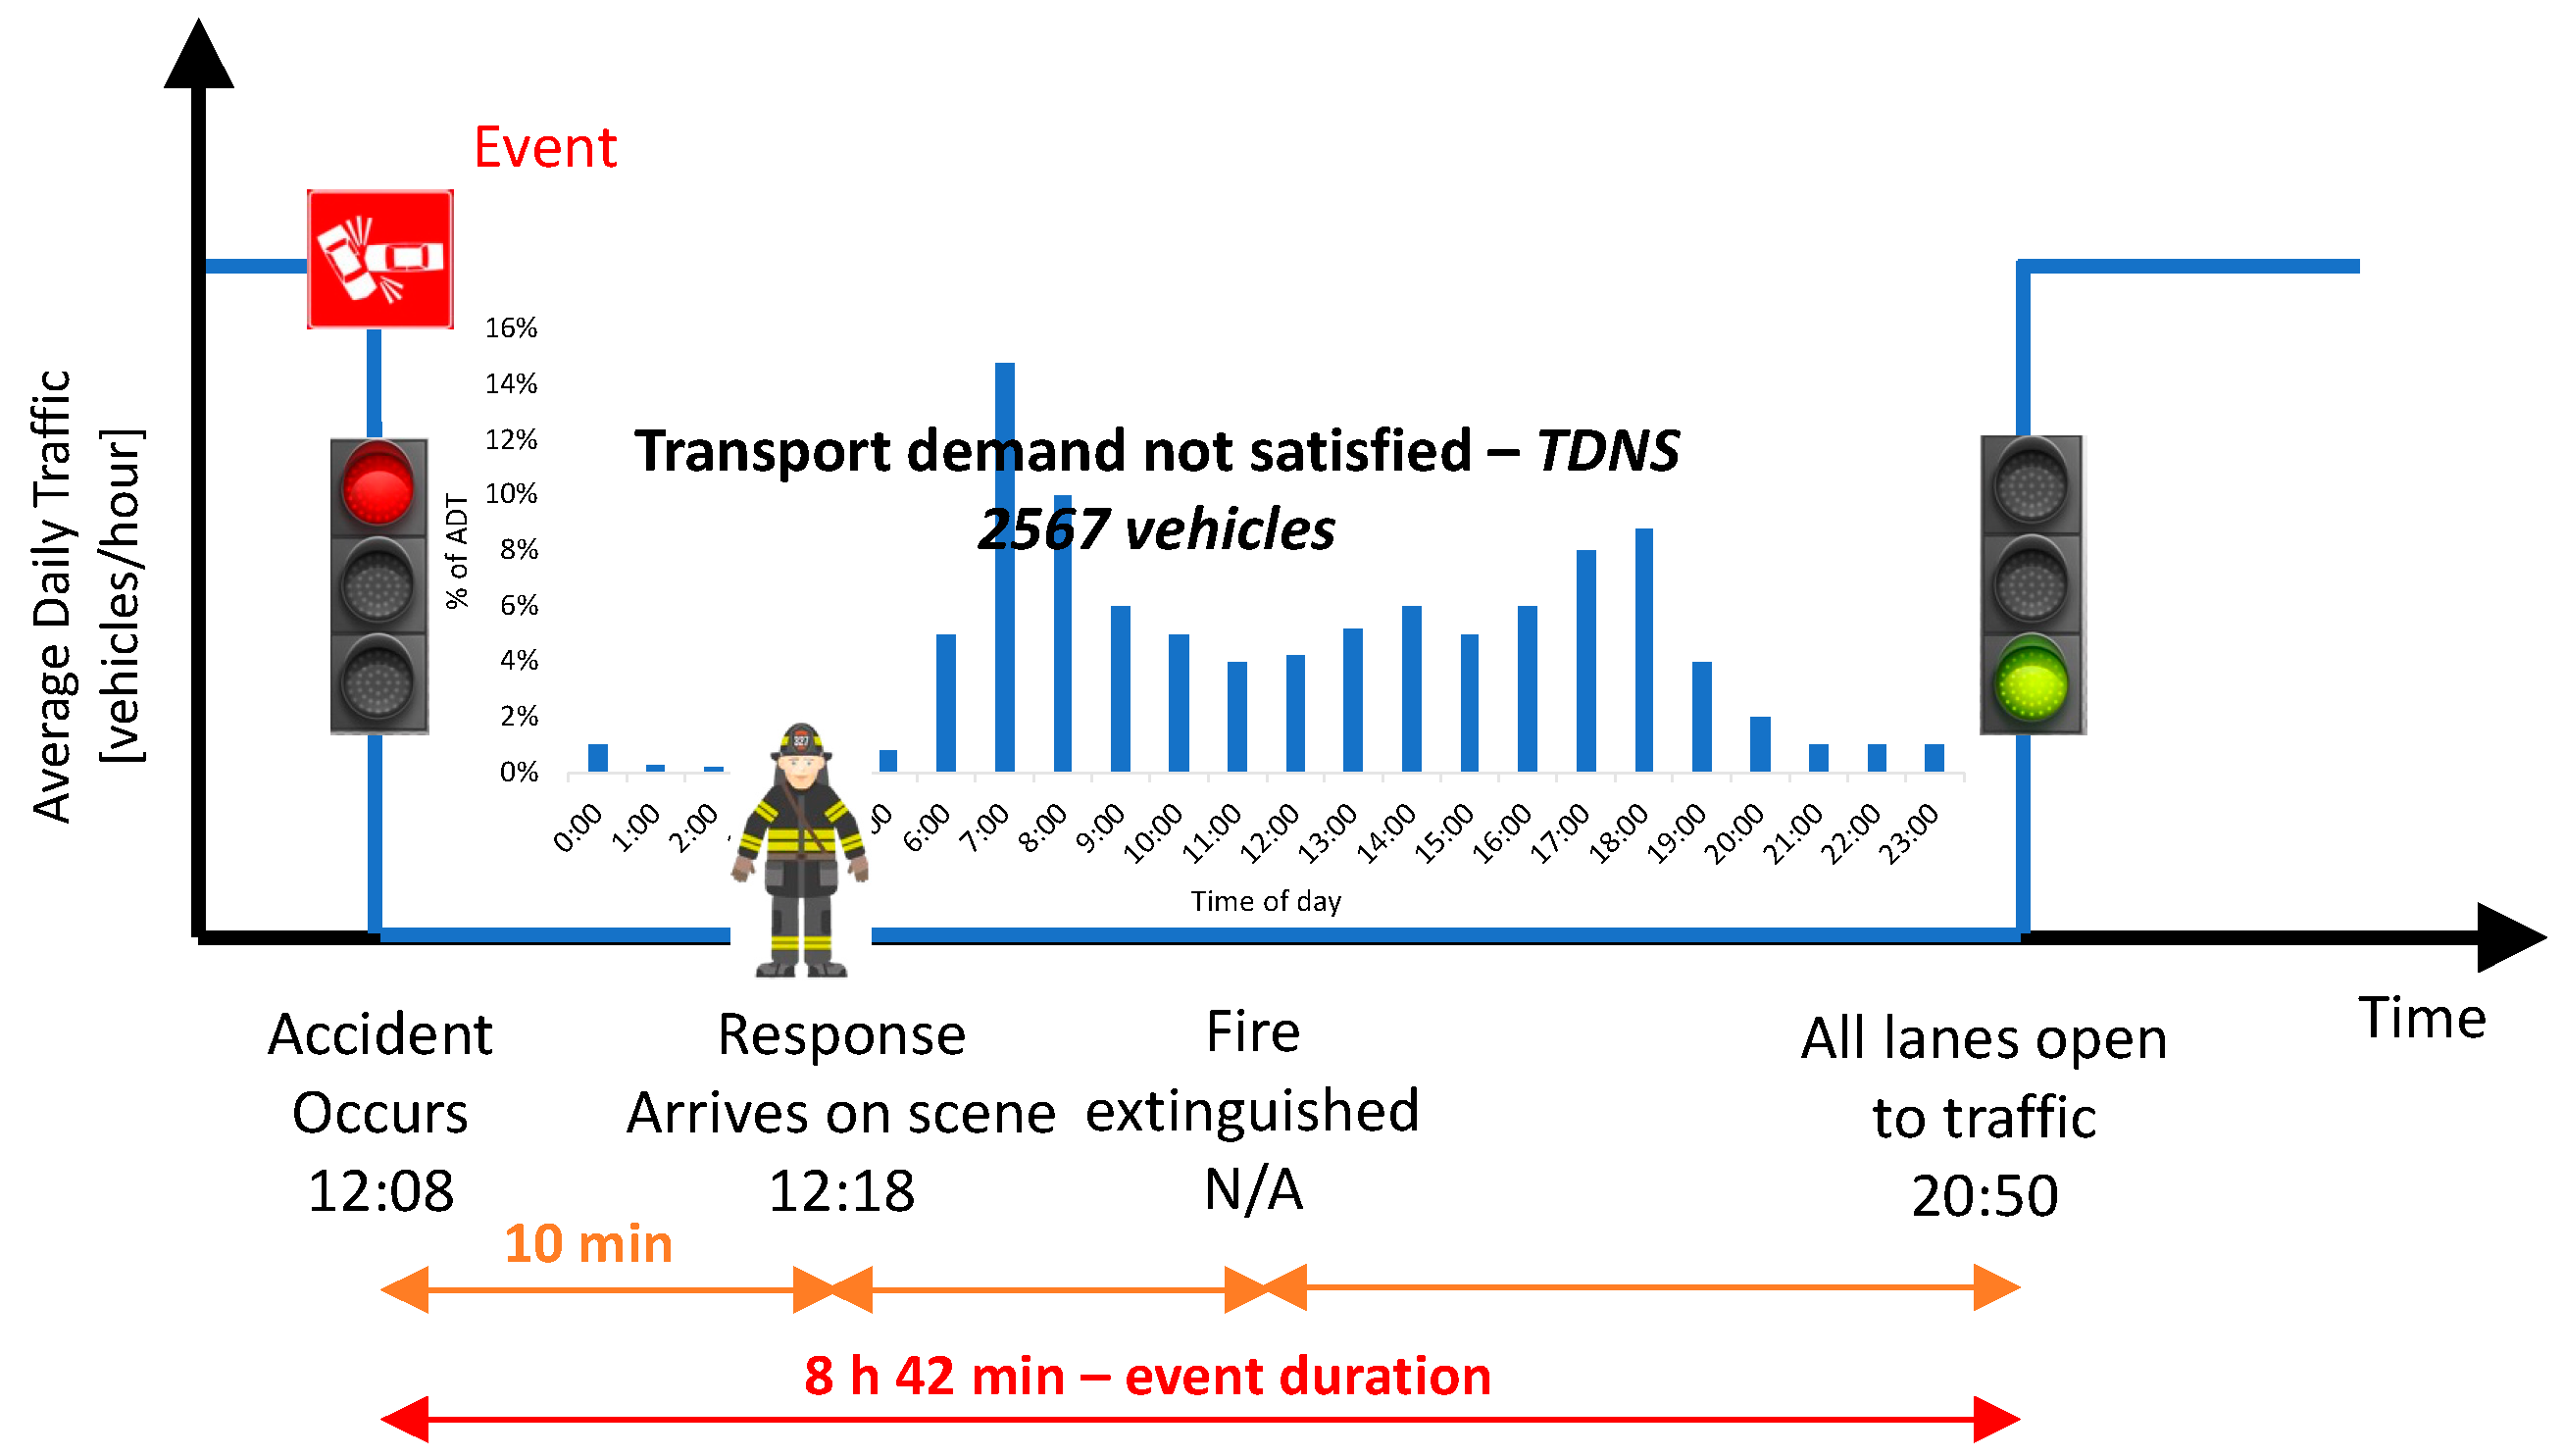
Figure 12.
Location of the 14 tunnels longer than 500 m located on the A24 and A25 motorways and managed by Strada dei Parchi S.p.A.
Figure 12.
Location of the 14 tunnels longer than 500 m located on the A24 and A25 motorways and managed by Strada dei Parchi S.p.A.
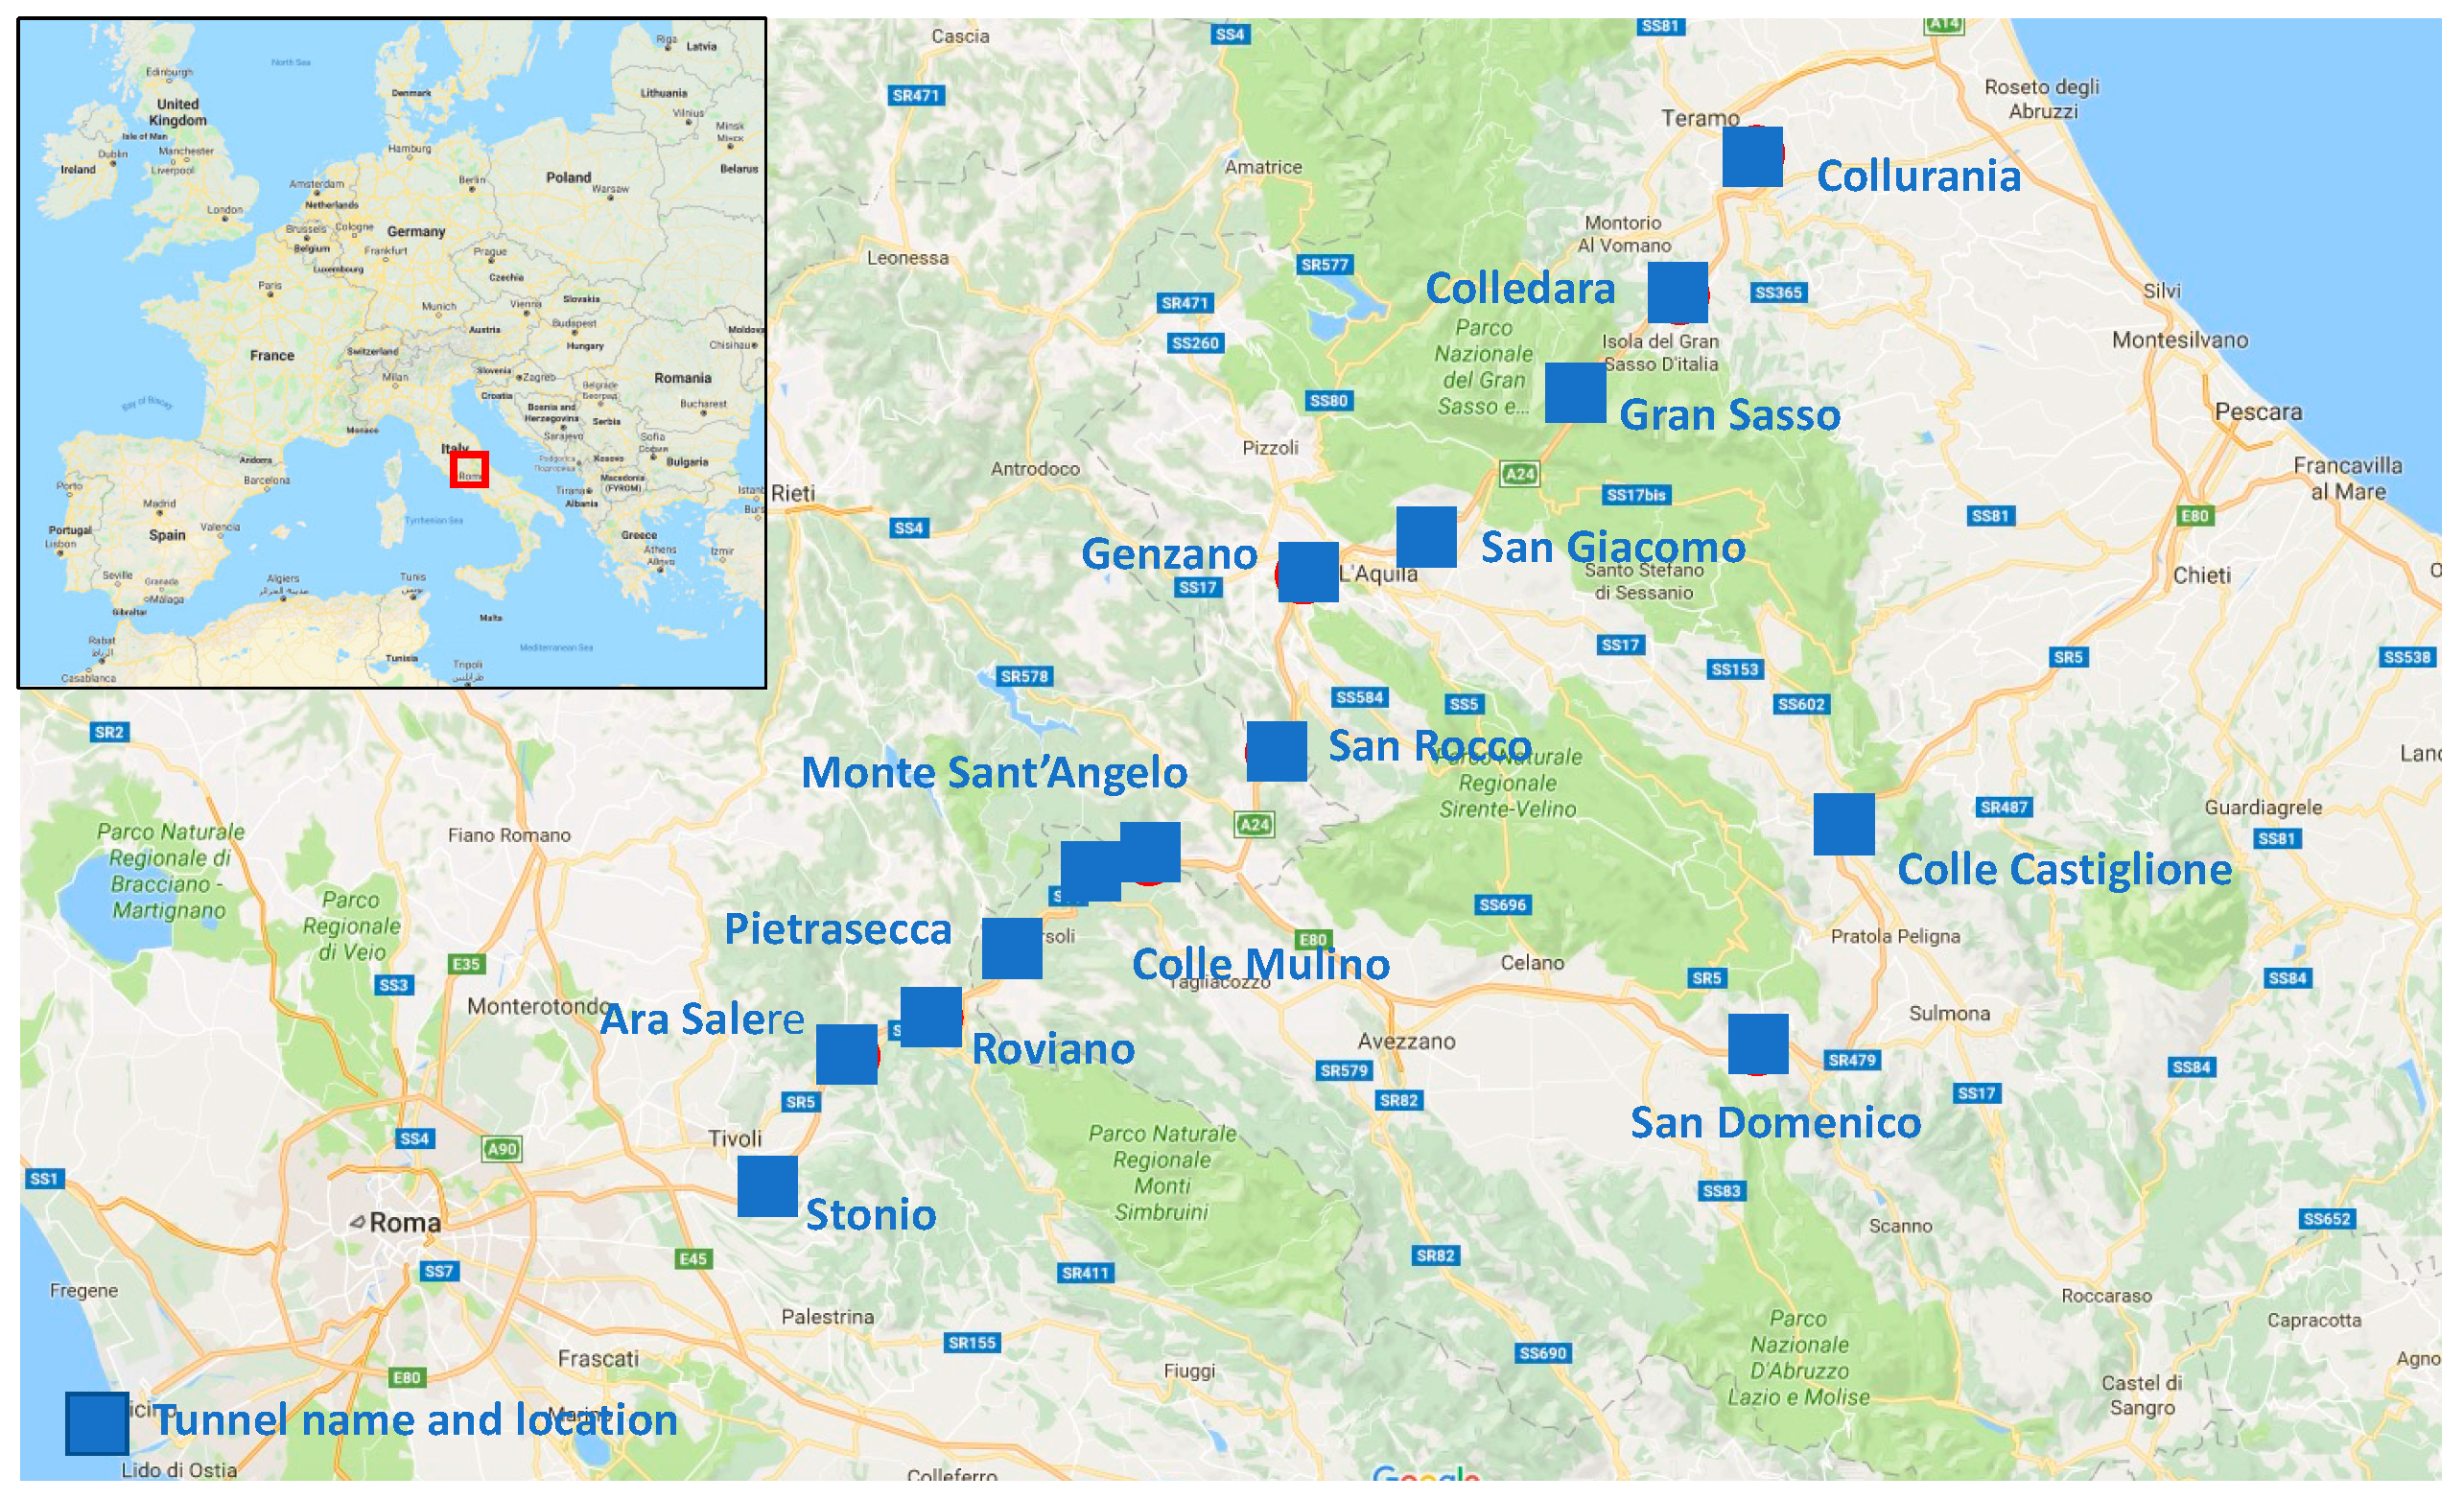
Figure 13.
Scooter and pick-ups equipped for fire control and fire extinguishing with micronized water. Source: Strada dei Parchi S.p.A.
Figure 13.
Scooter and pick-ups equipped for fire control and fire extinguishing with micronized water. Source: Strada dei Parchi S.p.A.
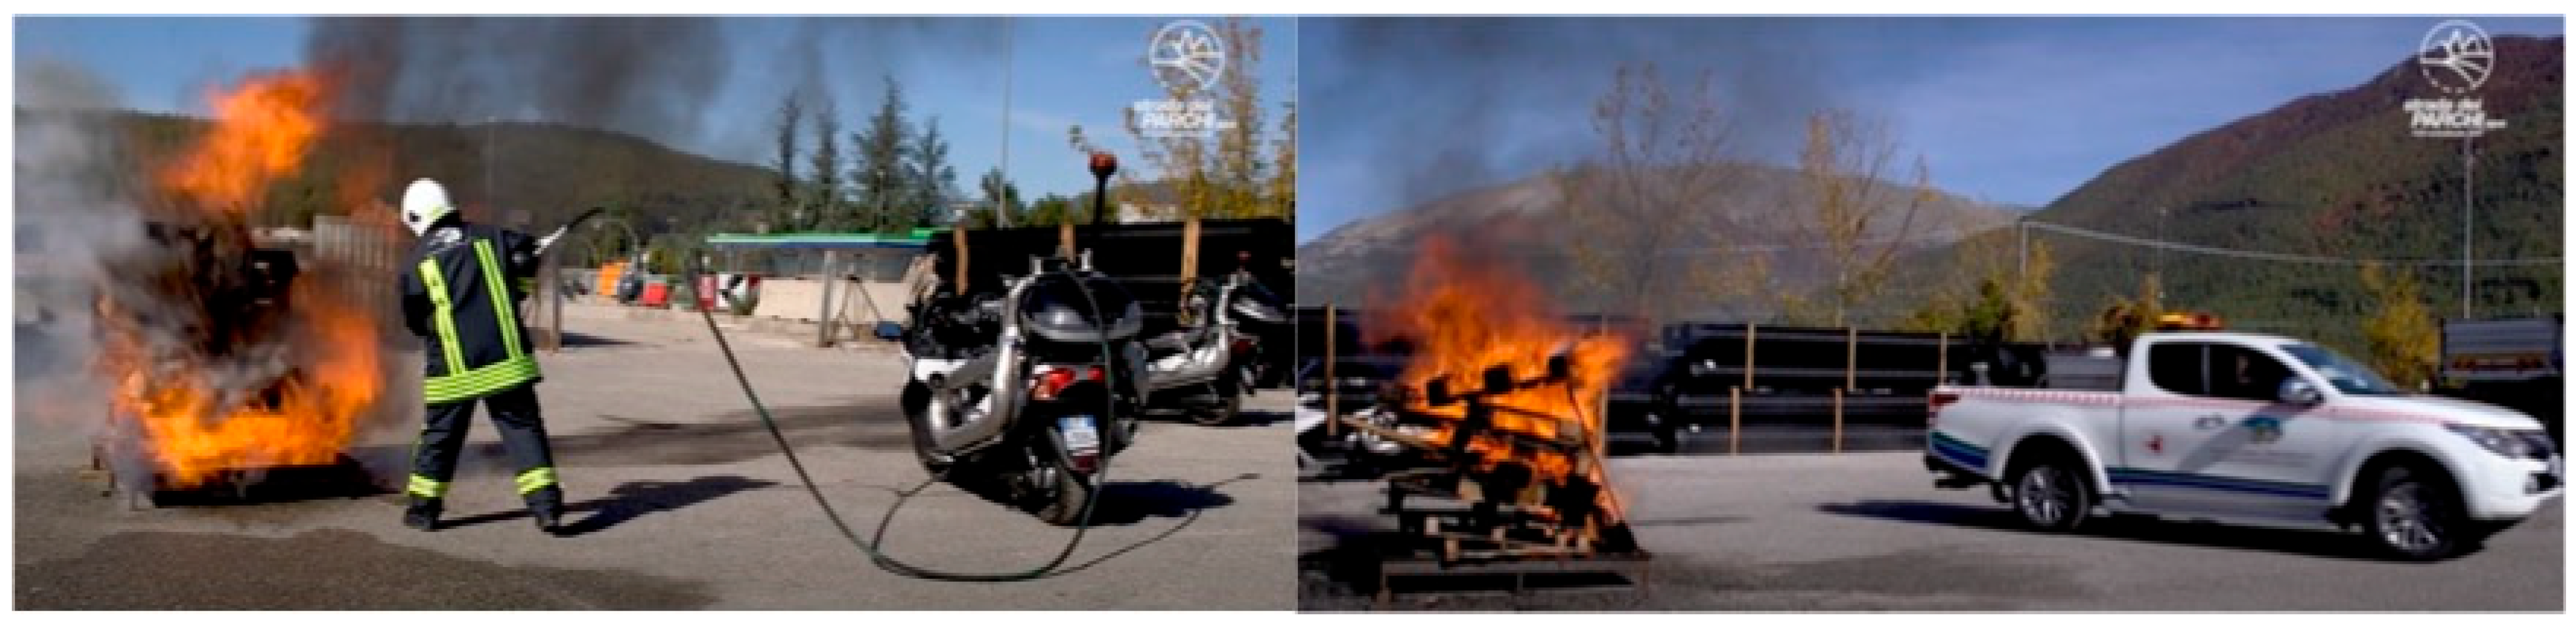
Figure 14.
Location of emergency teams, scooter and pick-ups near a tunnel entrance. Source: https://www.google.it/maps/ (accessed on 17 November 2022).
Figure 14.
Location of emergency teams, scooter and pick-ups near a tunnel entrance. Source: https://www.google.it/maps/ (accessed on 17 November 2022).

Figure 15.
Time-dependent event management in a tunnel with two lanes.
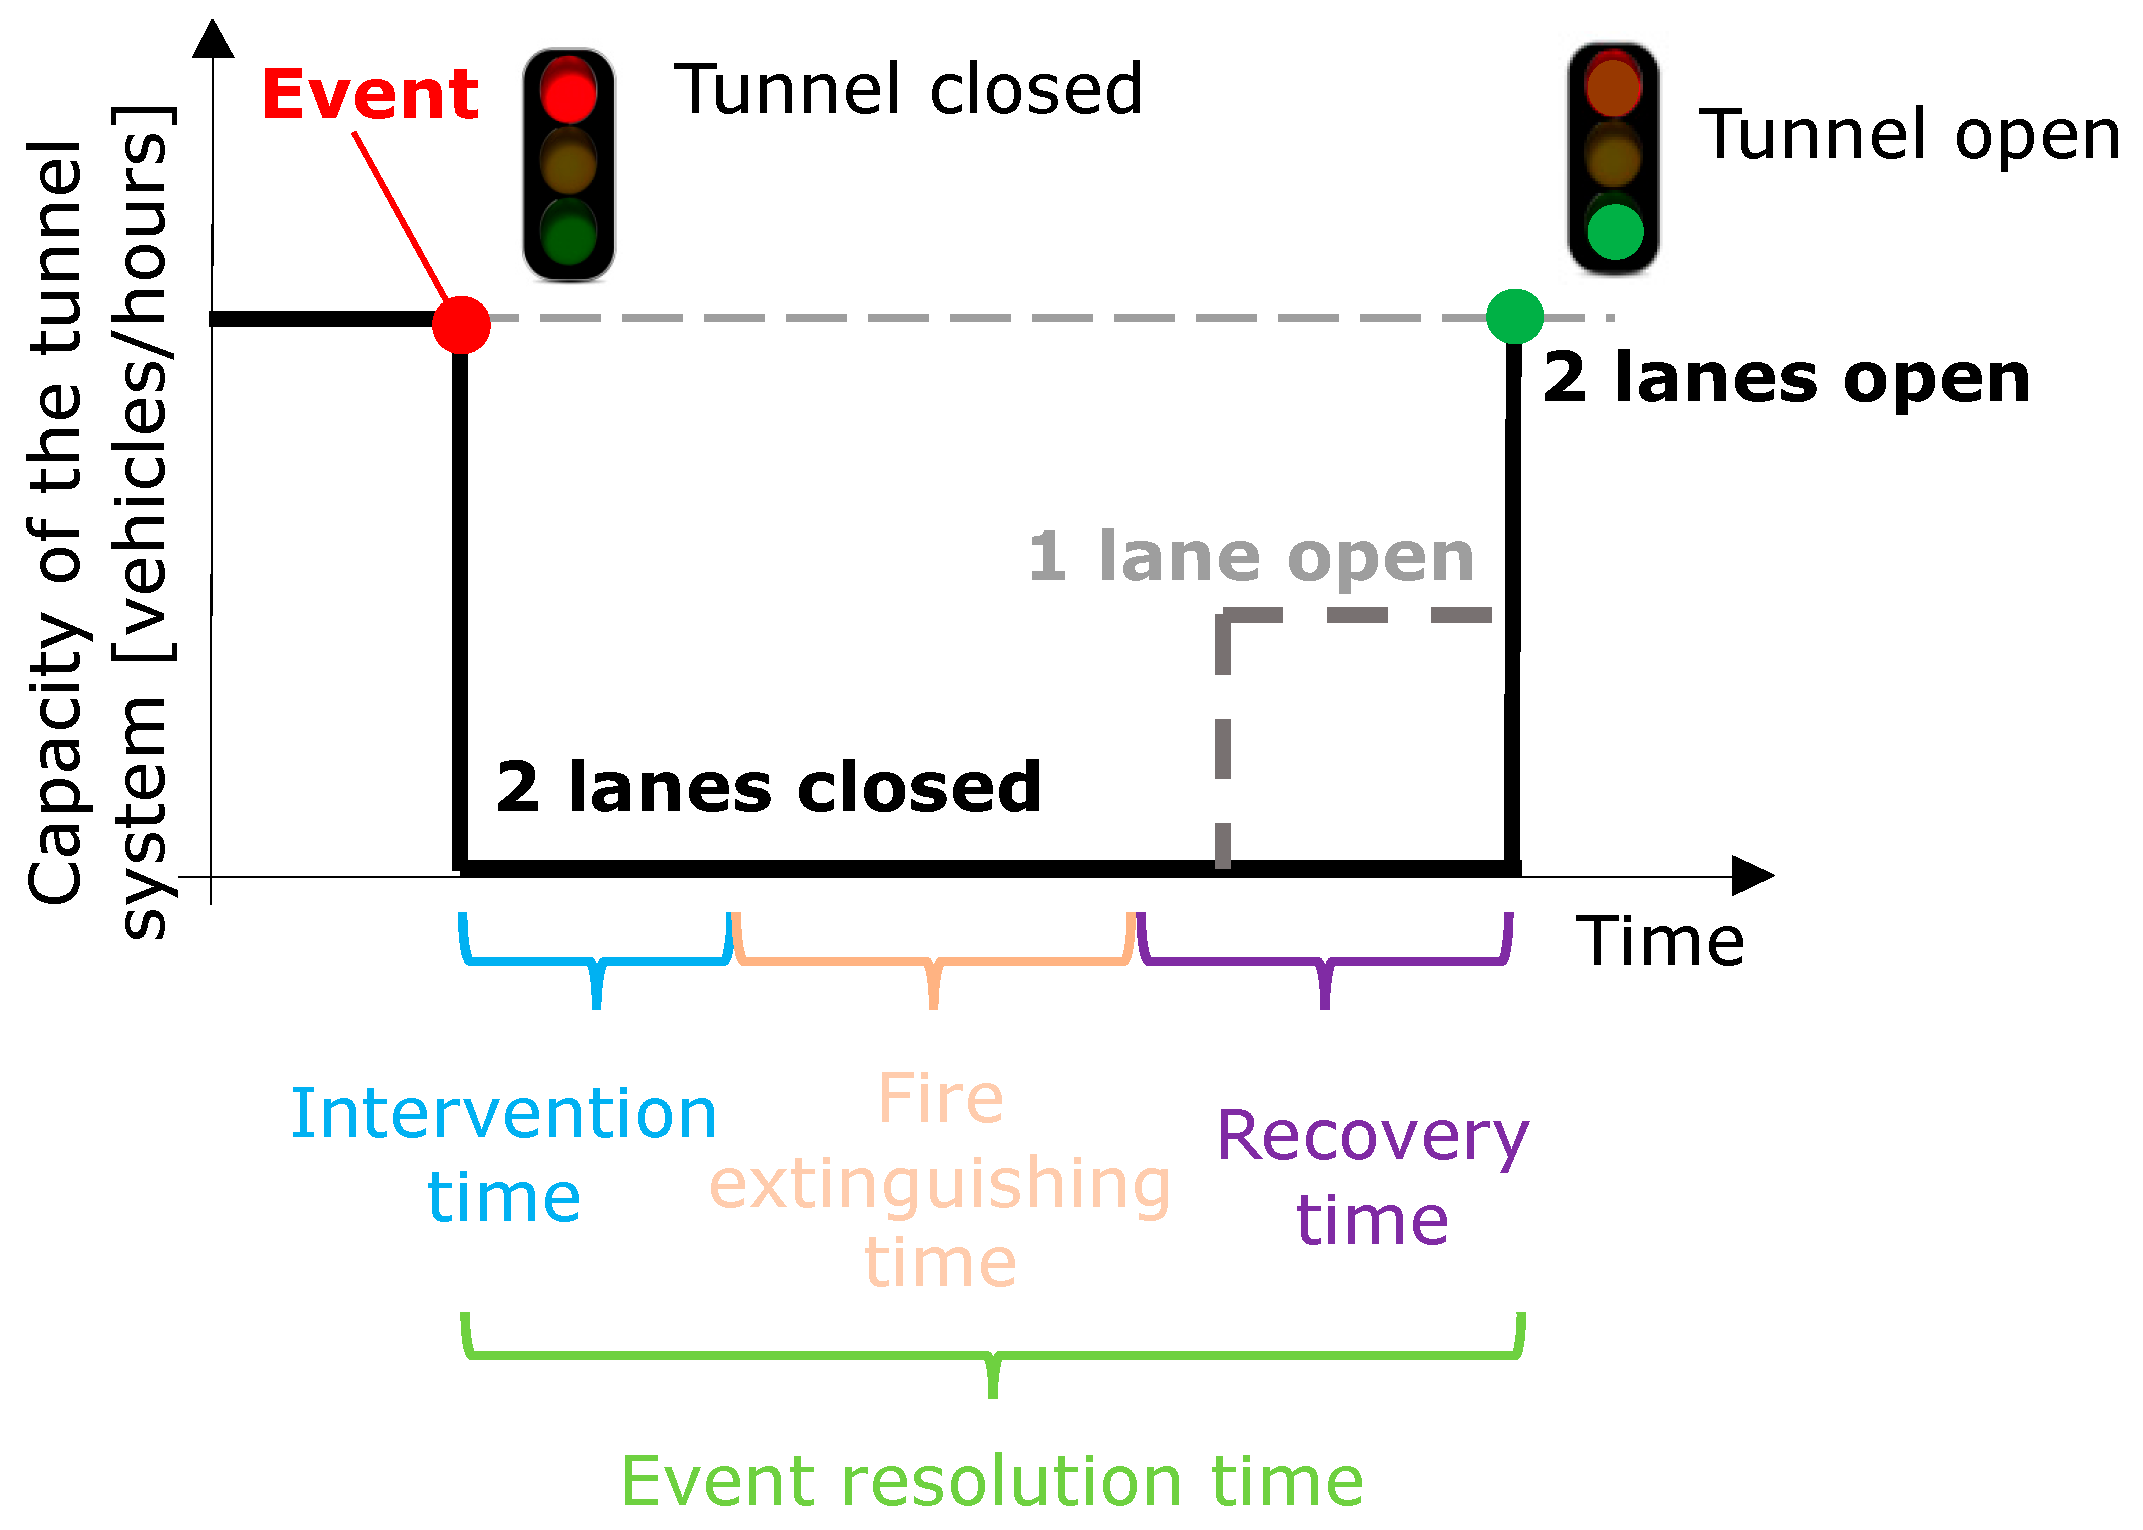
Figure 16.
(a) Statistical analysis of emergency teams’ intervention times and (b) event type. Data source: Strada dei Parchi S.p.A.
Figure 16.
(a) Statistical analysis of emergency teams’ intervention times and (b) event type. Data source: Strada dei Parchi S.p.A.
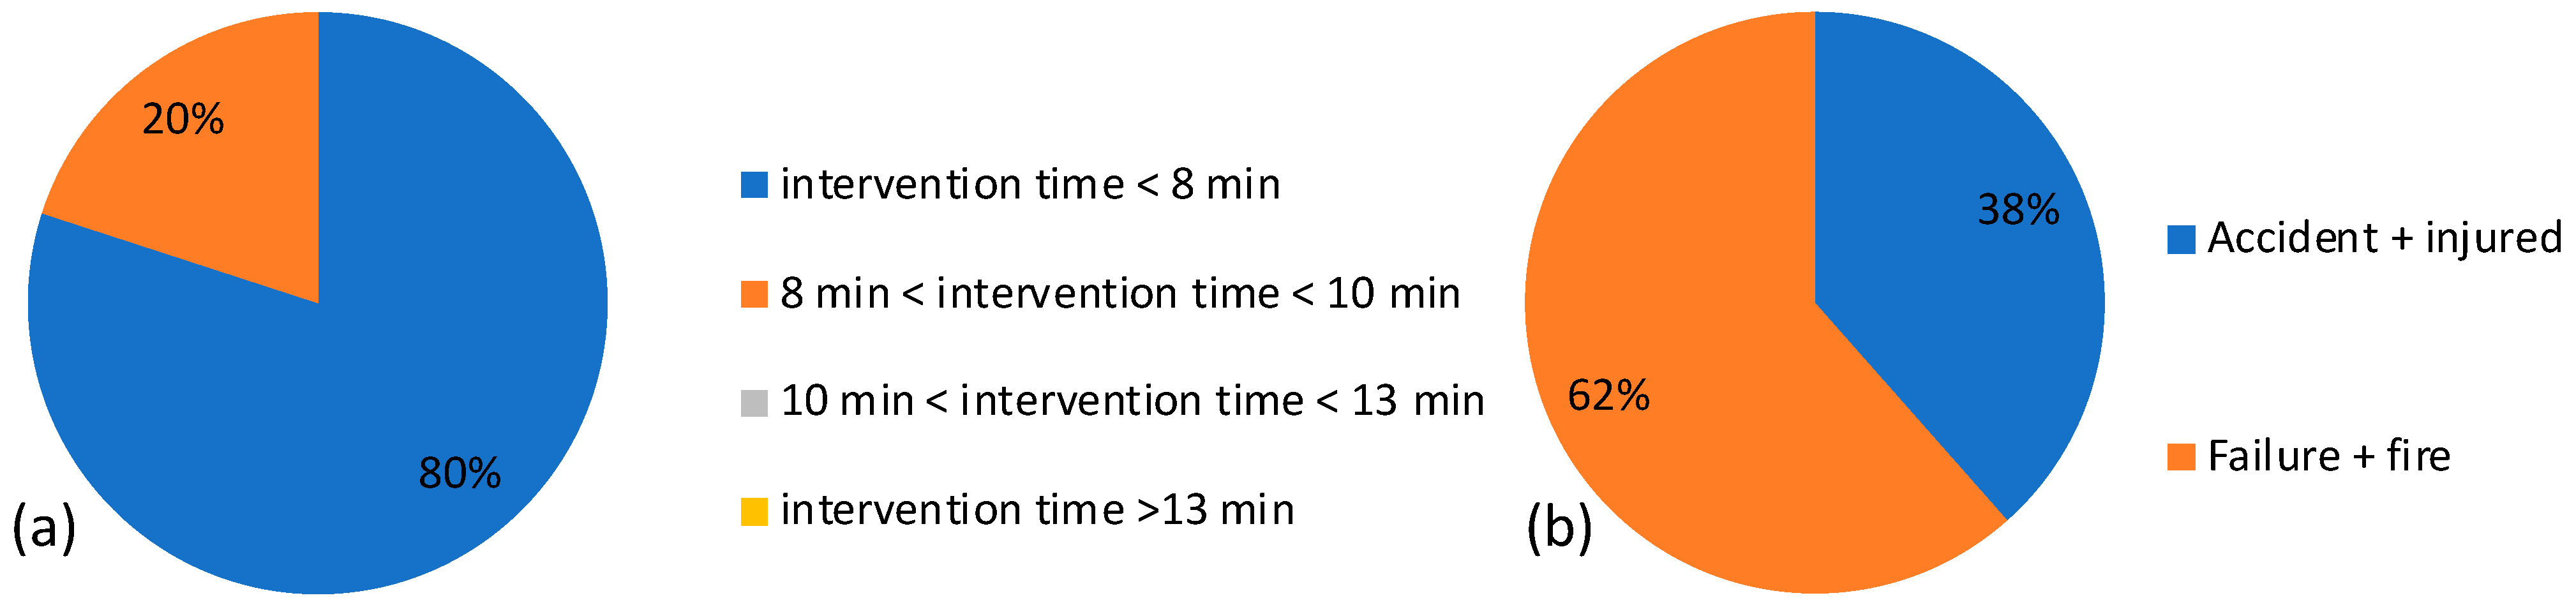
Figure 17.
Representation of intervention time limits for fast- and slow-moving fires, with respective probability of occurrence [39] and representation of the intervention time limit adopted in the risk analysis.
Figure 17.
Representation of intervention time limits for fast- and slow-moving fires, with respective probability of occurrence [39] and representation of the intervention time limit adopted in the risk analysis.

Figure 18.
Extract of the fire event tree implemented in the risk analysis model developed by the authors. Adapted from [55].
Figure 18.
Extract of the fire event tree implemented in the risk analysis model developed by the authors. Adapted from [55].
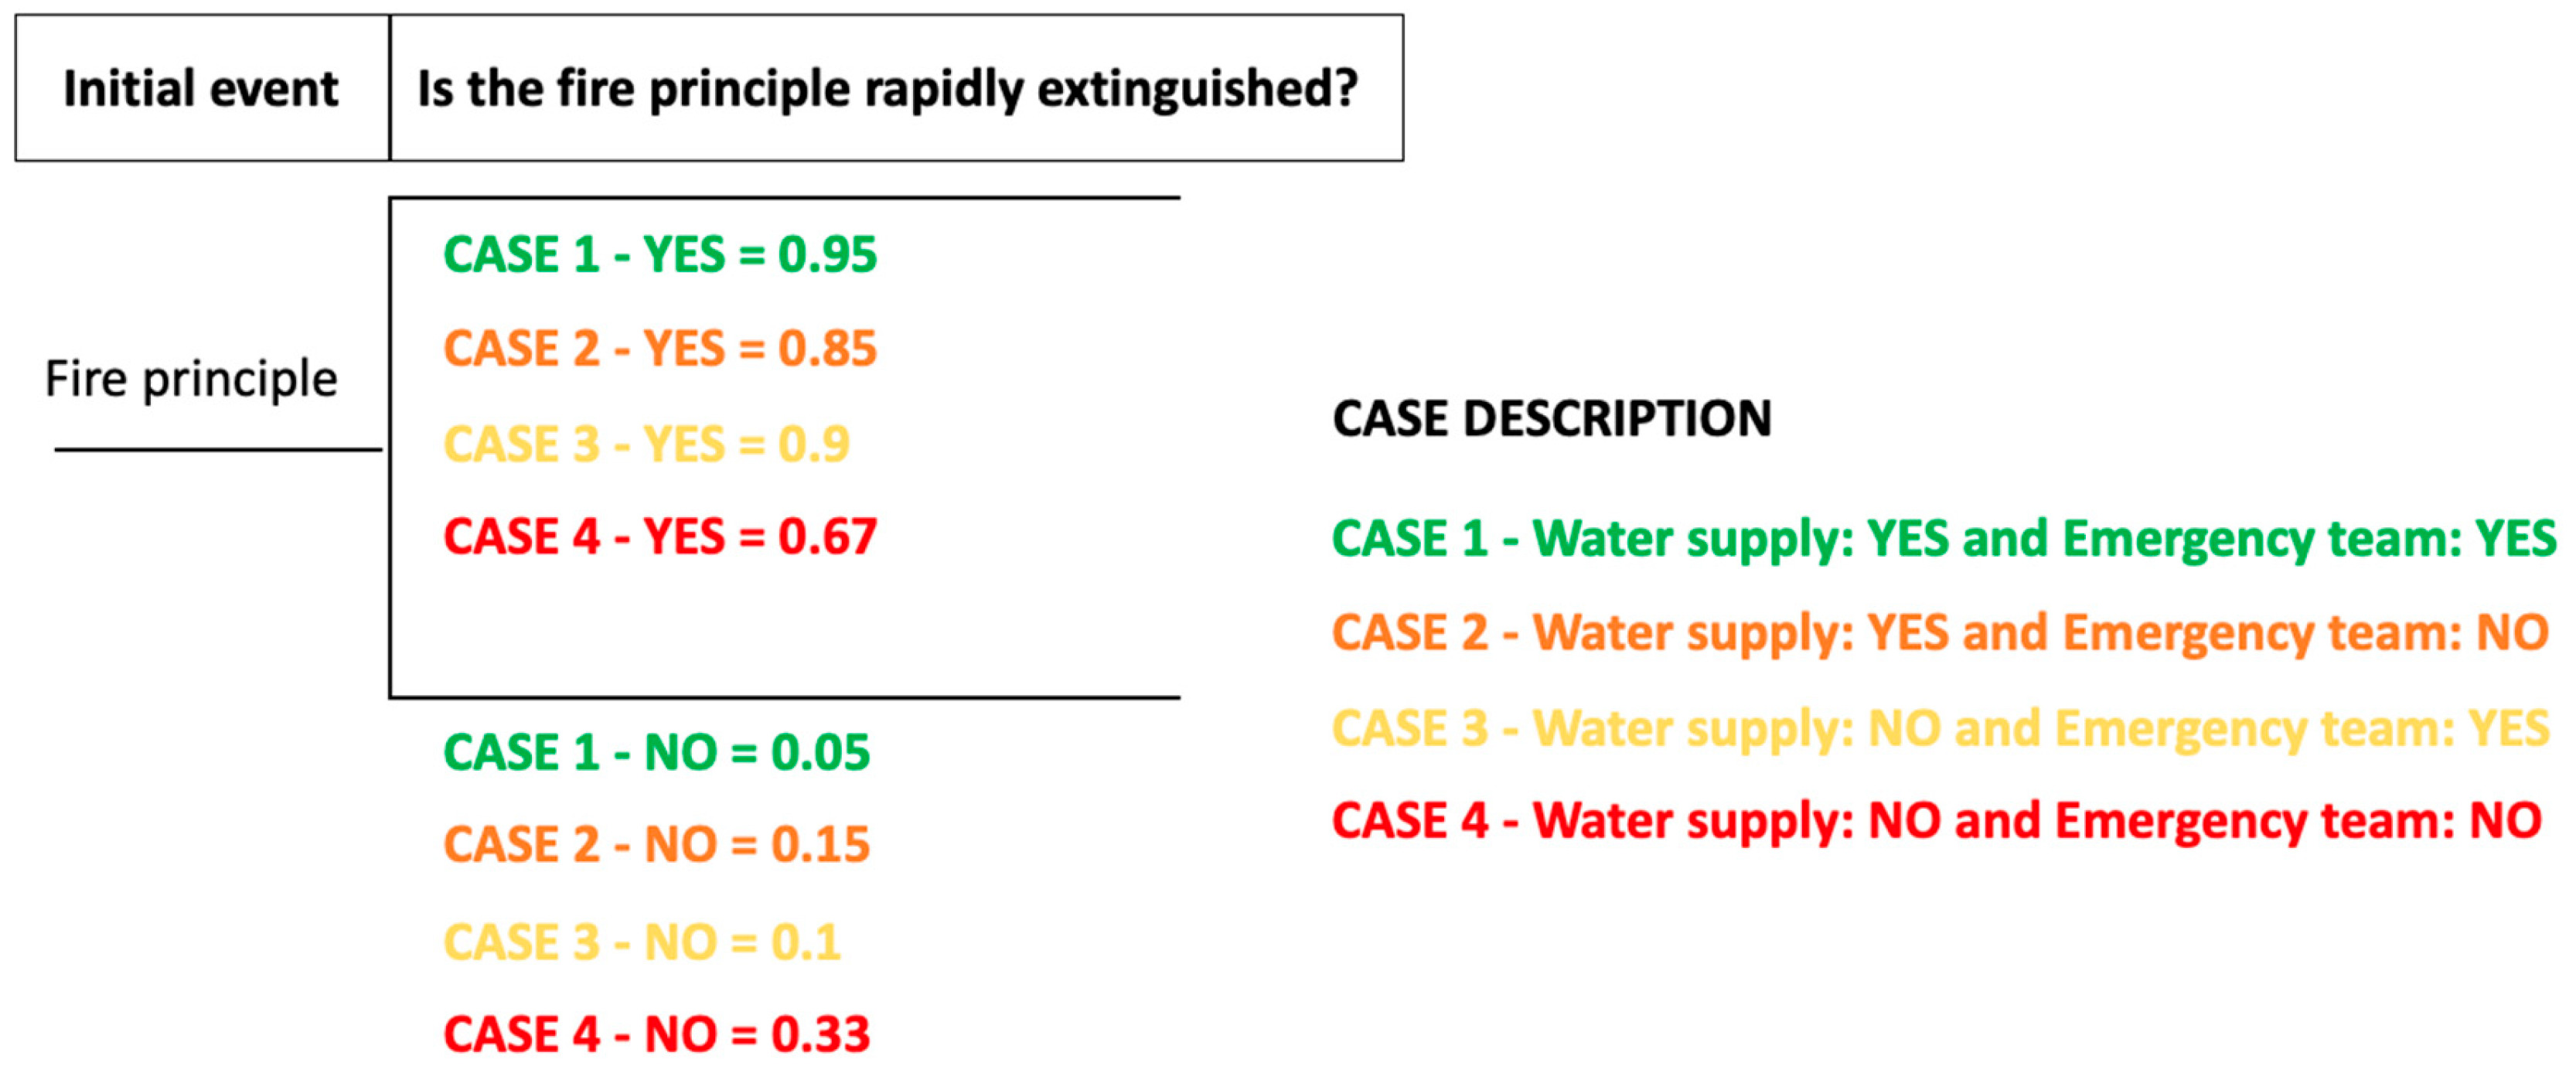
Figure 19.
Event tree of the risk analysis model developed by authors. Adapted from [34].
Figure 19.
Event tree of the risk analysis model developed by authors. Adapted from [34].

Figure 20.
F-N curves calculated with TRAM model [33,34] to evaluate the effectiveness of emergency teams in terms of societal risk mitigation for the Stonio Tunnel (left tube).

Figure 21.
Effect of the availability of emergency teams on the EDV (and % reduction) for the Stonio Tunnel (left tube).
Figure 21.
Effect of the availability of emergency teams on the EDV (and % reduction) for the Stonio Tunnel (left tube).

Table 1.
Components of resilience from [21].
Table 1.
Components of resilience from [21].
| Preparedness | Mitigation | Response | Recovery |
|---|---|---|---|
| Activities taken by an entity to define the hazardous environment to which it is subject | Activities taken prior to an event to reduce the frequency or the severity of a possible accidental event | Immediate and ongoing activities, procedures and systems that have been undertaken or developed to manage the adverse effects of an event | Activities and programs designed to effectively and efficiently restore conditions to a level that is acceptable to the entity |
Table 2.
Classification of road tunnels according to the mode of intervention of emergency teams. Adapted from [39].
Table 2.
Classification of road tunnels according to the mode of intervention of emergency teams. Adapted from [39].
| Tunnel Class | Description | Intervention Time of Emergency Teams |
|---|---|---|
| Class I | Tunnels where the transit of dangerous goods is forbidden | Emergency teams may be able to operate for any response time and fire size |
| Class II | One-way tunnels in which automatic extinguishing systems are installed or which can be reached within 8 min by emergency teams. All fires can be controlled by both emergency teams and automatic systems | t < 8 min |
| Class III | One-way tunnels. Teams are able to control slow developing fires | 8 min < t < 20 min |
| Class IV | Congested and/or two-way tunnels. High probability of fire and fire spread | t > 20 min |
Table 3.
Types of fires and related fire curves. Adapted from [39].
Table 3.
Types of fires and related fire curves. Adapted from [39].
| Type of Fire | Fire Curve |
|---|---|
| Self-developed (69.6%) | A; B |
| Following Collision (30.4%) | C; D |
Table 4.
Description of the four fire curves. Adapted from [39].
Table 4.
Description of the four fire curves. Adapted from [39].
| Fire Curve | Fire Characteristics | HRR (Heat Release Rate) |
|---|---|---|
| A | Slow developing fire with spread that is suppressed by emergency teams | The peak power (HRR—heat release rate) does not exceed the limit (see Figure 4). The power decreases as emergency teams intervene |
| B | Slow developing fire with late intervention of the teams | The peak power exceeds the limit before the teams have intervened |
| C | Rapidly developing fire with no possibility of spread | Peak power does not allow the fire to spread, possibly because of team intervention |
| D | Rapidly developing fire with possibility of spreading | Rapidly developing, high-powered fire that is spreading |
Table 5.
List of 28 tubes with length greater than 500 m (source: Strada dei Parchi S.p.A.).
| Tube Name [R = Right Tube; L= Left Tube] | Length [m] | |
|---|---|---|
| 1 | Ara Salere R | 606 |
| 2 | Ara Salere L | 589 |
| 3 | Roviano R | 805 |
| 4 | Roviano L | 807 |
| 5 | Genzano R | 741 |
| 6 | Genzano L | 738 |
| 7 | Colle Castiglione R | 863 |
| 8 | Colle Castiglione L | 878 |
| 9 | Colledara R | 910 |
| 10 | Colledara L | 916 |
| 11 | Colle Mulino R | 1110 |
| 12 | Colle Mulino L | 1023 |
| 13 | San Giacomo R | 1029 |
| 14 | San Giacomo L | 1025 |
| 15 | Pietrasecca R | 1132 |
| 16 | Pietrasecca L | 1133 |
| 17 | Stonio R | 1243 |
| 18 | Stonio L | 1191 |
| 19 | Monte S. Angelo R | 1585 |
| 20 | Monte S. Angelo L | 1573 |
| 21 | Collurania R | 2088 |
| 22 | Collurania L | 2108 |
| 23 | San Rocco R | 4183 |
| 24 | San Rocco L | 4176 |
| 25 | San Domenico R | 4547 |
| 26 | San Domenico L | 4557 |
| 27 | Gran Sasso R | 10,121 |
| 28 | Gran Sasso L | 10,116 |
Table 6.
Intervention times of emergency teams related to events occurring from May 2019 in some tunnels of the A24/A25 motorways (data source: Strada dei Parchi S.p.A.).
Table 6.
Intervention times of emergency teams related to events occurring from May 2019 in some tunnels of the A24/A25 motorways (data source: Strada dei Parchi S.p.A.).
| Tunnel Tube [R = Right; L = Left] | Event Date [DD/MM/YYYY] | Vehicle Involved [LV: Light Vehicle] [HV: Heavy Vehicle] | A-Event Hour [hh:mm] | Event Type | B-Emergency Team Activation [hh:mm] | C-Arrival on Site [hh:mm] | Intervention Time [min] [C-A] | Fire Extinguishing Time [min] | Event Resolution Time [min] |
|---|---|---|---|---|---|---|---|---|---|
| San Domenico L | 01/05/2019 | 2 LV | 16:44 | Accident + injured | 16:44 | 16:50 | 6 | - | 118 |
| San Rocco L | 12/05/2019 | 2 LV | 12:05 | Accident + injured | 12:05 | 12:15 | 10 | - | 62 |
| San Domenico L | 11/06/2019 | LV | 15:37 | Failure + fire | 15:39 | 15:45 | 8 | - | |
| Gran Sasso L | 15/06/2019 | LV | 18:20 | Accident + injured | 18:22 | 18:30 | 10 | - | 47 |
| Stonio L | 22/06/2019 | LV | 20:43 | Failure + fire | 20:47 | 20:48 | 5 | 6 | |
| Gran Sasso L | 29/06/2019 | LV | 10:46 | Failure + fire | 10:47 | 10:53 | 7 | - | 99 |
| San Domenico L | 15/08/2019 | LV | 19:36 | Failure + fire | 19:40 | 19:43 | 7 | 21 | 70 |
| Gran Sasso L | 29/08/2019 | LV | 07:21 | Failure + fire | 07:22 | 07:26 | 5 | 10 | 69 |
| San Rocco L | 25/09/2019 | 2 LV | 08:49 | Accident + injured | 08:50 | 08:54 | 5 | - | 52 |
| Collurania L | 02/01/2020 | LV | 18:44 | Accident + injured | 18:45 | 18:48 | 4 | - | |
| San Rocco R | 21/02/2020 | LV | 09:40 | Failure + fire | 09:40 | 09:42 | 2 | - | 83 |
| San Rocco R | 23/02/2021 | LV | 12:23 | Failure + fire | 12:23 | 12:25 | 2 | 15 | 51 |
| Gran Sasso L | 29/06/2021 | HV | 10:02 | Failure + fire | 10.02 | 10:07 | 5 | - | 408 |
| Gran Sasso L | 15/10/2021 | LV | 08:27 | Failure + fire | 08:27 | 08:32 | 5 | 6 | 55 |
| Roviano R | 25/11/2021 | LV | 08:28 | Failure + fire | 08:32 | 08:35 | 7 | 24 | 49 |
Table 7.
Main data of the Stonio Tunnel (left tube).
| Parameter | Value |
|---|---|
| Length [m] | 1190 |
| Section [m2] | 54 |
| Number of lanes | 2 |
| Distance between the emergency exits [m] | 587; 38 |
| ADT—average daily traffic [vehicles/day] | 16,090 |
| Peak time flow when the analysis was carried out [vehicles/h] | 1609 (10% ADT) |
| Longitudinal slope [%] | −2.6 |
| Average number of passengers in a light vehicle | 2 |
| Average number of passengers in a heavy vehicle | 1.1 |
| Average number of passengers in a bus | 30 |
| Percentage of light vehicles [%] | 88 |
| Percentage of heavy vehicles [%] | 11 |
| Percentage of buses [%] | 1 |
| Average speed of the light vehicles [km/h] | 110 |
| Average speed of the heavy vehicles/buses [km/h] | 70 |
Table 8.
Main safety measures of the Stonio Tunnel (left tube).
| Infrastructure Measures, Equipment and Management Procedures | Presence |
|---|---|
| Road signs | YES |
| Traffic lights and/or arrow-cross panels inside the tunnel | NO |
| Variable message panels inside the tunnel | YES |
| Emergency messages by radio for tunnel users | NO |
| Speakers in shelters and at emergency exits | NO |
| Emergency lighting | YES |
| Emergency pedestrian platforms | YES |
| Emergency team | YES |
| Emergency ventilation | YES |
| Control center | YES |
| TVCC with AID (automatic incident detection) | YES |
| Fibrolaser | YES |
| Traffic lights and/or arrow-cross panels at the tunnel entrance | YES |
| GSM (global system for mobile communications) coverage | YES |
| Emergency stations | YES |
| Fixed fire-fighting system | NO |
| Flammable liquid drainage | YES |
| Water supply | YES |
Publisher’s Note: MDPI stays neutral with regard to jurisdictional claims in published maps and institutional affiliations. |
© 2022 by the authors. Licensee MDPI, Basel, Switzerland. This article is an open access article distributed under the terms and conditions of the Creative Commons Attribution (CC BY) license (https://creativecommons.org/licenses/by/4.0/).
Share and Cite
MDPI and ACS Style
Borghetti, F.; Frassoldati, A.; Derudi, M.; Lai, I.; Trinchini, C. Road Tunnels Operation: Effectiveness of Emergency Teams as a Risk Mitigation Measure. Sustainability 2022, 14, 15491. https://doi.org/10.3390/su142315491
AMA Style
Borghetti F, Frassoldati A, Derudi M, Lai I, Trinchini C. Road Tunnels Operation: Effectiveness of Emergency Teams as a Risk Mitigation Measure. Sustainability. 2022; 14(23):15491. https://doi.org/10.3390/su142315491
Chicago/Turabian StyleBorghetti, Fabio, Alessio Frassoldati, Marco Derudi, Igino Lai, and Cristian Trinchini. 2022. "Road Tunnels Operation: Effectiveness of Emergency Teams as a Risk Mitigation Measure" Sustainability 14, no. 23: 15491. https://doi.org/10.3390/su142315491
Note that from the first issue of 2016, this journal uses article numbers instead of page numbers. See further details here.