


Spatial Structure of China’s Green Development Efficiency: A Perspective Based on Social Network Analysis
1
School of Geography and Tourism, Qufu Normal University, Rizhao 276826, China
2
Rizhao Key Laboratory of Territory Spatial Planning and Ecological Construction, Rizhao 276826, China
3
Faculty of Culture Tourism, Shanxi University of Finance and Economics, Taiyuan 030031, China
*
Author to whom correspondence should be addressed.
Sustainability 2022, 14(23), 16156; https://doi.org/10.3390/su142316156
Submission received: 7 September 2022
/
Revised: 14 November 2022
/
Accepted: 29 November 2022
/
Published: 3 December 2022
(This article belongs to the Special Issue Regional Governance and Ecological Sustainability)
Abstract
:Clarifying the spatial correlation network structure of green development efficiency (GDE) is of great significance for realizing coordinated and sustainable development in China. By constructing the evaluation index system of GDE, this study used the super epsilon-based measure (EBM) model that considers undesirable output to measure the GDE of China from 2000 to 2018, based on which the characteristics of the spatial correlation network characteristics and influencing factors were analyzed using social network analysis (SNA) and a geographical detector. The results indicated that: (1) The GDE of China as a whole remained relatively stable, and there was a significant spatial spillover effect of GDE between provinces; the spatial correlation network demonstrated complex and dense characteristics, and the closeness and stability of the network gradually increased. However, the strict hierarchical structure of the network still existed. (2) The eastern coastal provinces exhibited significant spillover effects and connectivity functions, while the northeastern and central-western provinces are located at the edges of the spatial correlation network. (3) The GDE spatial correlation network is divided into a leader subgroup, bridge subgroup and net benefit subgroup, with no isolated subgroup. (4) The economic development level, urbanization and financial development have a decisive impact on the formation of the GDE spatial correlation network.
1. Introduction
Since the reform and opening up of China, the economy has continued to grow rapidly and great achievements have been made in social and economic development. Owing to the rapid development of industrialization and urbanization, the traditional extensive development model has put pressure on the environment and resources [1]. Consequently, multiple development crises have emerged, and the issue of the sustainability of economic development has attracted unprecedented attention [2]. To solve these problems, a series of concepts such as the “green new deal” [3], “green growth” [4], and “green economy” [5] have been proposed and widely disseminated. The practical experience of green development in developed countries has proven that green development can ensure the stability and sustainability of socioeconomic development [6,7,8].
For China, the world’s largest developing country, after years of rapid growth, its economic aggregate has risen to the second largest in the world [9]. China has expended a significant amount of resources and incurred environmental costs [10]. An increase in environmental pollution and ecological damage has constrained the sustainable development of China. Green development was an important way to achieve sustainable development. Therefore, it has become meaningful to accurately measure the level of green development in China. Based on the regional perspective in China, the spatial heterogeneity of green development has been expanding due to differences in industries, economies, and resources among regions [11], which has seriously limited the regional synergistic growth of GDE. In addition, with the advancement of China’s regional coordinated development strategy, the mobility of various production factors and the spatial spillover effect of GDE has increased [12]. The complexity of the spatial correlation structure has intensified. Therefore, it is necessary to analyze the structural characteristics of the spatial correlation network of GDE to achieve regional synergistic sustainable development.
The literature review revealed that previous studies on green development mainly focused on empirical measurements and spatial analysis. Regarding empirical measurements, early studies mainly focused on green development related topics, such as the environment, energy, green innovation, and low-carbon economy [13,14,15]. Subsequently, more scholars attempted to comprehensively measure green development by establishing a composite evaluation system. Among them, the “green development index system” [16], “five circle model” [17], and “Driver-Pressure-State-Impact-Response (DPSIR) model” [18] have become the theoretical bases for establishing the evaluation system, entropy method [19], and principal component analysis method [20] are used as computational tools. The efficiency evaluation method of the input-output perspective can reflect the allocation level of production factors. Therefore, it is extensively used for green development measurements. Currently, the commonly used models include two types: the radial data envelopment analysis (DEA) model [21] and the non-radial slacks-based measure (SBM) model [22]. The radial DEA model requires that input or output factors change in equal proportions [23] and does not cover non-radial slack variables. Although SBM models (based on non-radial measures) consider the problem of slack variables, they tend to lose information on the proportion between the target and actual values of inputs and outputs [24]. Therefore, both the traditional radial-based DEA model and the non-radial-based SBM model possess drawbacks that may bias measurement results.
Regarding spatial analysis, the literature mainly reviewed spatial differentiation characteristics and correlation. Existing studies have been mainly conducted on different scales, such as global [25], provincial [19], and municipal [22], and the influencing factors have been discussed. Exploratory spatial analysis techniques can analyze the spatial correlation of GDE. The spatial clustering characteristics of GDE have been demonstrated in many studies [26,27], which indicates that green development levels between neighboring regions tend to be similar, implying a spatial spillover effect of its efficiency. Other studies have indicated that economic, financial, urbanization and resource utilization can drive the green development level of surrounding areas through spillover effects [28,29,30], thus establishing clustered green development. That is the essential reason for the spatial correlation of GDE.
It can be observed although the existing studies of green development have made great contributions, certain defects require improvement. First, the evaluation of GDE mostly uses radial DEA models or non-radial SBM models, which are subject to measurement errors due to their shortcomings. However, the Super-EBM model, which combines radial and non-radial characteristics, is compatible with the proportional relationship between input-output targets and actual values and solves the problem of non-radial slack variables [31], thus improving measurement accuracy. Second, existing studies are limited by attribute data and mainly analyze the spatial characteristics of GDE based on geographic adjacency relationships. With the continuous promotion of China’s coordinated regional development strategy, there is spatial correlations of GDE in nonadjacent regions. However, traditional methods are difficult to analyze the spatial correlation effects across regions and lack effective descriptions of the spatial structural characteristics and correlations of GDE. Social network analysis (SNA) is a method founded on relational data. It breaks through the limitation of spatial adjacency and can perform a global analysis of spatial correlation features from the perspective of complex networks; therefore, it is extensively used in economics, sociology, and management studies [32,33,34]. Here, this method was adopted to analyze the GDE spatial correlation. The purpose was to clarify spatial correlation characteristics from an overall perspective and provide theoretical references for its coordinated and sustainable growth at the regional level.
In view of this, the aim of this study was to measure the level of green development in China by evaluating the GDE, and then analyze the structure of the spatial correlation network of China’s GDE from a complex network perspective, based on relational data. It also quantitatively identified the influencing factors of the spatial correlation network of GDE in China. In order to achieve these research objectives, this study used 30 provincial administrative regions in China (excluding Hong Kong, Taiwan, Macau, and Tibet) as study units to construct a GDE input-output evaluation index system, measured the GDE from 2000 to 2018 using the Super-EBM model. The modified gravity model was used to measure the spatial correlation matrix of GDE in China, and the SNA was used to analyze the structural characteristics of the correlation network and the position of each province in the network. Finally, this study used the QAP correlation analysis and geographical detector to identify the influencing factors of the spatial correlation network. We expect this study to deepen the theoretical knowledge of the structure of the spatial correlation network of GDE in China, and at the same time, provide theoretical references for the formulation of green synergistic development policies.
The possible contributions or innovations of this study are as follows: (1) The evaluation index system of GDE in existing studies is not comprehensive enough and lacks consideration of social factors. We have built a relatively comprehensive evaluation index system that takes into account economic, social, environmental and other factors. At the same time, the Super-EBM model that considers undesired output is used to measure GDE, which improves the accuracy of the measurement results. (2) From the perspective of spatial correlation, a modified gravity model and SNA to elucidate the overall structure and centrality of the spatial correlation network of GDE. (3) QAP correlation analysis is used to identify the influencing factors of the GDE spatial correlation network, and then the influencing factors of the spatial correlation network were detected using the geographical detector.
The rest of the paper is organized as follows: Section 2 provides the main methods, evaluation index system, influencing factors variables, research area, and data source. Section 3 analyzes the network structure characteristics and influencing factors. Section 4 presents a discussion. The main conclusions are presented in Section 5.
2. Methods and Data
2.1. Measurement of GDE
2.1.1. Super-EBM Model
Most existing studies measuring GDE use radial DEA models or non-radial SBM models. Tone et al. constructed a hybrid model (EBM) that contains radial and non-radial distance functions [31]. To solve the ranking problem of undesirable output elements and decision units, this study incorporated undesirable output elements in the EBM model and incorporated the superefficient DEA model proposed by Andersen et al. [35]. Thus, the Super-EBM model that considers undesirable outputs is non-oriented has constant payoffs of scale, and is defined as follows:
where r* represents the comprehensive efficiency value under constant return to scale; x, y, and z represent the input, expected output, and undesired output elements, respectively; n, m, s, and q represent the number of decision-making units, inputs, expected output, and undesired output, respectively; λ represents the relative importance of the reference unit; θ is the calculated radial efficiency value; , and are the weights of the ith input, rth expected output, and pth undesirable output indicators, respectively; and represent the slack of the rth expected output and the pth undesired output, respectively; ε represents the core parameter representing the importance of the non-radial component in the Super-EBM model, and the range of values is 0–1.
2.1.2. Evaluation System
GDE is an important measure of the level of green development, considering the combined efficiency of the economy, nature and society. Combined with the connotation of GDE and existing studies [19,36,37], the economic, social, and environmental factors were incorporated into the GDE evaluation framework. This study established a GDE evaluation system that included undesirable outputs (Table 1).
Labor, capital, resources, and material elements are the basic input indicators in economic activities; therefore, input indicators were selected from these four aspects. The number of employees was selected as the labor input indicator [38]; the capital input indicators were selected as fixed asset stock [39]; and the material input considered three aspects (energy, resources, and land), which were expressed by the total energy consumption [40], total water consumption [41], and built-up area [42], respectively. Given the progressively significant role of technological innovation in green development, the internal expenditure of research and experimental development funds was selected as the technology input indicator [43].
Output indicators included economic, social, and undesired environmental outputs. The economic output has been chosen as the regional gross domestic product (GDP) [40]. The social output indicator represented per capita retail sales of consumer goods [44], average employee wages [45], average years of education, per capita life expectancy, and green coverage in built-up areas [44]. These indicators were related to residents’ lives in terms of consumption, income, education, medical care, and living environment. The undesired environmental output indicators included total wastewater discharge [46], sulfur dioxide discharge [41], smoke (dust) discharge [40], and general industrial solid waste generation [38]. Considering the DEA model requires the number of decision-making units to exceed three times the sum of the input and output variables, the entropy value method was used for data containing multiple secondary indicators.
2.2. Social Network Analysis
Conceptually, GDE contains mobility elements, such as capital, human, and resources. The mobility of these elements in economic development activities will enhance the degree of interregional correlation and improve the GDE between regions, thus constituting a complex network structure that meets the conditions for the application of the SNA method. Therefore, this paper adopted the SNA method to analyze the spatial network structure of GDE in China.
2.2.1. Building a Spatial Correlation Network
The construction of a spatial correlation network is a prerequisite for SNA. Here, based on existing studies [47,48], this paper constructed a modified gravity model to measure the spatial correlation network of GDE in China. The specific model is as follows:
where Fij is the spatial correlation strength of GDE between provinces i and j, M denotes the GDE values, g is the per capita gross regional products, and Dij denotes the geographical distance between provincial capital cities. To portray the bidirectional and asymmetric nature of the correlation, Kij was set as the gravitational coefficient, representing the contribution rate of province i to the GDE between provinces i and j. The gravitational matrix was calculated according to Equation (2), and the critical values are the average of each row in the matrix. If the correlation strength F was greater than the average, it was recorded as 1, indicating a correlation between the two provinces; otherwise, it was recorded as 0, indicating no correlation. The spatial binary matrix constructed by the aforementioned calculation constitutes the basic data for network structure analysis.
2.2.2. Overall Network Structure Characteristics
Four indicators were usually selected to study the overall network structure characteristics: network density, hierarchy, efficiency, and relationships. These indicators were used to analyze the structure and evolution of the network.
Network density [49] measures the tightness of connections between provinces. The higher the density of the network, the stronger the correlation between provinces in the network.
where D represents the network density value, L and N represent the actual number of correlation relationships and the number of units in the network, respectively.
Network hierarchy [50] measures the extent to which network members are asymmetrically accessible. The greater the value, the more rigid the hierarchical structure, indicating that some provinces are dominated in the network.
where H represents the network level, K represents the number of symmetrically reachable member pairs, and max(K) represents the maximum possible number of pairs of symmetrically reachable members.
Network efficiency [51] reflects the connection efficiency between members. The lower the efficiency, the more spillover channels and the more stable the network.
where E represents the network efficiency, M and max(M) are the numbers of redundant lines and the maximum number of connections in the network.
2.2.3. Centrality
Centrality is used to clarify the function, status, and participation degree of each province. It includes degree, closeness, and betweenness centrality.
Degree centrality [52] measures the location of a province in the network. The higher degree of centrality indicates that the province is more related to other provinces and closer to the center of the network.
where CAD represents the degree centrality, n represents the number of other provinces in the network that are directly associated with a province, and N is the total number of provinces.
Closeness centrality [53] measures the ability of provinces to act autonomously in the network. Provinces with higher closeness centralities have more direct correlations, and the province belongs to the central actor.
where CAP represents the closeness centrality, dij is the shortcut distance between the two provinces (the number of relations contained in the shortcut).
Betweenness centrality [54] indicates the ability of the province to control the associated relationships in the network. The higher the betweenness centrality, the more that the province plays a leading role in the establishment of relationships between other provinces.
where CAB represents the betweenness centrality, gjk represents the number of shortcuts between provinces j and k, gjk(i) denotes the number of shortcuts between provinces j and k that pass through province i, and bjk(i) is the probability that province i is on the shortcut between j and k, j ≠ k ≠ i, and j < k.
2.2.4. Cohesive Subgroups
Cohesive subgroup analysis is a quantitative analysis of the ‘small groups’ within a spatial correlation network to reveal the structural characteristics and interaction mechanisms of the different subgroups formed by the nodes in the network [55]. Analyzing cohesive subgroups allows us to understand the structural rules within a spatial correlation network.
2.3. Analysis of Influencing Factors
2.3.1. The QAP Correlation
The spatial correlation network has been affected by a variety of factors. Traditional measurement methods induce the problem of multicollinearity, which causes result errors. QAP correlation is conducted by examining whether two matrices are correlated and performing nonparametric tests of the coefficients [56]. This method performs the tests considering the relative independence of each influencing factor, thereby preventing multicollinearity.
2.3.2. Geographical Detector
The geographical detector is a statistical method to detect the differences in geographical elements and influencing factors of spatial distribution [57]. A geographical detector includes four parts: interactive detector, factor detector, ecological detector and risk detector. In this paper, the interactive detector in the geographical detector is used to analyze the influence strength of driving factors on the spatial correlation network of China’s GDE.
2.3.3. Influencing Factors Variables
According to previous studies, the spatial correlation network is jointly influenced by multiple factors. Here, according to the development characteristics of China, seven factors were selected as independent variables, and the spatial correlation network indicator of GDE was the dependent variable. These factors include economic development level [39], industrial structure [42], technology level [50], urbanization [58], environmental regulation [59], financial development, and resource endowment [60]. These indicators were chosen to characterize GDP per capita (pgdp), the proportion of the added value of the tertiary industry to GDP (inds), the proportion of technology market transactions to GDP (tech), the urbanization rate of the population (urb), the proportion of investment in industrial pollution control to GDP (er), the balance of loans from financial institutions (fina) and regional power generation, respectively (res).
2.4. Data Source and Processing
Here, 30 provinces and cities in China were selected as study regions, excluding Hong Kong, Taiwan, Macau, and Tibet. Based on the differences between the regions and previous division experiences, we divided the 30 provinces and cities into three major regions, namely eastern, central, and western [61] (Figure 1).
Panel data from 2000 to 2018 were selected as the research sample in this study because of the completeness and continuity of the data. The data were obtained from the China Statistical Yearbook, China Population and Employment Statistical Yearbook, China Energy Statistical Yearbook, China Environmental Statistical Yearbook, and the statistical yearbooks of provinces and regions from 2001 to 2019. The capital stock data were not directly available; therefore, the perpetual inventory method was used to measure the capital stock of each province. To avoid the effect of price factors, the data on regional GDP and total retail sales of social consumer goods per capita were converted to constant prices using 2000 as the base period. The spherical distances between the provinces were calculated using ArcGIS10.4.
3. Results
3.1. Calculation Results of GDE
As presented in Figure 2, the national average remained at approximately 0.7, showing slight fluctuation and stage characteristics. There are significant differences in the spatial distribution of GDE, showing the following spatial characteristics: east > central > west.
3.2. Spatial Correlation Network Analysis of GDE in China
Figure 3 indicates that the spatial correlation network of GDE has a dense and complex structure and that no provinces are independent of the network. This shows that the GDE has broken through traditional administrative boundary restrictions and that there are interconnections among different provinces. In 2000, Beijing, Shanghai and Tianjin had the largest number of correlations in the spatial correlation network of GDE and were in the core position. In 2018, in addition to Beijing, Shanghai and Tianjin, Jiangsu was also at the core. The result indicates that the complexity of the GDE correlation network in China has gradually increased.
3.2.1. Overall Network Structure
As presented in Figure 4, the relationships increased from 152 in 2000 to 205 in 2018, and the density subsequently rose from 0.175 to 0.236, indicating that the spatial correlation of GDE is gradually increasing. However, relationships and density remain relatively low, and the linkages among provinces in the spatial correlation network need to be strengthened.
The network hierarchy always remains above 0.9, reflecting the existence of an extremely strict hierarchical structure within the spatial correlation network. The results indicate that most provinces are at the edge of the network, except for very few provinces that strongly influence the network. The network efficiency dropped from 0.697 to 0.567, indicating that the spillover channels in the network increased, and the spillover cost of GDE decreased, which enhanced the stability of the spatial correlation network.
3.2.2. Centrality Analysis
As presented in Figure 5, spillover relationships in coastal provinces such as Beijing, Shanghai, Tianjin, Zhejiang, Jiangsu, Fujian, and Guangdong were significantly higher than the reception relationships, and they were spillover subjects in the network. The reception relationships were significantly higher than spillover relationships in the central and western provinces.
As shown in Table 2, the average degree centrality increased from 27.816 to 39.310 between 2000 and 2018, indicating that the degree centrality of most provinces increased and that the gap between provinces had narrowed. This indicates that the tightness and balance of the network are enhanced. Beijing, Shanghai, Tianjin, and Jiangsu consistently ranked high and strongly influenced the spatial correlation network. These provinces have strong economic foundations, strong technological innovation capabilities, and high levels of green economic development and resource factor allocation, so they dominate the spatially correlated network. The degree of centrality of the northwestern region (Xinjiang, Ningxia, and Qinghai) and the northeastern region (Liaoning, Heilongjiang, and Jilin) improved.
The average closeness centrality increased from 28.091 to 35.733 between 2000 and 2018, indicating an enhancement in the stability of the spatial association network. However, there were large disparities among the regions. The closeness of centrality of eastern provinces such as Shanghai, Beijing, Tianjin, Jiangsu, Zhejiang, and Fujian was always above the average, indicating that these provinces can quickly connect with other provinces in the spatial correlation network and are in the center. These provinces were more quickly connected to other provinces because of their economic and trade activities and advantageous geographical locations. Contrarily, provinces such as Xinjiang, Ningxia, Heilongjiang, Qinghai, Sichuan, and Heilongjiang were limited by their remote geographical location and backward industrial structure; they were in a marginal position in the network.
The average betweenness centrality increased from 1.322 to 2.451 between 2000 and 2018, the number of provinces above average increased from five to nine, and the dominant role of central network nodes demonstrated an increasing trend. Shanghai, Beijing, Tianjin, Guangdong, and Jiangxi had higher betweenness centralities, and they played the role of “intermediary” and “bridge” and controlled the flow of resources and information. The betweenness centrality of western provinces, such as Xinjiang, Ningxia, Qinghai, and Sichuan, was always zero, and they could not effectively connect spatial correlation networks. Provinces such as Henan, Hebei, Hubei, Hunan, and Anhui in the central region exhibited low betweenness centrality, with very weak control over the spatial correlations of other provinces.
3.2.3. Cohesive Subgroups Analysis
Based on the spatial correlation network of China’s GDE in 2000 and 2018, the CONCOR method in UCINET 6.0 software was used to analyze the distribution and interaction of cohesive subgroups within the spatial correlation network. As can be seen from Figure 6, the spatial correlation network of GDE was divided into eight cohesive subgroups in 2000, and the composition of each subgroup showed significant proximity characteristics. In 2018, the number of subgroups decreased by 1, the composition of subgroups changed, and the composition of cohesive subgroups gradually broke through the restrictions of geographical space. For example, in 2000, cohesive subgroup 7 consisted of Liaoning, Jilin and Heilongjiang, while in 2018, cohesive subgroup 7 included Xinjiang, Hainan and Jiangxi. The composition of the cohesive subgroup broke the traditional east-central-west horizontal distribution pattern and formed a complex spatial correlation network.
We drew a cohesive subgroups interaction map to intuitively analyze the interrelationships among cohesive subgroups (Figure 7). As shown in Figure 7, the spatial correlation of GDE in China is dominated by the spillover between cohesive subgroups, and the correlation between cohesive subgroups gradually becomes closer over time. As per the cohesive subgroups’ interaction diagram, each cohesive subgroup plays a different role in the spatial correlation network of GDE, which can be roughly divided into four categories: (1) Leader subgroup. The cohesive subgroups composed of Beijing, Tianjin and Shanghai have a significant reception and spillover relationship with other subgroups, showing strong control, with the role of driving other subgroups to improve their GDE, promoting the formation and development of spatial correlation network. (2) Bridge subgroup. The cohesive subgroups composed of the southeast coastal areas and the surrounding areas play a connecting role in the spatial correlation network. (3) Net benefit subgroup. The cohesive subgroup, mainly composed of Gansu, Ningxia, Qinghai and Yunnan, obtained spillover effect from other subgroups. However, the radiation effect on other subgroups is very weak and plays the role of “beneficiary” in the network. (4) Isolated subgroup. There is no significant isolated subgroup in the spatial correlation network of China’s GDE, indicating complex correlation relationships among the subgroups.
3.3. Analysis of Influencing Factors
In this paper, QAP correlation analysis was adopted, and 5000 randomized replacements were selected to calculate the correlation between the spatial correlation network of GDE in China and various influencing factors to determine whether each influencing factor has a significant impact on the spatial correlation network of GDE (Table 3).As shown in Table 3, each variable strongly correlates with the spatial correlation network structure of GDE and passed the significance test. Among them, the correlation coefficients of economic development level, industrial structure, technical level, urbanization, financial development and resource endowment on spatial correlation network are significantly positive, while the correlation coefficient of environmental regulation is significantly negative.
The interactive detector of the geographical detector was used to calculate the influence degree of each factor on the spatial correlation network index of GDE. In this study, the Jenks optimal natural fracture method was used to classify each influence factor, and then the geographical detector was used for analysis (Table 4). As shown in Table 4, each influence factor has a certain driving effect on the spatial correlation network of China’s GDE, but there are significant differences in the strength of the influence. Economic development level, urbanization and financial development have a large detection power on the spatial correlation network of GDE, which are the core influencing factors of the formation of spatial correlation network and play a decisive role in the spatial correlation network structure. Technical level and industrial structure play a significant role in driving, which are important factors. The influence of resource endowment and environmental regulation on the formation of spatial correlation networks is weak.
4. Discussion
Green development is an important choice for sustainable development. Research on the spatial correlation structure of GDE can promote the improvement of the overall level of green development and achieve regionally coordinated and sustainable development. Based on these results, the following policy implications can be obtained: First, the spatial correlation network pattern of GDE in China has initially taken shape, but the improvement of GDE not only depends on the green development policies formulated by the government but also closely related to the inter-provincial ecological and economic exchanges and cooperation. At the same time, it is important to give full play to the role of policy regulation and market adjustment on the spatial correlation of GDE, open up the channels for the flow of resources and factors between provinces, promote the flow and sharing of green development factors across regions, and realize coordinated regional green development between the eastern coastal areas and the central and western provinces. Second, according to the positions and roles of different provinces in the spatial correlation network of GDE, the situation must be tailored to local conditions. The radiating and driving effect of the eastern coastal provinces in the spatial correlation network of GDE must be consolidated to further exert the technological spillover and economical driving effect of the eastern coastal provinces, narrow the gap of green development between regions, reduce the network hierarchy, and realize coordinated, green development in the regions. Third, to take full account of the driving effects of the economic development level, urbanization and financial development must continue on the spatial correlation network of green development to promote the flow of capital, technology, talent and other elements between the central actors of the network and the marginal actors, so as to provide more spatial spillover channels for improving the efficiency of green development.
This study encountered certain limitations that should be addressed. It was limited by the data source and the provincial research scale. Future studies should consider refining the research scale to explore in depth the spatial characteristics of GDE at different scales and in different regions. In addition, we studied the spatial correlation characteristics of green development from a comprehensive perspective; future spatial correlation studies can be conducted on specific sustainable development topics, such as energy consumption, carbon emissions, and economic growth.
5. Conclusions
From the perspective of a spatial correlation network, this study reconstructed the GDE evaluation index system according to the concept connotation of GDE. We have calculated the GDE of 30 provinces in China from 2000 to 2018 using the Super-EBM model considering undesired output and analyzed the spatial structure and influencing factors using SNA and a geographical detector. This study provides a system of evaluation indexes and measurement methods for assessing GDE. At the same time, it uses relational data to analyze the structure of its spatial correlation network, which provides a new perspective for studying the spatial characteristics of GDE. Therefore, this study can supplement the theoretical and methodological research of GDE and also provide a reference for the Chinese government to formulate green coordinated, sustainable development policies. The research conclusions are as follows:
There were large regional differences in GDE, and a complex spatial correlation network was formed. Based on the overall network characteristics, the tightness and stability of the network increased with an increase in overflow channels. The strict hierarchical structure of the spatial correlation network led to large differences in the strength of interprovincial correlations, which inhibited the development of the network. Based on the centrality analysis, eastern coastal provinces showed significant spillover effects and acted as “intermediaries” and “bridges” in the network, thus playing leading roles as connecting functions. Most provinces in the northeast and central-western regions were marginalized in the network.
As shown from the analysis of cohesive subgroups, there is significant geographical proximity in the composition of cohesive subgroups, but with development, the composition of subgroups gradually breaks the traditional geographical spatial limitation and forms a closely connected and complex spatially connected network. The leadership subgroup of the eastern, more economically developed provinces has a strong radiating and driving effect, contributing to the formation and development of a spatial correlation network. According to the analysis of the influencing factors, the correlation between economic development level, industrial structure, technical level, urbanization, environmental regulation, financial development and resource endowment and the spatial correlation network structure of GDE is strong, while the economic development level, urbanization and financial development play a decisive role in the structure of spatial correlation network.
Author Contributions
Conceptualization, L.Z.; methodology, X.G. and N.C.; software, X.G.; data curation, N.C. and Y.Z.; writing—original draft preparation, X.G, N.C. and L.Z.; writing—review and editing, X.G. and L.Z.; visualization, Y.Z.; funding acquisition, L.Z. All authors have read and agreed to the published version of the manuscript.
Funding
This research was funded by the National Natural Science Foundation of China (No. 41701117, No. 42071150), Technology Plan of Shandong Colleges and Universities (No. 2020RWG010), Natural Science Foundation of Shandong Province (No. ZR2022MD104) and Qufu Normal University Postgraduate Dissertation Research Innovation Independent Fund Project (No. LWCXS202229).
Institutional Review Board Statement
Not applicable.
Informed Consent Statement
Not applicable.
Data Availability Statement
The datasets generated and/or analyzed during the current study are not publicly available as the data is confidential but are available from the corresponding author on reasonable request.
Conflicts of Interest
The authors declare no conflict of interest.
References
- Li, Z.; Zheng, K.; Zhong, Q. Comprehensive evaluation and spatial-temporal pattern of green development in Hunan Province, China. Sustainability 2022, 14, 6819. [Google Scholar] [CrossRef]
- Zakari, A.; Khan, I.; Tan, D.; Alvarado, R.; Dagar, V. Energy efficiency and sustainable development goals (SDGs). Energy 2022, 239, 122365. [Google Scholar] [CrossRef]
- United Nations. In Proceedings of the 2008 United Nations Climate Change Conference, Poznań, Poland, 1–12 December 2008; Available online: https://baike.baidu.com/item/%E7%BB%BF%E8%89%B2%E6%96%B0%E6%94%BF/971528 (accessed on 6 August 2022).
- OECD. Towards Green Growth: A Summary for Policy Makers; Organisation for Economic Co-operation and Development (OECD): Paris, France, 2011. [Google Scholar]
- UNEP. Towards a Green Economy: Pathways to Sustainable Development and Poverty Eradication—A Synthesis for Policy Makers; UNEP: Nairobi, Kenya, 2011. [Google Scholar]
- Jänicke, M. “Green growth”: From a growing eco-industry to economic sustainability. Energy Policy 2012, 48, 13–21. [Google Scholar] [CrossRef]
- Sun, C.; Tong, Y.; Zou, W. The evolution and a temporal-spatial difference analysis of green development in China. Sustain. Cities Soc. 2018, 41, 52–61. [Google Scholar] [CrossRef]
- Li, C.; Song, L. Regional differences and spatial convergence of green development in China. Sustainability 2022, 14, 8511. [Google Scholar] [CrossRef]
- Lu, Y.; Zhang, Y.; Cao, X.; Wang, C.; Wang, Y.; Zhang, M.; Ferrier, R.C.; Jenkins, A.; Yuan, J.; Bailey, M.J.; et al. Forty years of reform and opening up: China’s progress toward a sustainable path. Sci. Adv. 2019, 5, eaau9413. [Google Scholar] [CrossRef] [Green Version]
- Zhang, M.; Zhang, C.; Kafy, A.; Tan, S. Simulating the relationship between land use/cover change and urban thermal environment using machine learning algorithms in Wuhan City, China. Land 2022, 11, 14. [Google Scholar] [CrossRef]
- Gai, M.; Wang, X.; Qi, C. Spatiotemporal evolution and influencing factors of ecological civilization construction in China. Complexity 2020, 2020, 8829144. [Google Scholar] [CrossRef]
- Lu, P.; Liu, J.; Wang, Y.; Ruan, L. Can industrial agglomeration improve regional green total factor productivity in China? An empirical analysis based on spatial econometrics. Growth Chang. 2021, 52, 1011–1039. [Google Scholar] [CrossRef]
- Huang, M.; Ding, R.; Xin, C. Impact of technological innovation and industrial-structure upgrades on ecological efficiency in China in terms of spatial spillover and the threshold effect. Integr. Environ. Assess. Manag. 2020, 17, 852–865. [Google Scholar] [CrossRef]
- Lu, X.; Qu, Y.; Sun, P.; Yu, W.; Peng, W. Green transition of cultivated land use in the Yellow River Basin: A perspective of green utilization efficiency evaluation. Land 2020, 9, 475. [Google Scholar] [CrossRef]
- Xue, L.; Zheng, Z.; Meng, S.; Li, M.; Li, H.; Chen, J. Carbon emission efficiency and spatio-temporal dynamic evolution of the cities in Beijing-Tianjin-Hebei Region, China. Environ. Dev. Sustain. 2022, 24, 7640–7664. [Google Scholar] [CrossRef]
- Yang, Y.; Huang, P. Has the level of green development in the northwestern provinces of China truly improved? A case study of Shaanxi. Sustain. Cities Soc. 2019, 51, 101779. [Google Scholar] [CrossRef]
- Weng, Q.; Qin, Q.; Li, L. A comprehensive evaluation paradigm for regional green development based on “Five-Circle Model”: A case study from Beijing-Tianjin-Hebei. J. Clean. Prod. 2020, 277, 124076. [Google Scholar] [CrossRef]
- Xiao, Y.; Chen, J.; Wang, X.; Lu, X. Regional green development level and its spatial spillover effects: Empirical evidence from Hubei Province, China. Ecol. Indic. 2022, 143, 109312. [Google Scholar] [CrossRef]
- Zhang, H.; Geng, Z.; Yin, R.; Zhang, W. Regional differences and convergence tendency of green development competitiveness in China. J. Clean. Prod. 2020, 254, 119922. [Google Scholar] [CrossRef]
- Tong, C.; Ding, S.; Wang, B.; Yang, S. Assessing the target-availability of China’s investments for green growth using time series prediction. Phys. A Stat. Mech. Appl. 2020, 537, 122724. [Google Scholar] [CrossRef]
- Houssini, K.; Geng, Y. Measuring Morocco’s green growth performance. Environ. Sci. Pollut. Res. 2022, 29, 1144–1154. [Google Scholar] [CrossRef]
- Lu, W.; Zhang, G. Green development efficiency of urban agglomerations in a developing country: Evidence from Beijing-Tianjin-Hebei in China. Environ. Dev. Sustain. 2022, 4, 1–24. [Google Scholar] [CrossRef]
- Cooper, W.W.; Rhodes, E. Short communication: Measuring the efficiency of decision-making units. Eur. J. Oper. Res. 1979, 3, 339. [Google Scholar]
- Yang, L.; Wang, K.L.; Geng, J.C. China’s regional ecological energy efficiency and energy saving and pollution abatement potentials: An empirical analysis using epsilon-based measure model. J. Clean. Prod. 2018, 194, 300–308. [Google Scholar] [CrossRef]
- Cuiyun, C.; Chazhong, G. Green development assessment for countries along the belt and road. J. Environ. Manag. 2020, 263, 110344. [Google Scholar] [CrossRef] [PubMed]
- Wang, A.; Tong, Z.; Du, W.; Zhang, J.; Liu, X.; Yang, Z. Comprehensive evaluation of green development in Dongliao river basin from the integration system of “Multi-dimensions”. Sustainability 2021, 13, 4785. [Google Scholar] [CrossRef]
- Chen, Z.; Li, X.; Xia, X. Measurement and spatial convergence analysis of China’s agricultural green development index. Environ. Sci. Pollut. Res. 2021, 28, 19694–19709. [Google Scholar] [CrossRef] [PubMed]
- Huang, M.; Li, S. The analysis of the impact of the Belt and Road initiative on the green development of participating countries. Sci. Total Environ. 2020, 722, 137869. [Google Scholar] [CrossRef]
- Tian, Y.; Wang, R.; Liu, L.; Ren, Y. A spatial effect study on financial agglomeration promoting the green development of urban agglomerations. Sustain. Cities Soc. 2021, 70, 102900. [Google Scholar] [CrossRef]
- Xie, H.; Ouyang, Z.; Choi, Y. Characteristics and influencing factors of green finance development in the Yangtze river delta of China: Analysis based on the spatial durbin model. Sustainability 2020, 12, 9753. [Google Scholar] [CrossRef]
- Tone, K.; Tsutsui, M. An epsilon-based measure of efficiency in DEA—A third pole of technical efficiency. Eur. J. Oper. Res. 2010, 207, 1554–1563. [Google Scholar] [CrossRef]
- Fan, J.; Xiao, Z. Analysis of spatial correlation network of China’s green innovation. J. Clean. Prod. 2021, 299, 126815. [Google Scholar] [CrossRef]
- Gao, H.; Zhang, Y.; Xu, C.; Yang, Y. Towards a sustainable grain production network: An empirical study from Northeast China. Sustainability 2022, 14, 8849. [Google Scholar] [CrossRef]
- Shaharudin, M.S.; Fernando, Y.; Chiappetta Jabbour, C.J.; Sroufe, R.; Jasmi, M.F.A. Past, present, and future low carbon supply chain management: A content review using social network analysis. J. Clean. Prod. 2019, 218, 629–643. [Google Scholar] [CrossRef]
- Andersen, P.; Petersen, N.C. A procedure for ranking efficient units in data envelopment analysis. Manage. Sci. 1993, 39, 1261–1264. [Google Scholar] [CrossRef]
- Lyu, X.; Peng, W.; Yu, W.; Xin, Z.; Niu, S.; Qu, Y. Sustainable intensification to coordinate agricultural efficiency and environmental protection: A systematic review based on metrological visualization. J. Land Use Sci. 2021, 16, 313–338. [Google Scholar] [CrossRef]
- Li, H.; He, F.; Deng, G. How does environmental regulation promote technological innovation and green development? New evidence from China. Polish J. Environ. Stud. 2019, 29, 689. [Google Scholar] [CrossRef] [PubMed]
- Yu, Y.; Yi, Z.; Jia, J. The efficiency evolution and risks of green development in the Yangtze River Economic Belt, China. Sustainability 2022, 14, 10417. [Google Scholar] [CrossRef]
- Zhao, L.; Gao, X.; Jia, J.; Zhang, Y. Analyzing inclusive green growth in China: A perspective of relative efficiency. Environ. Sci. Pollut. Res. 2022, 22, 23155. [Google Scholar] [CrossRef]
- Liu, R.; Chen, D.; Yang, S.; Chen, Y. Evaluation of green development efficiency of the major cities in Gansu Province, China. Sustainability 2021, 13, 3034. [Google Scholar] [CrossRef]
- Liu, K.; Shi, D.; Xiang, W.; Zhang, W. How has the efficiency of China’s green development evolved? An improved non-radial directional distance function measurement. Sci. Total Environ. 2022, 815, 152337. [Google Scholar] [CrossRef]
- Yang, T.; Zhou, K.; Zhang, C. Spatiotemporal patterns and influencing factors of green development efficiency in China’s urban agglomerations. Sustain. Cities Soc. 2022, 85, 104069. [Google Scholar] [CrossRef]
- Gao, H.; Zhao, L. Green development level measurement and spatial difference analysis of Yangtze River Economic Belt. Sci. Technol. Prog. Policy 2019, 36, 46–53. [Google Scholar]
- Cui, H.; Liu, Z. Spatial-temporal pattern and influencing factors of the urban green development efficiency in Jing-Jin-Ji Region of China. Polish J. Environ. Stud. 2021, 2, 1079–1093. [Google Scholar] [CrossRef] [PubMed]
- Yue, L.; Xue, D. Spatiotemporal change of urban green development efficiency in the Yellow River Basin and influencing factors. Resour. Sci. 2020, 42, 2274–2284. [Google Scholar] [CrossRef]
- Yang, Y.; Wu, D.; Xu, M.; Yang, M.; Zou, W. Capital misallocation, technological innovation, and green development efficiency: Empirical analysis based on China provincial panel data. Environ. Sci. Pollut. Res. 2022, 4, 65535–65548. [Google Scholar] [CrossRef] [PubMed]
- Wang, Z.; Liu, Q.; Xu, J.; Fujiki, Y. Evolution characteristics of the spatial network structure of tourism efficiency in China: A province-level analysis. J. Destin. Mark. Manag. 2020, 18, 100509. [Google Scholar] [CrossRef]
- Chen, B.; Wu, C.; Huang, X.; Yang, X. Examining the relationship between urban land expansion and economic linkage using coupling analysis: A case study of the Yangtze River Economic Belt, China. Sustainability 2020, 12, 1227. [Google Scholar] [CrossRef] [Green Version]
- Liu, Y.; Shao, X.; Tang, M.; Lan, H. Spatio-temporal evolution of green innovation network and its multidimensional proximity analysis: Empirical evidence from China. J. Clean. Prod. 2021, 283, 124649. [Google Scholar] [CrossRef]
- Wang, F.; Wu, L.; Zhang, F. Network structure and influencing factors of agricultural science and technology innovation spatial correlation network—A study based on data from 30 provinces in China. Symmetry 2020, 12, 1773. [Google Scholar] [CrossRef]
- Gan, C.; Voda, M.; Wang, K.; Chen, L.; Ye, J. Spatial network structure of the tourism economy in urban agglomeration: A social network analysis. J. Hosp. Tour. Manag. 2021, 47, 124–133. [Google Scholar] [CrossRef]
- Zhou, Y.; Wang, H.; Wang, Z.; Dai, X. The improvement path for regionally coordinated green development: Evidence from social network analysis. Int. J. Environ. Res. Public Health 2022, 19, 1703. [Google Scholar] [CrossRef]
- Hsu, C.W.; Lin, C.Y. Using social network analysis to examine the technological evolution of fermentative hydrogen production from biomass. Int. J. Hydrogen Energy 2016, 41, 21573–21582. [Google Scholar] [CrossRef]
- Freeman, L.C. Centrality in social networks. Soc. Netw. 1979, 1, 215–239. [Google Scholar] [CrossRef] [Green Version]
- Liu, H.; Zhang, Y.; Sang, Z.; Wang, W.; Zhang, L.; Li, M. Connection characteristics and hierarchical structure of China’s Urban Network-Based on the communications technology service industry. Complexity 2022, 10, 61433293. [Google Scholar] [CrossRef]
- Barnett, G.A. Encyclopedia of Social Networks; SAGE Publications: Thousand Oaks, CA, USA, 2011; pp. 523–526. [Google Scholar]
- Yue, H.; Hu, T. Geographical detector-based spatial modeling of the COVID-19 mortality rate in the continental United States. Int. J. Environ. Res. Public Health 2021, 18, 6832. [Google Scholar] [CrossRef] [PubMed]
- Chen, L.; Zhang, X.; He, F.; Yuan, R. Regional green development level and its spatial relationship under the constraints of haze in China. J. Clean. Prod. 2019, 210, 376–387. [Google Scholar] [CrossRef]
- Zhao, P.J.; Zeng, L.e.; Lu, H.y.; Zhou, Y.; Hu, H.y.; Wei, X.Y. Green economic efficiency and its influencing factors in China from 2008 to 2017: Based on the super-SBM model with undesirable outputs and spatial Dubin model. Sci. Total Environ. 2020, 741, 140026. [Google Scholar] [CrossRef]
- Zhao, L.; Cao, N.; Han, Z.; Gao, X. Spatial correlation network and influencing factors of green economic efficiency in China. Resour. Sci. 2021, 43, 1933–1946. [Google Scholar] [CrossRef]
- Zhang, M.; Tan, S.; Zhang, X. How do varying socio-economic factors affect the scale of land transfer? Evidence from 287 cities in China. Environ. Sci. Pollut. Res. 2022, 29, 40865–40877. [Google Scholar] [CrossRef]
Figure 1.
Geographical distribution of the three regions in China.
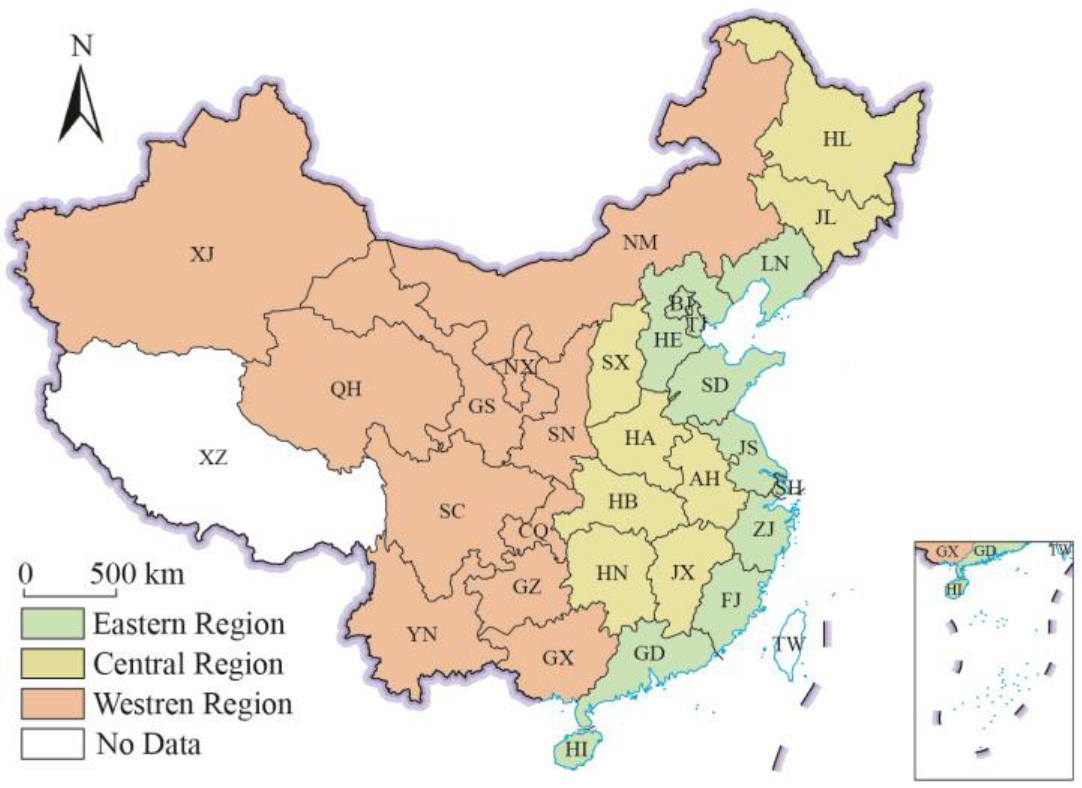
Figure 2.
Evolutionary trend of GDE.
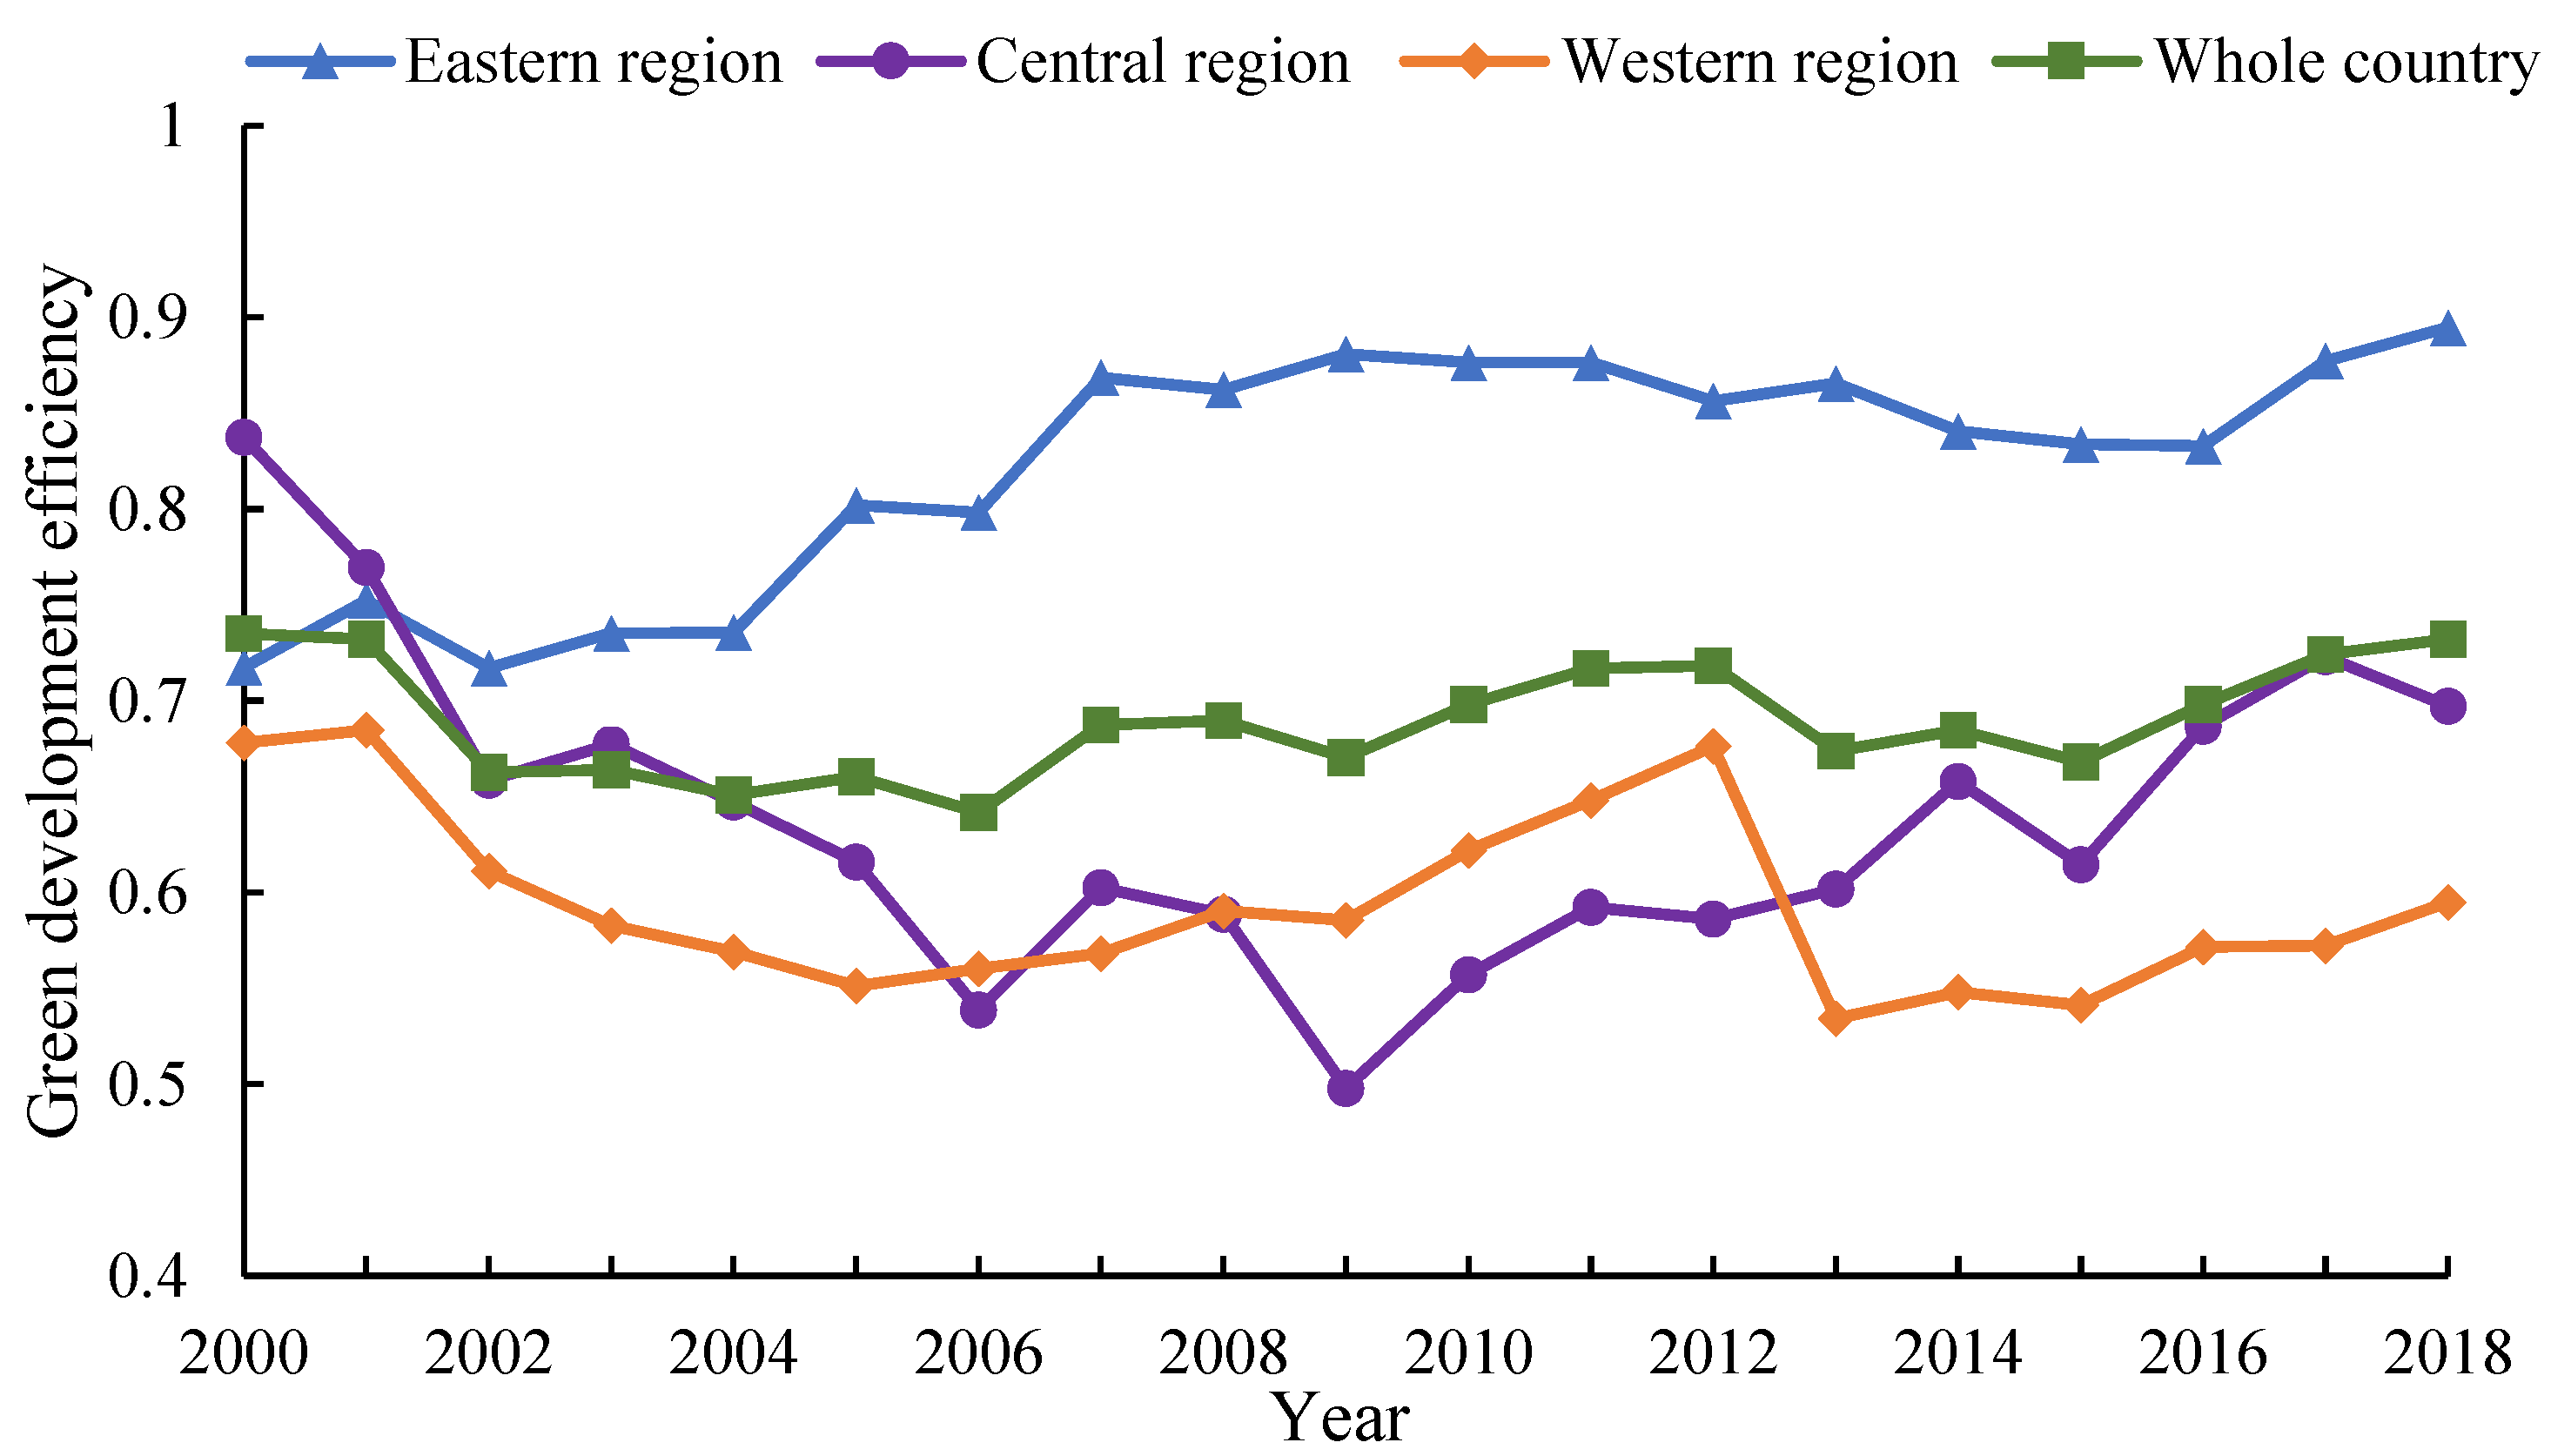
Figure 3.
Spatial correlation network of GDE in China.
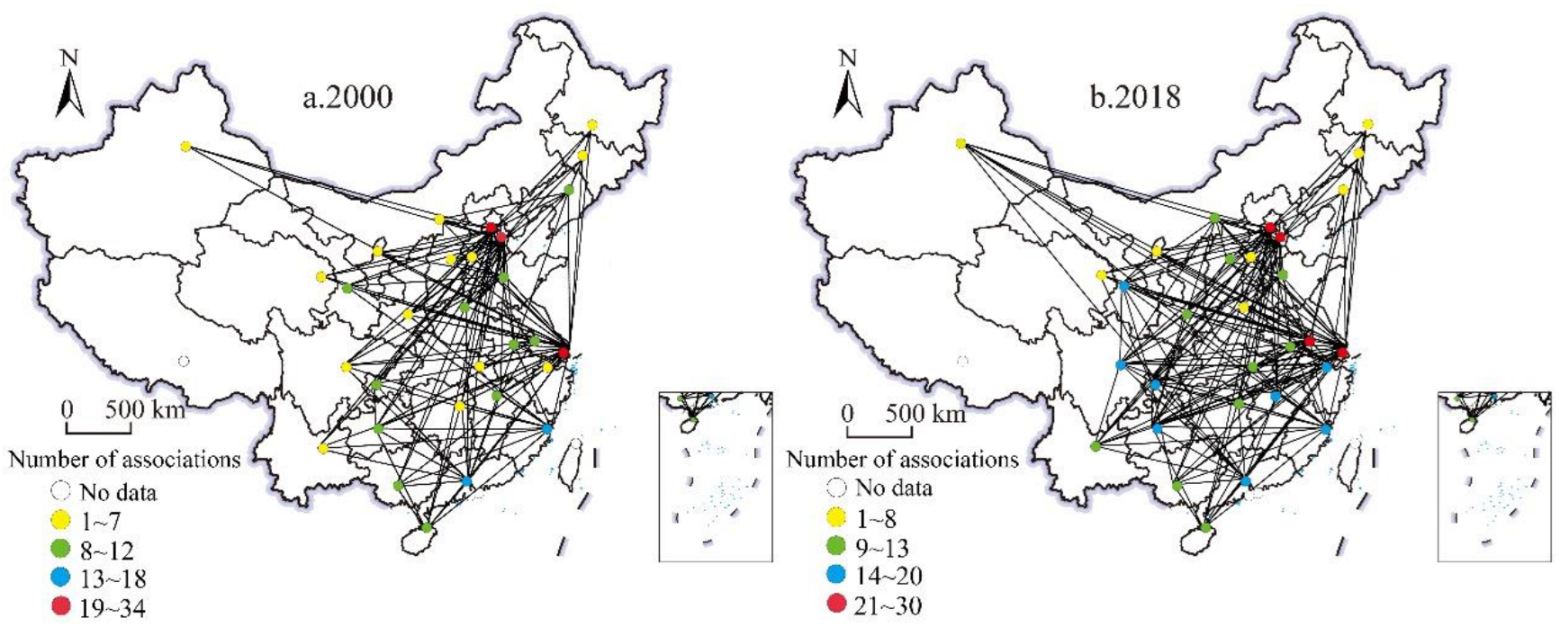
Figure 4.
Overall network characteristics of GDE in China.
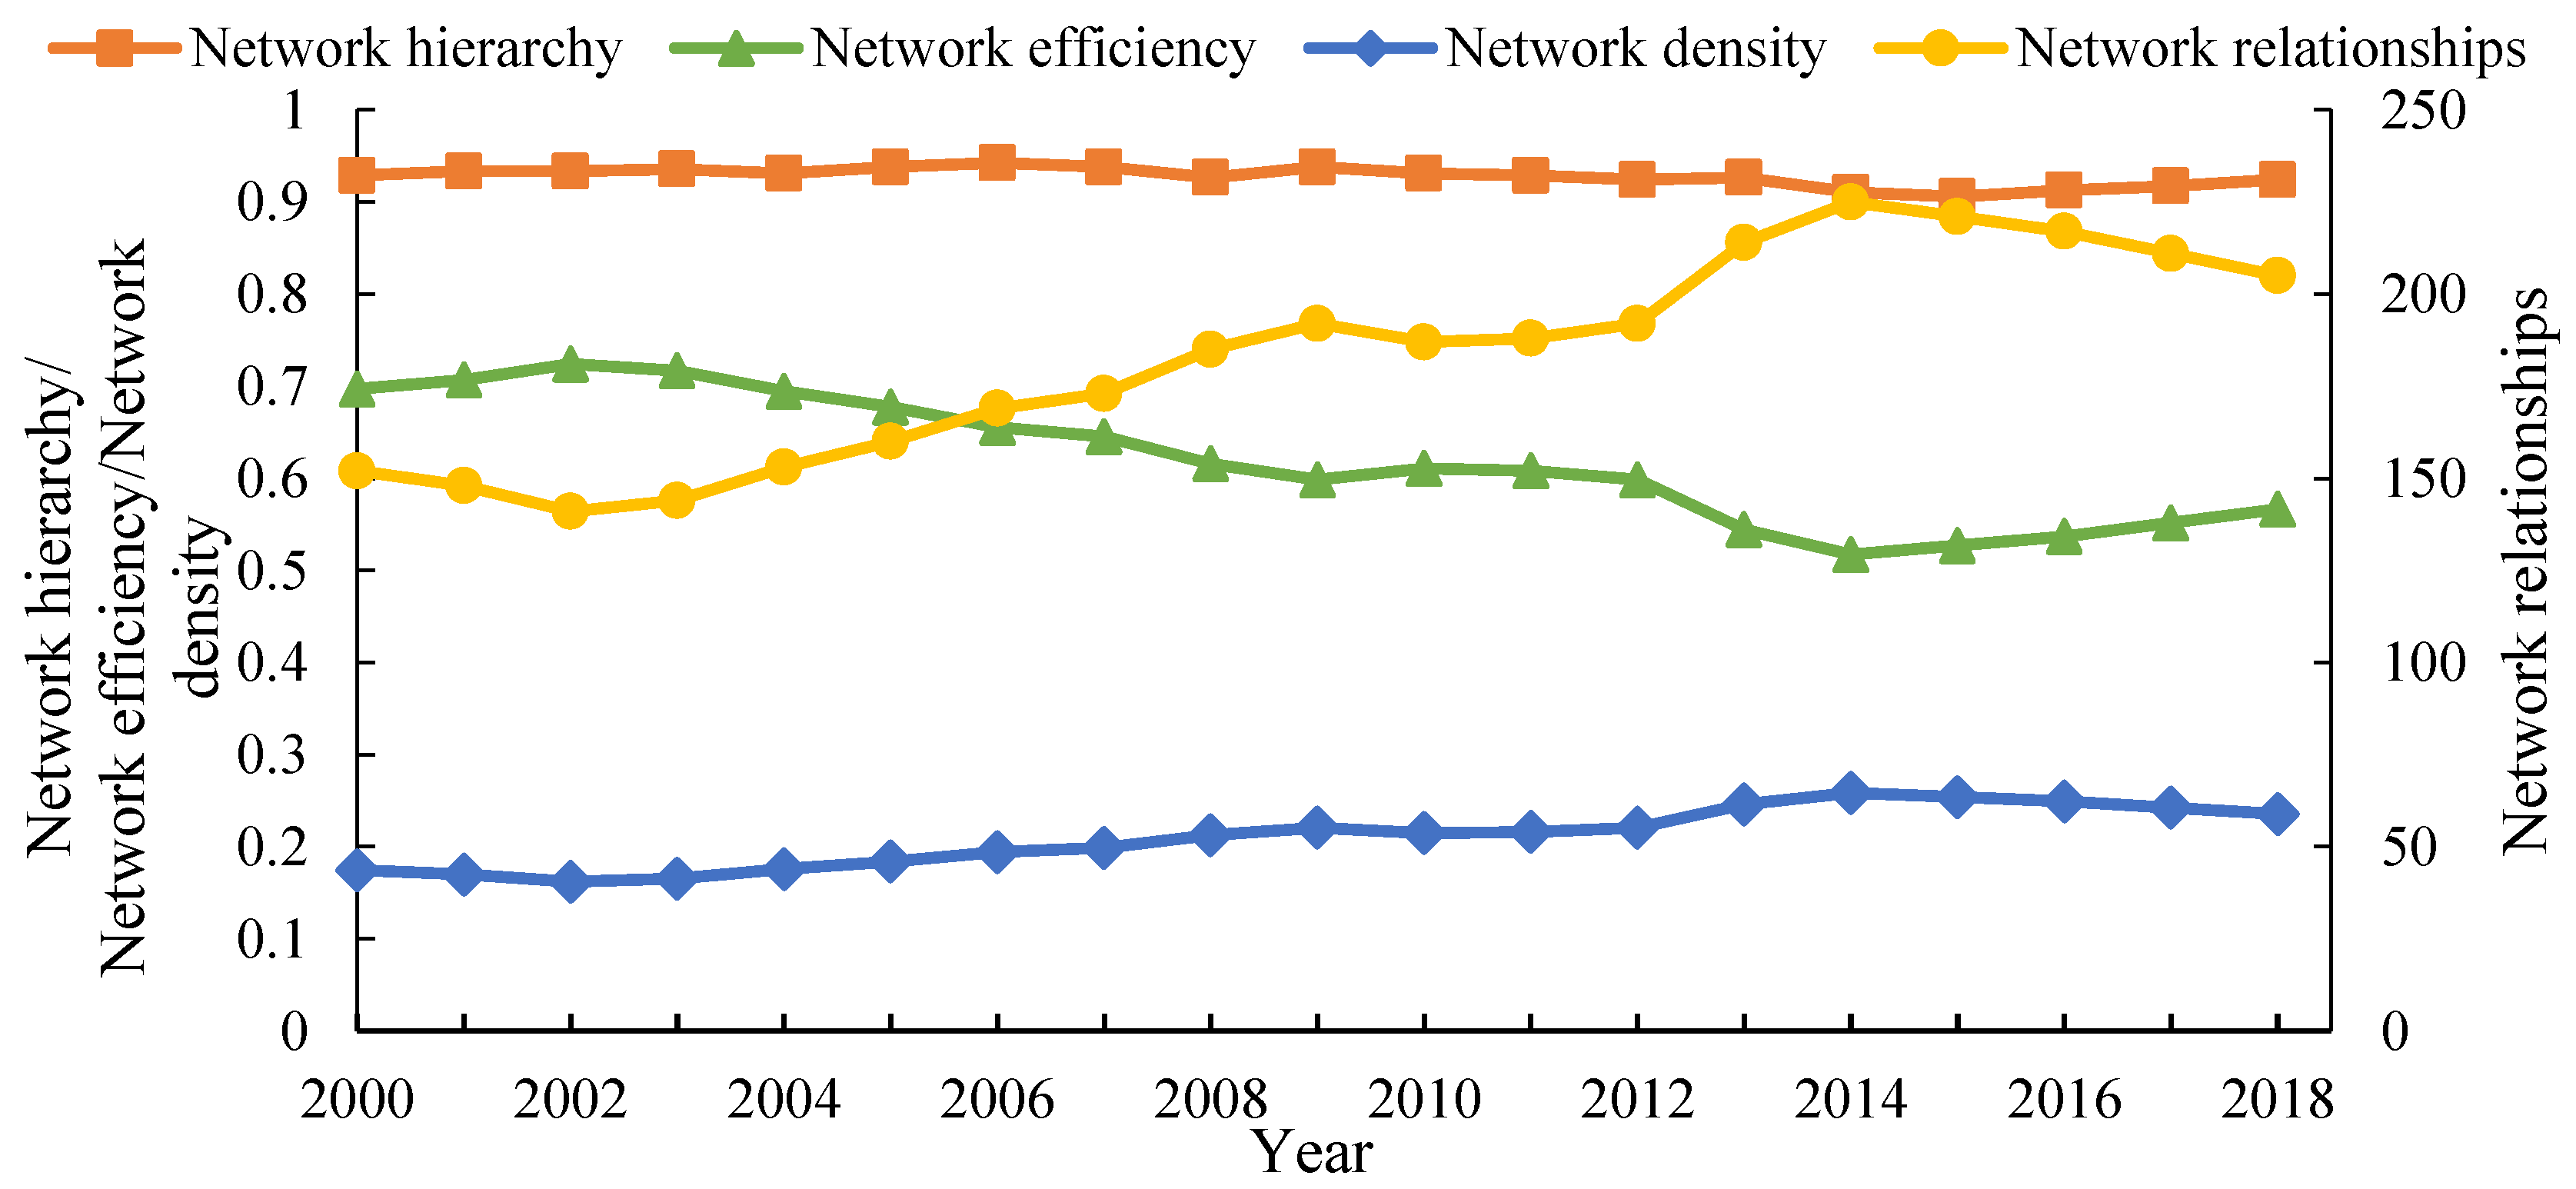
Figure 5.
The spillover and reception relationship of GDE in China.
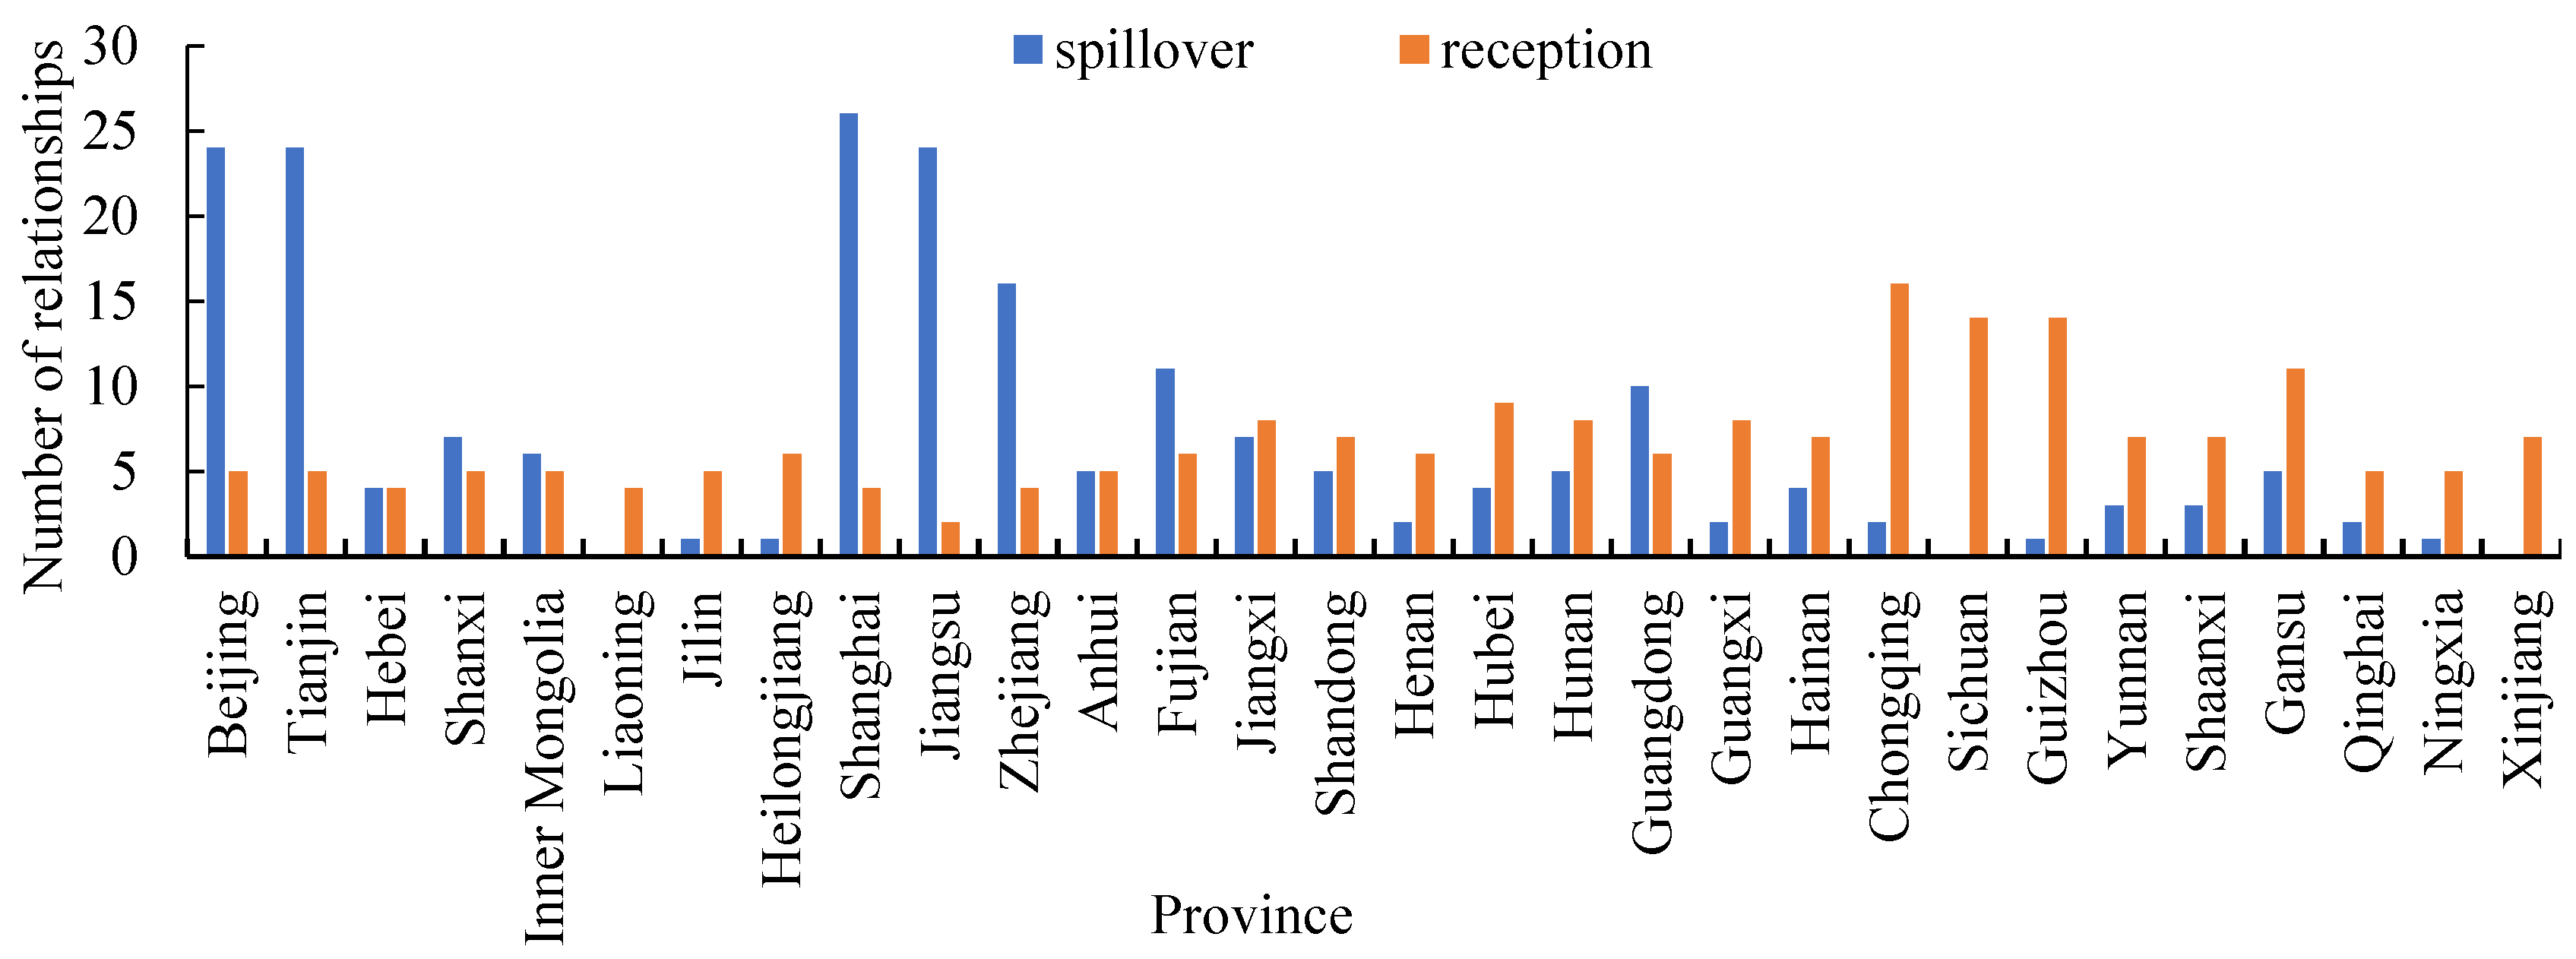
Figure 6.
Distribution of Cohesive Subgroups of Spatial Correlation Network for GDE in China.
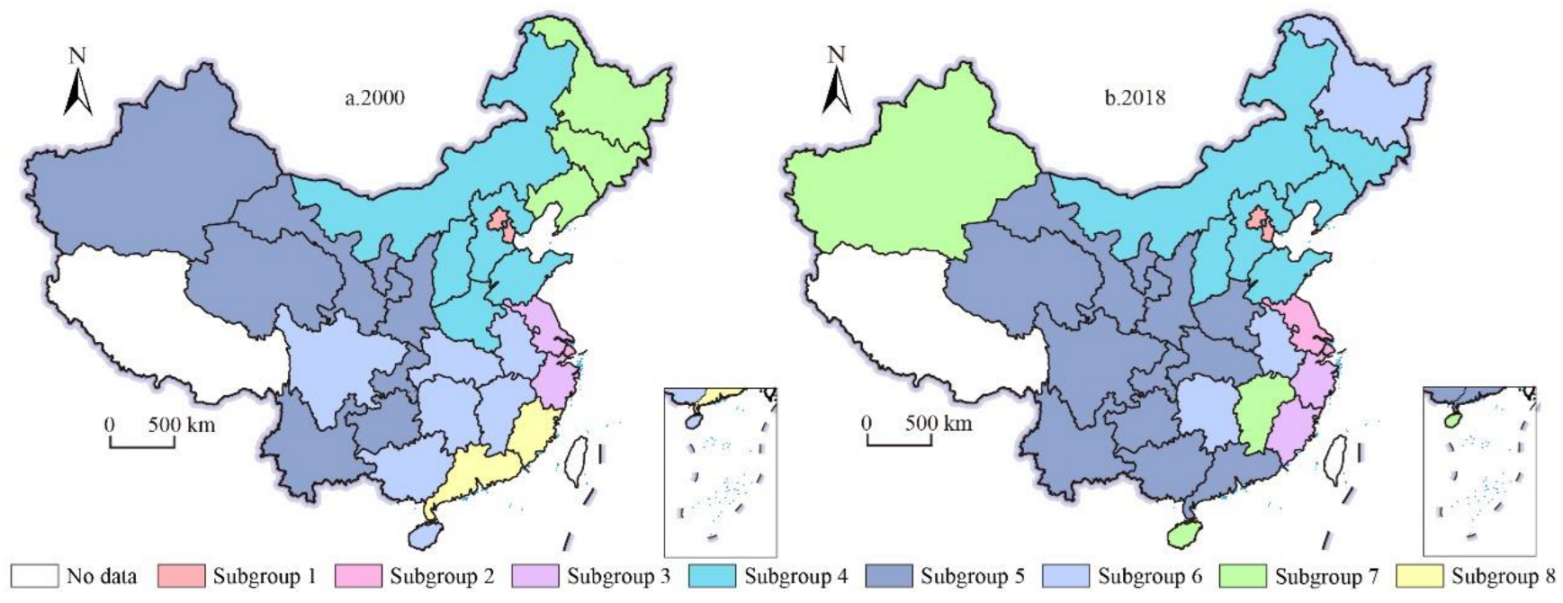
Figure 7.
Cohesive Subgroup Interactions of the China GDE Spatial Correlation Network. Note: The numbers in the figure represent the individual cohesive subgroups.
Figure 7.
Cohesive Subgroup Interactions of the China GDE Spatial Correlation Network. Note: The numbers in the figure represent the individual cohesive subgroups.


Table 1.
Evaluation Index System of GDE.
| Type of Indicator | Input & Output Elements | Variables | Data Sources |
|---|---|---|---|
| Input Indicators | Labor input | Number of employees (10 thousand people) | China Population and Employment Statistical Yearbook, statistical yearbooks of provinces and regions |
| Capital input | Stock of fixed assets (CNY 100 million) | China Statistical Yearbook | |
| Energy input | Total energy consumption (10 thousand tons of standard coal) | China Energy Statistical Yearbook | |
| Resource input | Total water consumption (100 million m3) | China Statistical Yearbook | |
| Land input | Built-up area (km2) | China Statistical Yearbook | |
| Technical input | Internal expenses for research and experimental development (CNY 10 thousand) | China Statistical Yearbook | |
| Output Indicators | Economic output | GDP (CNY billion) | China Statistical Yearbook |
| Social output | Per capita retail sales of social consumer goods (CNY), average salary of employees (CNY), average years of education (year), per capita life expectancy (years old), greening coverage of built-up areas (%) | China Statistical Yearbook, statistical yearbooks of provinces and regions | |
| Environmental undesirable output | Wastewater emissions (ten thousand tons), SO2 emissions (ten thousand tons), smoke (dust) emissions (ten thousand tons), general industrial solid waste generation (ten thousand tons) | China Statistical Yearbook and China Environmental Statistical Yearbook |
Table 2.
Centrality Analysis of the Spatial Correlation Network of GDE in China.
| Province | 2000 | 2018 | ||||
|---|---|---|---|---|---|---|
| Degree Centrality | Closeness Centrality | Betweenness Centrality | Degree Centrality | Closeness Centrality | Betweenness Centrality | |
| Beijing | 79.310 | 72.500 | 5.851 | 82.759 | 85.294 | 6.178 |
| Tianjin | 82.759 | 80.556 | 7.958 | 82.759 | 85.294 | 6.178 |
| Hebei | 13.793 | 46.032 | 0.158 | 20.690 | 49.153 | 0.888 |
| Shanxi | 17.241 | 46.774 | 0.189 | 27.586 | 55.769 | 1.405 |
| Inner Mongolia | 13.793 | 46.774 | 0.158 | 27.586 | 51.786 | 0.649 |
| Liaoning | 24.138 | 3.567 | 0.103 | 13.793 | 3.333 | 0 |
| Jilin | 17.241 | 3.571 | 0.246 | 17.241 | 3.448 | 0 |
| Heilongjiang | 13.793 | 3.567 | 0 | 20.690 | 3.448 | 0.062 |
| Shanghai | 93.103 | 93.548 | 13.258 | 89.655 | 90.625 | 9.486 |
| Jiangsu | 24.138 | 55.769 | 0.423 | 82.759 | 85.294 | 5.831 |
| Zhejiang | 10.345 | 49.153 | 0 | 58.621 | 65.909 | 1.771 |
| Anhui | 31.034 | 59.184 | 0.727 | 24.138 | 52.727 | 1.347 |
| Fujian | 41.379 | 59.184 | 0.603 | 48.276 | 48.333 | 3.347 |
| Jiangxi | 24.138 | 53.704 | 2.136 | 31.034 | 54.717 | 14.913 |
| Shandong | 31.034 | 59.184 | 0.747 | 31.034 | 50.000 | 4.246 |
| Henan | 20.690 | 54.717 | 0.912 | 24.138 | 34.524 | 0.142 |
| Hubei | 20.690 | 4.496 | 0.073 | 37.931 | 38.667 | 0.801 |
| Hunan | 17.241 | 4.309 | 0.088 | 34.483 | 34.940 | 1.069 |
| Guangdong | 41.379 | 4.348 | 5.203 | 37.931 | 47.541 | 9.283 |
| Guangxi | 20.690 | 4.315 | 0.088 | 31.034 | 32.955 | 0.246 |
| Hainan | 24.138 | 4.322 | 0.15 | 31.034 | 34.524 | 0.544 |
| Chongqing | 20.690 | 4.315 | 0.088 | 58.621 | 3.571 | 0.840 |
| Sichuan | 24.138 | 3.333 | 0 | 48.276 | 3.333 | 0 |
| Guizhou | 27.586 | 4.315 | 0.252 | 48.276 | 3.567 | 0.189 |
| Yunnan | 17.241 | 4.309 | 0.088 | 31.034 | 33.333 | 0.215 |
| Shaanxi | 20.690 | 3.333 | 0 | 31.034 | 4.149 | 0.183 |
| Gansu | 24.138 | 3.448 | 0.154 | 44.828 | 4.161 | 3.709 |
| Qinghai | 13.793 | 3.448 | 0 | 20.690 | 4.143 | 0 |
| Ningxia | 13.793 | 3.333 | 0 | 17.241 | 4.131 | 0 |
| Xinjiang | 10.345 | 3.333 | 0 | 24.138 | 3.333 | 0 |
| Average | 27.816 | 28.091 | 1.322 | 39.310 | 35.733 | 2.451 |
| Max | 93.103 | 93.548 | 13.258 | 89.655 | 90.625 | 14.913 |
| Min | 10.345 | 3.333 | 0 | 13.793 | 3.333 | 0 |
Table 3.
QAP Correlation Analysis of the Influencing Factors the Spatial Correlation Network of GDE in China.
Table 3.
QAP Correlation Analysis of the Influencing Factors the Spatial Correlation Network of GDE in China.
| Variables | Obs Value | Significa | Average | Std Dev | Minimum | Maximum | p ≥ 0 | p ≤ 0 |
|---|---|---|---|---|---|---|---|---|
| pgdp | 0.476 | 0.000 | 0.001 | 0.061 | −0.154 | 0.277 | 0.000 | 1.000 |
| inds | 0.270 | 0.000 | 0.001 | 0.070 | −0.155 | 0.259 | 0.000 | 1.000 |
| tech | 0.182 | 0.015 | 0.001 | 0.074 | −0.129 | 0.243 | 0.015 | 0.985 |
| urb | 0.409 | 0.000 | −0.001 | 0.062 | −0.155 | 0.261 | 0.000 | 1.000 |
| er | −0.095 | 0.051 | −0.000 | 0.067 | −0.160 | 0.333 | 0.949 | 0.051 |
| fina | 0.161 | 0.017 | −0.001 | 0.065 | −0.177 | 0.289 | 0.017 | 0.983 |
| res | 0.081 | 0.076 | 0.000 | 0.054 | −0.156 | 0.242 | 0.076 | 0.924 |
Table 4.
Detection Results of the Influence Intensity of China’s GDE Spatial Correlation Network.
| Variables | pgdp | inds | tech | urb | er | fina | res |
|---|---|---|---|---|---|---|---|
| Degree centrality | 0.821 | 0.260 | 0.427 | 0.703 | 0.203 | 0.382 | 0.137 |
| Closeness centrality | 0.602 | 0.181 | 0.355 | 0.449 | 0.111 | 0.412 | 0.179 |
| Betweenness centrality | 0.327 | 0.252 | 0.146 | 0.310 | 0.154 | 0.306 | 0.197 |
| Average | 0.583 | 0.231 | 0.309 | 0.487 | 0.156 | 0.367 | 0.171 |
Publisher’s Note: MDPI stays neutral with regard to jurisdictional claims in published maps and institutional affiliations. |
© 2022 by the authors. Licensee MDPI, Basel, Switzerland. This article is an open access article distributed under the terms and conditions of the Creative Commons Attribution (CC BY) license (https://creativecommons.org/licenses/by/4.0/).
Share and Cite
MDPI and ACS Style
Gao, X.; Cao, N.; Zhang, Y.; Zhao, L. Spatial Structure of China’s Green Development Efficiency: A Perspective Based on Social Network Analysis. Sustainability 2022, 14, 16156. https://doi.org/10.3390/su142316156
AMA Style
Gao X, Cao N, Zhang Y, Zhao L. Spatial Structure of China’s Green Development Efficiency: A Perspective Based on Social Network Analysis. Sustainability. 2022; 14(23):16156. https://doi.org/10.3390/su142316156
Chicago/Turabian StyleGao, Xiaotong, Naigang Cao, Yushuo Zhang, and Lin Zhao. 2022. "Spatial Structure of China’s Green Development Efficiency: A Perspective Based on Social Network Analysis" Sustainability 14, no. 23: 16156. https://doi.org/10.3390/su142316156
Note that from the first issue of 2016, this journal uses article numbers instead of page numbers. See further details here.