
Evaluation and Projection of Diurnal Temperature Range in Maize Cultivation Areas in China Based on CMIP6 Models


State Key Laboratory of Earth Surface Processes and Resource Ecology, Faculty of Geographical Science, Beijing Normal University, Beijing 100875, China
*
Author to whom correspondence should be addressed.
Sustainability 2022, 14(3), 1660; https://doi.org/10.3390/su14031660
Submission received: 30 December 2021
/
Revised: 25 January 2022
/
Accepted: 26 January 2022
/
Published: 31 January 2022
(This article belongs to the Special Issue Sustainability with Changing Climate and Extremes)
Abstract
:The diurnal temperature range (DTR) is an important meteorological component affecting maize yield. The accuracy of climate models simulating DTR directly affects the projection of maize production. We evaluate the ability of 26 Coupled Model Intercomparison Project phase 6 (CMIP6) models to simulate DTR during 1961–2014 in maize cultivation areas with the observation (CN05.1), and project DTR under different shared socioeconomic pathway (SSP) scenarios. The root mean square error (), standard deviation (), Kling-Gupta efficiency () and comprehensive rating index () are used in the evaluation of the optimal model. The results show that CMIP6 models can generally reproduce the spatial distribution. The reproducibility of the annual average DTR in the maize cultivation areas is better than that in China but lower for the maize-growing season. The optimal model (EC-Earth3-Veg-LR) is used in the projection. Under the two SSPs, the DTR decreases compared with the historical period, especially in Northwest and North China. The DTR under SSP245 remains unchanged (annual) or increases slightly (growing season) during 2015–2050, while a significant decreasing trend is observed under SSP585. This highlights the importance of evaluating DTR in maize cultivation areas, which is helpful to further improve the accuracy of maize yield prediction.
1. Introduction
Many studies have addressed the future changes in temperature and precipitation under a climate change background [1,2,3]. These studies have provided a solid basis for assessing the risk of climate change to human health, agriculture, natural resources, water resources, etc. In agriculture, some equivalent climate variables independently play important roles. Maize is one of the main food sources of humans and is widely cultivated worldwide. The changes in maize yield are related to the food security of human society. The yield of maize is known to be influenced by the environment and other factors [4,5]. Air temperature is one of the main factors affecting maize growth and production, and maize showed a greater yield decrease than wheat and rice at the same warming level [6,7]. A large number of studies have analyzed the effects of accumulated temperature and temperature on maize production. The diurnal temperature difference (DTR) also plays an important role in maize yield. DTR is defined as the difference between the maximum and minimum 2-m temperature during a 24-h period, and it has been proven to impact multipole crop production aspects, including yield, quality, and market commercial price [8]. It has been reported that changes in daily maximum air temperature and minimum air temperature may have different influences on crops [9,10,11], and lower daily minimum air temperature helps to improve crop quality. Lobell and Field [4] explored the relationship between the DTR and crop yield and found that the influence of daytime warming on crops was greater than that of nighttime warming. Jiang [12] indicated that a decrease in DTR in spring and summer was beneficial for crop yield increases, while an increase in DTR in fall was beneficial. Therefore, to better predict the future maize yield, the accurate simulation of DTR via global climate models has become increasingly important.
Unfortunately, there have been few studies addressing DTR future changes, which can obviously limit our understanding of the impact of climate change on crop production. There are large uncertainties in the trends and possible interpretations of DTR [13,14]. Lobell and Field [4] evaluated 12 global climate models that participated in the Coupled Model Intercomparison Project (CMIP) phase 3 and found future changes in DTR to be inconsistent among the models. Lindvall and Svensson [15] evaluated the simulation ability of 20 Coupled Model Intercomparison Project phase 5 (CMIP5) models in simulating the terrestrial DTR of recent and future projections using HadGHCND and CRU and found that DTR varies considerably between CMIP5 models and that DTR is often underestimated. This uncertainty causes substantial confusion when applying climate model results to estimate the magnitude of crop exposure to climate change. Wang et al. [16] indicated that Coupled Model Intercomparison Project phase 6 (CMIP6) models have not improved their ability to simulate temporal DTR changes consistently during 1901–2005 relative to CMIP5. In conclusion, although CMIP6 models already have good simulation capability for air temperature and precipitation, the simulation capability for important agrometeorological elements such as DTR still needs to be improved.
Most evaluations of climate variables simulated by global climate models (GCM) are based on the annual scale and the whole region. It may be questioned whether those evaluations are suitable for agricultural applications. The spatial scales of previous studies have focused on global or nationwide scales [17], and few studies have been conducted at the scale of crop-cultivation areas. Scholars have conducted numerous studies to quantitatively assess climate model simulations of key meteorological elements and to estimate future climate [18,19,20]. Knox et al. [21] evaluated the impact of climate change on yield projections for maize and other crops in Africa and South Asia using several global climate models, noting that the increase in the number of climate models could reduce the uncertainty in projections. However, there is a lack of discussion on the impact of spatial scale differences in climate model performance on prediction results. Lindvall and Svensson [15] evaluated the ability of CMIP5 models to simulate the DTR over land in historical simulations and future projections and indicated that although models had good simulation ability for global DTR changes, there were uncertainties in simulations for smaller spatial scales. GCMs with good performance at global or continental scales may exhibit differences in simulation performance within the actual maize cultivation areas. Therefore, when estimating maize yield and quality, using the most suitable climate model in maize cultivation areas will improve the credibility of the prediction results.
In addition, previous studies have mainly focused on the ability to simulate the interannual variability of meteorological components [22], and few studies have been conducted on the growing season of crops. Wang et al. [16] pointed out that most individual CMIP6 models overestimated the DTR changes from December to February, especially in the high latitudes of the Northern Hemisphere. The model showed significant differences in land and did not completely capture the observed temporal and spatial evolution of the DTR. Fan et al. [23] found that the simulation stability of the annual average temperature model is higher than that of the seasonal average temperature model. There is a large difference between the model and observations of temperature from January to May, and the simulation of temperature from June to September is more stable. There are great differences between the simulation of interannual and seasonal variations in climate models. The good performance of climate models at annual or seasonal scales does not mean that climate models perform equally well in actual crop-growing seasons. Differences in model performance at different time scales may affect crop yield and quality prediction [24,25]. Therefore, a climate model with better performance in the maize-growing season should be used when predicting maize yield and quality.
The retrospective analysis of systematic biases in current climate models as well as their correction is one of the scientific issues that CMIP6 focuses on [26]. The questions that agricultural scientists are more interested in include: How well do climate models simulate the meteorological elements in crop cultivation areas? How will climate change in the future? This suggests that the ability of climate models to simulate key meteorological components that are critical in agriculture needs to be carefully evaluated to truly provide a more credible understanding and perception of the agricultural impacts of climate change. Therefore, we quantitatively evaluated the ability of the CMIP6 model to simulate the spatial and temporal characteristics of the DTR in the main maize cultivation areas from several perspectives and used the optimal model to predict and analyze the changes in the DTR in the main maize cultivation areas in China under different future scenarios. This study will contribute to further improving the ability of global climate models to simulate DTR in the maize cultivation areas of China and will serve research on the impact of climate change on maize yield and quality.
2. Materials and Methods
2.1. CMIP6 Model Output
The CMIP6 is the latest experiment to simulate global climate through climate models. It collects the best models in the world and conducts the most colorful experiments, covering the world at a high-spatial and temporal resolution. CMIP6 considers the effects of external forcing, including natural factors and human activities, over time in the simulation of historical periods. Global near-surface maximum air temperature (Tasmax) and minimum air temperature (Tasmin) data simulated by 26 CMIP6 models from 1961 to 2014 were retrieved from the CMIP6 website [27]. The DTR was calculated as the difference between the maximum and minimum near-surface temperature during a 24 h period simulated by the CMIP6 models in this study. The focus of this paper is the DTR during 1961–2050. The names of these models analyzed are listed in Table 1, together with the institution and resolution. We only considered the first ensemble simulation (CMIP6: ‘r1i1p1f1’) if a model had multiple ensemble simulations.
For future emission scenarios, the shared socioeconomic pathway (SSP) provided in CMIP6 is the combination of the representative concentration pathway (RCP) and other pathways. SSP scenarios provided in CMIP6 include the updated versions from CMIP5 (SSP126, SSP245, SSP460, and SSP585) and the new combinations (SSP119, SSP370, and SSP434). In addition, SSP245 and SSP585 represent radiative forcing stabilized at 4.5 and 8.5 W m−2 by the end of the 21st century. The SSP245 scenario is subjective for most countries pursuing sustainable development, while the SSP585 scenario represents the worst scenario (fossil-based energy-intensive economy), reflecting the impact of unconventional development [1,26]. Therefore, we selected SSP245 and SSP585 in CMIP6 for future projections.
To facilitate the analysis, a bilinear interpolation method was used to uniformly interpolate the model data to the 0.25° × 0.25° grid, corresponding to the grid position and resolution of the observed dataset. Due to the different periods of the model data and observational data, only China’s land area was considered in this study.
2.2. Observation Data
To evaluate the simulated results of the CMIP6 models, the daily maximum and minimum temperature data of the China high-resolution dataset CN05.1 released by the Open Laboratory for Climate Research of China Meteorological Administration [28] were used as observational data in this study. The available starting and ending times of these data were 1961–2018, with a high-spatial resolution of 0.25° × 0.25°. This dataset has a long timescale and high spatial resolution. The generation process of this dataset only used the actual observational data of observation stations for statistical interpolation, covering the entire land area of China (Taiwan Province is missing statistical data). Interpolation of this dataset is based on an “anomaly approach” using over 2400 stations [29], which is similar to the method used to create the Climatic Research Unit dataset [30]. Compared with the reanalysis data, the CN05.1 data have greater reliability. This dataset has been widely used for regional and global climate model validation [29,31].
2.3. Methods
According to the harvested area and yield of 175 crops [32], grid points with production greater than the 5th percentile of maize production in China were extracted from maize yield data as the maize cultivation areas. This dataset was created by combining national, state, and county level census statistics with a recently updated global data set of croplands on a 5 min by 5 min latitude/longitude grid. The resulting land use datasets depict circa the year 2000 the area (harvested) and yield of 175 distinct crops of the world [32]. All assessments were conducted on these grid points. Continental China was divided into seven regions according to Wu et al. [33] and the distribution of the maize cultivation areas. The regional division of China is shown in Figure 1.
2.3.1. Climatology and Interannual Variability
The historical simulation experiments in CMIP6 were conducted from 1850 to 2014, while different future scenarios were divided from 2015 onward. The historical period from 1961 to 2014 was used to evaluate the ability of models to simulate the interannual variability of the DTR. The 1995–2014 period can better represent the current climate state and help us understand the simulation capability of the CMIP6 model for the current climate state [34]. Therefore, the 20-year period from 1995 to 2014 was selected to evaluate the simulation ability of CMIP6 models regarding the spatial distribution of the DTR in maize cultivation areas in China.
According to the ten-day dataset of crop growth and soil moisture in China and the research results of Cao [35], March to June of the current year was selected as the maize-growing season. Fifty-four years of data from a historical period (1961 to 2014) were selected for analysis in this study. The annual mean DTR and the maize-growing season mean DTR simulated using CMIP6 models in maize cultivation areas were calculated and compared.
The future period from 2015 to 2050 was selected for future projection. CMIP6 models performed more stable in this period than for the late 21st century [34]. The period from 2031 to 2050 was selected to project the future climatological DTR, as it represents the middle of the 21st century. The spatial distribution of the climatological DTR in 2031–2050 under two SSP scenarios was calculated, and the changes relative to the historical climatology (1995–2014) simulations were analyzed according to different subregions.
The spatial distribution of the linear trends of the annual average and growing season mean DTR in the main maize cultivation areas from 2015 to 2050 was calculated. The yearly linear trend analysis was conducted on each grid of the study area. Meanwhile, the linear trends of annual and growing season average DTR were calculated to study the interannual variation trend of DTR.
2.3.2. Performance METRICS
In the evaluation of the CMIP6 model simulation capability for DTR and future projection in maize cultivation areas in China, the following indices were used.
To evaluate the simulation ability of CMIP6 models for the spatial distribution of the DTR in China’s maize cultivation areas, root mean square error () was used. It was widely employed to illustrate the bias between the simulations and observations [36]. The is:
where and are the simulated value and observation of the ith grid, respectively. N is the grid number. The is larger than 0. When the is 0, it indicates that the pattern matches the observation perfectly; a smaller indicates that the pattern has better performance.
The standard deviations () of the yearly growing season and annual anomalies of the maize cultivation area DTR were calculated as indicators to quantitatively express the ability of the models to simulate interannual variability. The DTR anomalies were linearly detrended before calculating the [15,22,37]. The is:
where and denote the mean of simulations and observations. The value is equal to 0 when is identical to , and the closer the value is to (standard deviation of observations), the greater the skill in simulating the interannual variability.
To further evaluate the ability of models to simulate DTR in China’s maize cultivation areas, the Kling-Gupta efficiency () was used [36,38,39]. is:
where and denote the standard deviation of simulations and observations. The value varies between 1 and -∞, where 1 represents a complete match. There is no specific meaning attached to the value when it equals zero [40].
To evaluate the ability of models to simulate both climatic state DTR and interannual variability, this study comprehensively ranked the simulation ability of each CMIP6 model based on and . The comprehensive rating index () enables efficient ranking of model simulation values [41]. The is:
where n is the number of evaluation indicators, m is the number of models, and is the ranking of the indicator of the model. The closer the value is to 1, the better the model simulation.
Previous studies have revealed that the multi-model ensemble () usually shows higher reliability in reproducing the present Chinese climate relative to an individual model [42]. Therefore, the multi-model arithmetic mean ensemble with the same weights was used in this study. The is:
where N is the number of models, is the simulations of the model.
Time series analysis was carried out to determine the interannual variability of the DTR. The linear trend analysis was used to investigate trends in DTR variability. The linear relationship between climate variable and time series was established [43].
where is the yearly average DTR and is the number of years of data used. is the time series. is the linear regression constant, is the linear tendency coefficient, and is defined as the climatic tendency rate (°C/10a), which can be calculated using the least square method. b is:
a is:
where and are the mean of the yearly average DTR and the time series. > 0 represents an increasing trend of DTR over time, and vice versa. Significance levels of the are estimated according to the two-tailed Student t-test.
3. Model Evaluation
3.1. Climatology
The CMIP6 models can reproduce the spatial characteristics of climatological DTR in maize cultivation areas (Figure 2). The DTR increased gradually from low to high latitudes and ranged from 6 °C to 16 °C. The DTR gradually increased from coastal to inland regions, with higher DTR in NWC and TP than in other regions.
When compared with observations, the multi-model ensemble data were approximately 3 °C lower than the observations nationwide and 6 °C lower in NWC. In addition, the DTR in CY was 2 °C higher than the observation.
EC-Earth3-Veg-LR had the best simulation ability among the 26 CMIP6 models for simulating the climatological DTR in maize cultivation areas ( = 1.098). The reproducibility of the DTR averaged over China was lower than that of the maize cultivation area averages, but it was still acceptable. The DTR simulated using the was not as good as EC-Earth3 in either China or maize cultivation areas. The same conclusions could be drawn across the country. The simulation of EC-Earth3 was relatively greater in CY compared with the observation, while in other regions, they were approximately 1 °C lower.
There was geographic variability in the distribution of s among models (Figure 3). The average was 2.33 in maize cultivation areas and 2.73 in China, which indicates that the consistency within maize cultivation areas was higher than that in China. The s of simulations in NEC and TP were approximately 2 °C higher than those in other regions, and there were significant differences between models. These results indicated that the CMIP6 models have good simulation capability in eastern China. There were great differences between the simulated results of different models in NEC and TP. CMIP6 models were still deficient in their ability to simulate the climatological DTR on the TP, which is consistent with CMIP5. Improving the model to make the simulation more reliable has become a new challenge for model developers.
We evaluated each region and calculated the for each model separately, and the evaluation results are presented in Figure 4 to show the performance of the models more visually.
In general, the CMIP6 models could reproduce the spatial distribution of climatological DTR (Figure 4), and most models had s less than 2. CMIP6 models performed better in simulating DTR in maize cultivation areas than in China ( was smaller than ). EC-Earth3-Veg-LR had better simulation effects for maize cultivation areas ( = 1.098) than the other models, and the showed the same characteristics. Models with good performance (smaller ) had high s; the (0.82) of EC-Earth3-Veg-LR ranked in the top 3 among models. However, the difference between the ( = 1.43) and observations was slightly greater than that of EC-Earth3-Veg-LR. There were large differences in model performance across regions. Moreover, the results show that the models had better simulations in SWC and NC. However, EC-Earth3-Veg was not the best in other regions. EC-Earth3 had the smallest and the highest ranking in NWC, which is consistent with the results in China evaluations. These results suggested that even the model with the best performance among the 26 models may not have the best simulation capability in all regions.
3.2. Interannual Variability
According to the observations, the growing season DTR in maize cultivation areas showed a decreasing trend at a rate of −0.151 °C/10 a (Figure 5). The same trend was observed for the annual DTR, with a decreasing rate of −0.178 °C/10 a. The annual DTR showed a greater rate of decline relative to the maize-growing season. CMIP6 models could better simulate these trends: among the 26 CMIP6 models, EC-Earth3 had the best simulation for the annual DTR trend (−0.119 °C/10 a) and performed best in the maize-growing season (−0.161 °C/10 a). The could simulate these trends with slower rates.
In general, CMIP6 models were able to simulate the interannual variation in the annual DTR and growing season mean DTR in maize cultivation areas. Most models had s less than 0.7. The maize-growing season DTR simulated using CMIP6 models performed differently from that of the annual DTR, and some models simulated the annual DTR better than the simulation of the growing season DTR. Similarly, it has been reported that CMIP5 simulates the interannual variability in annual surface air temperature better than monthly and seasonal temperatures. It is worth noting that models with good simulations of annual DTR were slightly inferior in simulating the growing season mean DTR, while models with good simulations of the growing season mean DTR showed unsatisfactory simulations for interannual variation of annual DTR (Figure 6). A model with a good simulation of annual DTR does not imply a good simulation of the maize-growing season; therefore, targeted evaluation for the maize-growing season becomes essential. AWI-CM-1-1-MR had the best ability to simulate DTR for the maize-growing season, and it was more suitable for studies targeting the maize-growing season compared with the interannual variation. Models with smaller s also had higher s; the (0.36) of AWI-CM-1-1-MR ranked in the top 5 among models. The performance of the CMIP6 model varied greatly across regions (Figure 6). The was more suitable for the simulation of annual DTR.
3.3. Comprehensive Evaluation
To comprehensively evaluate the ability of each model to simulate the spatial and temporal characteristics of the DTR in maize cultivation areas, the was used to evaluate each model in this study. According to Table 2, EC-Earth3-Veg-LR had the best simulation of DTR in maize cultivation areas ( = 0.92), which is more suitable for the simulation of DTR in maize cultivation areas of China.
4. Future Projections
Acceptable performances of climate models are the basis for developing credible data of future climate through CMIP6 scenario simulations. In this section, we explore the future changes in the diurnal temperature range of maize cultivation areas of China simulated using EC-Earth3-Veg-LR. The period is focused on two SSPs (SSP245 and SSP585): the period from 2031 to 2050 was selected to project the future climatological DTR, as it represents the middle of the 21st century. The linear trends of the annual average and growing season mean DTR in the main maize cultivation areas from 2015 to 2050 were calculated.
4.1. Climatology
The DTR and future changes in maize cultivation areas of China under different future scenarios are shown in Figure 7. The future DTR spatial distributions shared the same characteristics as historical observations. The DTR increased gradually from low to high latitudes, ranged from 6 °C to 16 °C, and gradually increased from coastal to inland regions.
Compared with historical (1995–2014) simulations, reductions were widely detected: under the SSP245 scenario, there was a decline in 86.90% of grid points within China and 81.2% under the SSP585 scenario. The climatological DTR of maize cultivation areas decreased by 0.151 °C (SSP245) and 0.207 °C (SSP585). The reduction proportion of the DTR under the SSP585 scenario was slightly smaller than that under the SSP245 scenario (Table 3). Under the SSP245 scenario, the reduction was mainly distributed in NWC, NC, and SWC, and the magnitude of change was concentrated at approximately 0.20 °C. The climatological DTR during 2030~2050 in NEC was approximately 0.38 °C higher than that of historical simulations. Almost all subregions showed a reduction under the SSP585 scenario, with a magnitude of 0.19 °C.
4.2. Interannual Variability
Compared with the historical period (1961–2014), the annual DTR remained essentially unchanged under the SSP245 scenario in maize cultivation areas (Figure 8), while the growing season DTR had an increasing trend (0.014 °C/10 a). Under the SSP585 scenario, the growing season DTR in maize cultivation areas exhibited a decreasing trend at a rate of −0.052 °C/10 a, and the annual DTR showed a greater decreasing trend (−0.069 °C/10 a). The decreasing trends of DTR under the SSP585 scenario were greater than those under the SSP245 scenario.
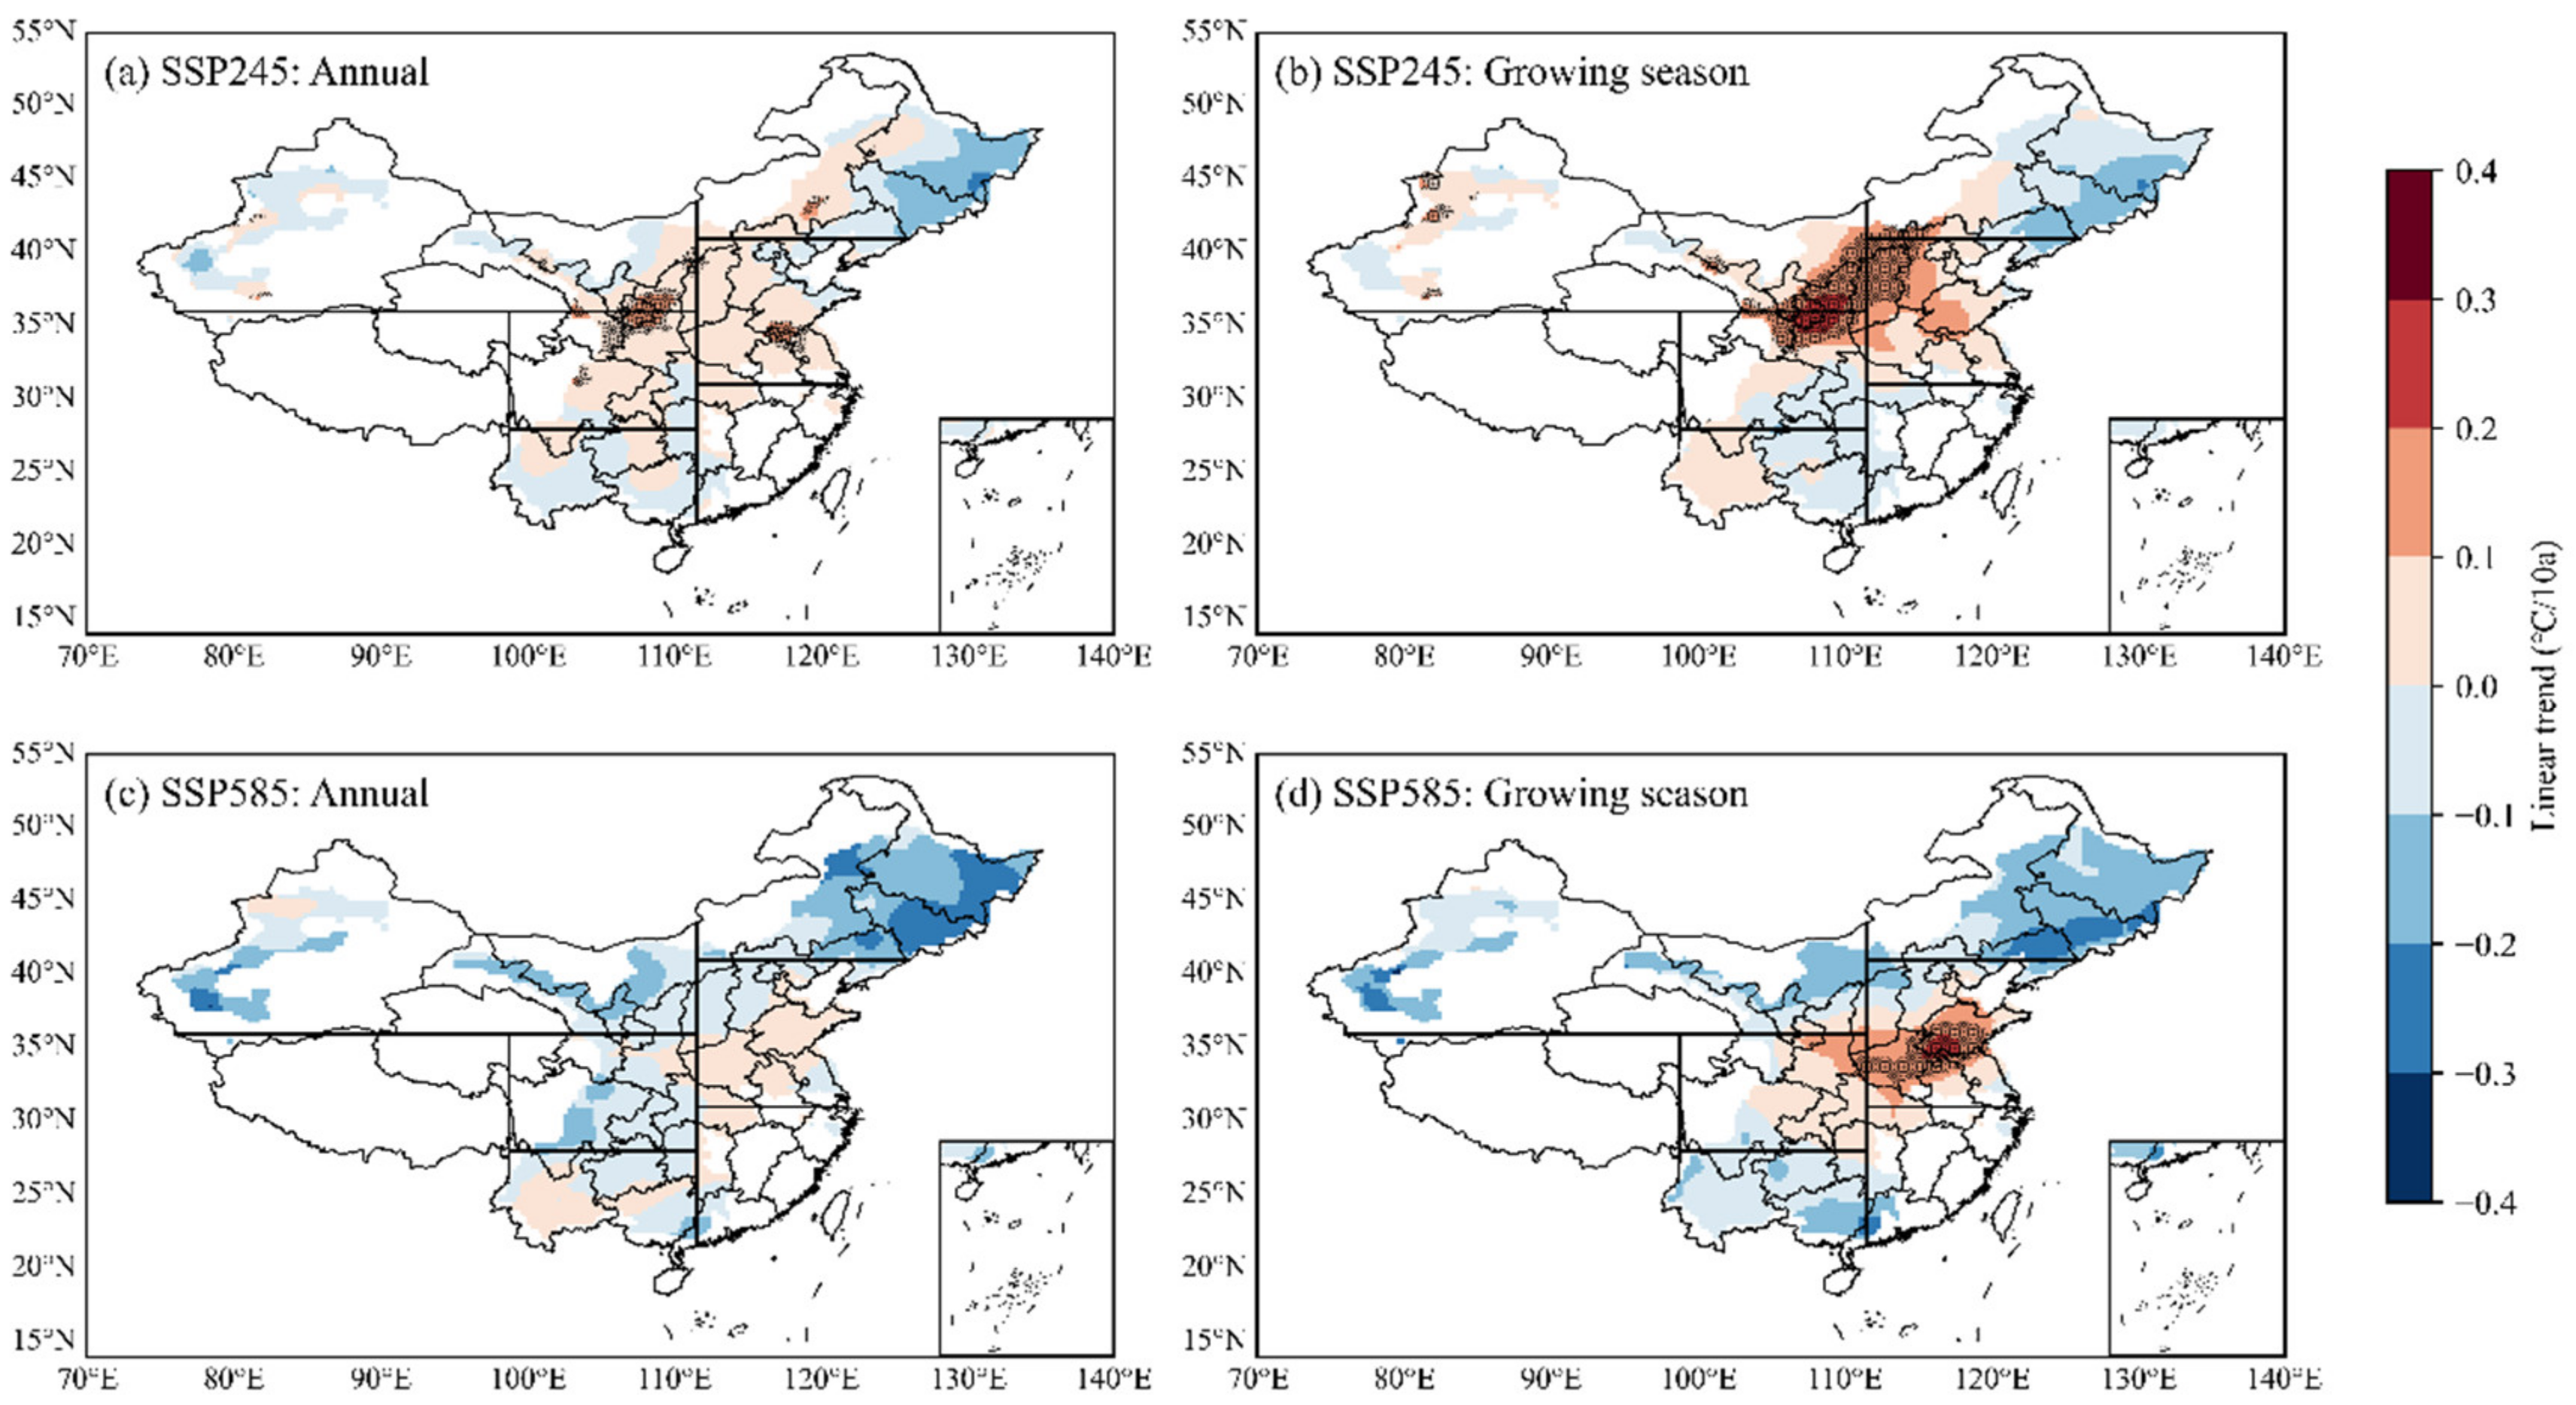
The annual DTR always showed a greater rate of decline relative to the growing season DTR in maize cultivation areas in both scenarios (Table 4). The annual DTR in the maize cultivation areas under the SSP245 scenario showed a decreasing trend at 45.90% of the grid points, while in NEC, SWC, and NWC, it was dominated by a decreasing trend. There was a significant increase in NC and CY. For the growing season DTR, more grid points showed decreasing trends in both NEC and CY. The proportion of grid points with decreasing trends in CY increased significantly, while the proportion of significant grid points increased and was more concentrated (Figure 9). In NWC and NC, the proportion of decreasing grid points decreased and that of significant grid points increased, mainly in the eastern area of Northwest China. The annual (76.28%) and growing season (70.09%) DTR under the SSP585 scenario showed decreasing trends at most grid points in maize cultivation areas, with decreasing rates exceeding 0.2 °C/10 a in NEC, SWC, and NWC. It showed increasing trends in most NC grid points and had a high percentage of significance (23.99%). The proportion of grid points with decreasing trends in DTR was greater under the SSP585 scenario than under the SSP245 scenario. Although the growing season DTR followed an increasing trend in NC and CY under the SSP245 scenario in general, the increasing trend was not significant in grid points with high maize cultivation in China (Figure 1), even with a large decreasing trend (NEC). Since Chinese maize production is mainly concentrated in NC and NEC, and the growing season DTR in these two subregions showed opposite changes, this may cause some impact on the quality and yield of maize in China.
5. Discussion
To explore the applicability of the CMIP6 model to maize research, an assessment was first conducted to evaluate the ability of CMIP6 models to simulate DTR in maize cultivation areas in China. The results show that CMIP6 models can reproduce the spatial and temporal characteristics of DTR in historical periods. CMIP6 models still have obvious deviations in simulating DTR in western China, which shares the same characteristics with other meteorological components [37,44,45]. The complex terrain in NWC may lead to simulation uncertainty [46]. The simulation effect of CMIP6 models on the historical climate DTR of the main maize cultivation areas is better than that of China. The decreasing DTR trend has been universally observed since the 1950s [47,48]. CMIP6 models can also capture the slow decreasing trend in annual DTR and growing season average DTR in maize cultivation areas during the historical period. CMIP6 models simulate the annual DTR better than that for the growing season DTR, and the same characteristics can be found in the simulations of meteorological components such as temperature and precipitation [49,50]. This difference makes it critical and essential to perform targeted model evaluations of the maize-growing season. As a result of the comprehensive evaluation, EC-Earth3-Veg-LR has the best simulation ability for the spatial and temporal distribution characteristics of DTR in maize cultivation areas.
We projected the spatial and temporal characteristics and changes in the DTR in the maize cultivation areas under different future scenarios with the selected optimal model. Compared with the historical simulation, the climatic DTR of the main maize-producing areas in the middle 21st century will be reduced by 0.151°C (SSP245) and 0.207 °C (SSP585). SSP585 showed a greater proportion of DTR reduction than SSP245. The DTR in the main maize cultivation areas under SSP245 is expected to remain unchanged (annual) or increase slightly (growing season). Under SSP585, DTR is expected to decrease both annually and during the growing season. The projected DTR changes shared the same characteristics with previous studies [15,48,51]. The downward trend of DTR in future scenarios is consistent with the historical period [52,53]. At the same time, the DTR trends in maize cultivation areas are also similar to the global DTR trends. It is worth noting that there are significant increasing trends of growing season DTR in NC and NEC, and the impact on the quality and yield of crops in China needs to be further explored.
A considerable number of studies have been conducted to evaluate the ability of climate models to simulate key meteorological components [18,19,20,21,22,23]. However, the spatial scales of previous evaluations were primarily global or national. There have been few studies on maize cultivation areas and maize-growing seasons. When estimating the effects of future climate on maize yield and quality, using inappropriate climate model data will greatly reduce the credibility of the results. We quantitatively evaluated the ability of CMIP6 models to simulate the temporal and spatial characteristics of the DTR in the main maize production areas from multiple perspectives and used the optimal model to predict and analyze the changes in the DTR in the main maize production areas in China under different scenarios in the future. This will help to further improve the ability of global climate models to simulate the DTR in China’s maize cultivation areas and to serve research on the effects of climate change on maize yield and quality.
This study only evaluates the DTR of the maize cultivation areas in China and projected the DTR changes during 2015–2050 under different SSP scenarios. The scope of our study is limited in China, and the simulation capability of the climate model in other regions needs further evaluation and projection. The yield of crops is known to be influenced by the environment and other factors [1,2,3,4,5]. Thus, the ability of the climate model to simulate other climate components in the maize cultivation areas in China needs to be further evaluated. Meanwhile, the evaluation and prediction of other meteorological elements are also worthy of further study and are of great significance and necessity.
6. Conclusions
The ability of 26 CMIP6 models to simulate the DTR during 1961–2014 is examined using model output together with the high-resolution CN05.1 dataset. Based on the overall rankings of the historical simulation capacities of 26 CMIP6 models in maize cultivation areas, the optimal model is screened to serve future estimates. Then, with the application of the optimal model, a future projection of DTR in the main maize cultivation areas during 2015–2050 under two SSPs is presented in this study. The main conclusions are summarized as follows:
- CMIP6 models can generally reproduce the spatial distribution and interannual variation in the DTR in the main maize cultivation areas. The reproducibility of the DTR averaged over the main maize cultivation areas is better than that of China ( is smaller than ). The DTR varies substantially between the models, and the intermodel spread is particularly large in NWC.
- Based on the comprehensive evaluation, EC-Earth3-Veg-LR is more suitable for the simulation of DTR in the main maize cultivation areas in China. It is essential to pertinently evaluate global climate models. The reproducibility of the maize-growing season DTR averaged over the main maize cultivation areas is lower than that of the annual DTR, but it is still acceptable.
- Compared with historical simulations, reductions are widely detected: the climatological DTR of the main maize cultivation areas decreases by 0.151 °C (SSP245) and 0.207 °C (SSP585). Under the SSP245 scenario, the reduction is mainly distributed in NWC, NC, and CY. All subregions show a reduction under SSP585. The reduction proportion of DTR under SSP245 is slightly smaller than that under SSP585.
- The DTR in the main maize cultivation areas under SSP245 is expected to remain unchanged (annual) or to increase slightly (growing season). Under SSP585, DTR is expected to decrease both annually and during the growing season. The annual and growing season DTRs are dominated by decreasing trends in NEC, NWC, and SWC under the two scenarios, while in CY and NC, the growing season DTR shows a significant increase.
Author Contributions
Conceptualization, X.Y. and W.X.; methodology, W.X.; software, W.X.; validation, W.X., S.W. and X.Y.; formal analysis, W.X.; investigation, W.X.; resources, W.X. and S.W.; data curation, W.X. and S.W.; writing—original draft preparation, W.X.; writing—review and editing, W.X. and X.Y.; visualization, W.X.; supervision, X.Y.; project administration, X.Y.; funding acquisition, X.Y. All authors have read and agreed to the published version of the manuscript.
Funding
This research was funded by the National Key R&D Program of China, grant number 2019YFA0606904.
Institutional Review Board Statement
Not applicable.
Informed Consent Statement
Not applicable.
Data Availability Statement
Not applicable.
Acknowledgments
We would like to thank the China Meteorological Administration for temperature data and information. We also acknowledge the Coupled Model Intercomparison Project (CMIP) launched by the World Climate Research Program (WCRP) for CMIP6 data.
Conflicts of Interest
The authors declare no conflict of interest. The funders had no role in the design of the study; in the collection, analyses, or interpretation of data; in the writing of the manuscript, or in the decision to publish the results.
References
- Arunrat, N.; Sereenonchai, S.; Chaowiwat, W.; Wang, C. Climate change impact on major crop yield and water footprint under CMIP6 climate projections in repeated drought and flood areas in Thailand. Sci. Total Environ. 2022, 807, 150741. [Google Scholar] [CrossRef] [PubMed]
- Arunrat, N.; Sereenonchai, S.; Wang, C. Carbon footprint and predicting the impact of climate change on carbon sequestration ecosystem services of organic rice farming and conventional rice farming: A case study in Phichit province, Thailand. J. Environ. Manag. 2021, 289, 112458. [Google Scholar] [CrossRef]
- Arunrat, N.; Pumijumnong, N.; Sereenonchai, S.; Chareonwong, U.; Wang, C. Assessment of climate change impact on rice yield and water footprint of large-scale and individual farming in Thailand. Sci. Total Environ. 2020, 726, 137864. [Google Scholar] [CrossRef] [PubMed]
- Lobell, D.B.; Field, C.B. Global scale climate–crop yield relationships and the impacts of recent warming. Environ. Res. Lett. 2007, 2, 014002. [Google Scholar] [CrossRef]
- Moriondo, M.; Giannakopoulos, C.; Bindi, M. Climate change impact assessment: The role of climate extremes in crop yield simulation. Clim. Change 2011, 104, 679–701. [Google Scholar] [CrossRef]
- Xiong, W.; Holman, I.; Lin, E.; Conway, D.; Li, Y.; Wu, W. Untangling relative contributions of recent climate and CO2 trends to national cereal production in China. Environ. Res. Lett. 2012, 7, 044014. [Google Scholar] [CrossRef]
- Wang, L.; Xiong, W.; Wen, X.; Feng, L. Effect of climatic factors such as temperature, precipitation on maize production in China. Trans. Chin. Soc. Agric. Eng. 2014, 30, 138–146. [Google Scholar] [CrossRef]
- Wang, Y.; Yang, H.; Liu, R.; Cai, H. Try to discuss the relationships between the seed qualities of wheat and meteorological conditions. Chin. J. Agrometeorol. 1990, 11, 1–7. [Google Scholar]
- Dhakhwa, G.B.; Campbell, C.L. Potential effects of differential day-night warming in global climate change on crop production. Clim. Change 1998, 40, 647–667. [Google Scholar] [CrossRef]
- Tubiello, F.N.; Rosenzweig, C.; Goldberg, R.A.; Jagtap, S.; Jones, J.W. Effects of climate change on US crop production: Simulation results using two different GCM scenarios. Part I: Wheat, potato, maize, and citrus. Clim. Res. 2002, 20, 259–270. [Google Scholar] [CrossRef] [Green Version]
- Smika, D.E.; Greb, B.W. Protein Content of Winter Wheat Grain as Related to Soil and Climatic Factors in the Semiarid Central Great Plains. Agron. J. 1973, 65, 433–436. [Google Scholar] [CrossRef]
- Jiang, L.X.; Lv, J.J.; Wang, L.L.; Yang, X.Q.; Li, S. Variation of Diurnal Temperature Range and its Relationship with Crop Yield in Heilongjiang Province. Chin. J. Agrometeorol. 2013, 2, 179–185. [Google Scholar]
- Fall, S.; Watts, A.; Nielsen-Gammon, J.; Jones, E.; Niyogi, D.; Christy, J.R.; Pielke, R.A., Sr. Analysis of the impacts of station exposure on the US Historical Climatology Network temperatures and temperature trends. J. Geophys. Res. Atmos. 2011, 116, D14. [Google Scholar] [CrossRef] [Green Version]
- Zhou, Y.; Ren, G. Change in extreme temperature event frequency over mainland China, 1961−2008. Clim. Res. 2011, 50, 125–139. [Google Scholar] [CrossRef] [Green Version]
- Lindvall, J.; Svensson, G. The diurnal temperature range in the CMIP5 models. Clim. Dyn. 2015, 44, 405–421. [Google Scholar] [CrossRef]
- Wang, J.; Chen, Y.; Tett, S.F.; Yan, Z.; Zhai, P.; Feng, J.; Xia, J. Anthropogenically-driven increases in the risks of summertime compound hot extremes. Nat. Commun. 2020, 11, 528. [Google Scholar] [CrossRef] [Green Version]
- Wang, B.; Feng, P.; De, L.; Garry, J.O.; Macadam, I.; Waters, C.; Asseng, S.; Cowie, A.; Jiang, T.; Xiao, D.; et al. Sources of uncertainty for wheat yield projections under future climate are site-specific. Nat. Food 2020, 1, 720–728. [Google Scholar] [CrossRef]
- Slafer, G.A.; Rawson, H.M. Rates and cardinal temperatures for processes of development in wheat: Effects of temperature and thermal amplitude. Funct. Plant Biol. 1995, 22, 913–926. [Google Scholar] [CrossRef]
- Larmure, A.; Salon, C.; Munier-Jolain, N.G. How does temperature affect C and N allocation to the seeds during the seed-filling period in pea? Effect on seed nitrogen concentration. Funct. Plant Biol. 2005, 32, 1009–1017. [Google Scholar] [CrossRef]
- Tang, B.; Hu, W.; Duan, A. Future Projection of Extreme Precipitation Indices over the Indochina Peninsula and South China in CMIP6 Models. J. Clim. 2021, 34, 8793–8811. [Google Scholar] [CrossRef]
- Knox, J.; Hess, T.; Daccache, A.; Wheeler, T. Climate change impacts on crop productivity in Africa and South Asia. Environ. Res. Lett. 2012, 7, 034032. [Google Scholar] [CrossRef]
- Lewis, S.C.; Karoly, D.J. Evaluation of historical diurnal temperature range trends in CMIP5 models. J. Clim. 2013, 26, 9077–9089. [Google Scholar] [CrossRef] [Green Version]
- Fan, X.; Duan, Q.; Shen, C.; Wu, Y.; Xing, C. Global surface air temperatures in CMIP6: Historical performance and future changes. Environ. Res. Lett. 2020, 15, 104056. [Google Scholar] [CrossRef]
- Tao, F.; Yokozawa, M.; Liu, J.; Zhang, Z. Climate–crop yield relationships at provincial scales in China and the impacts of recent climate trends. Clim. Res. 2008, 38, 83–94. [Google Scholar] [CrossRef]
- Zhang, T.; Zhu, J.; Wassmann, R. Responses of rice yields to recent climate change in China: An empirical assessment based on long-term observations at different spatial scales (1981–2005). Agric. For. Meteorol. 2010, 150, 1128–1137. [Google Scholar] [CrossRef]
- Zhou, T.; Zou, L.; Chen, X. Commentary on the Coupled Model Intercomparison Project Phase 6 (CMIP6). Clim. Change Res. 2019, 15, 445–456. [Google Scholar] [CrossRef]
- CMIP6 Search Interface. Available online: https://esgf-node.llnl.gov/search/cmip6 (accessed on 29 December 2021).
- Wu, J.; Gao, X.J. A gridded daily observation dataset over China region and comparison with the other datasets. Diqiu Wuli Xuebao 2013, 56, 1102–1111. [Google Scholar] [CrossRef]
- Xu, Y.; Gao, X.J.; Yan, S.Y.; Xu, C.H.; Shi, Y.; Giorgi, F. A daily temperature dataset over China and its application in validating a RCM simulation. Adv. Atmos. Sci. 2009, 26, 763–772. [Google Scholar] [CrossRef]
- New, M.; Lister, D.; Hulme, M.; Makin, I. A high-resolution data set ofsurface climate over global land areas. Clim. Res. 2002, 21, 1–25. [Google Scholar] [CrossRef] [Green Version]
- Li, Q.X.; Huang, J.; Jiang, Z.; Zhou, L.; Chu, P.; Hu, K. Detection of urbanizationsignals in extreme winter minimum temperature changes over northern China. Clim. Change 2014, 122, 595–608. [Google Scholar] [CrossRef]
- Monfreda, C.; Ramankutty, N.; Foley, J.A. Farming the planet: 2. Geographic distribution of crop areas, yields, physiological types, and net primary production in the year 2000. Glob. Biogeochem. Cycles 2008, 22, GB1022. [Google Scholar] [CrossRef]
- Wu, Y.; Miao, C.; Duan, Q.; Shen, C.; Fan, X. Evaluation and projection of daily maximum and minimum temperatures over China using the high-resolution NEX-GDDP dataset. Clim. Dyn. 2020, 55, 2615–2629. [Google Scholar] [CrossRef]
- IPCC. Summary for policymakers. In Climate Change 2021: The Physical Science Basis. Contribution of Working Group I to the Sixth Assessment Report of the Intergovernmental Panel on Climate Change; Cambridge University Press: Cambridge, UK, 2021. [Google Scholar]
- Cao, Y.; Li, W.; Zhao, B. Water requirements of spring maize in Northwest Liaoning Province under climate change. Resour. Sci. 2018, 40, 150–160. [Google Scholar] [CrossRef] [Green Version]
- Kobayashi, K.; Salam, M.U. Comparing simulated and measured values using mean squared deviation and its components. Agron. J. 2000, 92, 345–352. [Google Scholar] [CrossRef]
- Zhou, T.; Yu, R. Twentieth-century surface air temperature over China and the globe simulated by coupled climate models. J. Clim. 2006, 19, 5843–5858. [Google Scholar] [CrossRef]
- Gupta, H.V.; Kling, H.; Yilmaz, K.K.; Martinez, G.F. Decomposition of the mean squared error and NSE performance criteria: Implications for improving hydrological modelling. J. Hydrol. 2009, 377, 80–91. [Google Scholar] [CrossRef] [Green Version]
- Kling, H.; Fuchs, M.; Paulin, M. Runoff conditions in the upper Danube basin under an ensemble of climate change scenarios. J. Hydrol. 2012, 424, 264–277. [Google Scholar] [CrossRef]
- Hamed, M.M.; Nashwan, M.S.; Shahid, S.; bin Ismail, T.; Wang, X.J.; Dewan, A.; Asaduzzaman, M. Inconsistency in historical simulations and future projections of temperature and rainfall: A comparison of CMIP5 and CMIP6 models over Southeast Asia. Atmos. Res. 2022, 265, 105927. [Google Scholar] [CrossRef]
- Jiang, Z.; Li, W.; Xu, J.; Li, L. Extreme precipitation indices over China in CMIP5 models. Part I: Model evaluation. J. Clim. 2015, 28, 8603–8619. [Google Scholar] [CrossRef]
- Jiang, D.; Wang, H.; Lang, X. Evaluation of East Asian climatology as simulated by seven coupled models. Adv. Atmos. Sci. 2005, 22, 479–495. [Google Scholar] [CrossRef]
- Wei, F.Y. Modern Climate Statistical Diagnosis and Prediction Technology; Meteorological Press: Beijing, China, 1999; p. 269. [Google Scholar]
- Guo, Y.; Dong, W.; Ren, F.; Zha, Z.; Huang, J. Surface air temperature simulations over China with CMIP5 and CMIP3. Adv. Clim. Change Res. 2013, 4, 145–152. [Google Scholar] [CrossRef]
- Xu, Y.; Xu, C. Preliminary assessment of simulations of climate changes over China by CMIP5 multi-models. Atmos. Ocean. Sci. Lett. 2012, 5, 489–494. [Google Scholar] [CrossRef]
- Hu, Q.; Jiang, D.; Fan, G. Evaluation of CMIP5 models over the Qinghai-Tibetan Plateau. Chin. J. Atmos. Sci. 2014, 38, 924–938. [Google Scholar] [CrossRef]
- Easterling, D.R.; Horton, B.; Jones, P.D.; Peterson, T.C.; Karl, T.R.; Parker, D.E.; Salinger, M.J.; Razuvayev, V.; Plummer, N.; Folland, C.K. Maximum and minimum temperature trends for the globe. Science 1997, 277, 364–367. [Google Scholar] [CrossRef] [Green Version]
- Wang, K.; Clow, G.D. The Diurnal Temperature Range in CMIP6 Models: Climatology, Variability, and Evolution. J. Clim. 2020, 33, 8261–8279. [Google Scholar] [CrossRef]
- Xia, J.; Yan, Z.; Jia, G.; Zeng, H.; Jones, P.D.; Zhou, W.; Zhang, A. Projections of the advance in the start of the growing season during the 21st century based on CMIP5 simulations. Adv. Atmos. Sci. 2015, 32, 831–838. [Google Scholar] [CrossRef]
- Kamworapan, S.; Surussavadee, C. Evaluation of CMIP5 global climate models for simulating climatological temperature and precipitation for Southeast Asia. Adv. Meteorol. 2019, 2019, 1067365. [Google Scholar] [CrossRef]
- Hamal, K.; Sharma, S.; Talchabhadel, R.; Ali, M.; Dhital, Y.P.; Xu, T.; Dawadi, B. Trends in the Diurnal Temperature Range over the Southern Slope of Central Himalaya: Retrospective and Prospective Evaluation. Atmosphere 2021, 12, 1683. [Google Scholar] [CrossRef]
- You, Q.; Wang, D.; Jiang, Z.; Kang, S. Diurnal temperature range in CMIP5 models and observations on the Tibetan Plateau. Q. J. R. Meteorol. Soc. 2017, 143, 1978–1989. [Google Scholar] [CrossRef]
- Sun, X.; Ren, G.; You, Q.; Ren, Y.; Xu, W.; Xue, X.; Zhang, P. Global diurnal temperature range (DTR) changes since 1901. Clim. Dyn. 2019, 52, 3343–3356. [Google Scholar] [CrossRef]
Figure 1.
The regional divisions in China (subregion 1: Northeast China (NEC), subregion 2: North China (NC), subregion 3: Southeast China (SEC), subregion 4: Southwest China (SWC), subregion 5: Chuanyu (CY), subregion 6: Northwest China (NWC), and subregion 7: Tibetan Plateau (TP)).
Figure 1.
The regional divisions in China (subregion 1: Northeast China (NEC), subregion 2: North China (NC), subregion 3: Southeast China (SEC), subregion 4: Southwest China (SWC), subregion 5: Chuanyu (CY), subregion 6: Northwest China (NWC), and subregion 7: Tibetan Plateau (TP)).
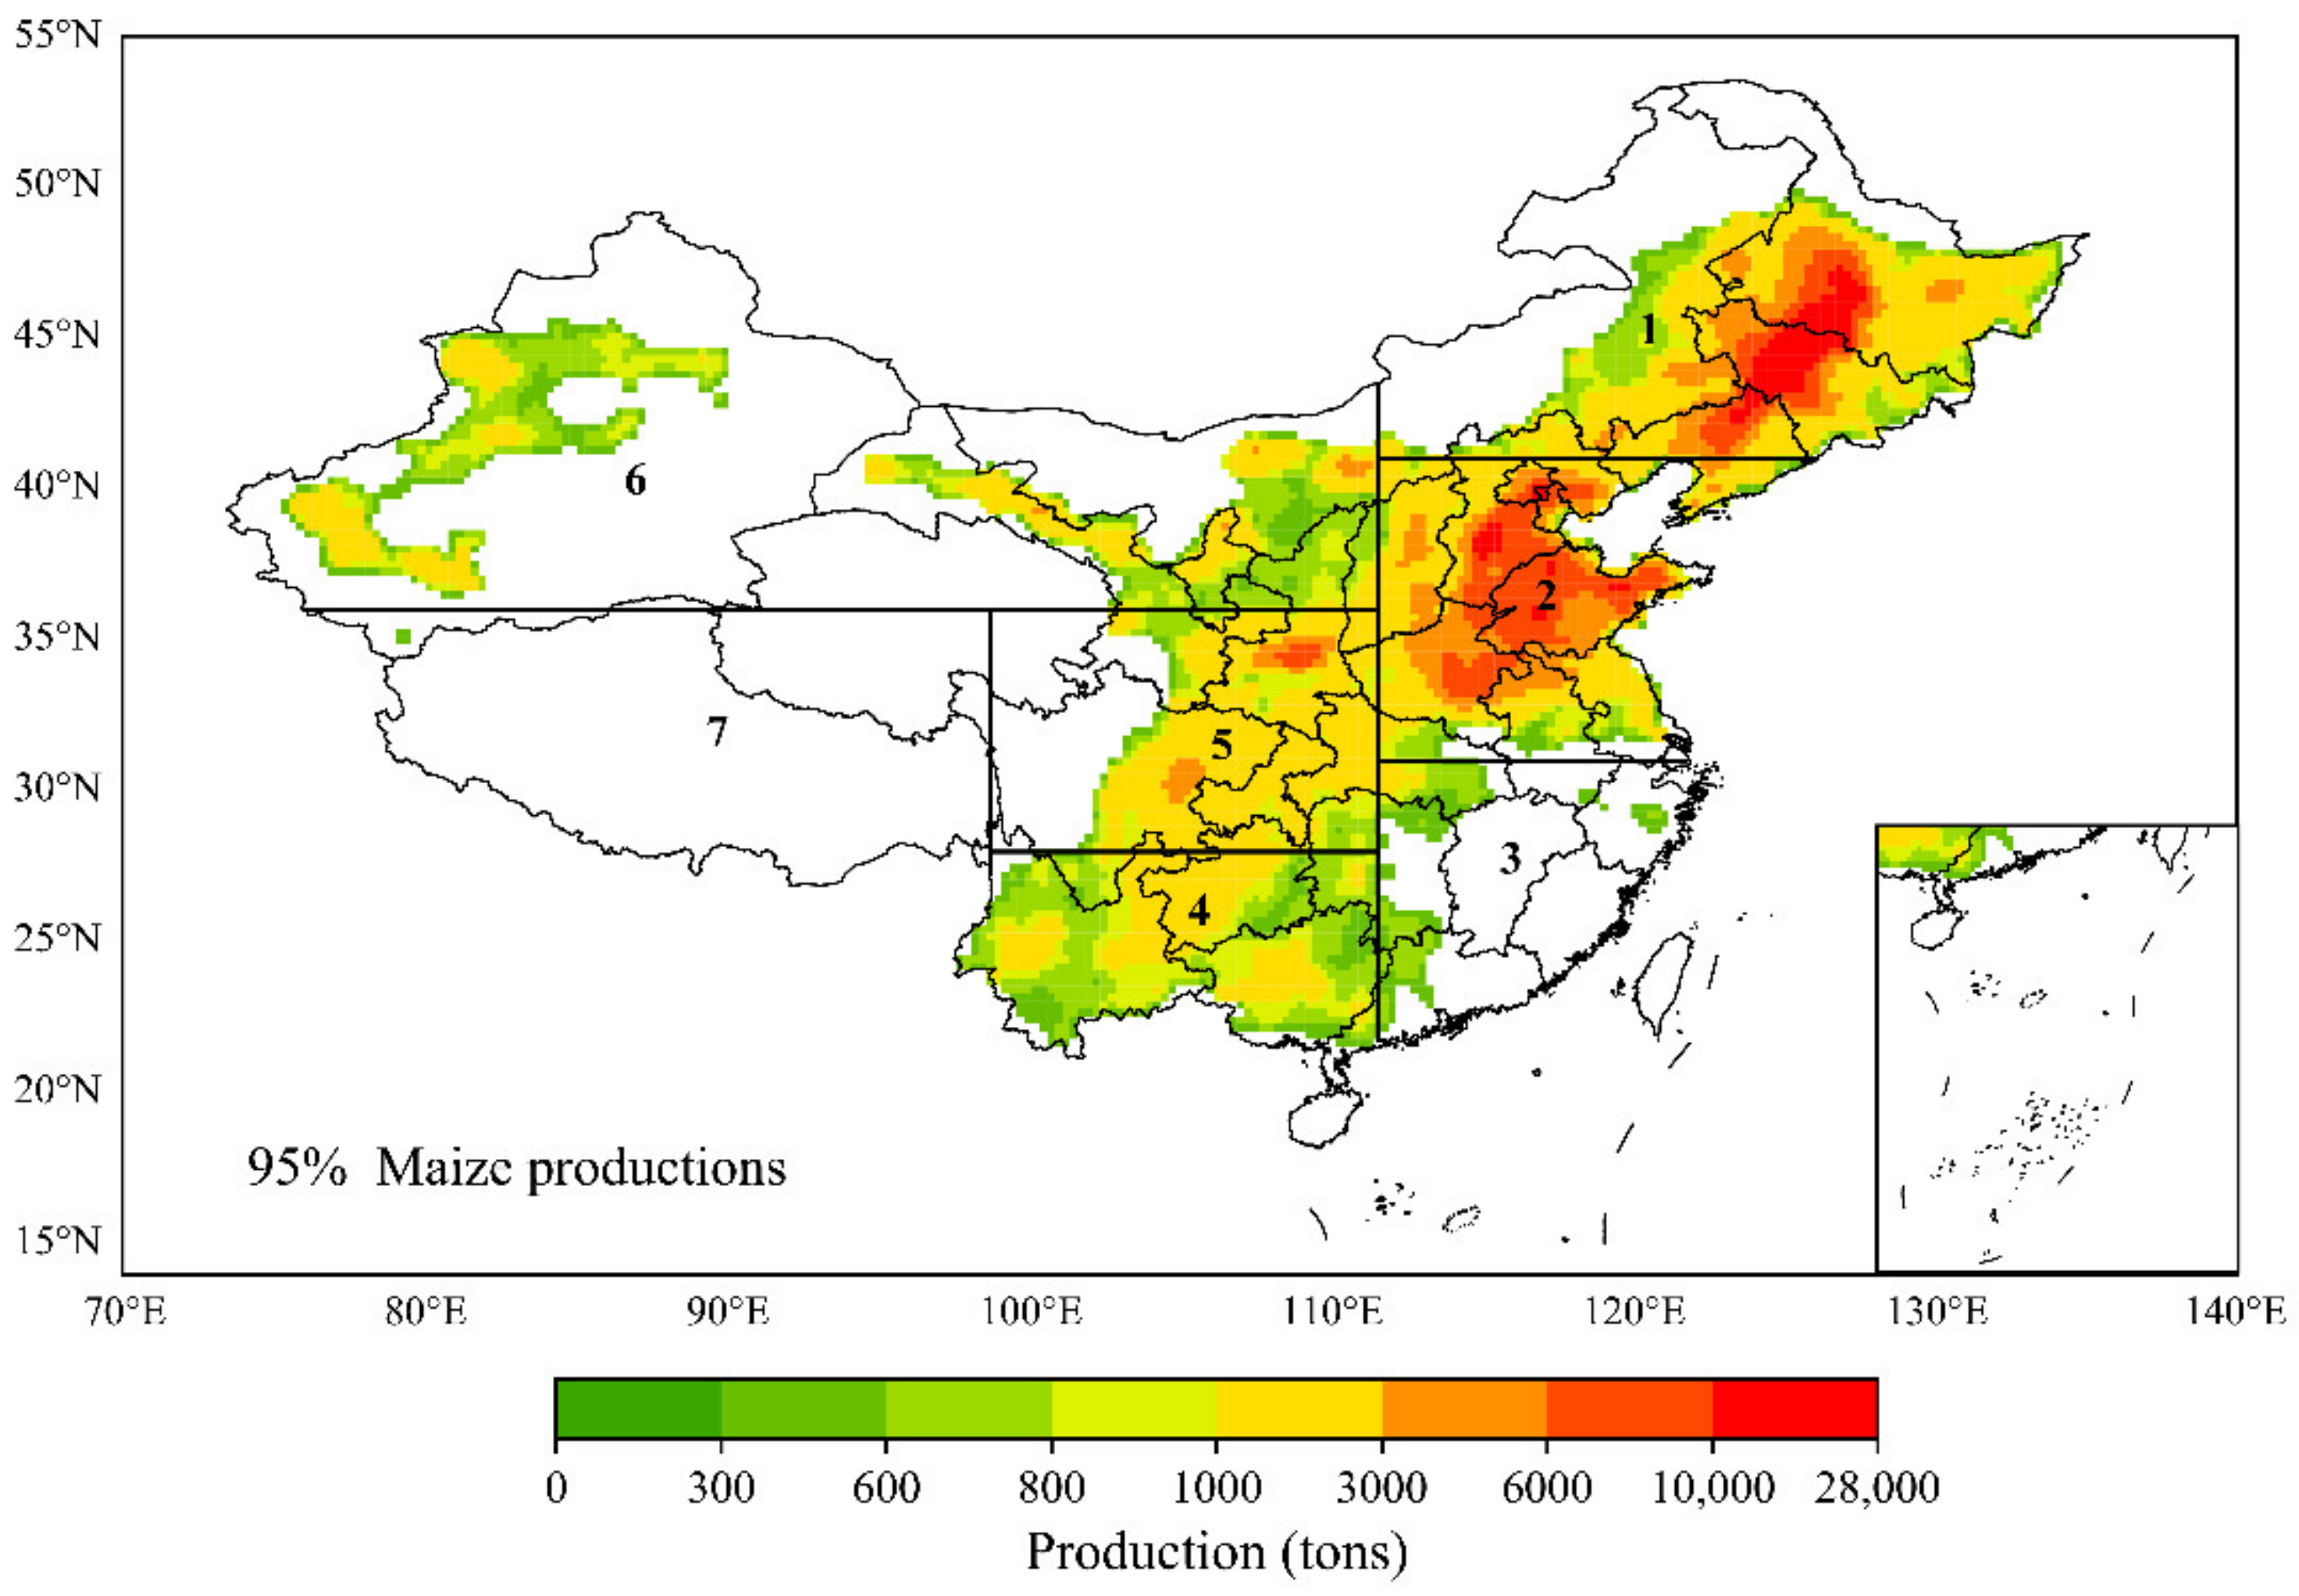
Figure 2.
Observation and simulations of climatological DTR spatial distribution during 1995–2014 in China (left column displays simulated results of DTR in maize cultivation areas; the right column shows the nationwide results); (a,b) are the models with the highest . Observation (c,d) multi-model ensemble () data are shown in (e,f).
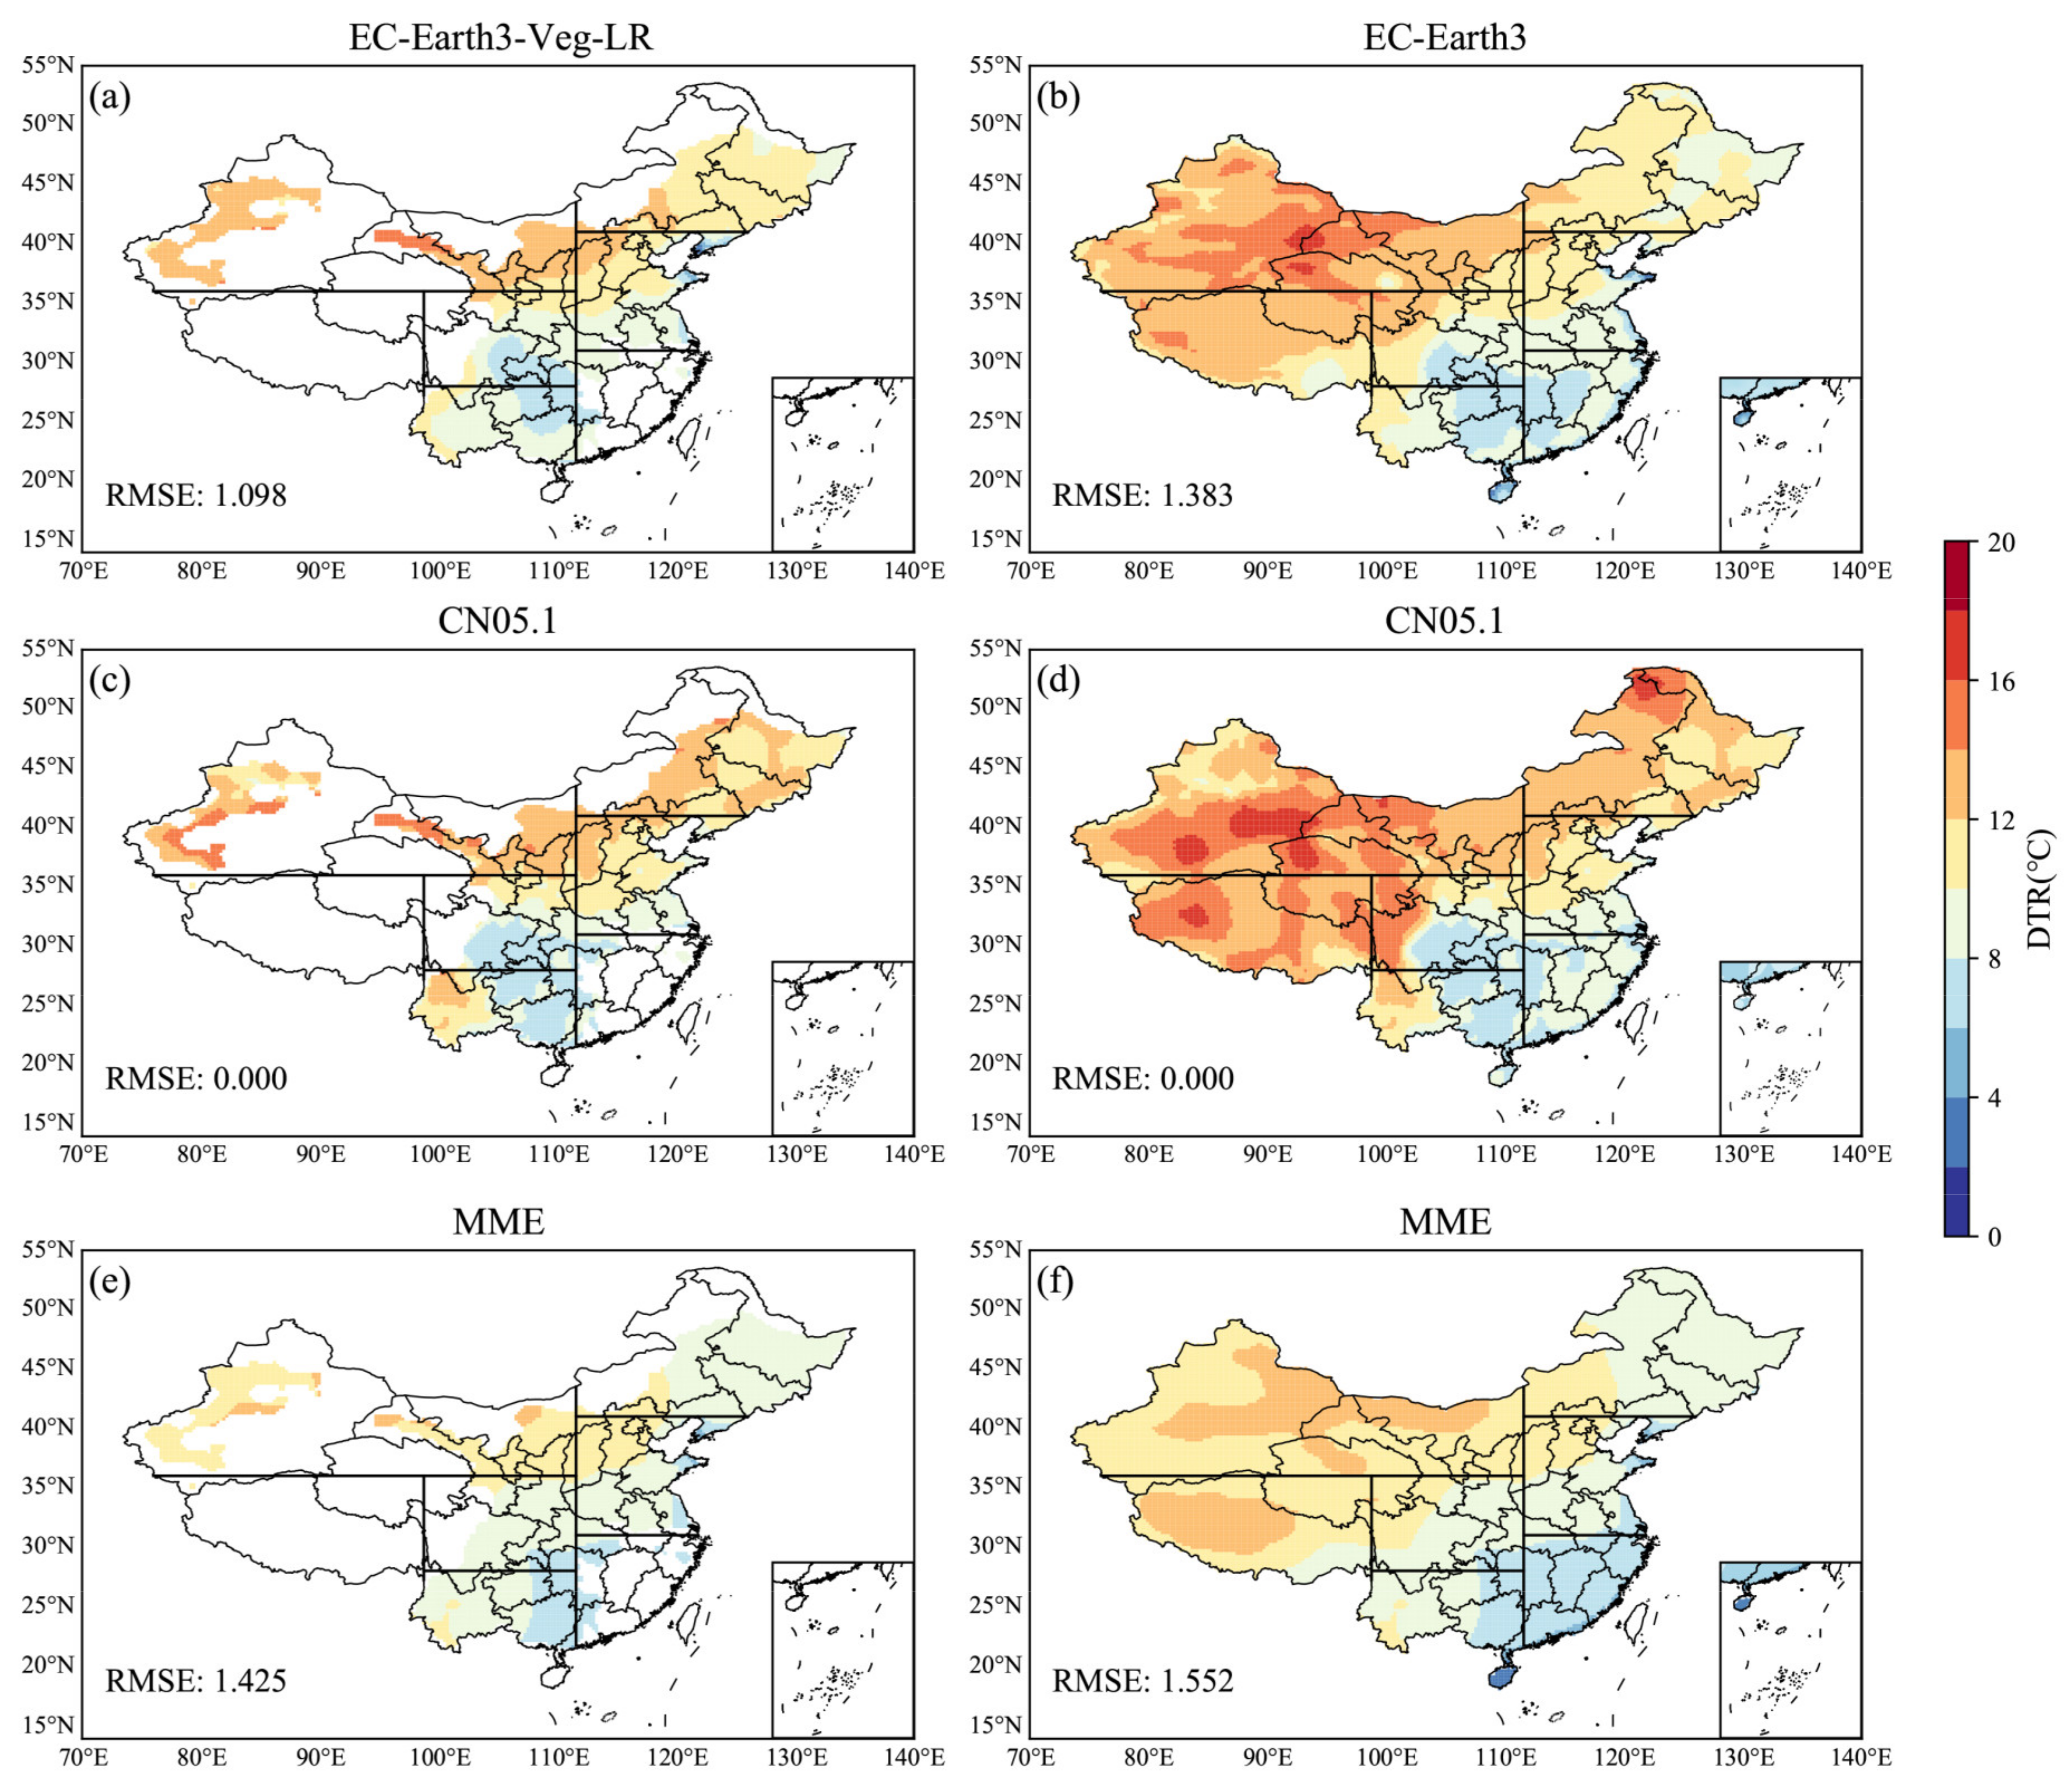
Figure 3.
Standard deviations () between CMIP6 models in maize cultivation areas (a) and China (b).
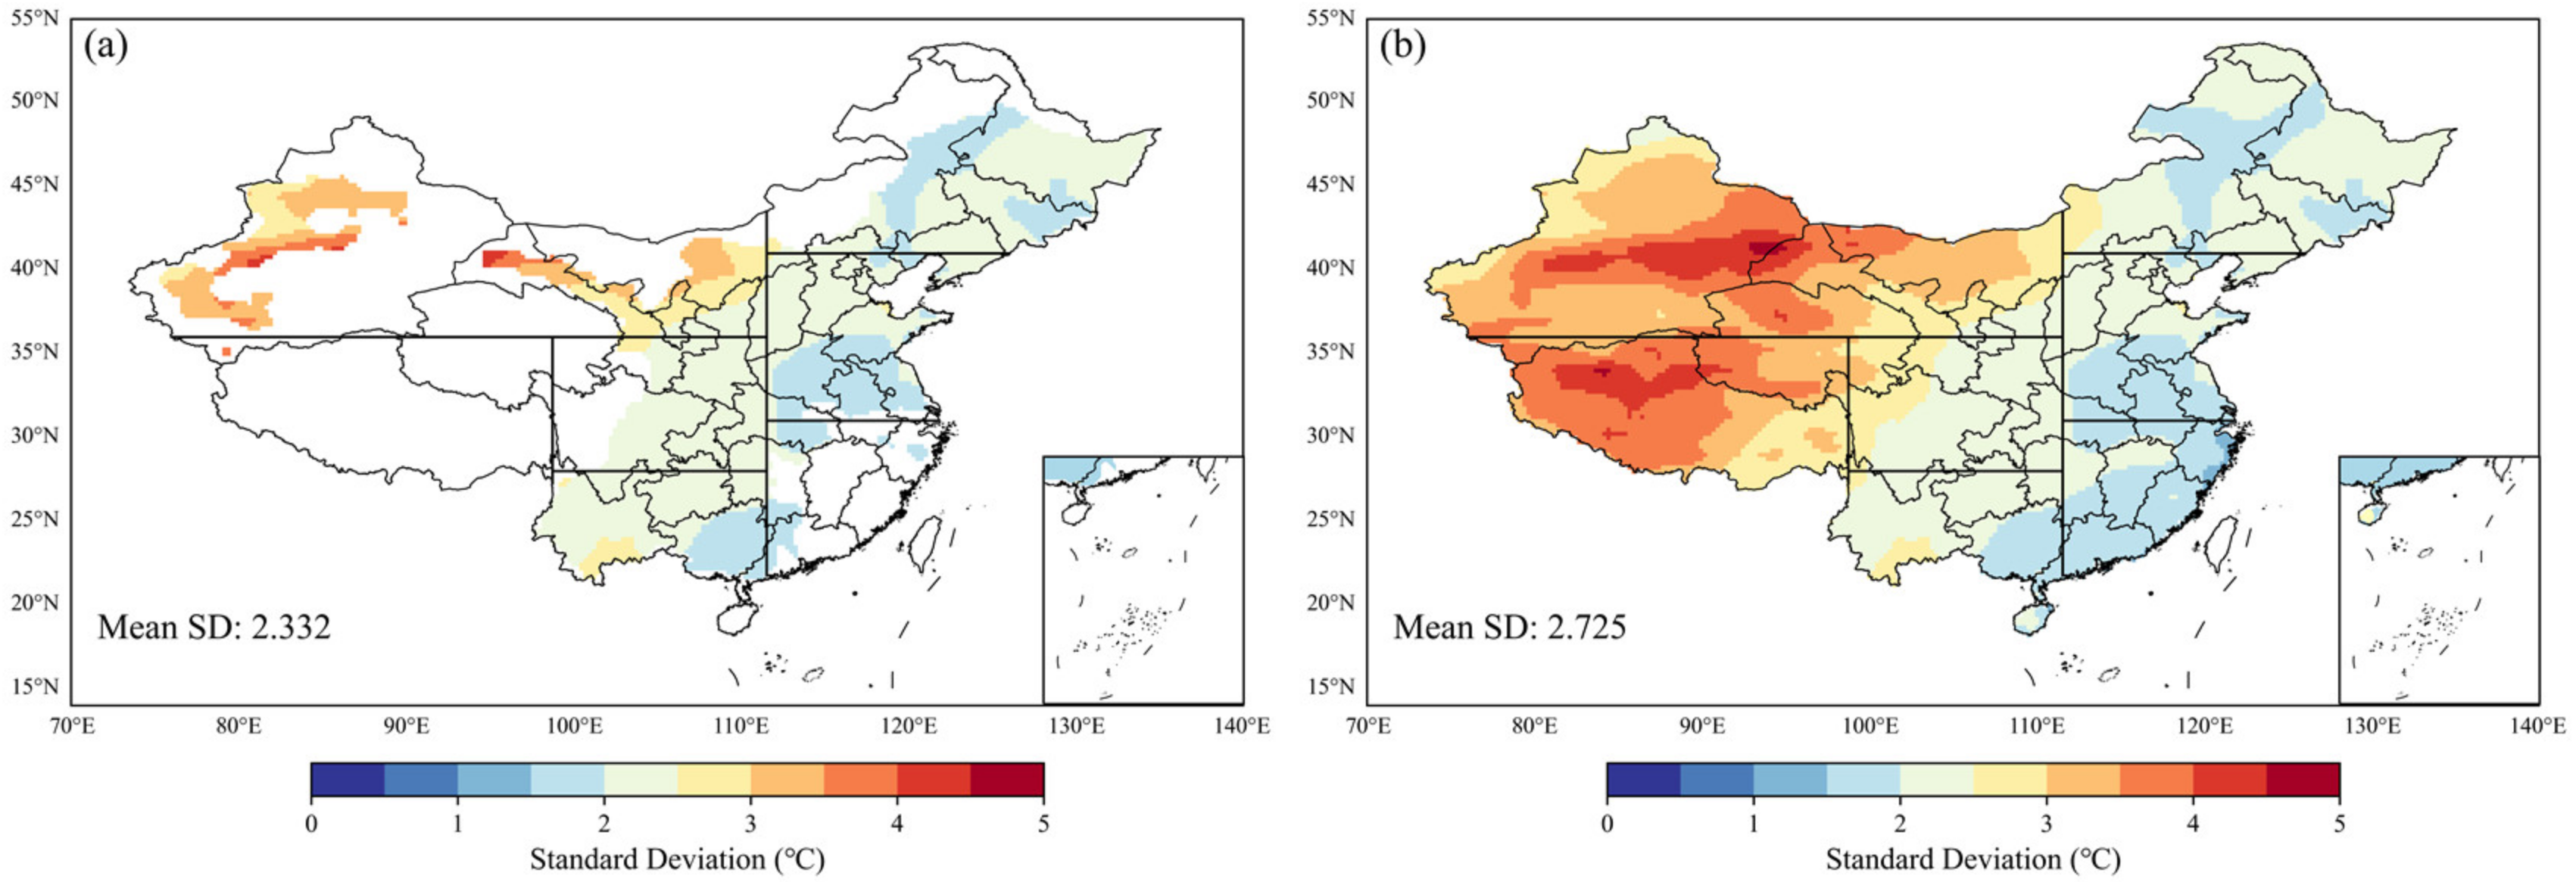
Figure 4.
The s of climatological DTR for the historical simulation in each region during 1961–2014. Green indicates the range from the 25th to 75th percentile of the s for the simulations.
Figure 4.
The s of climatological DTR for the historical simulation in each region during 1961–2014. Green indicates the range from the 25th to 75th percentile of the s for the simulations.
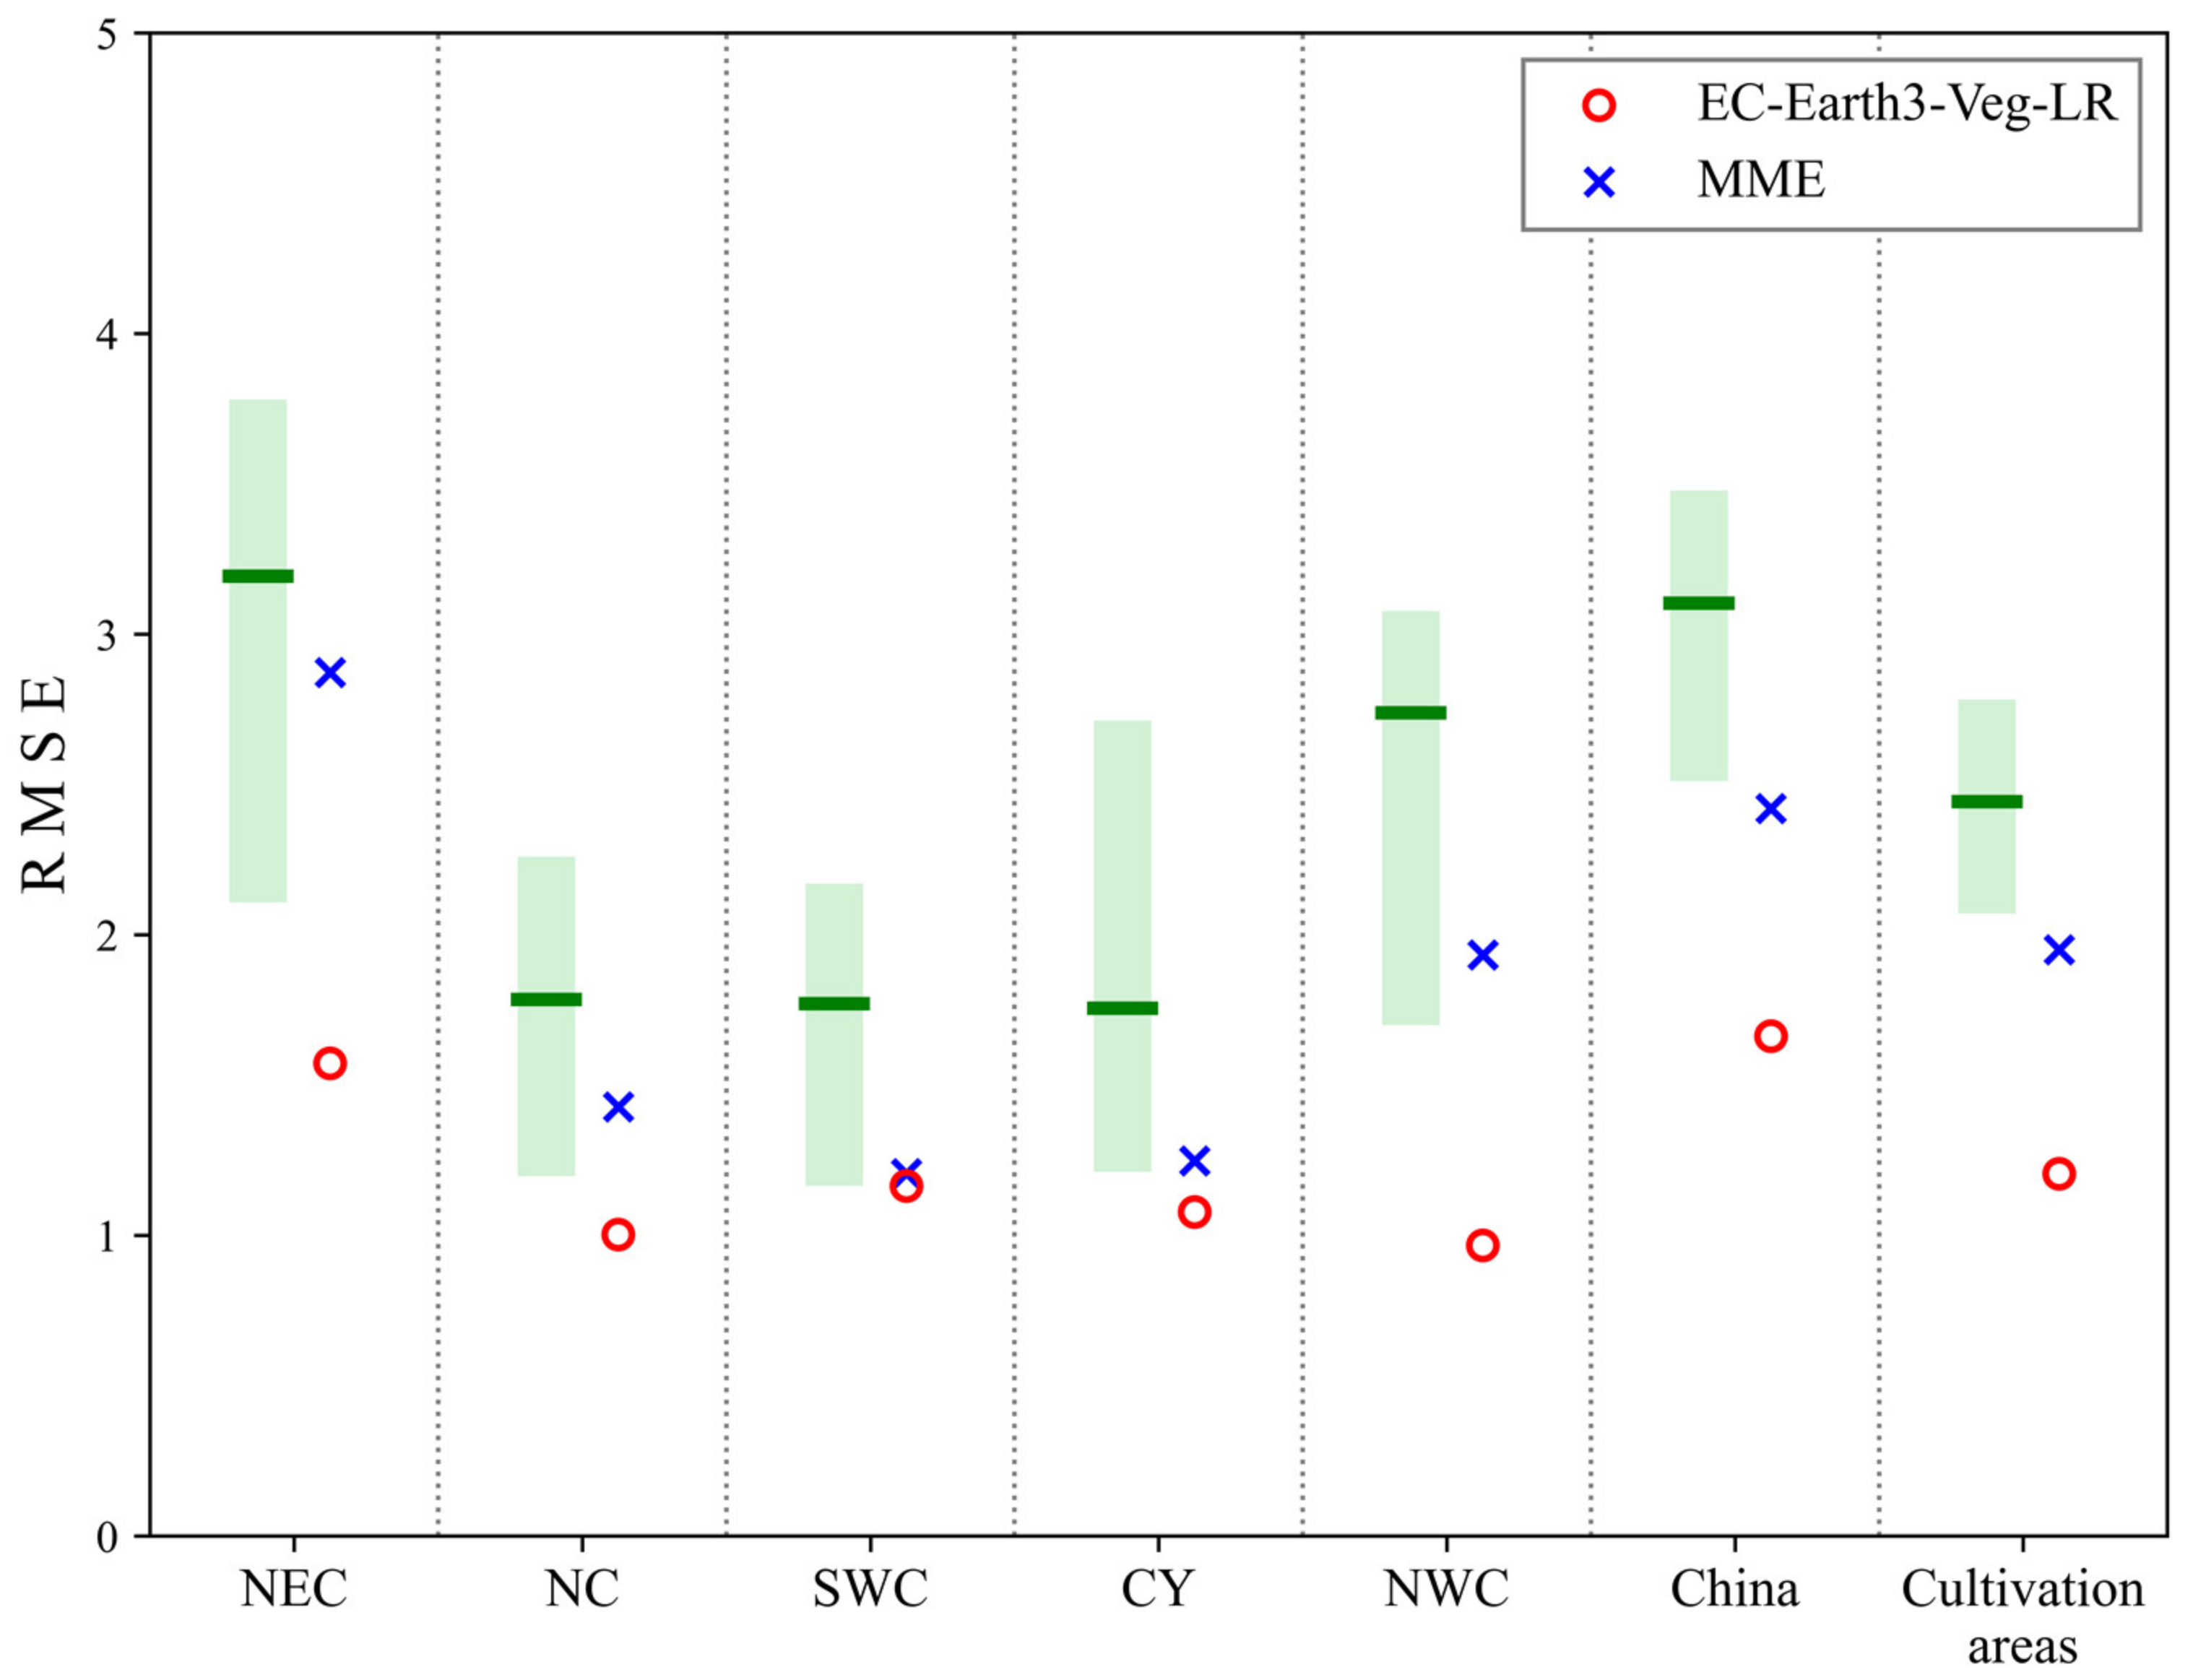
Figure 5.
Annual (a) and growing season (b) DTR anomalies simulated via CMIP6 models in maize cultivation areas show patterns of fluctuations that reflect annually varying correlations of DTR in China. Blue and red shadings indicate the range of simulations. DTR trends (c) of annual and growing season simulated using CMIP6 models and observations. Blue and red indicate the range from the 25th to 75th percentile of the trends simulated by the models. The red and blue lines are the medians of the model-simulated trends, and the gray dots are the results of the CMIP6 models. The red and green dots represent the results of CN05.1 and , respectively.
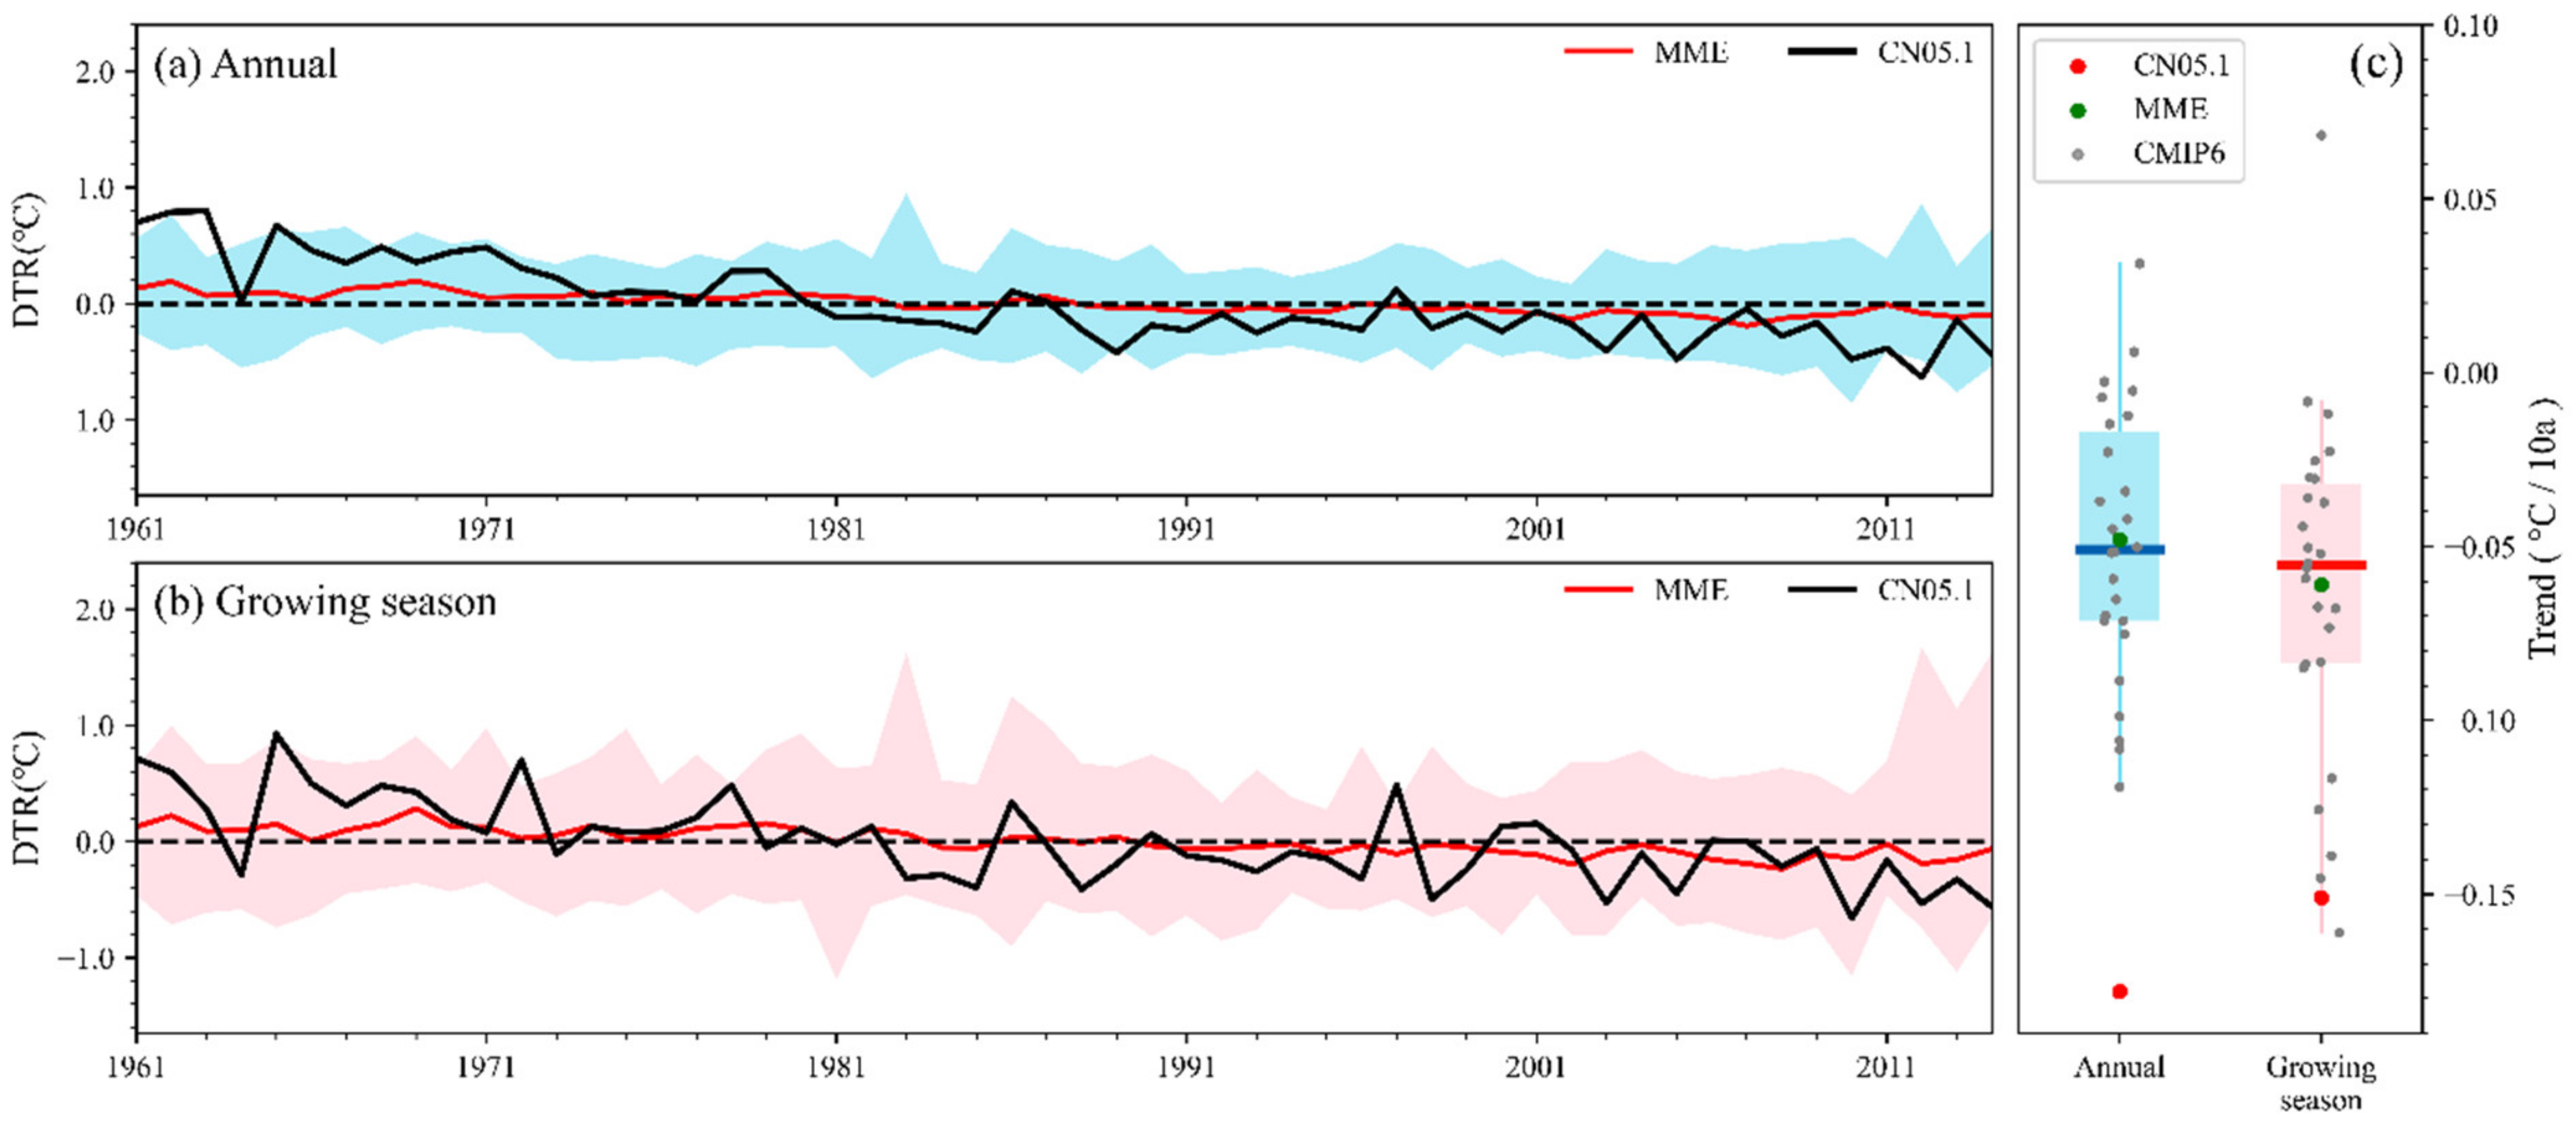
Figure 6.
The standard deviations of linearly detrended annual and yearly growing season mean anomalies of DTR for the historical simulation during 1961–2014. Blue indicates the range from the 10th to 90th percentile of the annual averages, and red indicates the maize-growing season means. Each row represents a region of China.
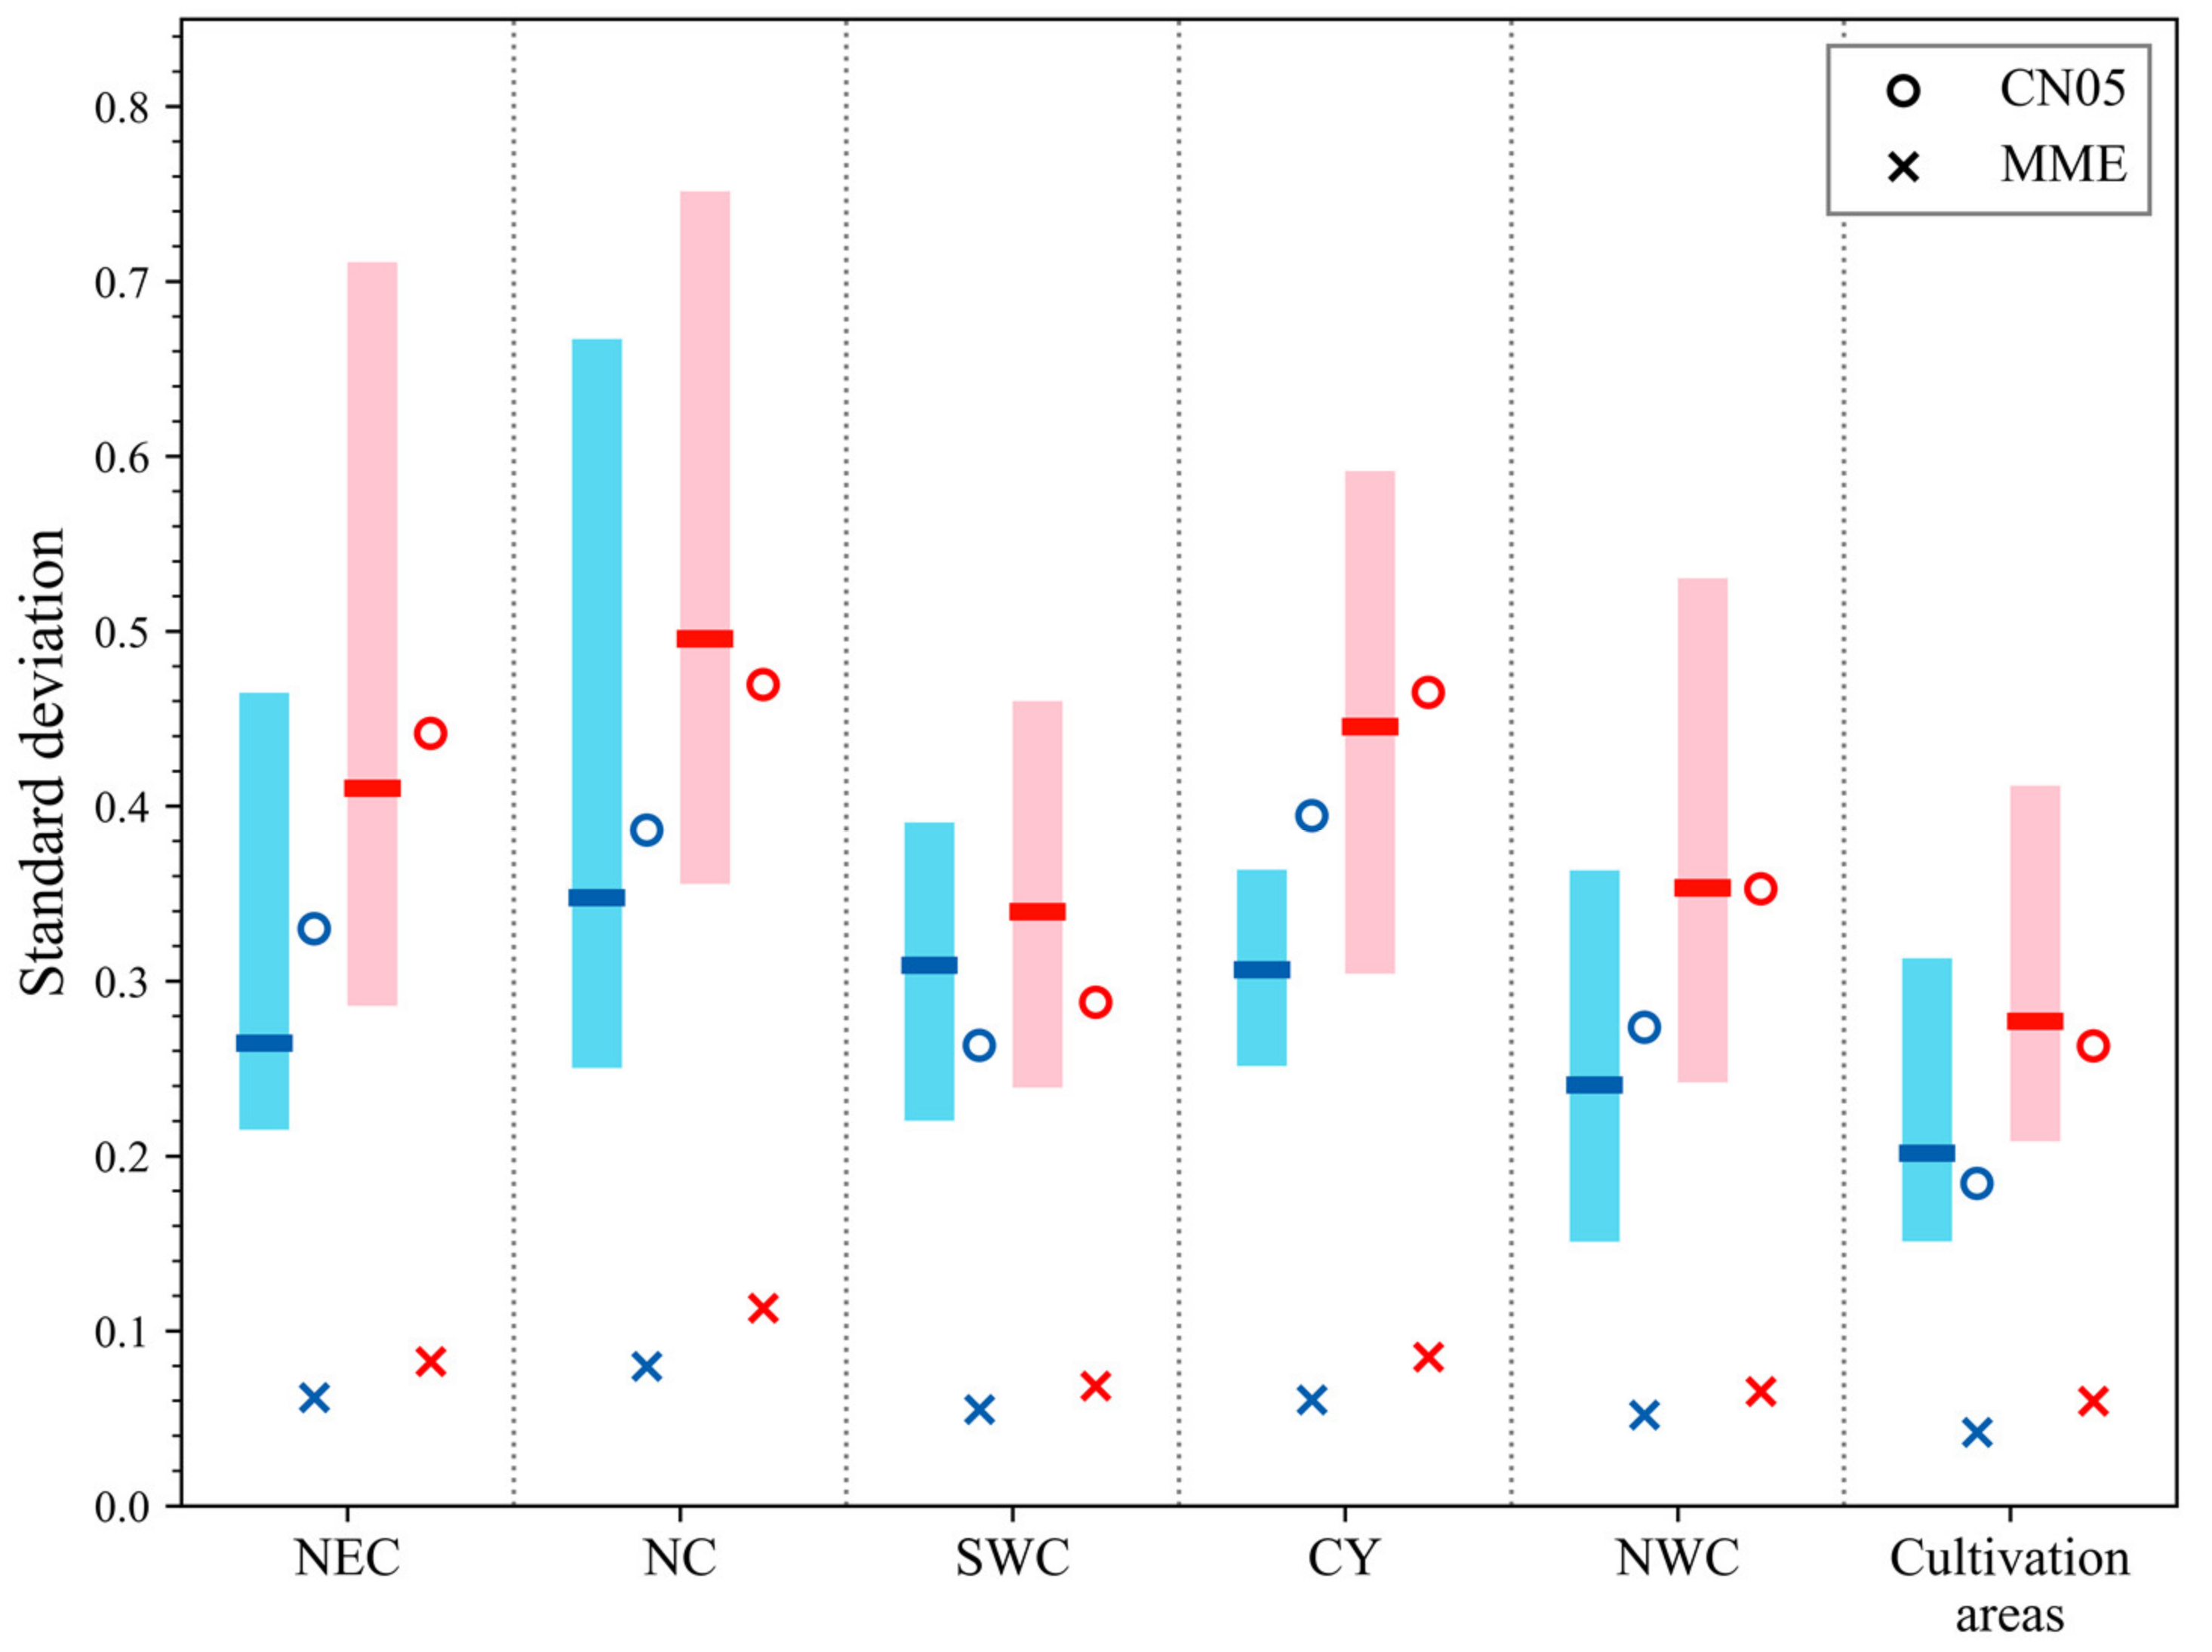
Figure 7.
The climatological DTR spatial distribution (a,c) during 2030–2050 and changes (b,d) relative to 1995–2014 in maize cultivation areas of China under different scenarios simulated via EC-Earth3-Veg-LR.
Figure 7.
The climatological DTR spatial distribution (a,c) during 2030–2050 and changes (b,d) relative to 1995–2014 in maize cultivation areas of China under different scenarios simulated via EC-Earth3-Veg-LR.
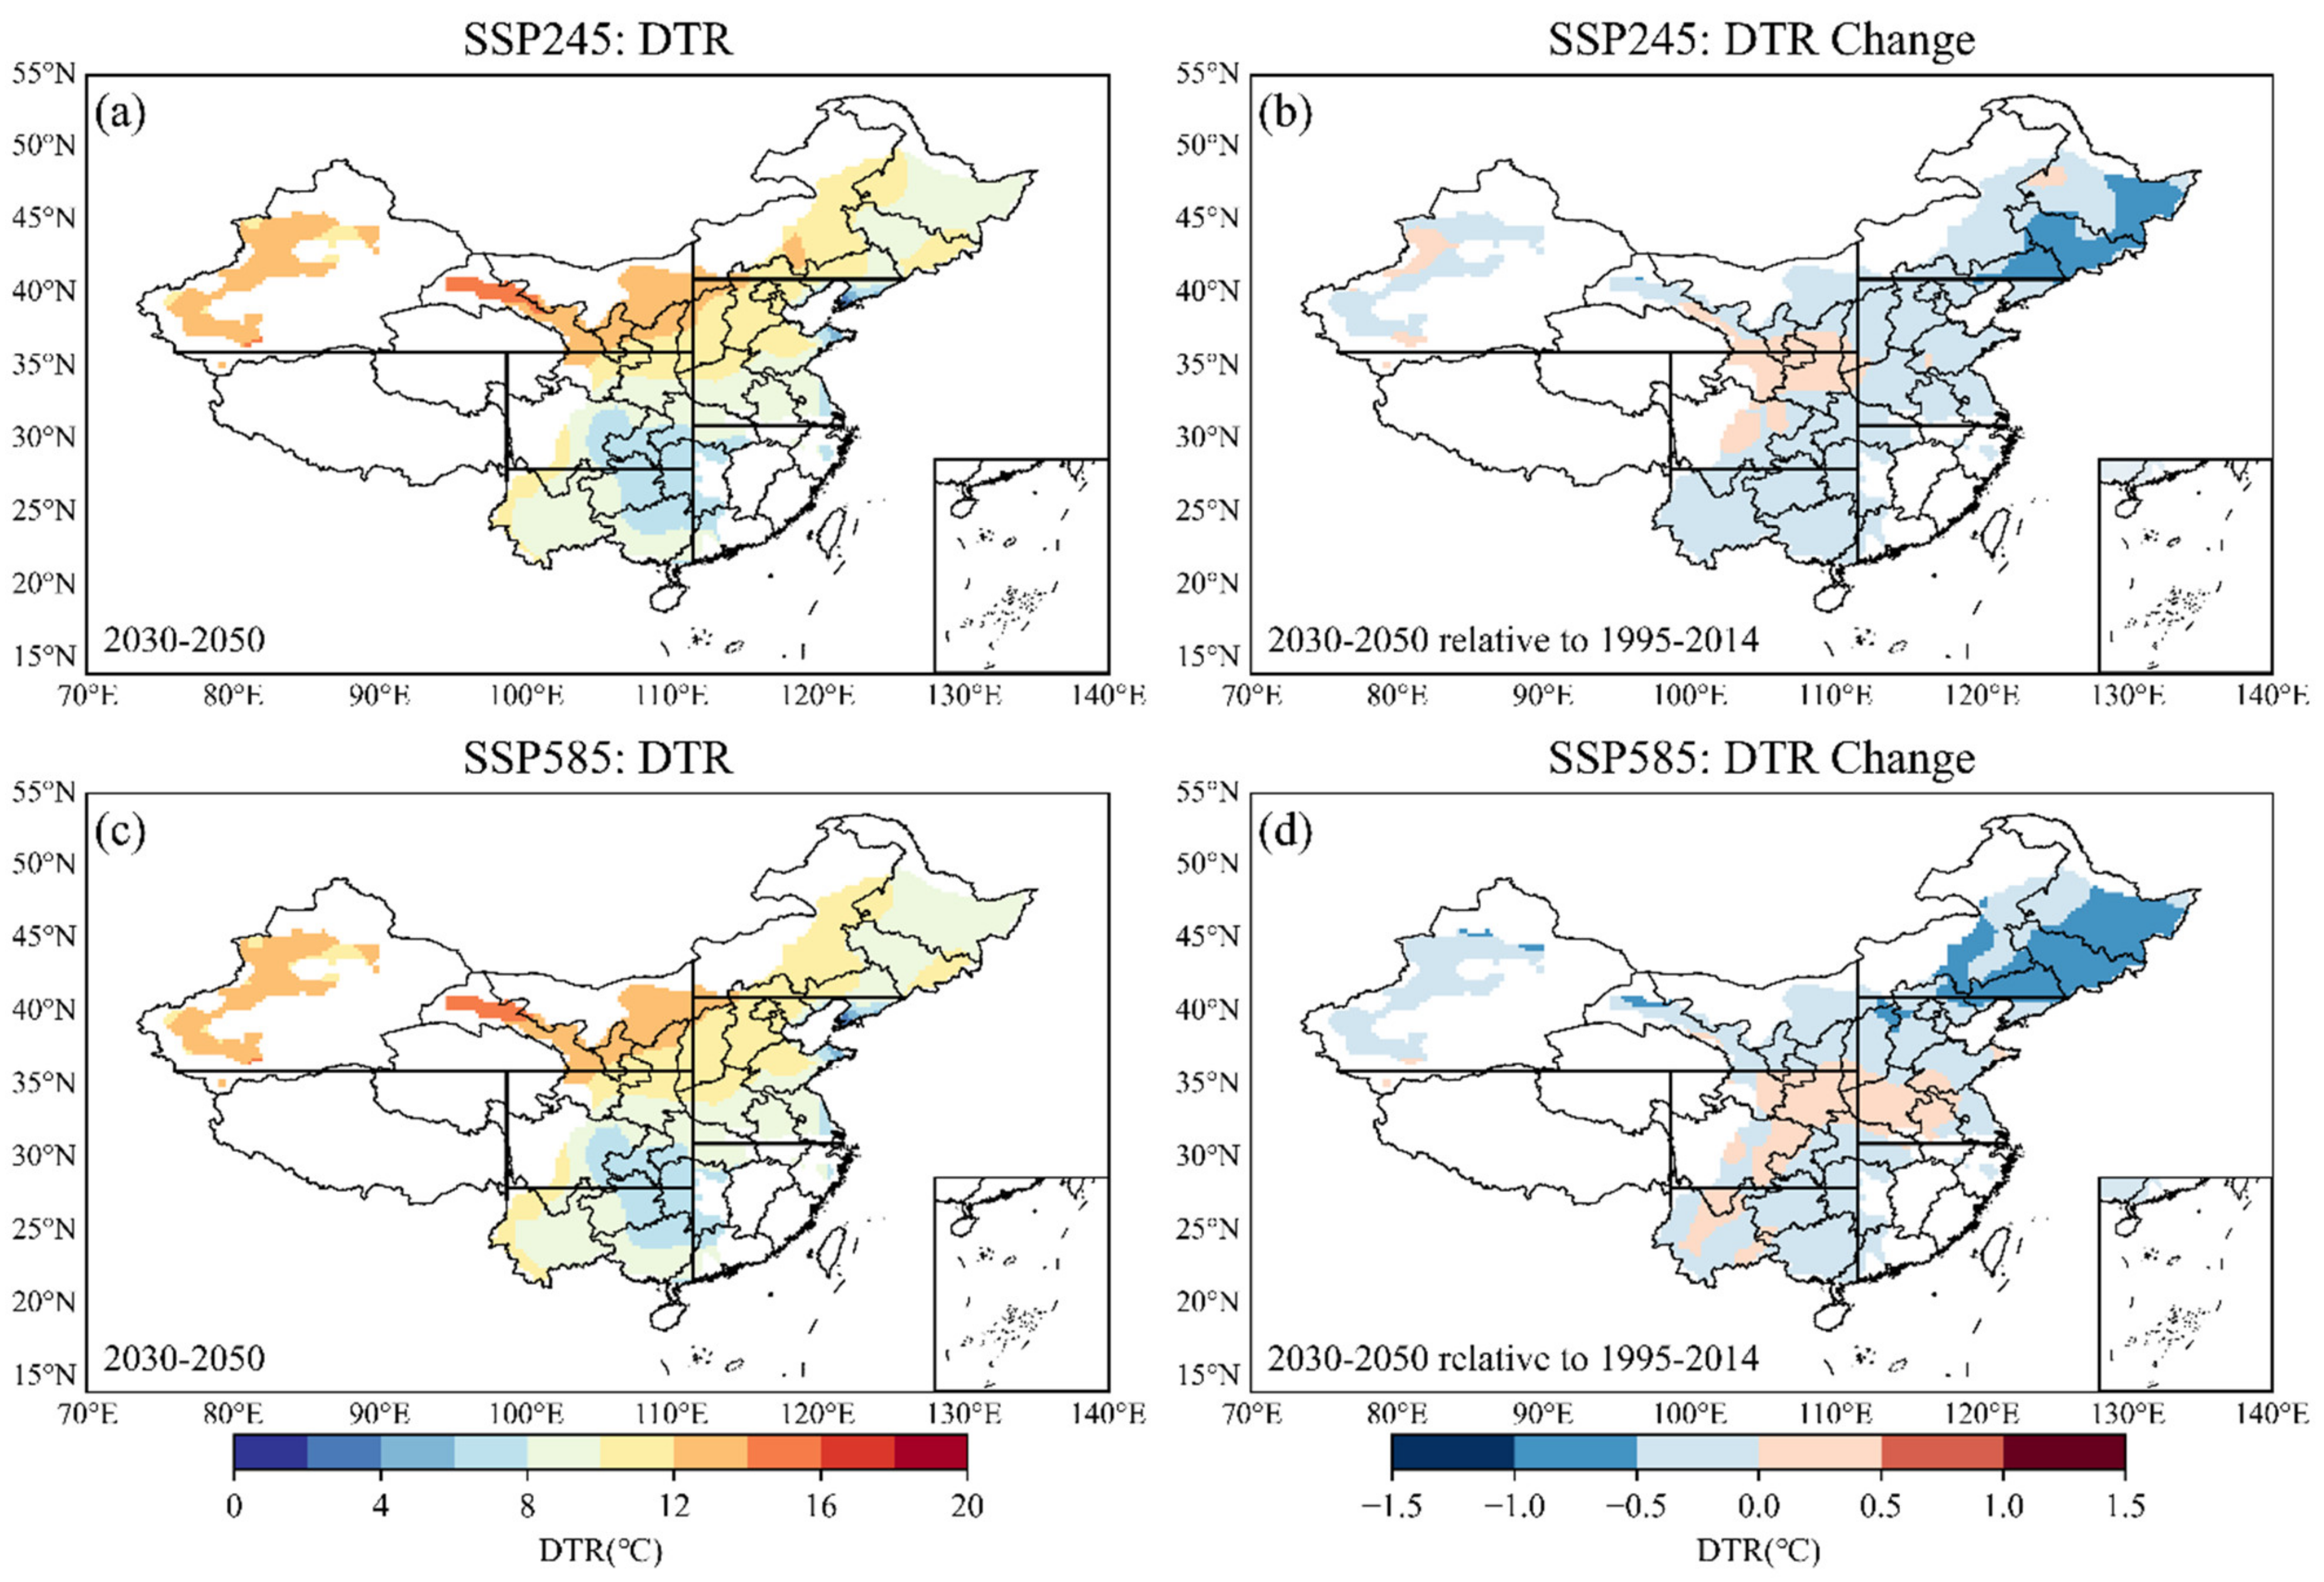
Figure 8.
Annual (a) and growing season (b) DTR anomalies under different scenarios simulated via EC-Earth3-Veg-LR in maize cultivation areas show patterns of fluctuations that reflect annually varying correlations of DTR in China.
Figure 8.
Annual (a) and growing season (b) DTR anomalies under different scenarios simulated via EC-Earth3-Veg-LR in maize cultivation areas show patterns of fluctuations that reflect annually varying correlations of DTR in China.
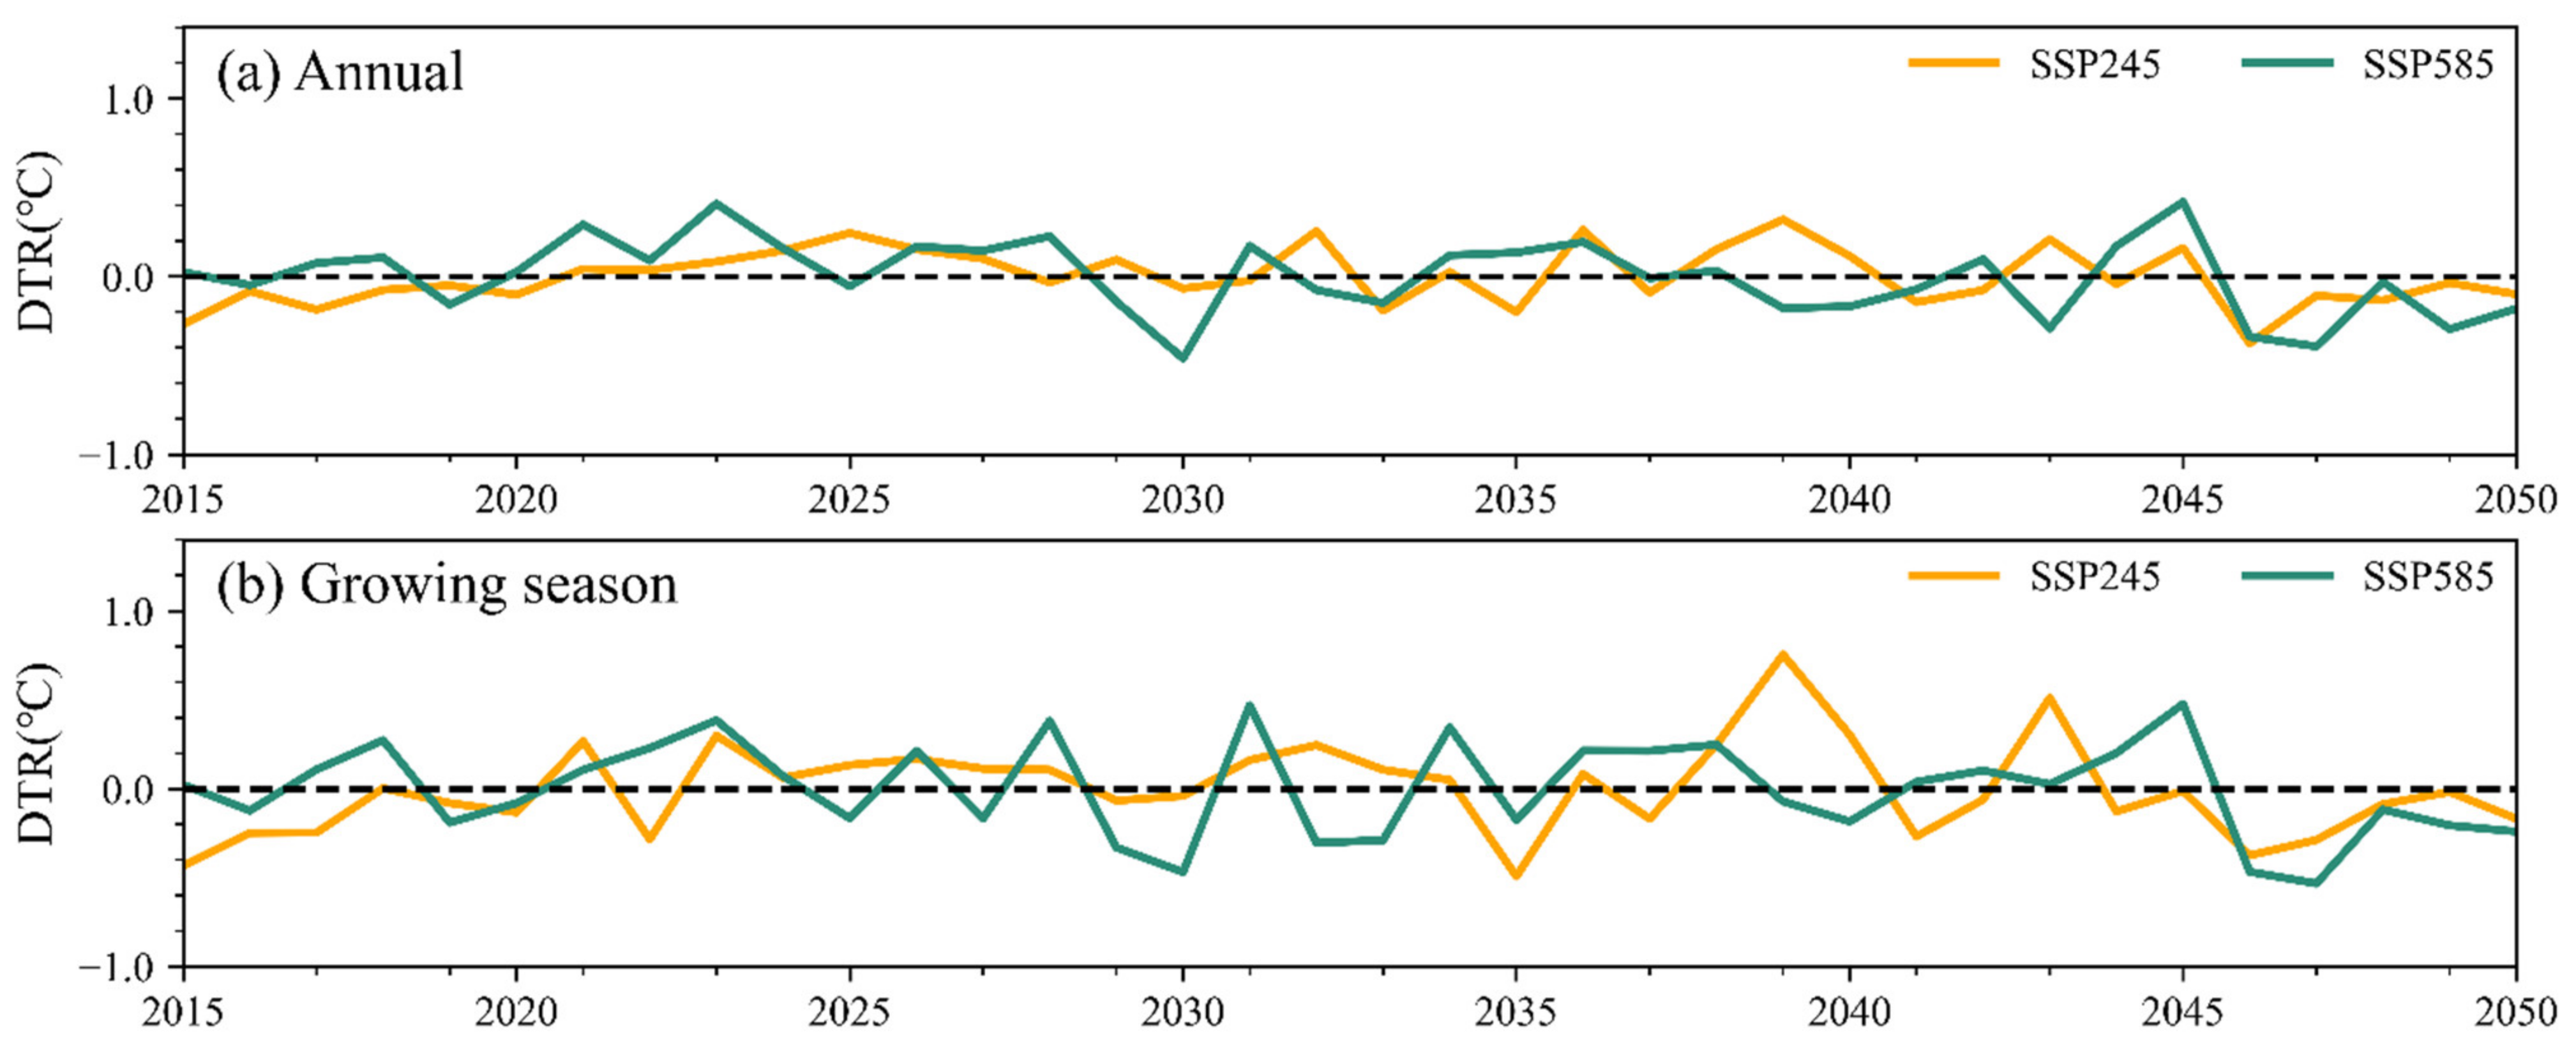
Figure 9.
Spatial distribution of linear trends (℃/10 a) of annual (a,c) and growing season (b,d) DTR during 2015–2050 in the main maize cultivation areas under different scenarios simulated via EC-Earth3-Veg-LR. The black dot indicates the grid point with the trend that was significant at p < 0.1.
Figure 9.
Spatial distribution of linear trends (℃/10 a) of annual (a,c) and growing season (b,d) DTR during 2015–2050 in the main maize cultivation areas under different scenarios simulated via EC-Earth3-Veg-LR. The black dot indicates the grid point with the trend that was significant at p < 0.1.

Table 1.
Information of CMIP6 models.
| No. | Model Name | Institution (Country) | Resolution (Lat × Lon) | Realization |
|---|---|---|---|---|
| 1 | ACCESS-CM2 | CSIRO-ARCCSS (Australia) | 1.875° × 1.25° | r1i1p1f1 |
| 2 | ACCESS-ESM1-5 | CSIRO (Australia) | 1.875° × 1.24° | r1i1p1f1 |
| 3 | AWI-CM-1-1-MR | AWI (Germany) | 0.9375° × 0.9375° | r1i1p1f1 |
| 4 | AWI-ESM-1-1-LR | AWI (Germany) | 1.875° × 1.875° | r1i1p1f1 |
| 5 | BCC-CSM2-MR | BCC (China) | 1.125° × 1.125° | r1i1p1f1 |
| 6 | BCC-ESM1 | BCC (China) | 2.8125 × 2.8125 | r1i1p1f1 |
| 7 | CanESM5 | CCCma (Canada) | 2.8125° × 2.8125° | r1i1p1f1 |
| 8 | EC-Earth3 | EC (European Community) | 0.703° × 0.703° | r1i1p1f1 |
| 9 | EC-Earth3-Veg | EC (European Community) | 0.703° × 0.703° | r1i1p1f1 |
| 10 | EC-Earth3-Veg-LR | EC (European Community) | 1.125° × 1.125° | r1i1p1f1 |
| 11 | FGOALS-f3-L | CAS (China) | 1.25° × 1.25° | r1i1p1f1 |
| 12 | FGOALS-g3 | CAS (China) | 2.0° × 2.0° | r1i1p1f1 |
| 13 | GFDL-CM4 | NOAA-GFDL (America) | 1.25° × 1.25° | r1i1p1f1 |
| 14 | GFDL-ESM4 | NOAA-GFDL (America) | 1.25° × 1.0° | r1i1p1f1 |
| 15 | GISS-E2-1-G | NASA-GISS (America) | 2.5° × 2.0° | r1i1p1f1 |
| 16 | INM-CM4-8 | INM (Russia) | 2.0° × 1.5° | r1i1p1f1 |
| 17 | INM-CM5-0 | INM (Russia) | 2.0° × 1.6° | r1i1p1f1 |
| 18 | IPSL-CM6A-LR | IPSL (France) | 2.5° × 1.25° | r1i1p1f1 |
| 19 | KIOST-ESM | KIOST (Korea) | 1.875° × 1.875° | r1i1p1f1 |
| 20 | MIROC6 | MIROC (Japan) | 1.40625° × 1.40625° | r1i1p1f1 |
| 21 | MPI-ESM-1-2-HAM | MPI-M (Germany) | 1.975° × 1.975° | r1i1p1f1 |
| 22 | MPI-ESM1-2-HR | MPI-M (Germany) | 0.9375° × 0.9376° | r1i1p1f1 |
| 23 | MPI-ESM1-2-LR | MPI-M (Germany) | 1.875° × 1.875° | r1i1p1f1 |
| 24 | MRI-ESM2-0 | MRI (Japan) | 1.125° × 1.126° | r1i1p1f1 |
| 25 | NESM3 | NUIST (China) | 1.875° × 1.875° | r1i1p1f1 |
| 26 | NorESM2-MM | NCC (Norway) | 1.25° × 0.9375° | r1i1p1f1 |
Table 2.
Scores of the top three models with the best performance.
| Index | EC-Earth3-Veg-LR | EC-Earth3 | GFDL-CM4 | |
|---|---|---|---|---|
| Climatology | RMSE | 1.098 | 1.116 | 0.865 |
| KGE | 0.818 | 0.821 | 0.455 | |
| Interannual variability | SD | 0.248 | 0.278 | 0.260 |
| KGE | 0.358 | 0.404 | 0.262 | |
| Overall | CRI | 0.865 | 0.808 | 0.808 |
Table 3.
Changes in the climatological DTR (℃) during 2030–2050 relative to 1995–2014 in regions of China under different scenarios.
Table 3.
Changes in the climatological DTR (℃) during 2030–2050 relative to 1995–2014 in regions of China under different scenarios.
| Scenario | NEC | NC | SWC | CY | NWC | Cultivation Areas |
|---|---|---|---|---|---|---|
| SSP245 | 0.382 | −0.149 | −0.223 | −0.043 | −0.094 | −0.151 |
| SSP585 | −0.556 | −0.097 | −0.092 | 0.005 | −0.212 | −0.207 |
Table 4.
The proportion of grid points with linear decreasing trends of annual and growing season DTR during 2015–2050 in different subregions of China. (“Sig. proportion” indicates the proportion of grid points that were significant at p < 0.1).
Table 4.
The proportion of grid points with linear decreasing trends of annual and growing season DTR during 2015–2050 in different subregions of China. (“Sig. proportion” indicates the proportion of grid points that were significant at p < 0.1).
| Region | NEC | NC | SWC | CY | NWC | Cultivation Areas | |
|---|---|---|---|---|---|---|---|
| SSP245 | Annual | 63.78% | 16.48% | 60.38% | 20.43% | 57.13% | 45.90% |
| Sig. proportion | 1.15% | 6.99% | 0.32% | 15.10% | 9.81% | 6.07% | |
| Growing season | 80.02% | 7.28% | 61.97% | 46.50% | 24.28% | 45.36% | |
| Sig. proportion | 3.44% | 16.70% | 0.00% | 19.55% | 27.30% | 12.92% | |
| SSP585 | Annual | 100.00% | 40.62% | 53.01% | 87.36% | 93.62% | 76.28% |
| Sig. proportion | 0.00% | 0.00% | 0.00% | 0.00% | 0.00% | 0.00% | |
| Growing season | 100.00% | 25.02% | 88.27% | 25.27% | 91.77% | 70.09% | |
| Sig. proportion | 0.00% | 23.99% | 0.00% | 1.28% | 0.00% | 4.96% |
Publisher’s Note: MDPI stays neutral with regard to jurisdictional claims in published maps and institutional affiliations. |
© 2022 by the authors. Licensee MDPI, Basel, Switzerland. This article is an open access article distributed under the terms and conditions of the Creative Commons Attribution (CC BY) license (https://creativecommons.org/licenses/by/4.0/).
Share and Cite
MDPI and ACS Style
Xie, W.; Wang, S.; Yan, X. Evaluation and Projection of Diurnal Temperature Range in Maize Cultivation Areas in China Based on CMIP6 Models. Sustainability 2022, 14, 1660. https://doi.org/10.3390/su14031660
AMA Style
Xie W, Wang S, Yan X. Evaluation and Projection of Diurnal Temperature Range in Maize Cultivation Areas in China Based on CMIP6 Models. Sustainability. 2022; 14(3):1660. https://doi.org/10.3390/su14031660
Chicago/Turabian StyleXie, Wenqiang, Shuangshuang Wang, and Xiaodong Yan. 2022. "Evaluation and Projection of Diurnal Temperature Range in Maize Cultivation Areas in China Based on CMIP6 Models" Sustainability 14, no. 3: 1660. https://doi.org/10.3390/su14031660
Note that from the first issue of 2016, this journal uses article numbers instead of page numbers. See further details here.