
Experimental Study on the Hydroponics of Wetland Plants for the Treatment of Acid Mine Drainage
by
 ,
,
Aijing Wu
1 ,
,
Yongbo Zhang
1,*,
Xuehua Zhao
1,
Jiamin Li
1,
Guowei Zhang
1,
Hong Shi
2,
Lina Guo
1 and
Shuyuan Xu
1 1
College of Water Resources Science and Engineering, Taiyuan University of Technology, Taiyuan 030024, China
2
College of Environmental Science and Engineering, Taiyuan University of Technology, Taiyuan 030024, China
*
Author to whom correspondence should be addressed.
Sustainability 2022, 14(4), 2148; https://doi.org/10.3390/su14042148
Submission received: 3 January 2022
/
Revised: 23 January 2022
/
Accepted: 11 February 2022
/
Published: 14 February 2022
(This article belongs to the Topic Mining Safety and Sustainability)
Abstract
:Acid Mine Drainage (AMD) has become an important issue due to its significant ecological pollution. In this paper, phytoremediation technology and mechanism for AMD were investigated by hydroponic experiments, using six wetland plants (Phragmites australis, Typha orientalis, Cyperus glomeratus, Scirpus validus, Iris wilsonii, Juncus effusus) as research objects. The results showed that (1) the removal of sulfate from AMD was highest for Juncus effusus (66.78%) and Iris wilsonii (40.74%) and the removal of Mn from AMD was highest for Typha orientalis (>99%) and Phragmites australis (>99%). In addition, considering the growth condition of the plants, Juncus effusus, Iris wilsonii, and Phragmites australis were finally selected as the dominant plants for the treatment of AMD. (2) The removal pathway of pollutants in AMD included two aspects: one part was absorbed by plants, and the other part was removed through hydrolysis and precipitation processes. Our findings provide a theoretical reference for phytoremediation technology for AMD.
1. Introduction
Acid mine drainage (AMD) is formed when sulfide minerals are exposed to oxidizing conditions after mining and other excavation processes [1,2]. As AMD is highly acidic and contains a large number of heavy metals, sulfates, and other pollutants [3,4], when it is discharged to the ground, it will cause great pollution to the surrounding water bodies and soil, lower the pH value of surface water, inhibit the growth and reproduction of aquatic organisms, destroy the granular structure of the soil, make the soil caked, salinized, barren, which will lead to the withering and death of crops [5]. In addition, the contaminants in AMD can pose a risk to human health through the food chain [6,7]. Previous studies have shown that AMD has become a long-term source of pollution, as it can continue to be generated for hundreds of years even after mining activities have ceased [8,9]. Therefore, there is an urgent need to investigate economical and efficient treatment technologies to minimize the negative impacts of AMD in response to its serious pollution problem.
Various techniques which cut across physical, chemical, and biological processes have been used to remediate water, air, and soil contaminated by AMD. Traditionally, AMD has been treated by adding calcium carbonate, lime, hydrated lime, caustic soda, and soda ash to AMD to neutralize the acidity [10]. However, it was found that 107–640 g of limestone is required to neutralize 1 L of AMD, making the application of neutralization quite expensive and unsafe when treating large amounts of AMD produced in coal mines [11]. The use of constructed wetlands (CWs) for AMD treatment is a rapidly developing passive treatment technology that focuses mainly on metal and sulfate removal [12,13]. CW is a substrate-microbial-plant composite ecosystem with physical, chemical, and biological triple synergy [14], which is an economic, efficient, and environment-friendly AMD remediation technology.
Wetland plants are an important part of CWs, which can not only remove pollutants from water bodies, accelerate the recycling and reuse of nutrients, but also maintain and beautify the wetland environment, improve the regional climate and promote a virtuous cycle of the ecological environment [15,16]. Since the selection of wetland plants has a significant impact on pollutant removal efficiency, the ability to release oxygen, and the species and number of microorganisms in the wetland substrate [17], cultivating or selecting plants that meet the treatment requirements can enhance the purification capacity of CWs and achieve long-term stable operation of CWs.
Currently, phytoremediation technology for the treatment of heavy metals has been studied more extensively, including studies on the removal effect and removal mechanism of heavy metals by plants and the tolerance mechanism of plants to heavy metals. For example, Oyuela Leguizamo, et al. [18] studied the behavior of 41 native or endemic species towards heavy metal pollution and screened the plants of the dominant family in the process of heavy metal enrichment. Muthusaravanan, et al. [19] reviewed the methods, mechanisms, and enhancement processes of phytoremediation of heavy metals. Han, et al. [20] investigated the Pb tolerant mechanisms, plant physiological response, and Pb sub-cellular localization in the root cells of Iris halophila. Although relatively mature research results have been achieved in the phytoremediation technology of heavy metals, however, little research has been done on the phytoremediation technology of sulfate. Thus, the study of the mechanism of sulfate removal from AMD by wetland plants in this paper is necessary.
In this study, six acid-tolerant wetland plants commonly found in China were used as research objects. Using hydroponic experiments, the growth status of six plants under different concentrations of AMD stress, the removal effects of six plants on pollutants in AMD and the accumulation of pollutants in plants were studied, and the removal mechanism of pollutants in AMD was analyzed, while the optimal wetland plants suitable for treating AMD were screened, which provided a reference basis for the construction of CWs at a later stage.
2. Materials and Methods
2.1. Synthetic AMD Composition
The chemical composition of AMD varies from site to site. In this study, the AMD was formulated manually based on the types and concentrations of the main pollutant ions in the AMD outflow from the Shandi River basin (38°1′32″ N, 113°31′37″ E) in Yangquan City, Shanxi Province, China. Since the constructed wetland investigated in this study was, actually, the final step of the AMD treatment technology, and the first stage was via permeable reaction barriers (PRB) when Fe was well removed, while Mn, Zn, and Cd were not [21], Fe was not considered in this study. Measured amounts of Na2SO4, MnCl2, Zn(NO3)2, and Cd(NO3)2 powders were added in distillate water to produce three sulfate concentrations of AMD shown in Table 1. Under acidic conditions, metals exist mainly in dissolved forms.
2.2. Wetland Plants
Phragmites australis (P. australis), Typha orientalis (T. orientalis), Cyperus glomeratus (C. glomeratus), Scirpus validus (S. validus), Iris wilsonii (I. wilsonii), Juncus effusus (J. effusus) were purchased from Anxin County, Baoding City, Hebei Province, China. As shown in Table 2, these six plants are all common acid-tolerant perennial wetland plants in China, which have some economic value and can therefore reduce the maintenance costs of CW systems.
2.3. Experimental Operation
Each of the six weighed plants was put into a measuring cup (150 g of each plant in each cup) with a capacity of 2 L, and then 1 L of experimental water was added to each measuring cup. There were four groups of experimental water (Table 3), including the control group with no contaminants and the AMD treatment group with three sulfate concentrations (low, medium, and high). The water level at this point was marked as the initial water level. Then, 5 mL of 1/5 strength Hoagland solution [23] was added to the measuring cup each day, and then distilled water was added to bring the water level to the initial level (water was consumed due to evaporation and plant transpiration). The experiment was carried out for 60 days.
2.4. Water Sample Analysis
The water samples were measured and analyzed for each indicator every 10 days. The pH value was measured using a pH meter (PHS-3C, Rex, Shanghai, China), while Ec was measured using a digital conductivity meter (DDS-307A, Rex). Concentrations of metals were determined by flame (acetylene) ionization using an atomic absorption spectrophotometer (TAS-990, Persee, Beijing, China) after sample filtration with 0.45 μm filter, and the concentration of SO42– in the water samples was determined by ion chromatography (883 Basic IC plus, Metrohm, Shanghai, China). All represented data are the average of three replicate values. The removal efficiency of pollutants (SO42−, Mn, Zn, Cd) was calculated (Equation (1)):
where Ci and Ce represent the initial water and effluent pollutants concentrations, respectively.
2.5. Plant and Water Sediment Analysis
After the experiment, the plants were rinsed repeatedly with tap water and then with distilled water to remove surface impurities. The plants were dried in an oven at 8 °C for 24 h and weighed for dry biomass. The dried plants were ground to fine powder with a grinder and then one gram of the powder was digested using a tri-acid mixture (HNO3, HClO4, and H2SO4; 5:1:1) at 80 °C until the solution became clear. The obtained solution was filtered and its contaminant content was determined using the method of water sample analysis in the previous section.
The bioconcentration factor (BCF) is defined as the ratio of total metal content in plant tissues (Cp, mg·kg–1) to total metal content in the surrounding environment (Cw, mg·L–1). It is given by Equation (2) [24]:
The experimental water was filtered at the end of the experiment and the precipitates were collected from the filter paper. The mineral composition of the precipitates was determined by X-ray diffraction (XRD) (Bruker D8-Advance X-ray polycrystalline powder diffractometer, Germany). XRD spectra were recorded over an angular range of 10–90° with Cu Kα anode (wavelength = 0.154 nm, 40 mA, 40 kV) with a step size of 0.01°.
2.6. Statistical Analysis
A one-way ANOVA was performed to identify significant differences among treatments, and, when detected, a post hoc Duncan’s Multiple Range Test was performed using the SPSS 26.0 statistical software. Differences between the two treatments were analyzed using a t-test (SPSS 26.0). The differences were considered significant when p < 0.05.
3. Results and Discussion
3.1. The Growth State of Plants
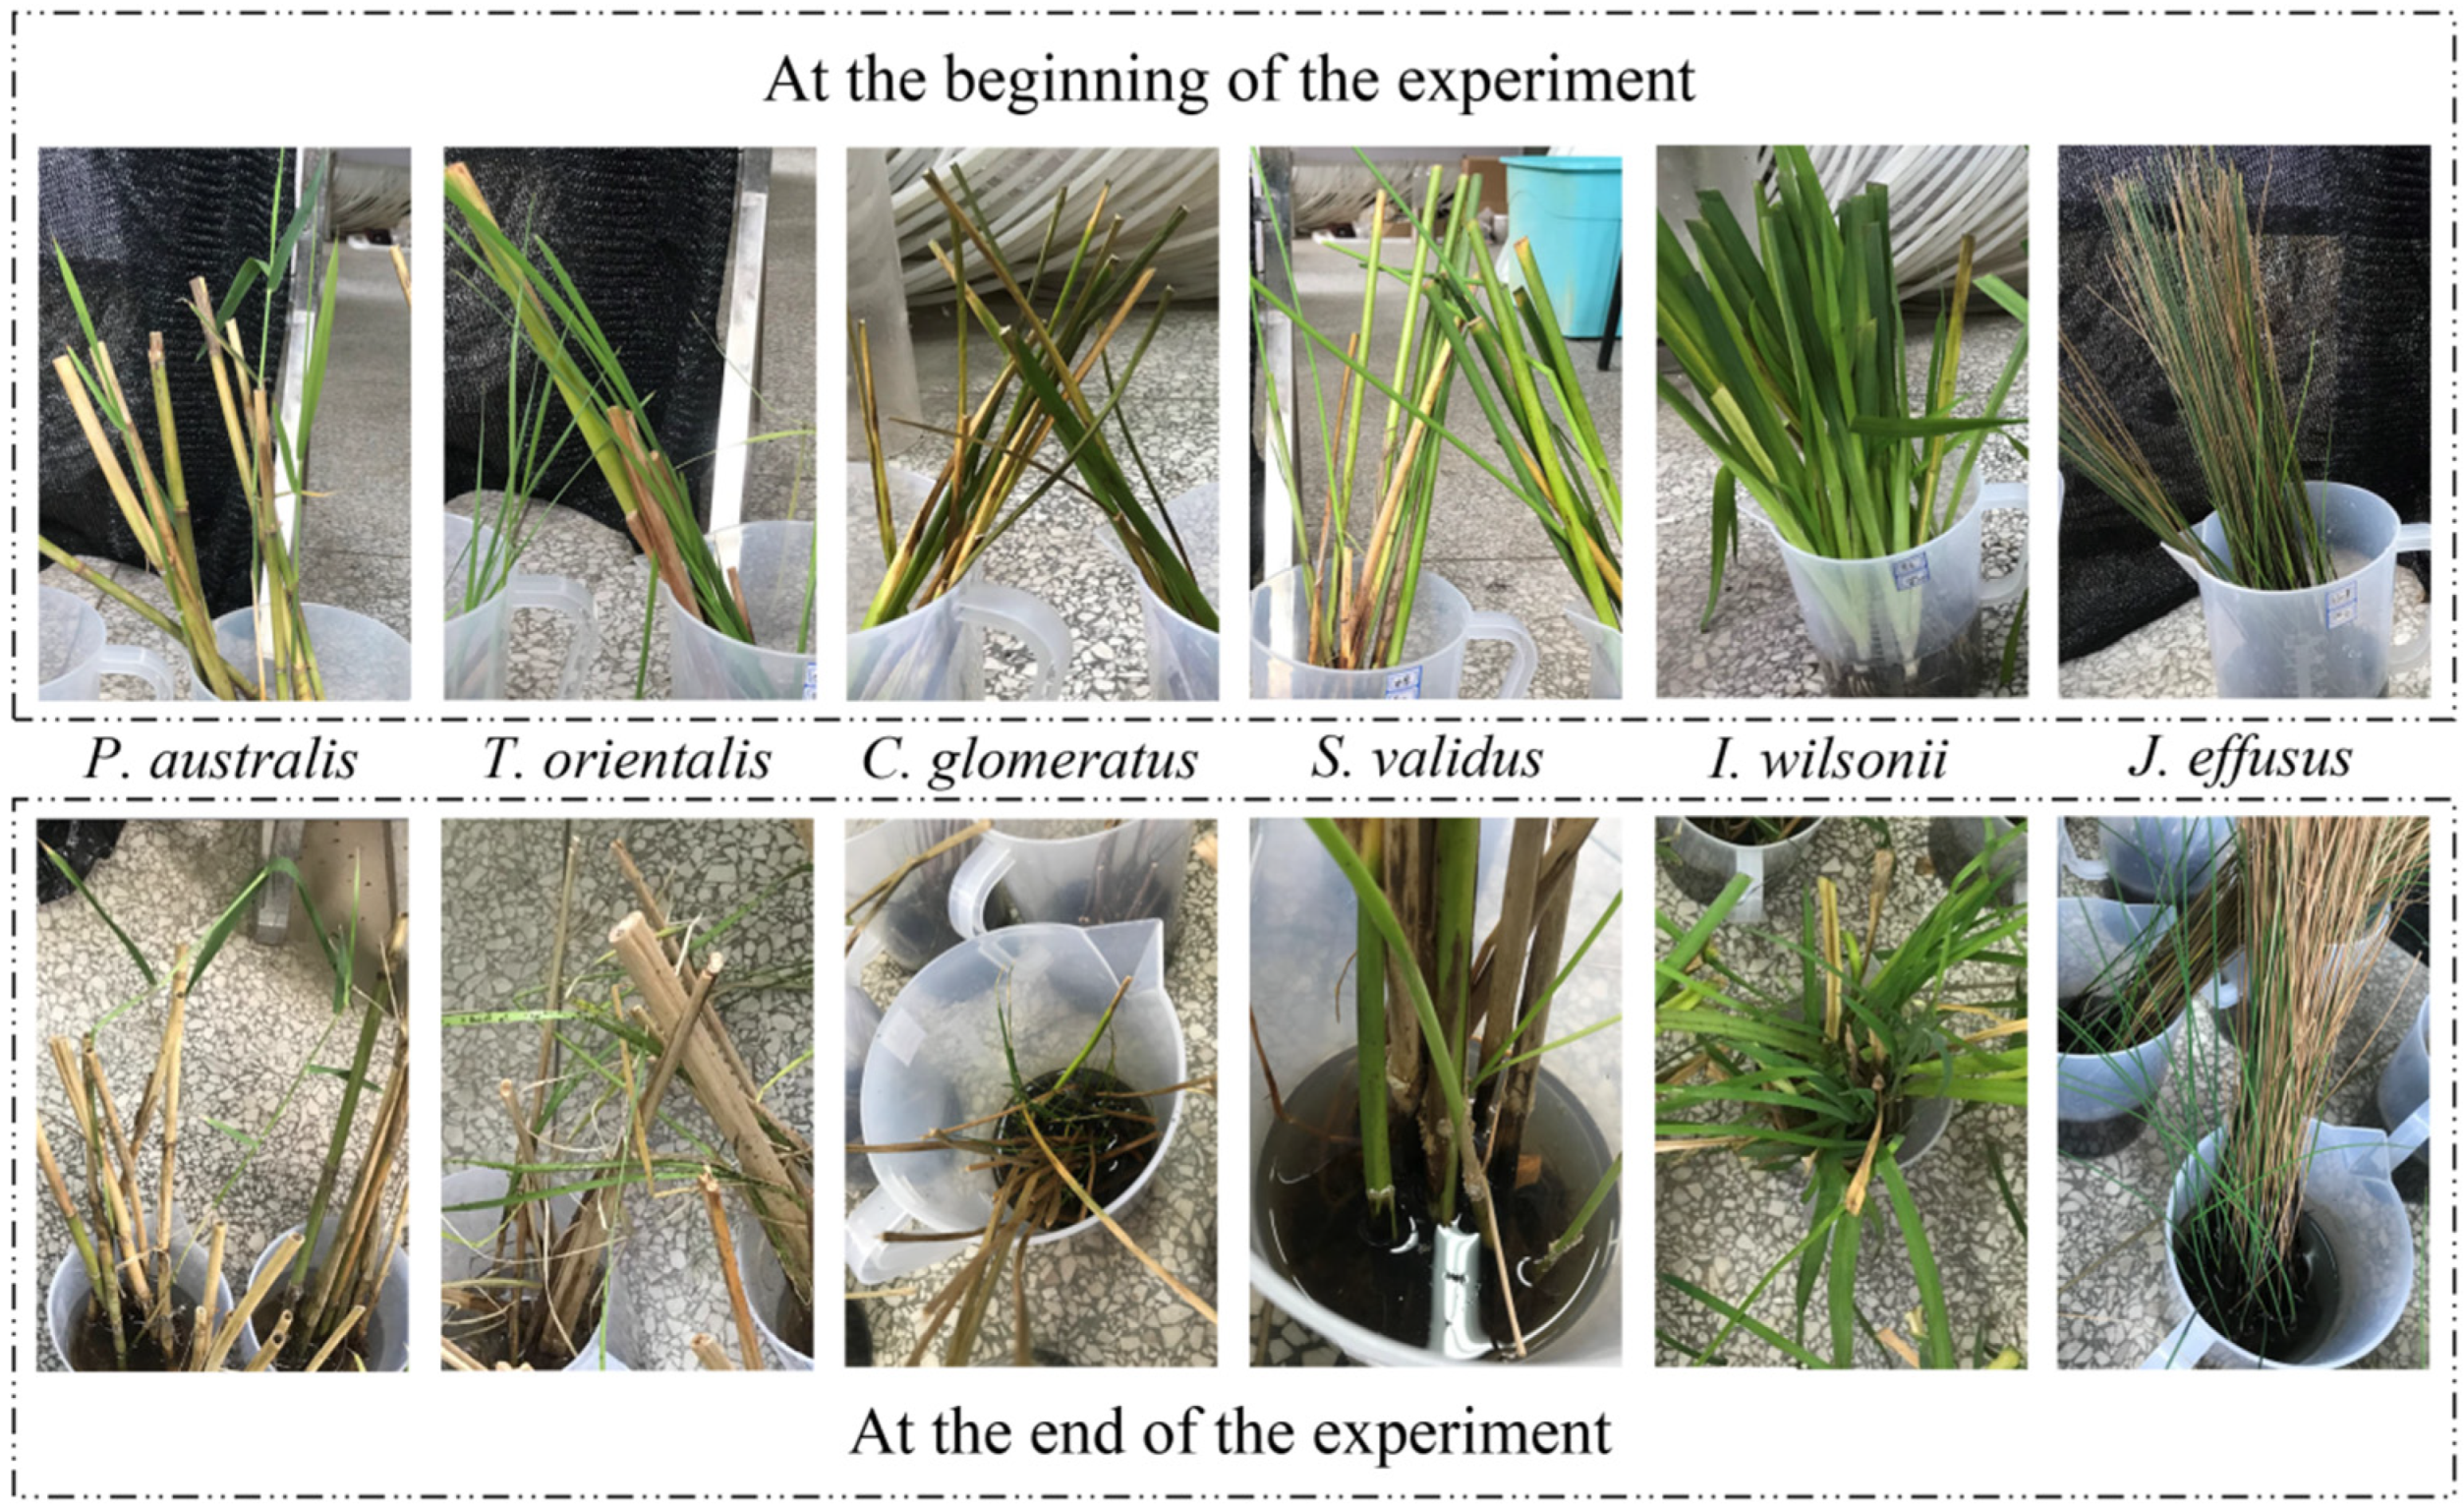
Figure 1 shows the comparison of the growth status of the six plants before and after the experiment. It could be seen that the plants grew well at the beginning of the experiment, however, the growth status of the six plants showed a large difference after 60 days. which was partly due to the impact of AMD and partly due to the addition of sodium in the configuration of AMD, and the high concentration of sodium would cause a series of osmotic and metabolic problems to the plants thus inhibiting their growth [25,26]. In this paper, the growth status of six plants at the end of the experiment was evaluated based on four indicators (Table 4): the number of new shoots, the state of old branches, the phenomenon of roots rotted, and pest infestation.
The growth of J. effusus and P. australis was in good condition due to the high number of new shoots of J. effusus and the good condition of old shoots of P. australis, and both were free from the phenomenon of roots rotted and pest infestation. I. wilsonii and C. glomeratus both passed two indicators; however, observation of Figure 1 shows that although C. glomeratus had more new shoots, its overall growth status was not as good as I. wilsonii due to its thinner branches and poor condition of old branches. The growth status of T. orientalis and S. validus was poor and both were infected with pests during the experiment, which were found to be difficult to eradicate after many repellent measures. Therefore, based on the overall growth of the plants under AMD stress, the plants with better growth were selected as J. effusus, P. australis and I. wilsonii.
3.2. Removal of Contaminants in AMD
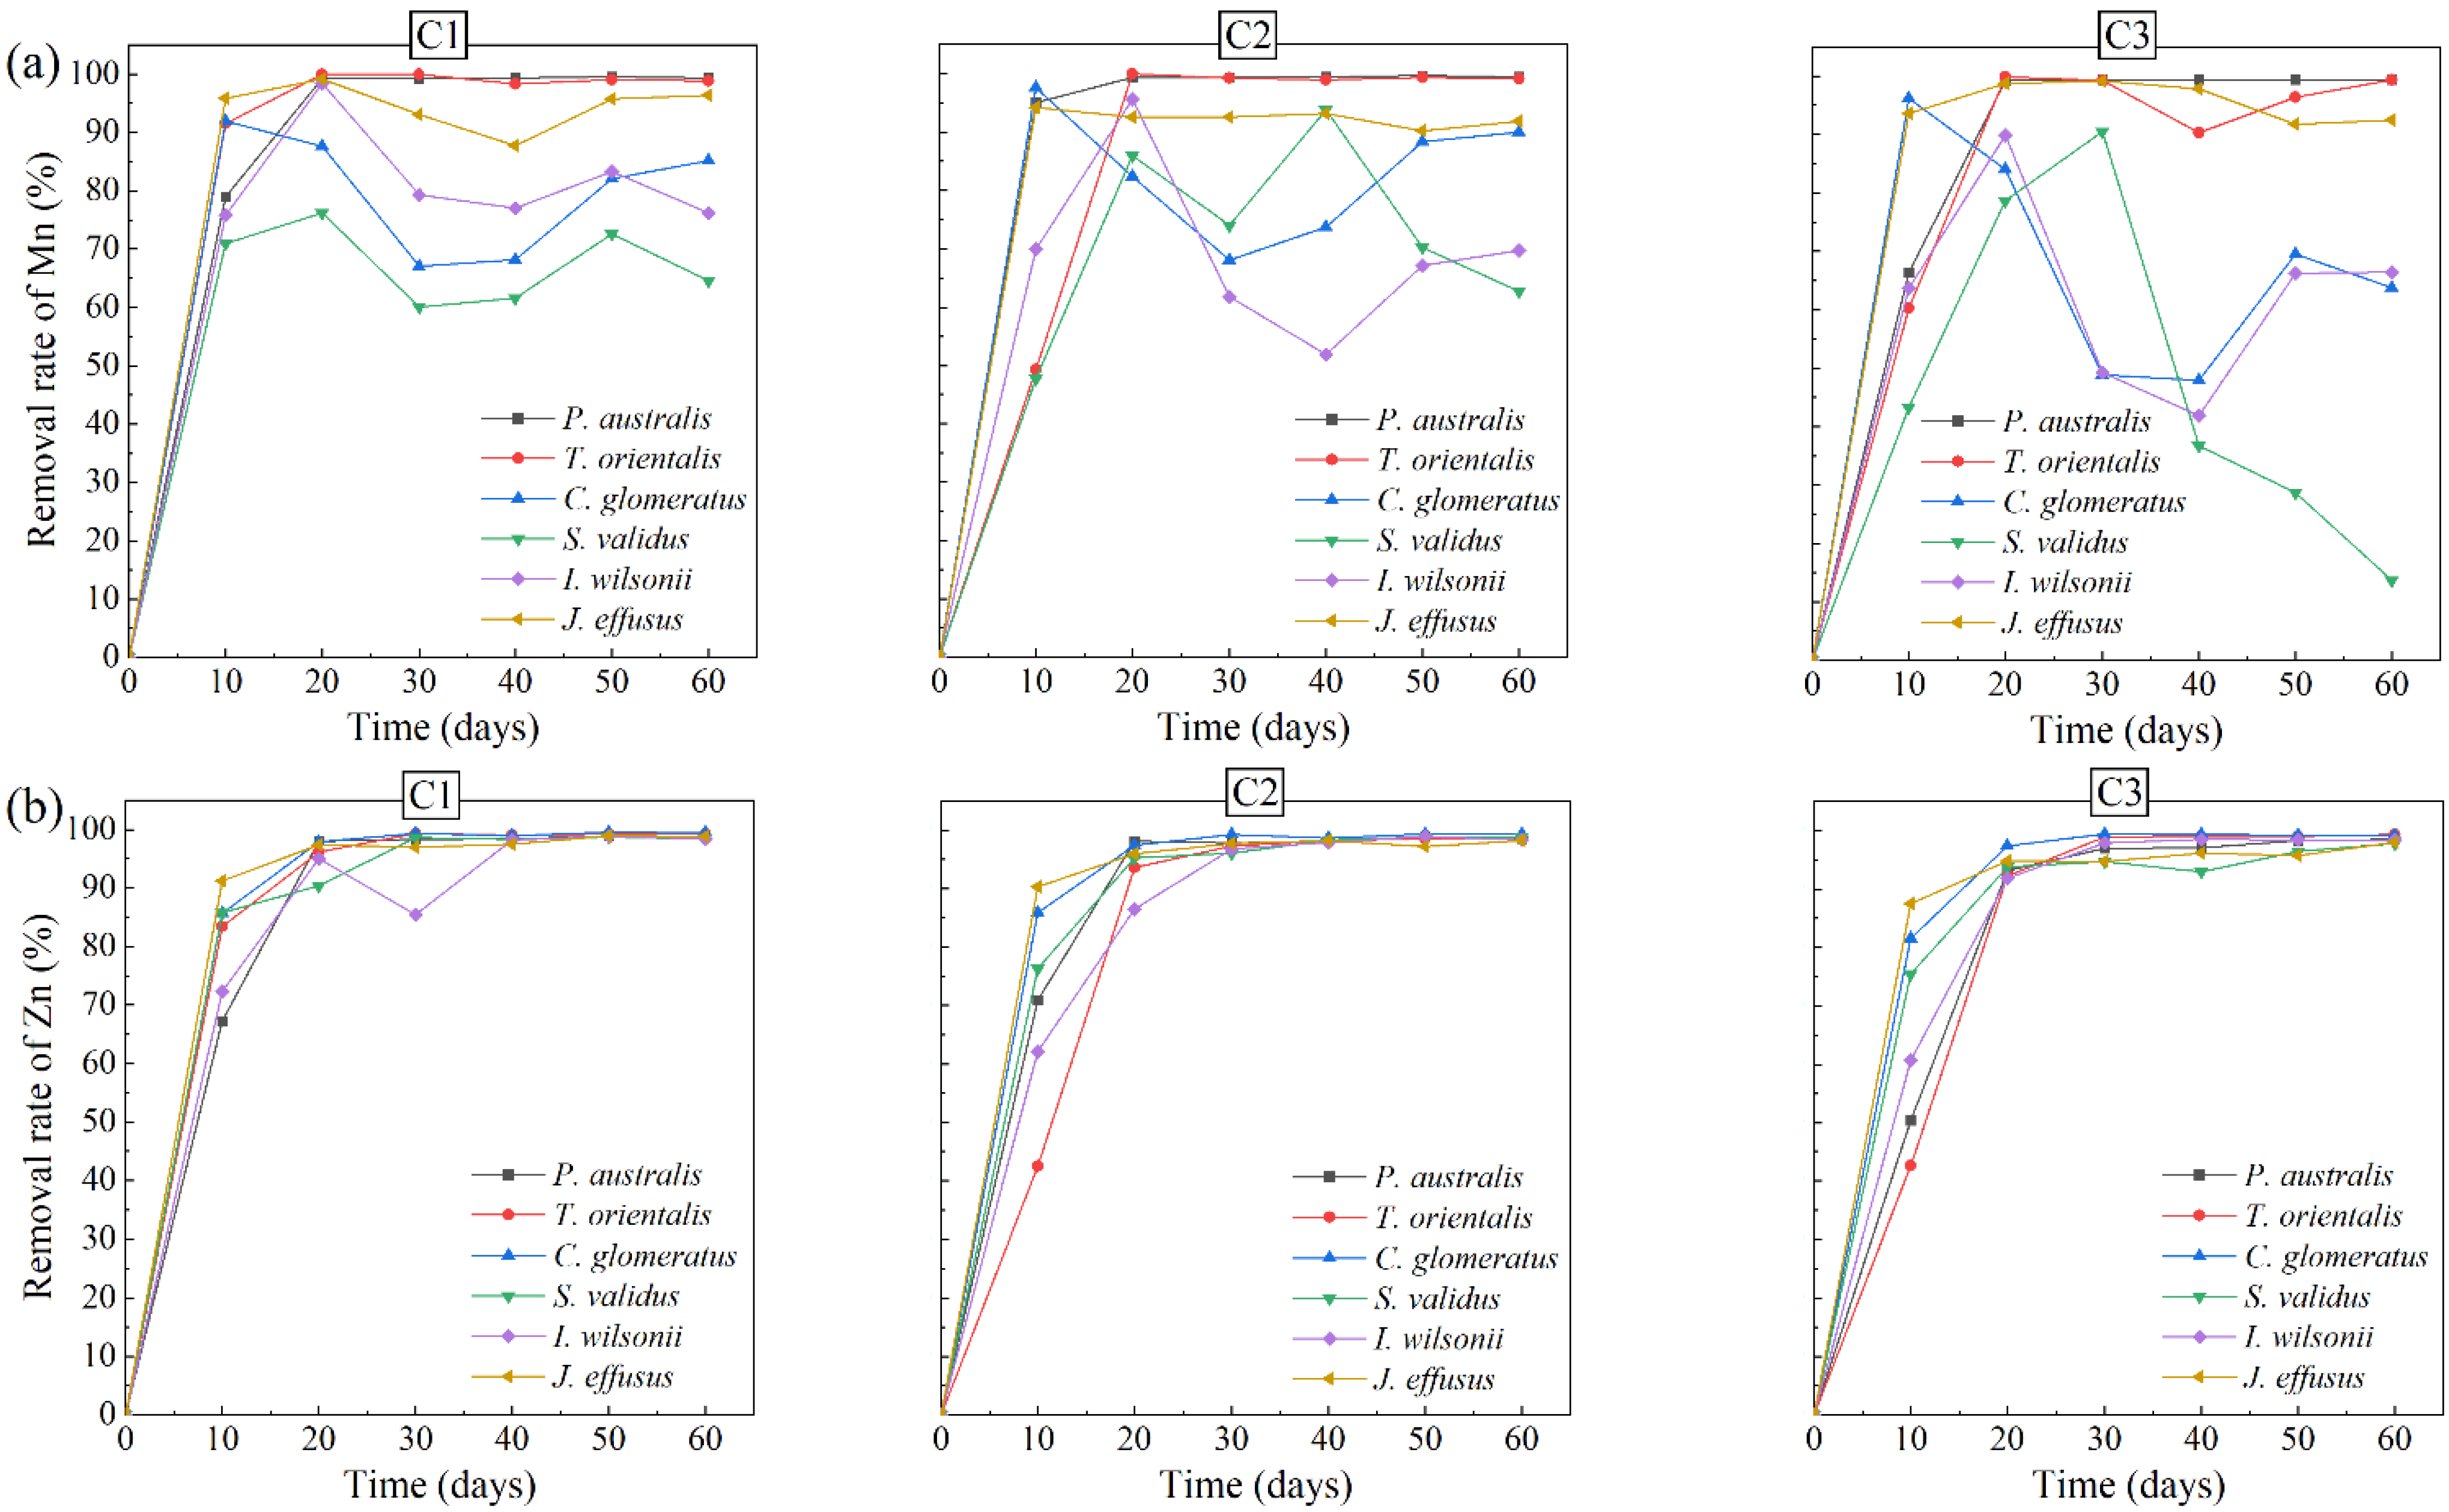
Figure 2 shows the variation of metals removal rates in AMD with different sulfate concentrations over time. As shown in Figure 2a, the removal rate of Mn from AMD was the highest for both P. australis and T. orientalis, with the removal rate reaching more than 99% at 20 days of the experiment and remaining stable afterward. In addition, the removal rate of Mn by J. effusus was basically above 90%. However, the removal rates of Mn from AMD by C. glomeratus, S. validus and I. wilsonii were relatively low and decreased in the later stages of the experiment. This was mainly since some of the roots of these three plants had decayed in the later stages of the experiment, leading to the release of the Mn absorbed by the plants. Moreover, the release of Mn in C3 water samples was stronger than that in C1 and C2 water samples, which may be due to the saline stress on plants in C3 water samples. Studies have shown that high concentrations of soluble salts in the environment can cause damage to plant cells and affect the normal nutrient uptake of plants, which may eventually cause the stomata of plants to close and plants to wilt or even die [27], so the wilting and root rot of plants in C3 water samples were more serious.
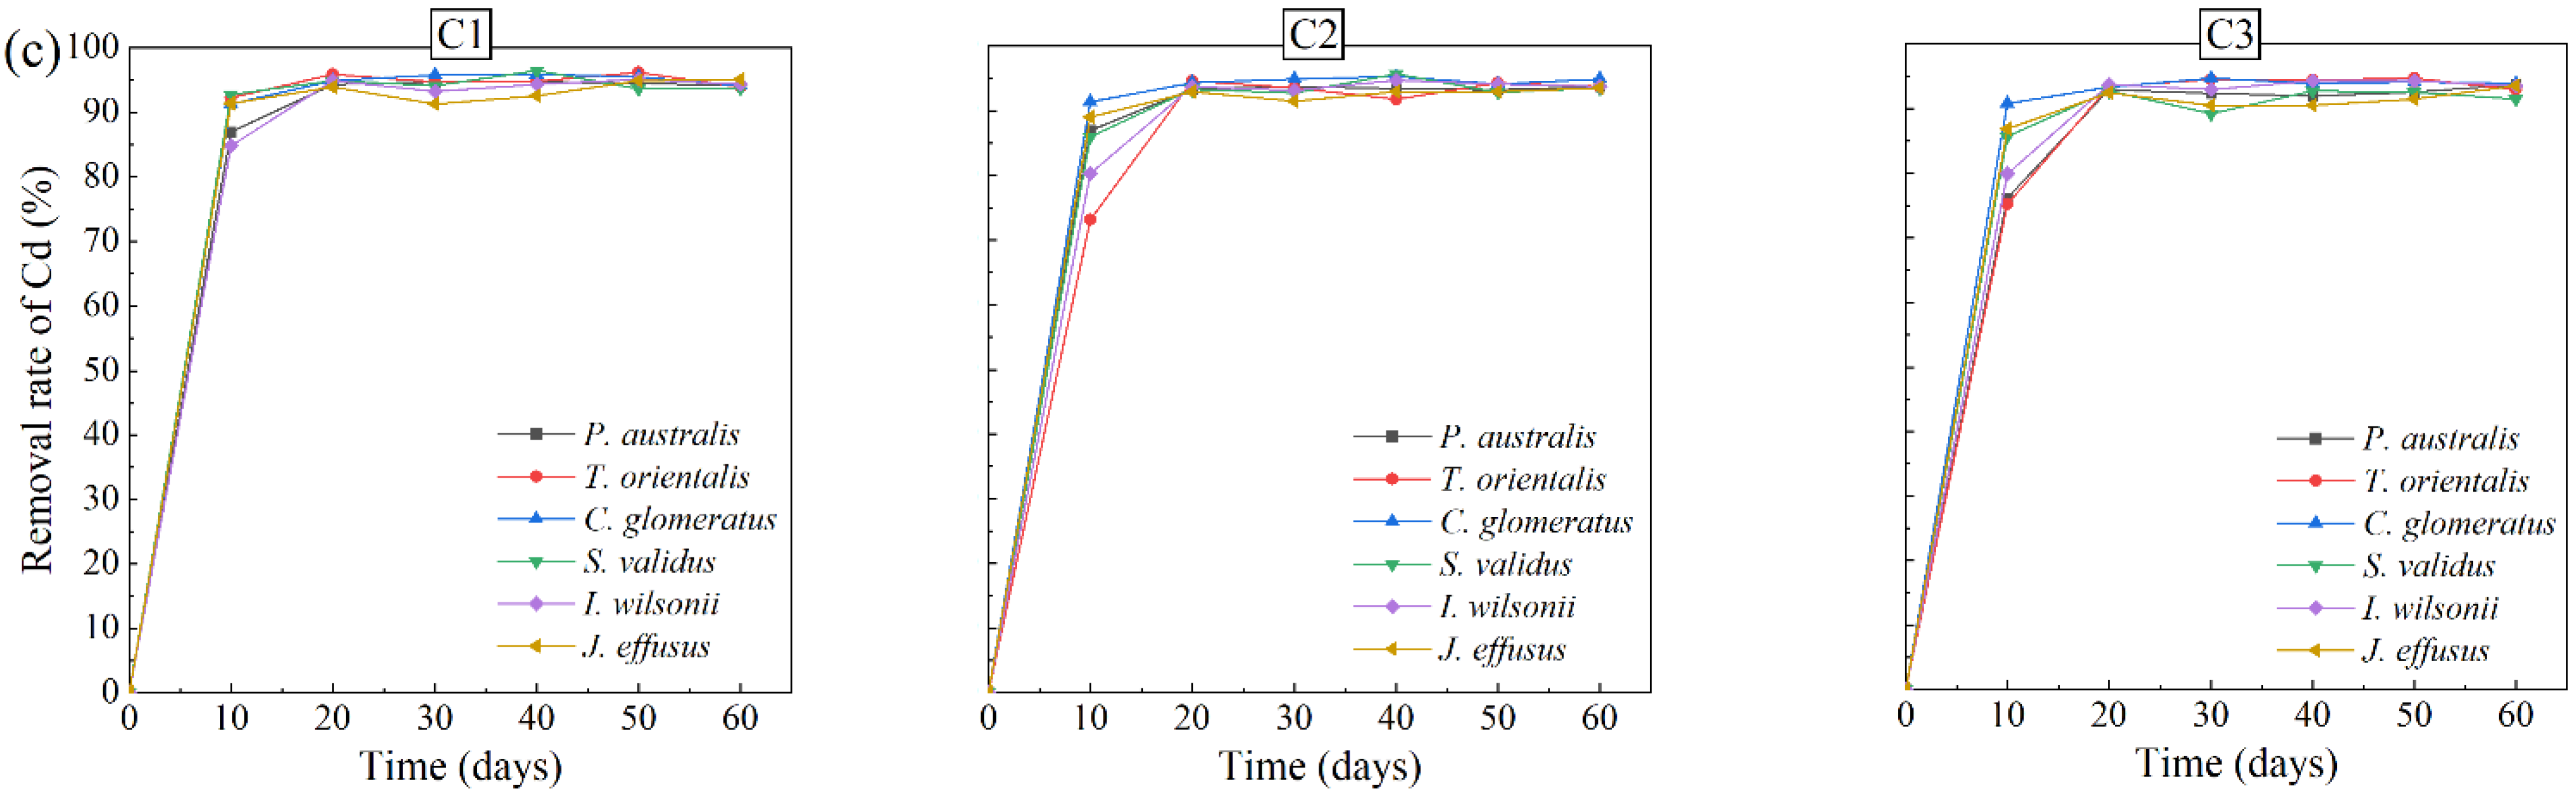
As shown in Figure 2b,c, the trends of Zn and Cd removal rates in AMD by the six plants were all rising first and then stable, and the Zn and Cd removal rates reached more than 97% and 90%, respectively, at 60 days of the experiment. From the figure, it could be seen that the differences in the removal rates of Mn from AMD were greater among the different plants, while there were no significant differences in the removal rates of Zn and Cd, indicating that Zn and Cd in the water samples were more stable than Mn and not easily released by dissolution. Many earlier pieces of literature also reported the difficult removal of Mn [28,29], because, under anoxic conditions, Mn is often present in the form of Mn2+, which is more soluble. Therefore, before treating AMD through CW systems, it needs to be pretreated to oxidize manganese to insoluble manganese dioxide or manganese hydroxide.
Figure 3 shows that sulfate concentrations in AMD decreased continuously with time. Among the six plants, the highest SO42− removal was achieved by J. effusus. The removal of SO42− from all three concentrations of AMD by J. effusus reached more than 50% after 60 days of the experiment with the highest removal rate of 66.78% (C1). The plant with the next highest SO42− removal was I. wilsonii, which removed more than 35% of SO42– from all three concentrations of AMD after 60 days of the experiment, with the highest removal rate of 40.74% (C2). This result is closely related to the growth status of the six plants because sulfur is an indispensable element for the growth and development of all plants, as well as a structural component element of plants, which is involved in many important biochemical reactions in plants [30]. Among the six plants, J. effusus had the highest number of new shoots and I. wilsonii had the best state of old branches, so they needed more water and nutrients, which explains the higher removal of SO42− from AMD by J. effusus and I. wilsonii.
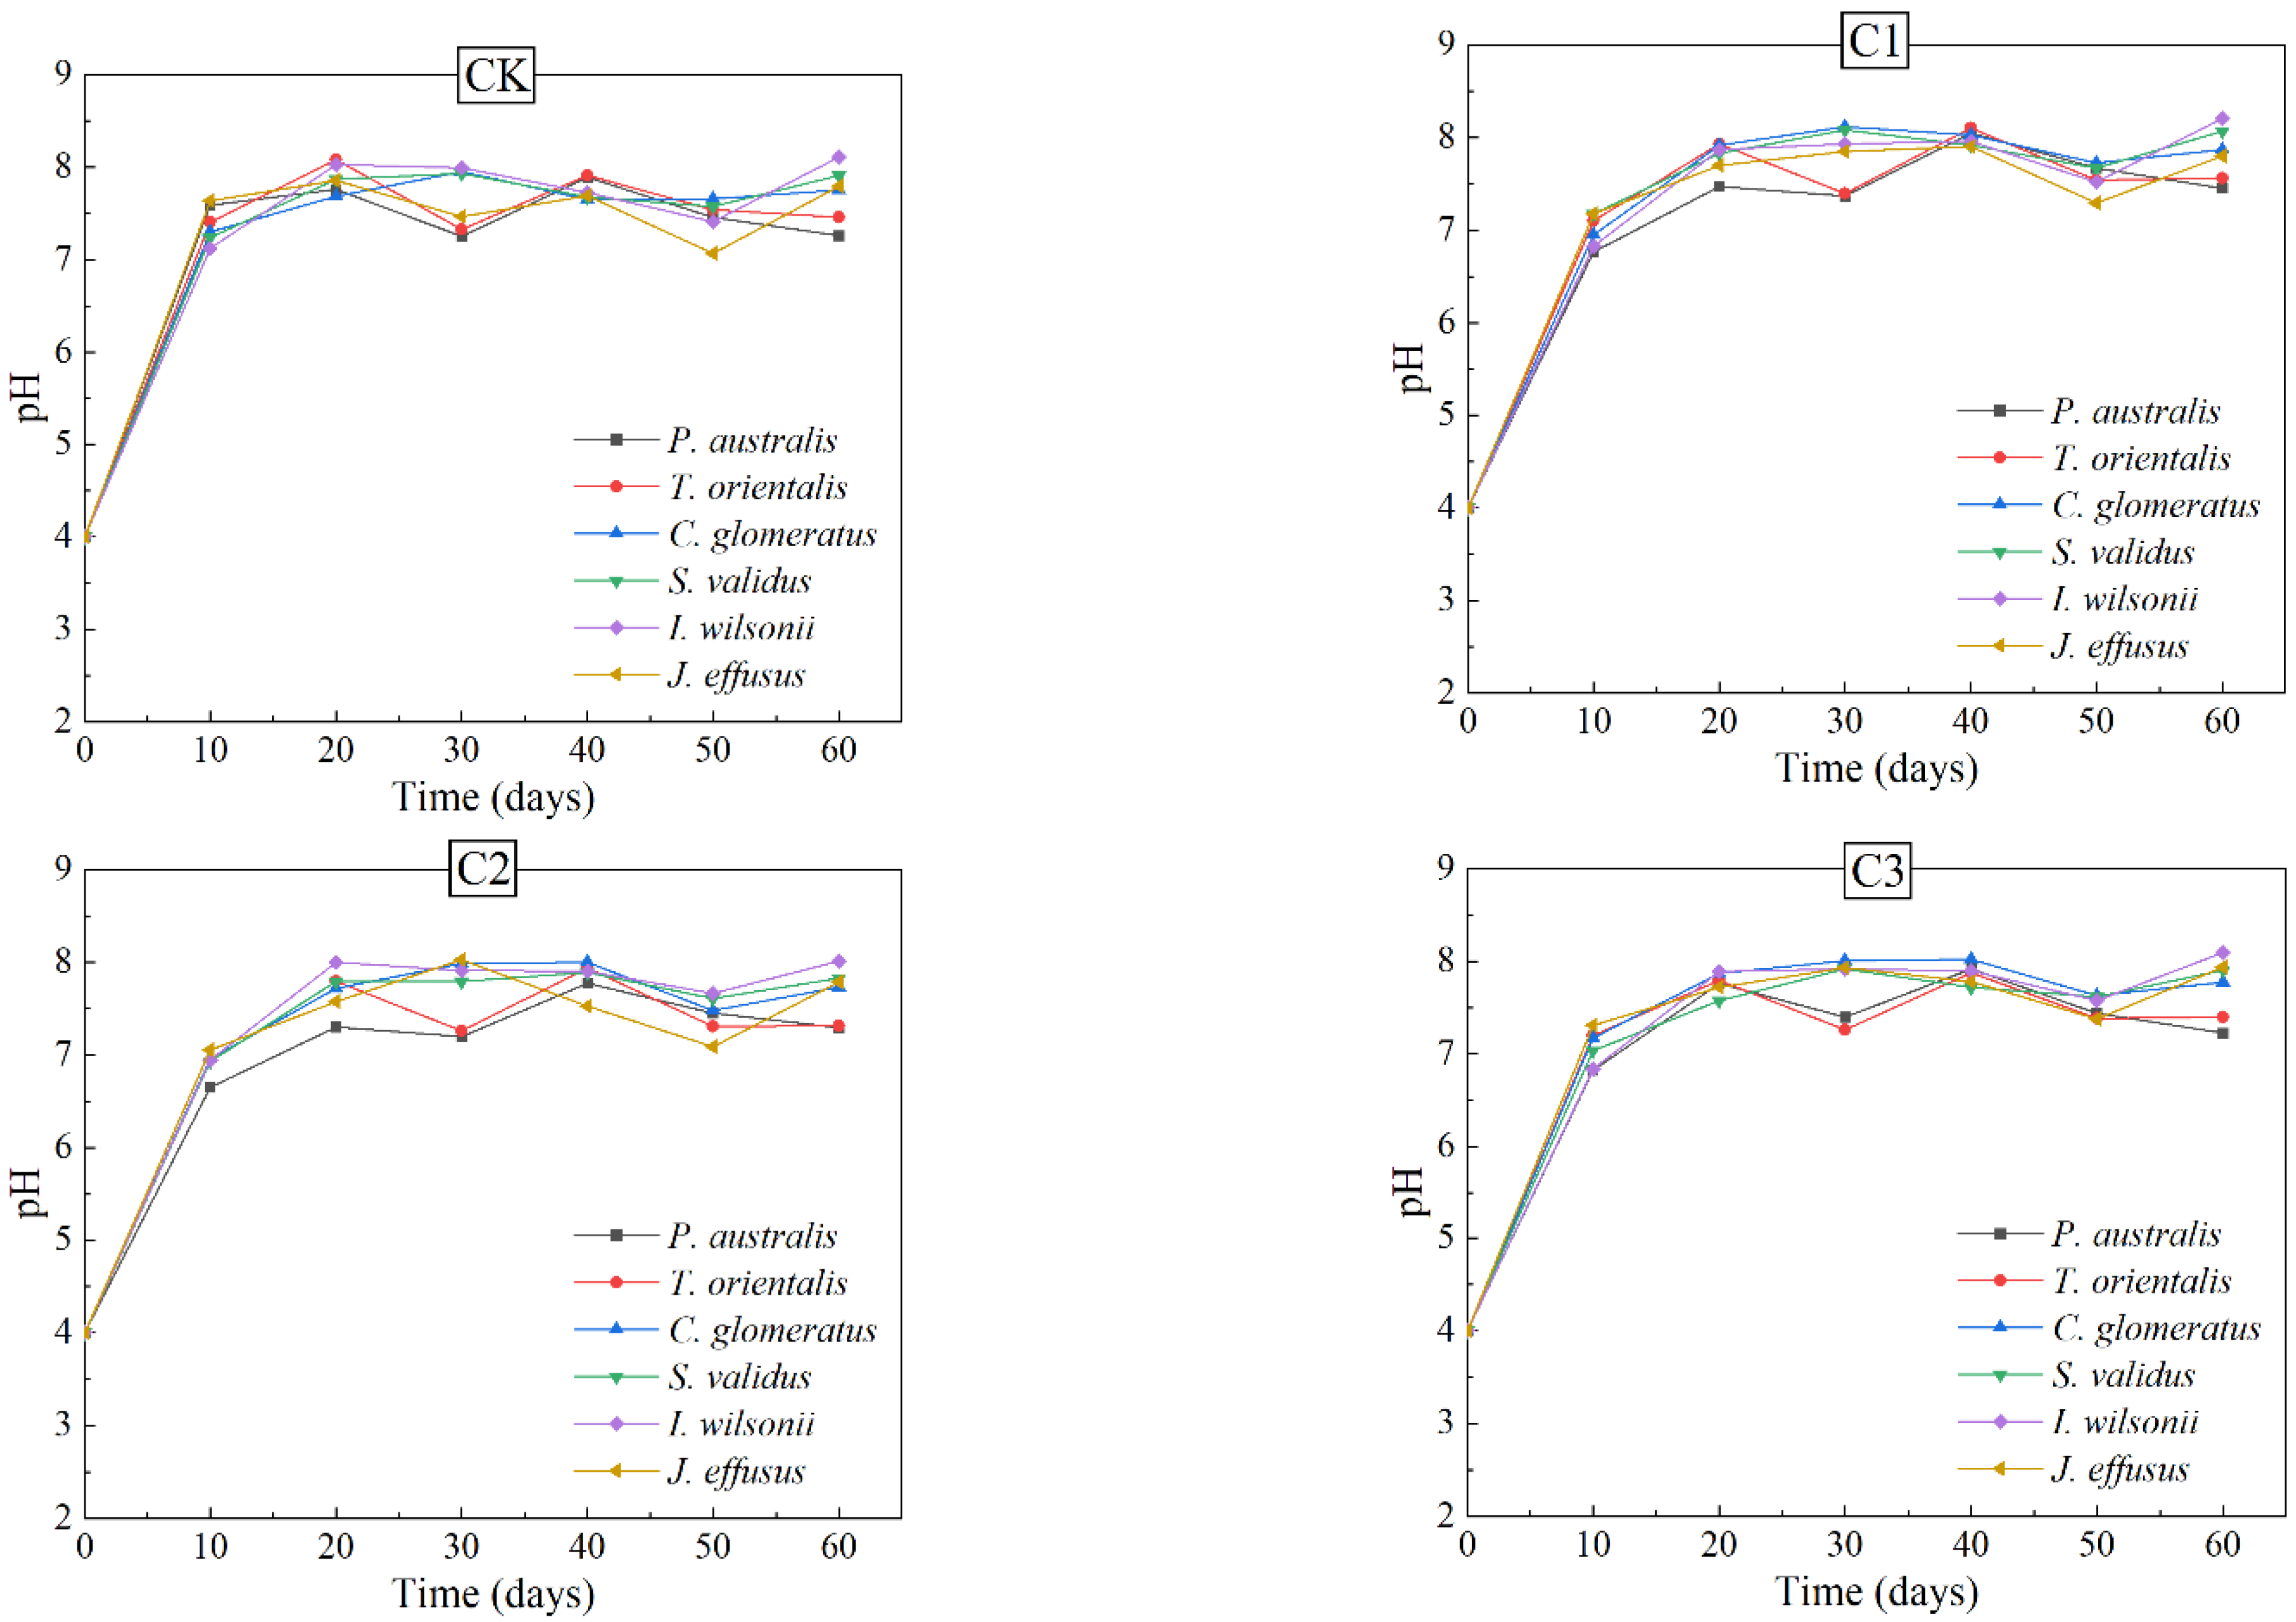
Studies have shown that water quality changes, plant growth, and microbial reproduction are all affected by the pH of the water [31], so continuous monitoring of pH in water is necessary. Figure 4 shows the variation profiles of pH of the experimental water over the operation time. It can be seen that the pH of the experimental water increased from 4 to more than 7 after 20 days of planting the plants in water, which means that the water changed from acidic to weakly alkaline, and the pH of the water was stabilized at 7–8 in the later stages of the experiment. This may be partly due to the ability of plants to regulate the pH of the water during growth, and partly due to the presence of microorganisms, such as sulfate-reducing bacteria, which can use organic matter in the water as electron donors to produce bicarbonate while reducing sulfate, leading to an increase in pH [32], which is important for the removal of metals from the water because the acidity of the solution allows the metals to be transported in the most soluble form.
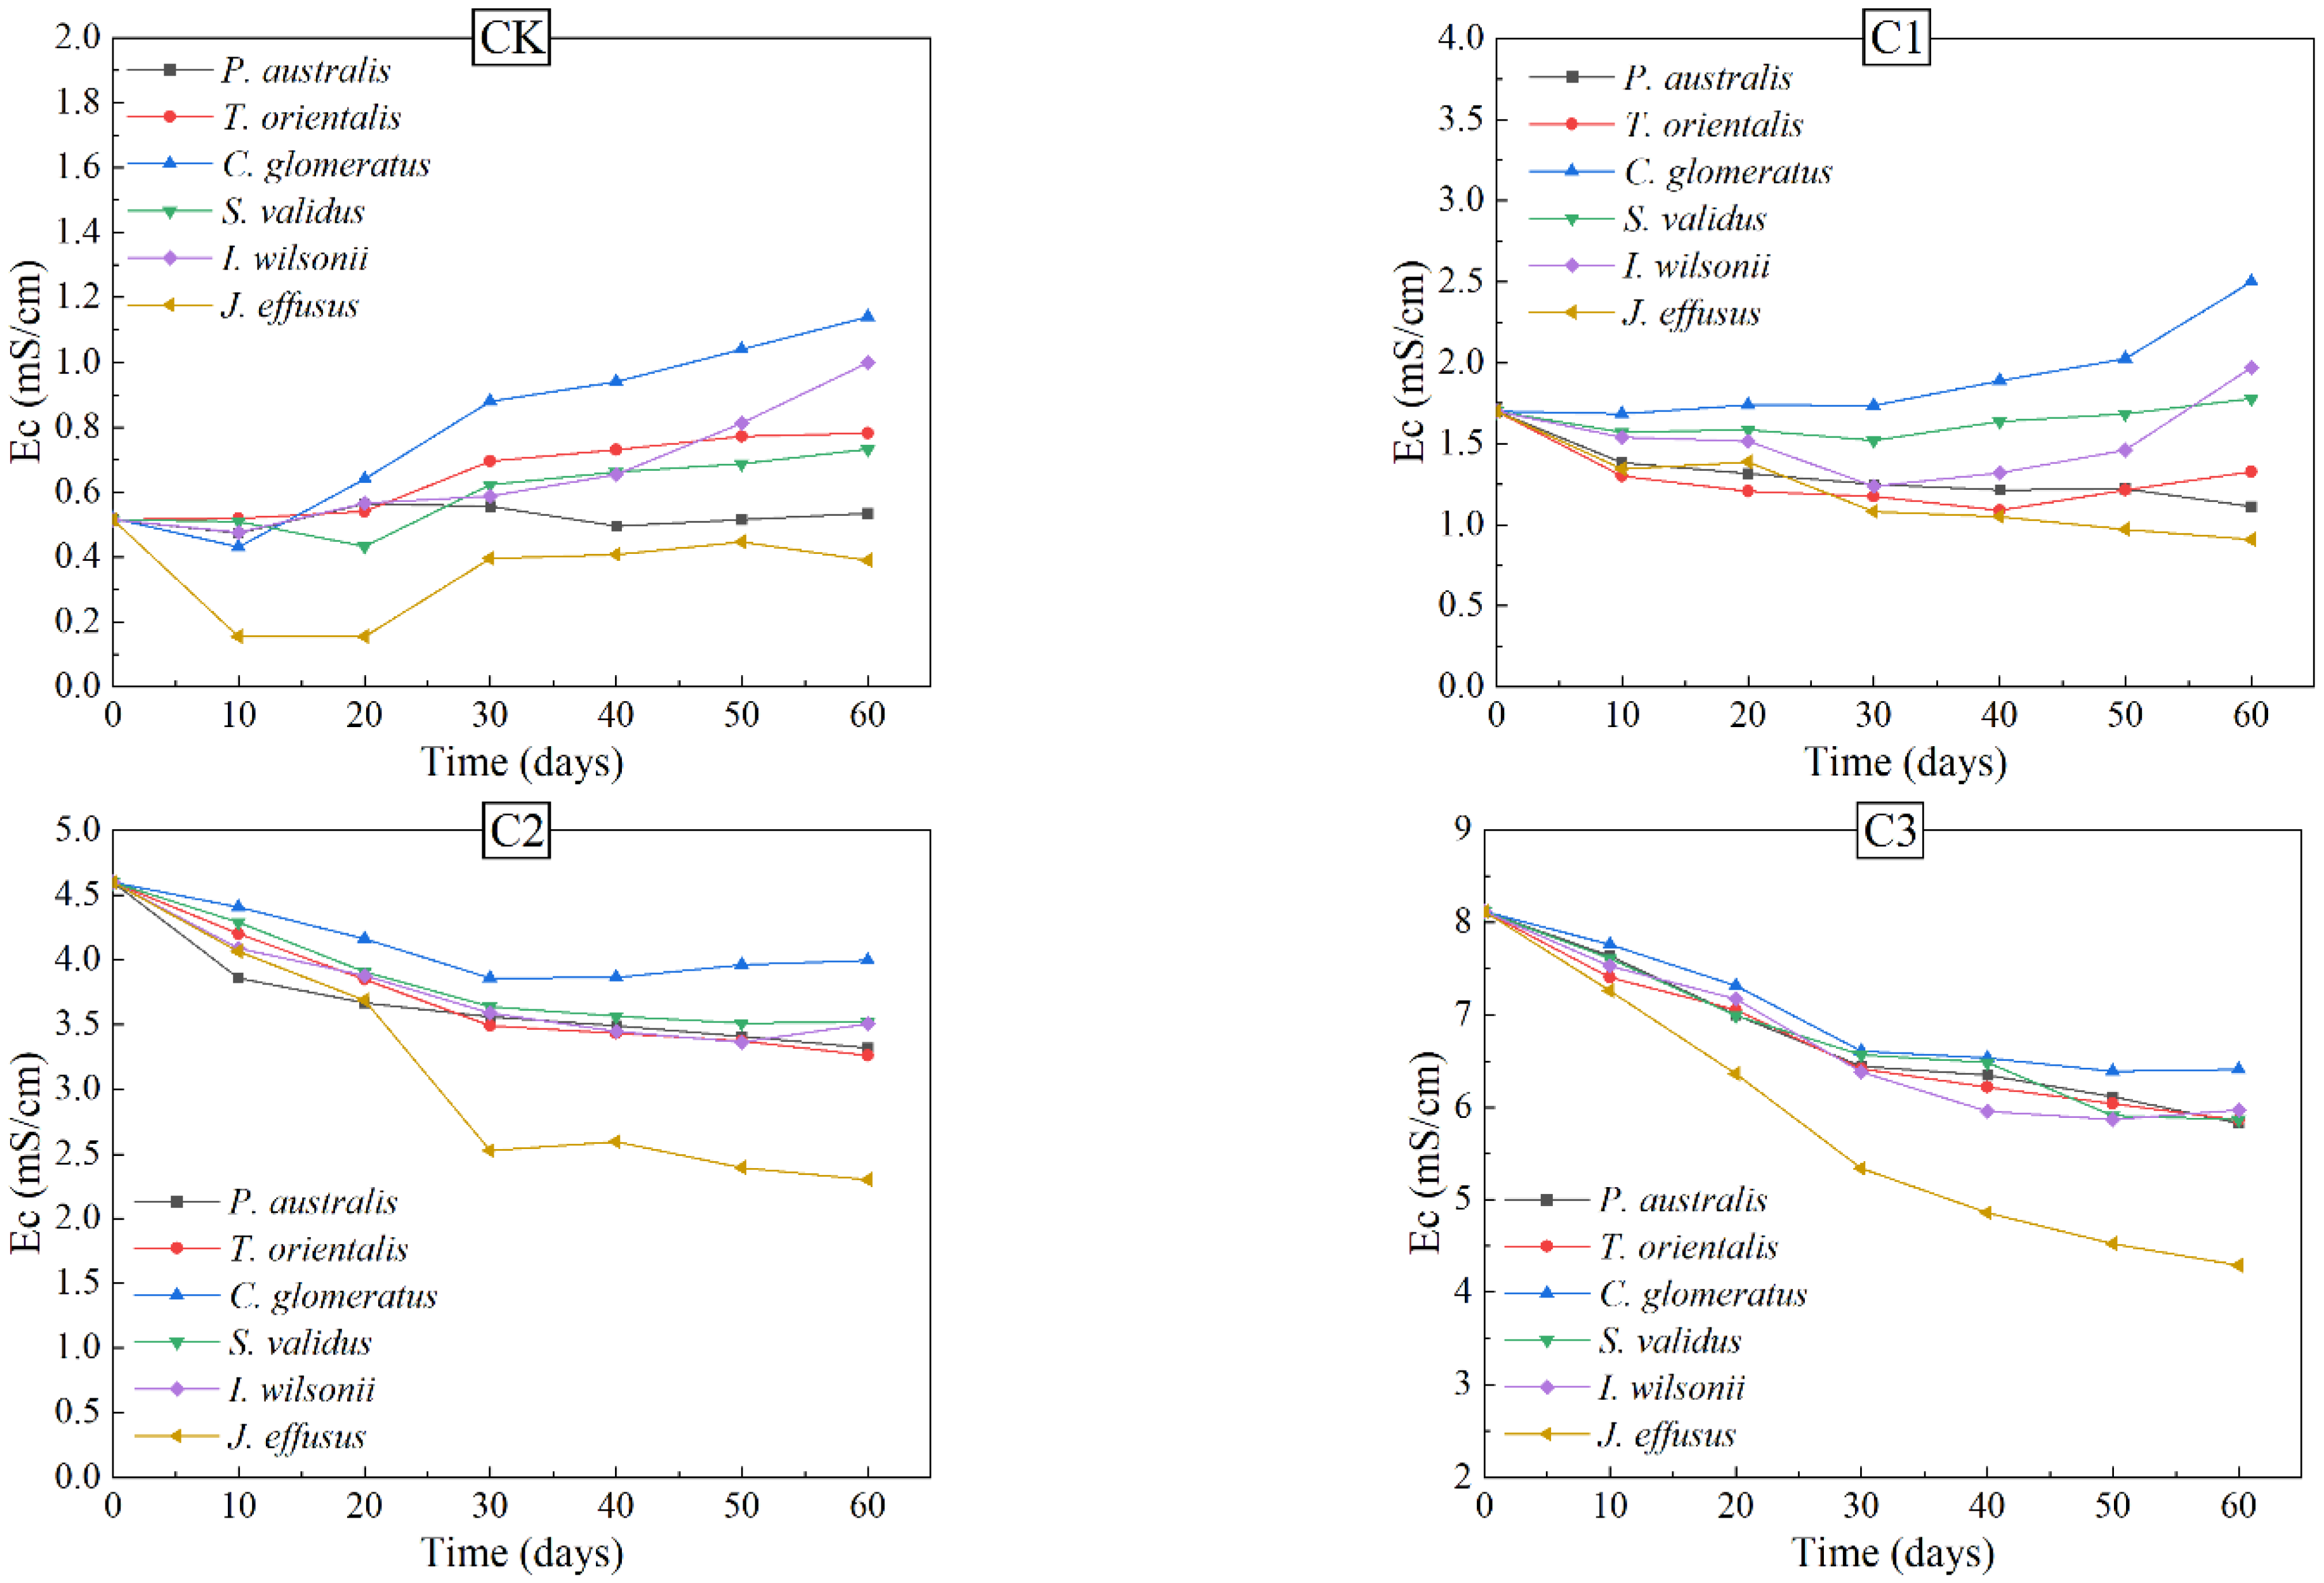
The electrical conductivity (Ec) of the solution is an important indicator of its salt content, ionic content, impurity content, etc. Figure 5 shows the variation profiles of Ec of the experimental water over the operation time. In CK (control group), the Ec of the water samples of J. effusus decreased more and the Ec of the water samples of P. australis changed very little, while the Ec of the water samples of the remaining four plants increased to different degrees, which was mainly due to some root rot of these four plants in the late stage of the experiment, resulting in the dissolution and release of internal plant components. In C1 (low sulfate concentration AMD), the Ec of the water samples of P. australis, T. orientalis and J. effusus decreased, the Ec of the water samples of S. validus and I. wilsonii decreased and then increased slightly, while the Ec of the water samples of C. glomeratus increased more, which was caused by the combination of its growth status and weaker purification effect on AMD. In C2 and C3 (medium and high sulfate concentration AMD), the Ec of the water samples of all six plants decreased, because the removal of pollutants from the water samples had a more significant effect on the Ec than the release of the internal plant components, with the largest decrease in the Ec of water samples of J. effusus, indicating that J. effusus had a greater effect on the removal of pollutants from the water samples, which was consistent with the previous experimental findings.
3.3. Removal Mechanism of Pollutants in AMD
Table 5 shows the metal concentrations and bioconcentration factors (BCFs) of six plants in C3 water samples. The BCF indicates the ability of plants to enrich heavy metals from their surroundings [33], and it could be seen that the BCFs of six plants for each metal were greater than one, indicating that the accumulation of metals in plant tissues was greater than that in the growth medium, so all six plants could be used for phytoextraction of Mn, Zn, and Cd [34]. The order of BCF for most of the plants (except P. australis) was Mn > Cd > Zn, which indicated that Mn was more readily absorbed by plants, thus explaining the decrease in Mn removal in AMD due to the poor growth state of plants at the later stages of the experiment. In addition, the BCFs of plants for Mn followed the order: I. wilsonii > S. validus > C. glomeratus > J. effusus > T. orientalis > P. australis, the BCFs of plants for Zn followed the order: I. wilsonii > J. effusus > S. validus> T. orientalis > C. glomeratus > P. australis, the BCFs of plants for Cd followed the order: I. wilsonii > J. effusus > S. validus> C. glomeratus > P. australis> T. orientalis. This showed that I. wilsonii had the highest metal enrichment capacity, followed by J. effusus and S. validus.
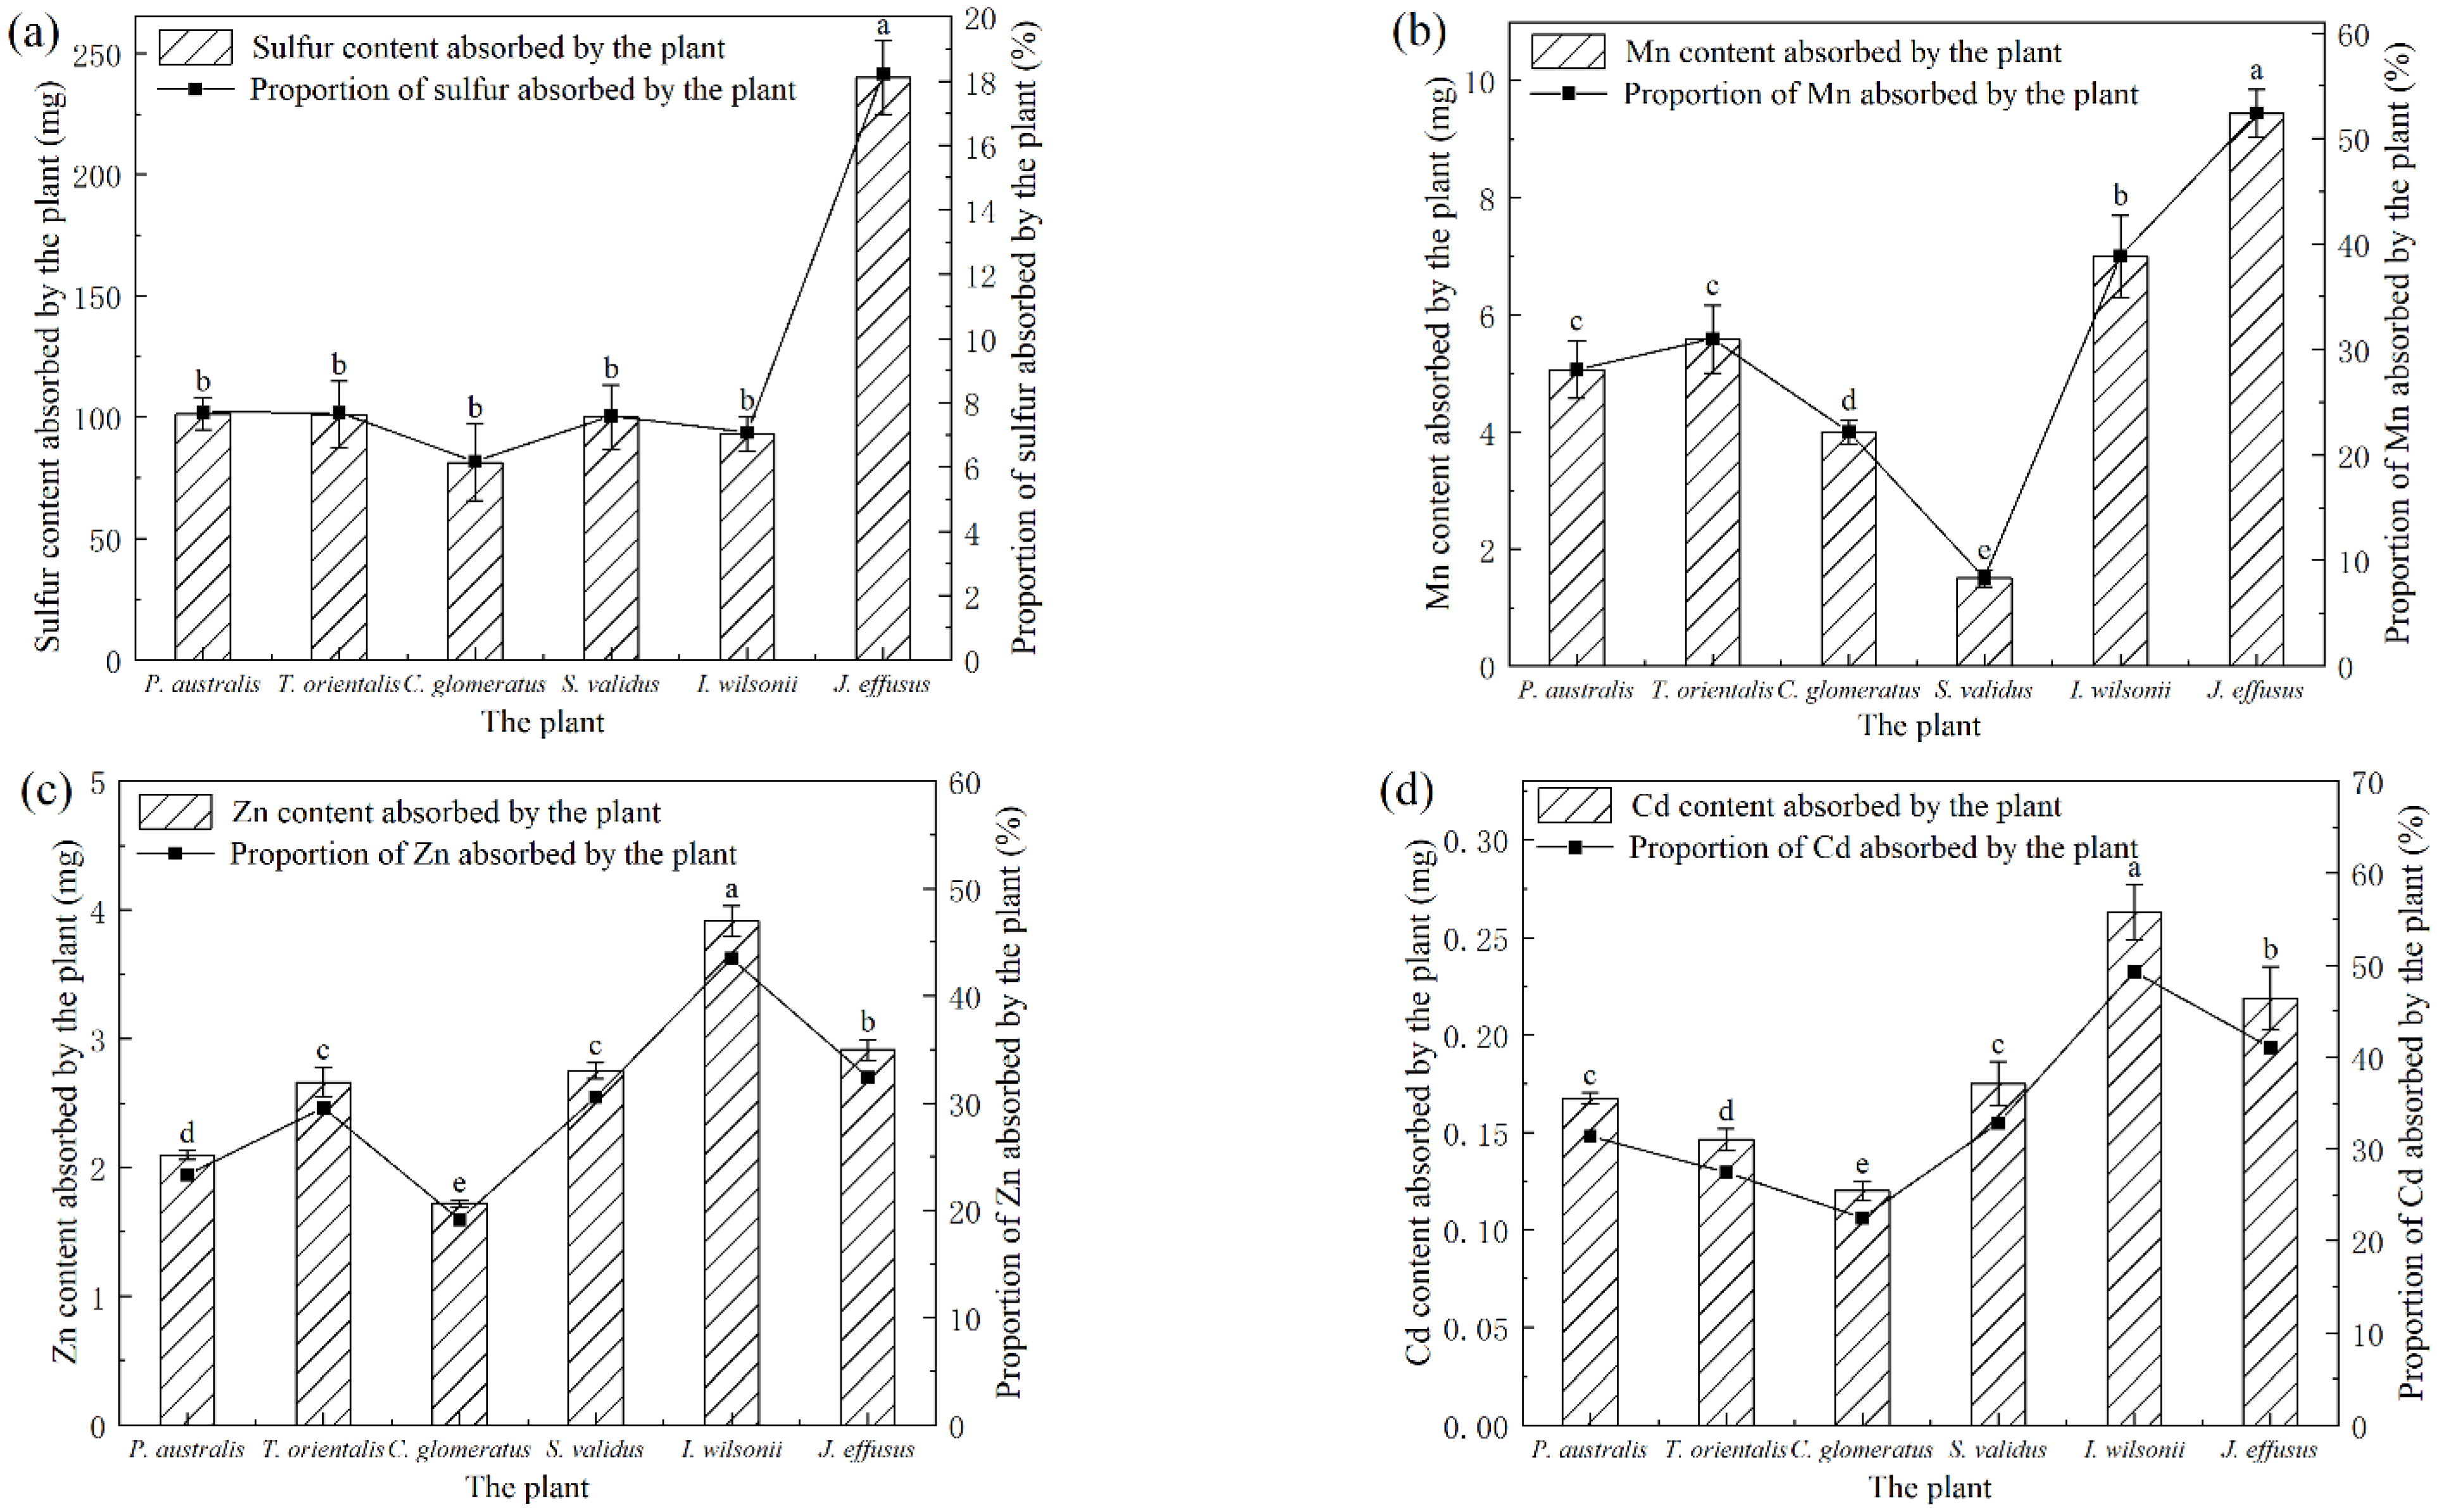
In this paper, the removal mechanism of pollutants in AMD was analyzed by taking the C3 treatment group as an example. The sulfur, Mn, Zn, and Cd contents of six plants in CK and C3 water samples at the end of the experiment were detected, the difference was taken as the sulfur, Mn, Zn, and Cd contents absorbed by each plant in C3 water samples, and the ratio of the difference to the initial content of pollutants in C3 water samples was taken as the proportion of sulfur, Mn, Zn, and Cd absorbed by plants in C3 water samples, as shown in Figure 6.
Bars and error bars represent the mean ± SD of three replicates. The same letter in the histogram of a certain plant represents no significant difference at the level of 0.05 (Duncan’s Multiple Range Test). From Figure 6a, it can be seen that J. effusus absorbed the highest amount of sulfur, which accounted for 18.23% of sulfur in AMD, while the other five species absorbed a small percentage of sulfur, ranging from 6% to 8%. This is also the reason for the highest SO42– removal rate in AMD by J. effusus. However, compared with Figure 3, it can be found that the proportion of sulfur absorbed by plants is smaller than the sulfur removal rate in AMD, indicating that only a part of sulfur in AMD is absorbed by plants. In addition, white crystals were observed to precipitate from the plant surface during the experiment, and the higher the sulfate concentration in AMD and the longer the experiment, the more white crystals were precipitated from the plant. Examination of the composition of the white crystals using X-ray diffraction (XRD) revealed that the main component was sodium sulfate (Figure 7), suggesting that the plant first absorbed the sodium sulfate into its body and then excreted the portion that could not be absorbed and used by its own tissues, thus allowing the removal of sulfate by harvesting.
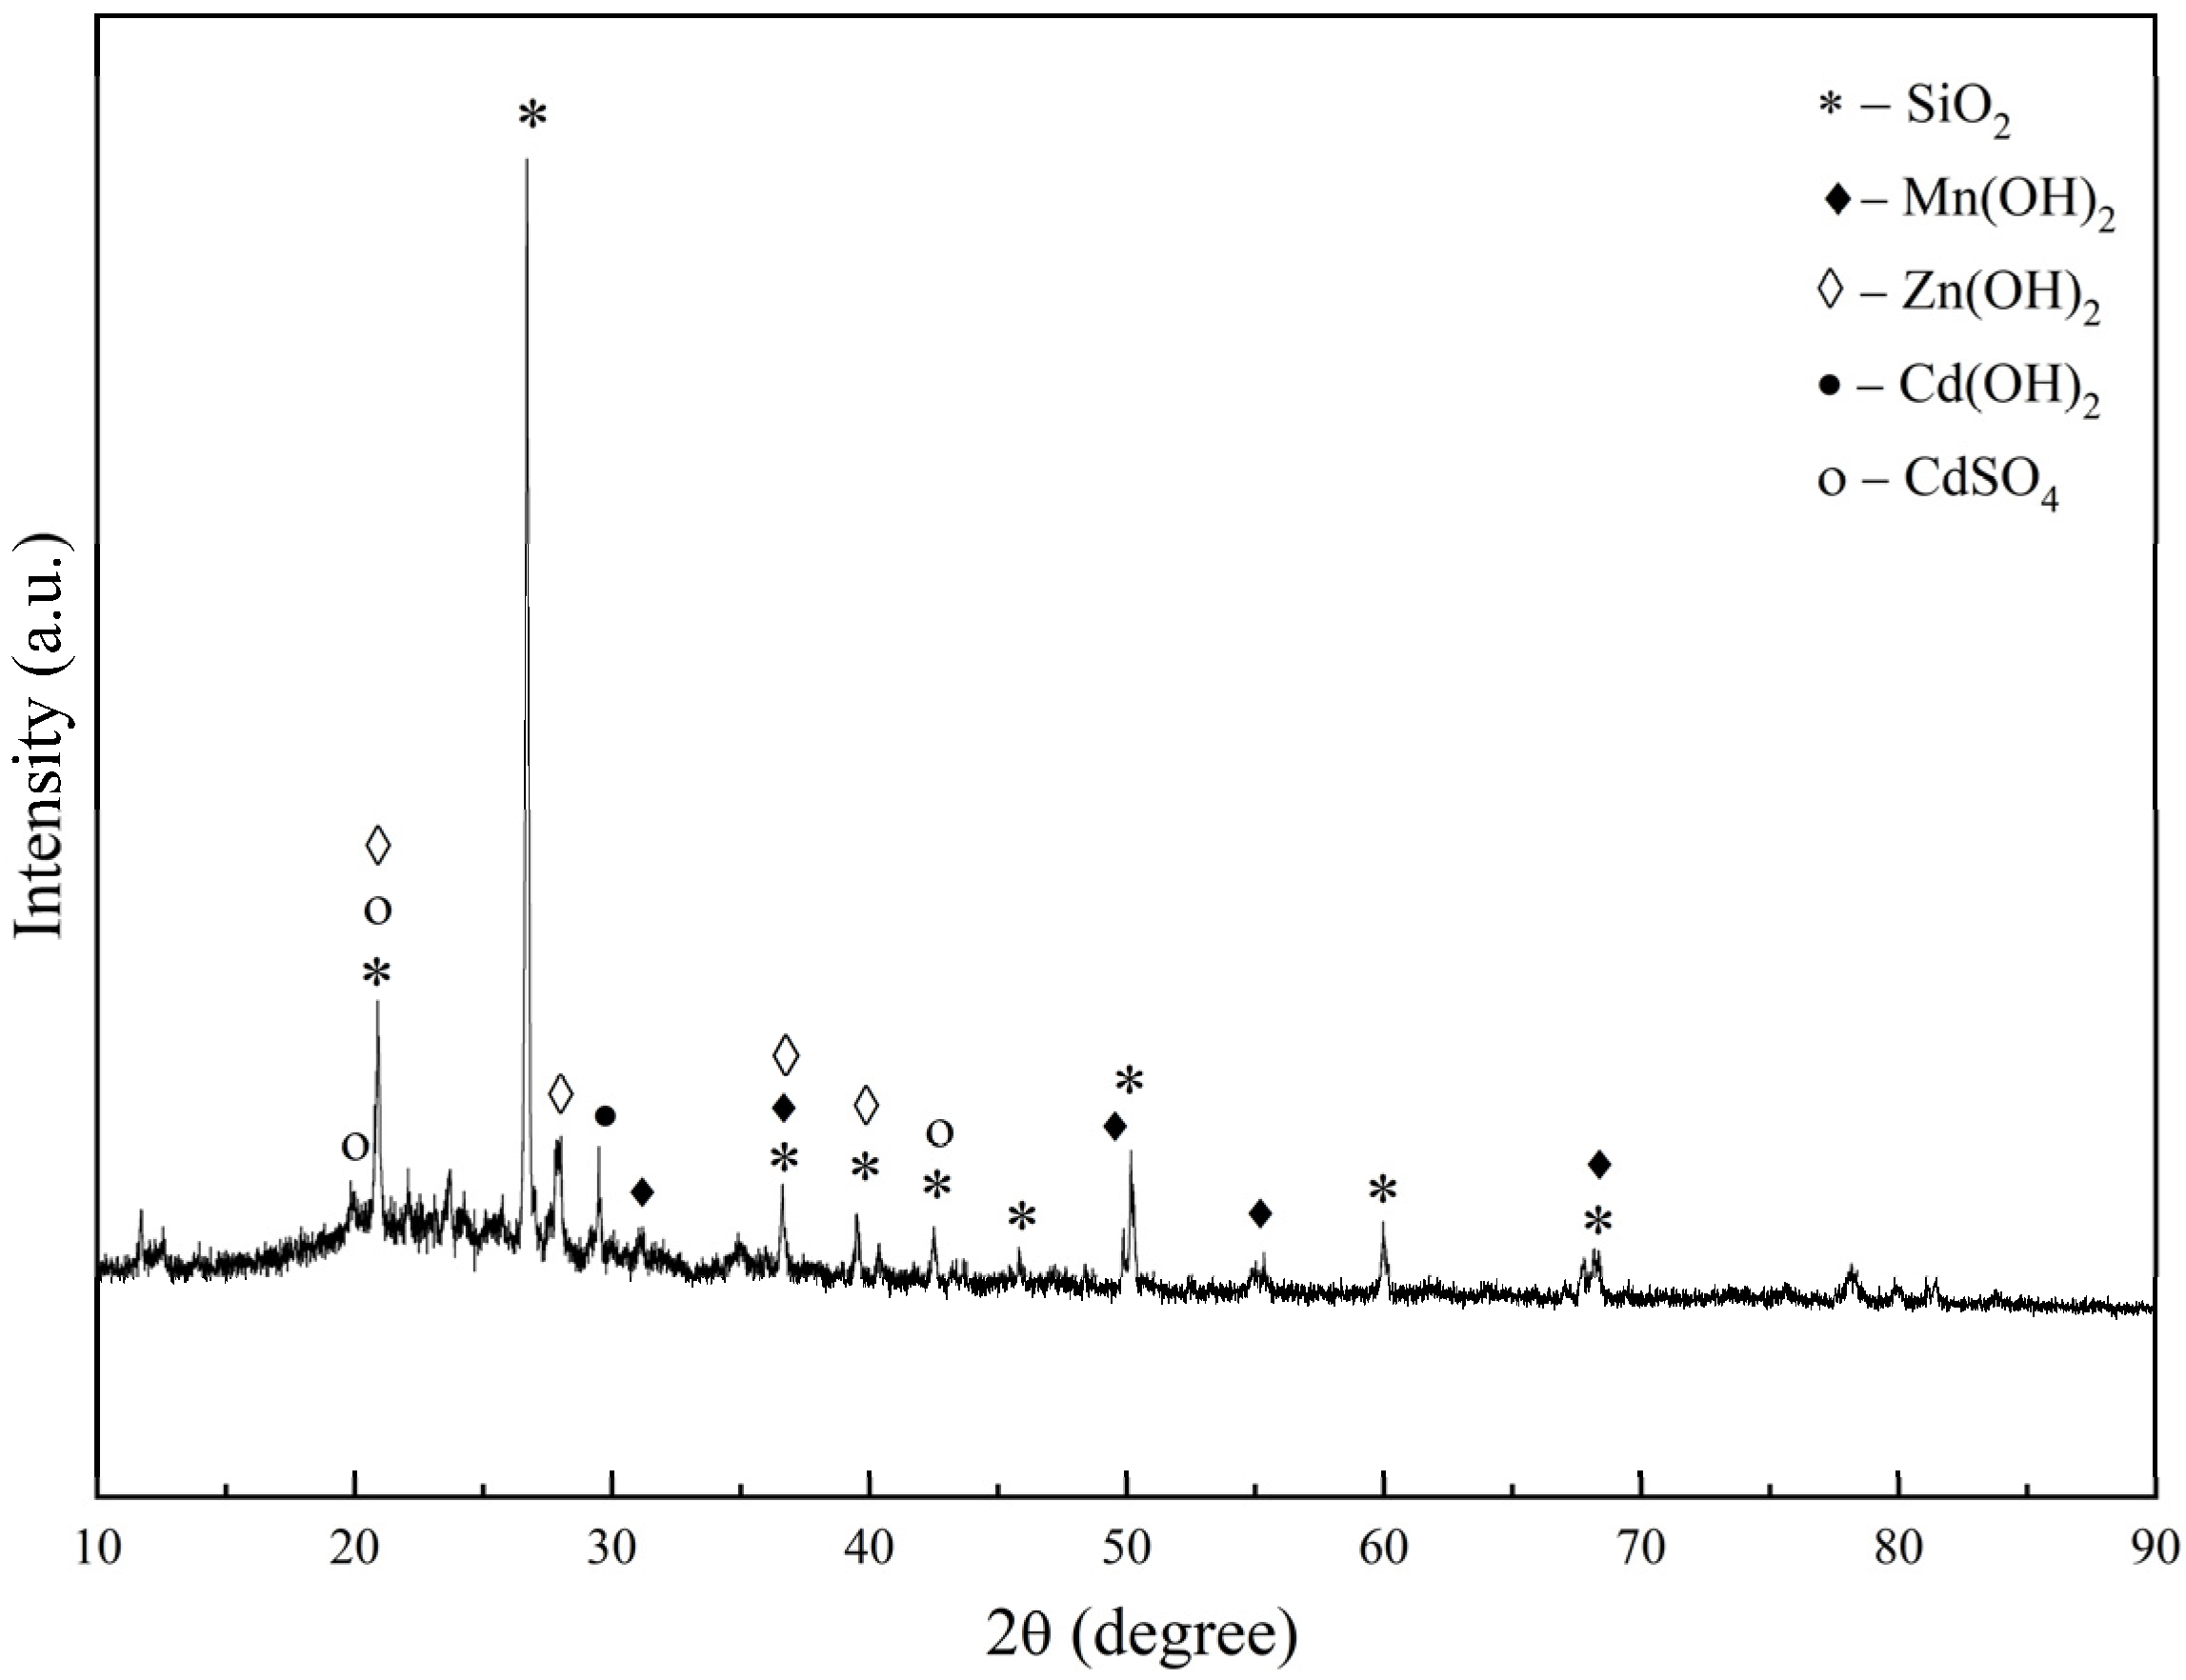
As seen in Figure 6b–d, among the six plants, the metal uptake by J. effusus and I. wilsonii was higher than the other four plants. J. effusus absorbed 52.44%, 32.37%, and 41.02% of the Mn, Zn, and Cd contents in AMD, respectively, and I. wilsonii absorbed 38.89%, 43.47%, and 49.27% of the Mn, Zn, and Cd contents in AMD, respectively. However, compared with Figure 2a–c, it can be found that the proportion of metals absorbed by plants is smaller than the metal removal rate in AMD, which means that only part of the metals in AMD are absorbed by plants. Therefore, the precipitates in the water samples were examined for composition using an X-ray diffractometer (XRD) (Figure 8), and it was found that the precipitates could be Mn(OH)2, Zn(OH)2, Cd(OH)2, CdSO4, etc., indicating the existence of other ways (hydrolysis, precipitation, etc.) for the removal of heavy metals from AMD, which could be related to the change of pH in AMD.
4. Conclusions
In this paper, six wetland plants (Phragmites australis, Typha orientalis, Cyperus glomeratus, Scirpus validus, Iris wilsonii, Juncus effusus) were used as research objects to conduct an experimental hydroponic study of phytoremediation of AMD, and the following main conclusions were obtained:
- (1)
- There was no significant difference in the removal rates of Zn and Cd in AMD among the six plants, while the removal rates of SO42– and Mn in AMD varied greatly. Therefore, the six wetland plants were screened in terms of their growth status and the removal effects of the plants on pollutants in AMD, and Juncus effusus, Iris wilsonii and Phragmites australis were preferably finally selected as the dominant plants for the treatment of AMD.
- (2)
- The analysis of the uptake of pollutants in plants and the precipitates in AMD showed that the removal pathway of pollutants in AMD consisted of two aspects: one part was absorbed by the plants, and the other part was removed by means of hydrolysis, precipitation, etc. It was noteworthy that the plants first absorbed sodium sulfate into their bodies and then excreted the part that could not be absorbed and utilized by their own tissues, which precipitated as white crystals on the plant surface; hence, sulfate could be removed by harvesting.
Author Contributions
Conceptualization, A.W. and Y.Z.; software, A.W. and L.G.; investigation, A.W., J.L. and G.Z.; writing—original draft preparation, A.W.; writing—review and editing, S.X. and X.Z.; supervision, Y.Z.; project administration, Y.Z. and H.S.; funding acquisition, Y.Z. and H.S. All authors have read and agreed to the published version of the manuscript.
Funding
This research was funded by key research programs of the Ministry of Science and Technology for water resource efficiency development and utilization project, grant number 2018YFC0406403.
Data Availability Statement
The datasets generated and/or analyzed during the current study are available from the corresponding author on reasonable request.
Conflicts of Interest
The authors declare no conflict of interest.
References
- Fernando, W.A.M.; Ilankoon, I.M.S.K.; Syed, T.H.; Yellishetty, M. Challenges and opportunities in the removal of sulphate ions in contaminated mine water: A review. Miner. Eng. 2018, 117, 74–90. [Google Scholar] [CrossRef]
- Singh, S.; Chakraborty, S. Performance of organic substrate amended constructed wetland treating acid mine drainage (AMD) of North-Eastern India. J. Hazard. Mater. 2020, 397, 122719. [Google Scholar] [CrossRef]
- Guo, L.; Cutright, T.J. Remediation of AMD Contaminated Soil by Two Types of Reeds. Int. J. Phytore Mediat. 2015, 17, 391–403. [Google Scholar] [CrossRef]
- Mang, K.C.; Ntushelo, K. Phytoextraction and phytostabilisation approaches of heavy metal remediation in acid mine drainage with case studies: A review. Appl. Ecol. Environ. Res. 2019, 17, 6129–6149. [Google Scholar] [CrossRef]
- Cutright, T.J.; Senko, J.; Sivaram, S.; York, M. Evaluation of the Phytoextraction Potential at an Acid-Mine-Drainage-Impacted Site. Soil Sediment Contam. 2012, 21, 970–984. [Google Scholar] [CrossRef]
- Karaca, O.; Cameselle, C.; Reddy, K.R. Mine tailing disposal sites: Contamination problems, remedial options and phytocaps for sustainable remediation. Rev. Environ. Sci. Bio-Technol. 2018, 17, 205–228. [Google Scholar] [CrossRef]
- Nagy, A.; Magyar, T.; Juhasz, C.; Tamas, J. Phytoremediation of acid mine drainage using by-product of lysine fermentation. Water Sci. Technol. 2020, 81, 1507–1517. [Google Scholar] [CrossRef]
- Younger, P.L. The longevity of minewater pollution: A basis for decision-making. Sci. Total Environ. 1997, 194–195, 457–466. [Google Scholar] [CrossRef]
- Zheng, Q.; Zhang, Y.; Zhang, Z.; Li, H.; Wu, A.; Shi, H. Experimental research on various slags as a potential adsorbent for the removal of sulfate from acid mine drainage. J. Environ. Manag. 2020, 270, 110880. [Google Scholar] [CrossRef]
- Tong, L.; Fan, R.; Yang, S.; Li, C. Development and Status of the Treatment Technology for Acid Mine Drainage. Min. Metall. Explor. 2021, 38, 315–327. [Google Scholar] [CrossRef]
- Dutta, M.; Islam, N.; Rabha, S.; Narzary, B.; Bordoloi, M.; Saikia, D.; Silva, L.F.O.; Saikia, B.K. Acid mine drainage in an Indian high-sulfur coal mining area: Cytotoxicity assay and remediation study. J. Hazard. Mater. 2019, 389, 121851. [Google Scholar] [CrossRef]
- Skousen, J.; Zipper, C.E.; Rose, A.; Ziemkiewicz, P.F.; Nairn, R.; McDonald, L.M.; Kleinmann, R.L. Review of Passive Systems for Acid Mine Drainage Treatment. Mine Water Environ. 2017, 36, 133–153. [Google Scholar] [CrossRef] [Green Version]
- Blanco, I.; Sapsford, D.J.; Trumm, D.; Pope, J.; Kruse, N.; Cheong, Y.-W.; McLauchlan, H.; Sinclair, E.; Weber, P.; Olds, W. International Trials of Vertical Flow Reactors for Coal Mine Water Treatment. Mine Water Environ. 2018, 37, 4–17. [Google Scholar] [CrossRef] [Green Version]
- Pat-Espadas, A.M.; Loredo Portales, R.; Amabilis-Sosa, L.E.; Gomez, G.; Vidal, G. Review of Constructed Wetlands for Acid Mine Drainage Treatment. Water 2018, 10, 1685. [Google Scholar] [CrossRef] [Green Version]
- Palihakkara, C.R.; Dassanayake, S.; Jayawardena, C.; Senanayake, I.P. Floating Wetland Treatment of Acid Mine Drainage using Eichhornia crassipes (Water Hyacinth). J. Health Pollut. 2018, 8, 14–19. [Google Scholar] [CrossRef]
- Yan, A.; Wang, Y.; Tan, S.N.; Mohd Yusof, M.L.; Ghosh, S.; Chen, Z. Phytoremediation: A Promising Approach for Revegetation of Heavy Metal-Polluted Land. Front. Plant Sci. 2020, 11, 359. [Google Scholar] [CrossRef]
- Brisson, J.; Chazarenc, F. Maximizing pollutant removal in constructed wetlands: Should we pay more attention to macrophyte species selection? Sci. Tech. 2008, 407, 3923–3930. [Google Scholar] [CrossRef]
- Oyuela Leguizamo, M.A.; Fernandez Gomez, W.D.; Sarmiento, M.C.G. Native herbaceous plant species with potential use in phytoremediation of heavy metals, spotlight on wetlands—A review. Chemosphere 2017, 168, 1230–1247. [Google Scholar] [CrossRef]
- Muthusaravanan, S.; Sivarajasekar, N.; Vivek, J.S.; Paramasivan, T.; Naushad, M.; Prakashmaran, J.; Gayathri, V.; Al-Duaij, O.K. Phytoremediation of heavy metals: Mechanisms, methods and enhancements. Environ. Chem. Lett. 2018, 16, 1339–1359. [Google Scholar] [CrossRef]
- Han, Y.; Zhang, L.; Yang, Y.; Yuan, H.; Zhao, J.; Gu, J.; Huang, S. Pb uptake and toxicity to Iris halophila tested on Pb mine tailing materials. Environ. Pollut. 2016, 214, 510–516. [Google Scholar] [CrossRef]
- Zheng, Q. The Study on Mechanism of the Treatment of Acid Mine Drainage Using PRB with Loess-Steel Slag. Ph.D. Thesis, Taiyuan University of Technology, Taiyuan, China, 2020. [Google Scholar] [CrossRef]
- Chinese Academy of Sciences, Editorial Committee of the Flora of China. Flora of China; Science Press: Beijing, China, 1993. [Google Scholar]
- Park, J.H. Contrasting effects of Cr(III) and Cr(VI) on lettuce grown in hydroponics and soil: Chromium and manganese speciation. Environ. Pollut. 2020, 266, 115073. [Google Scholar] [CrossRef] [PubMed]
- Dan, A.; Oka, M.; Fujii, Y.; Soda, S.; Ishigaki, T.; Machimura, T.; Ike, M. Removal of heavy metals from synthetic landfill leachate in lab-scale vertical flow constructed wetlands. Sci. Total Environ. 2017, 584, 742–750. [Google Scholar] [CrossRef]
- Maser, P.; Eckelman, B.; Vaidyanathan, R.; Horie, T.; Fairbairn, D.J.; Kubo, M.; Yamagami, M.; Yamaguchi, K.; Nishimura, M.; Uozumi, N.; et al. Altered shoot/root Na+ distribution and bifurcating salt sensitivity in Arabidopsis by genetic disruption of the Na+ transporter AtHKT1. FEBS Lett. 2002, 531, 157–161. [Google Scholar] [CrossRef] [Green Version]
- Wu, H. Plant salt tolerance and Na+ sensing and transport. Crop. J. 2018, 6, 215–225. [Google Scholar] [CrossRef]
- Fang, S.; Hou, X.; Liang, X. Response Mechanisms of Plants Under Saline-Alkali Stress. Front. Plant Sci. 2021, 12, 1–20. [Google Scholar] [CrossRef]
- Vymazal, J. Removal of heavy metals in a horizontal sub-surface flow constructed wetland. J. Environ. Sci. Health 2005, 40, 1369–1379. [Google Scholar] [CrossRef]
- Lesage, E. Behaviour of Heavy Metals in Constructed Treatment Wetlands; Ghent University: Ghent, Belgium, 2006. [Google Scholar]
- Wu, S.; Kuschk, P.; Wiessner, A.; Mueller, J.; Saad, R.A.B.; Dong, R. Sulphur transformations in constructed wetlands for wastewater treatment: A review. Ecol. Eng. 2013, 52, 278–289. [Google Scholar] [CrossRef]
- Aoyagi, T.; Hamai, T.; Hori, T.; Sato, Y.; Kobayashi, M.; Sato, Y.; Inaba, T.; Ogata, A.; Habe, H.; Sakata, T. Hydraulic retention time and pH affect the performance and microbial communities of passive bioreactors for treatment of acid mine drainage. AMB Express 2017, 7, 142. [Google Scholar] [CrossRef] [Green Version]
- Sanchez-Andrea, I.; Luis Sanz, J.; Bijmans, M.F.M.; Stams, A.J.M. Sulfate reduction at low pH to remediate acid mine drainage. J. Hazard. Mater. 2014, 269, 98–109. [Google Scholar] [CrossRef]
- Mulenga, C.; Clarke, C.; Meincken, M. Bioaccumulation of Cu, Fe, Mn and Zn in native Brachystegia longifolia naturally growing in a copper mining environment of Mufulira, Zambia. Environ. Monit. Assess. 2022, 194, 13. [Google Scholar] [CrossRef]
- Cruzado-Tafur, E.; Bierla, K.; Torro, L.; Szpunar, J. Accumulation of As, Ag, Cd, Cu, Pb, and Zn by Native Plants Growing in Soils Contaminated by Mining Environmental Liabilities in the Peruvian Andes. Plants 2021, 10, 241. [Google Scholar] [CrossRef] [PubMed]
Figure 1.
Comparison of the growth status of each plant before and after the experiment.

Figure 2.
The removal rates of (a) Mn; (b) Zn; (c) Cd in AMD with three sulfate concentrations vs. time. C1, C2 and C3 represent AMD with different sulfate concentrations (Table 3).
Figure 2.
The removal rates of (a) Mn; (b) Zn; (c) Cd in AMD with three sulfate concentrations vs. time. C1, C2 and C3 represent AMD with different sulfate concentrations (Table 3).


Figure 3.
Sulfate concentrations in three concentrations of AMD vs. time. C1, C2 and C3 represent AMD with different sulfate concentrations (Table 3).
Figure 3.
Sulfate concentrations in three concentrations of AMD vs. time. C1, C2 and C3 represent AMD with different sulfate concentrations (Table 3).
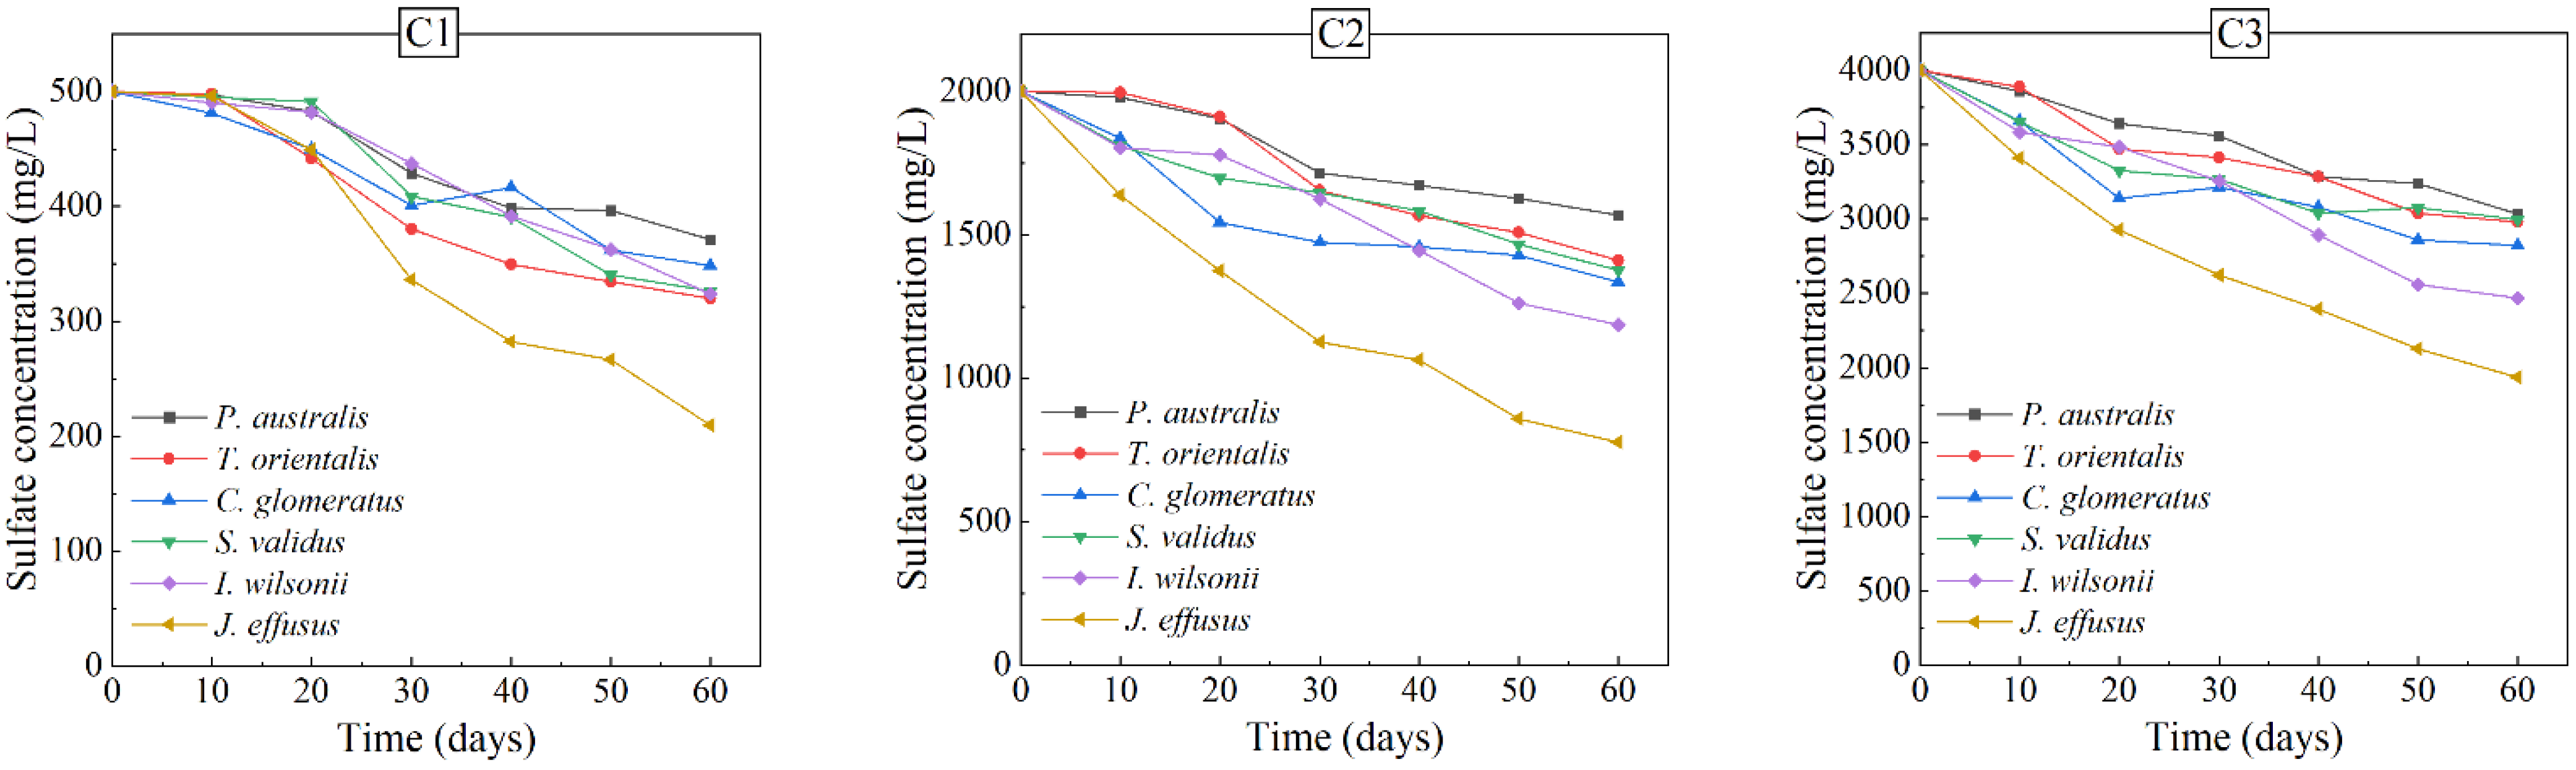
Figure 4.
Variation profiles of pH of the experimental water over the operation time. CK represents distilled water, and C1, C2 and C3 represent AMD with different sulfate concentrations (Table 3).
Figure 4.
Variation profiles of pH of the experimental water over the operation time. CK represents distilled water, and C1, C2 and C3 represent AMD with different sulfate concentrations (Table 3).

Figure 5.
Variation profiles of electrical conductivity (Ec) of the experimental water over the operation time.
Figure 5.
Variation profiles of electrical conductivity (Ec) of the experimental water over the operation time.

Figure 6.
The content and proportion of (a) sulfur; (b) Mn; (c) Zn; (d) Cd absorbed by the plant in C3 water samples.
Figure 6.
The content and proportion of (a) sulfur; (b) Mn; (c) Zn; (d) Cd absorbed by the plant in C3 water samples.

Figure 7.
Images and XRD patterns of precipitates on the plant surface.
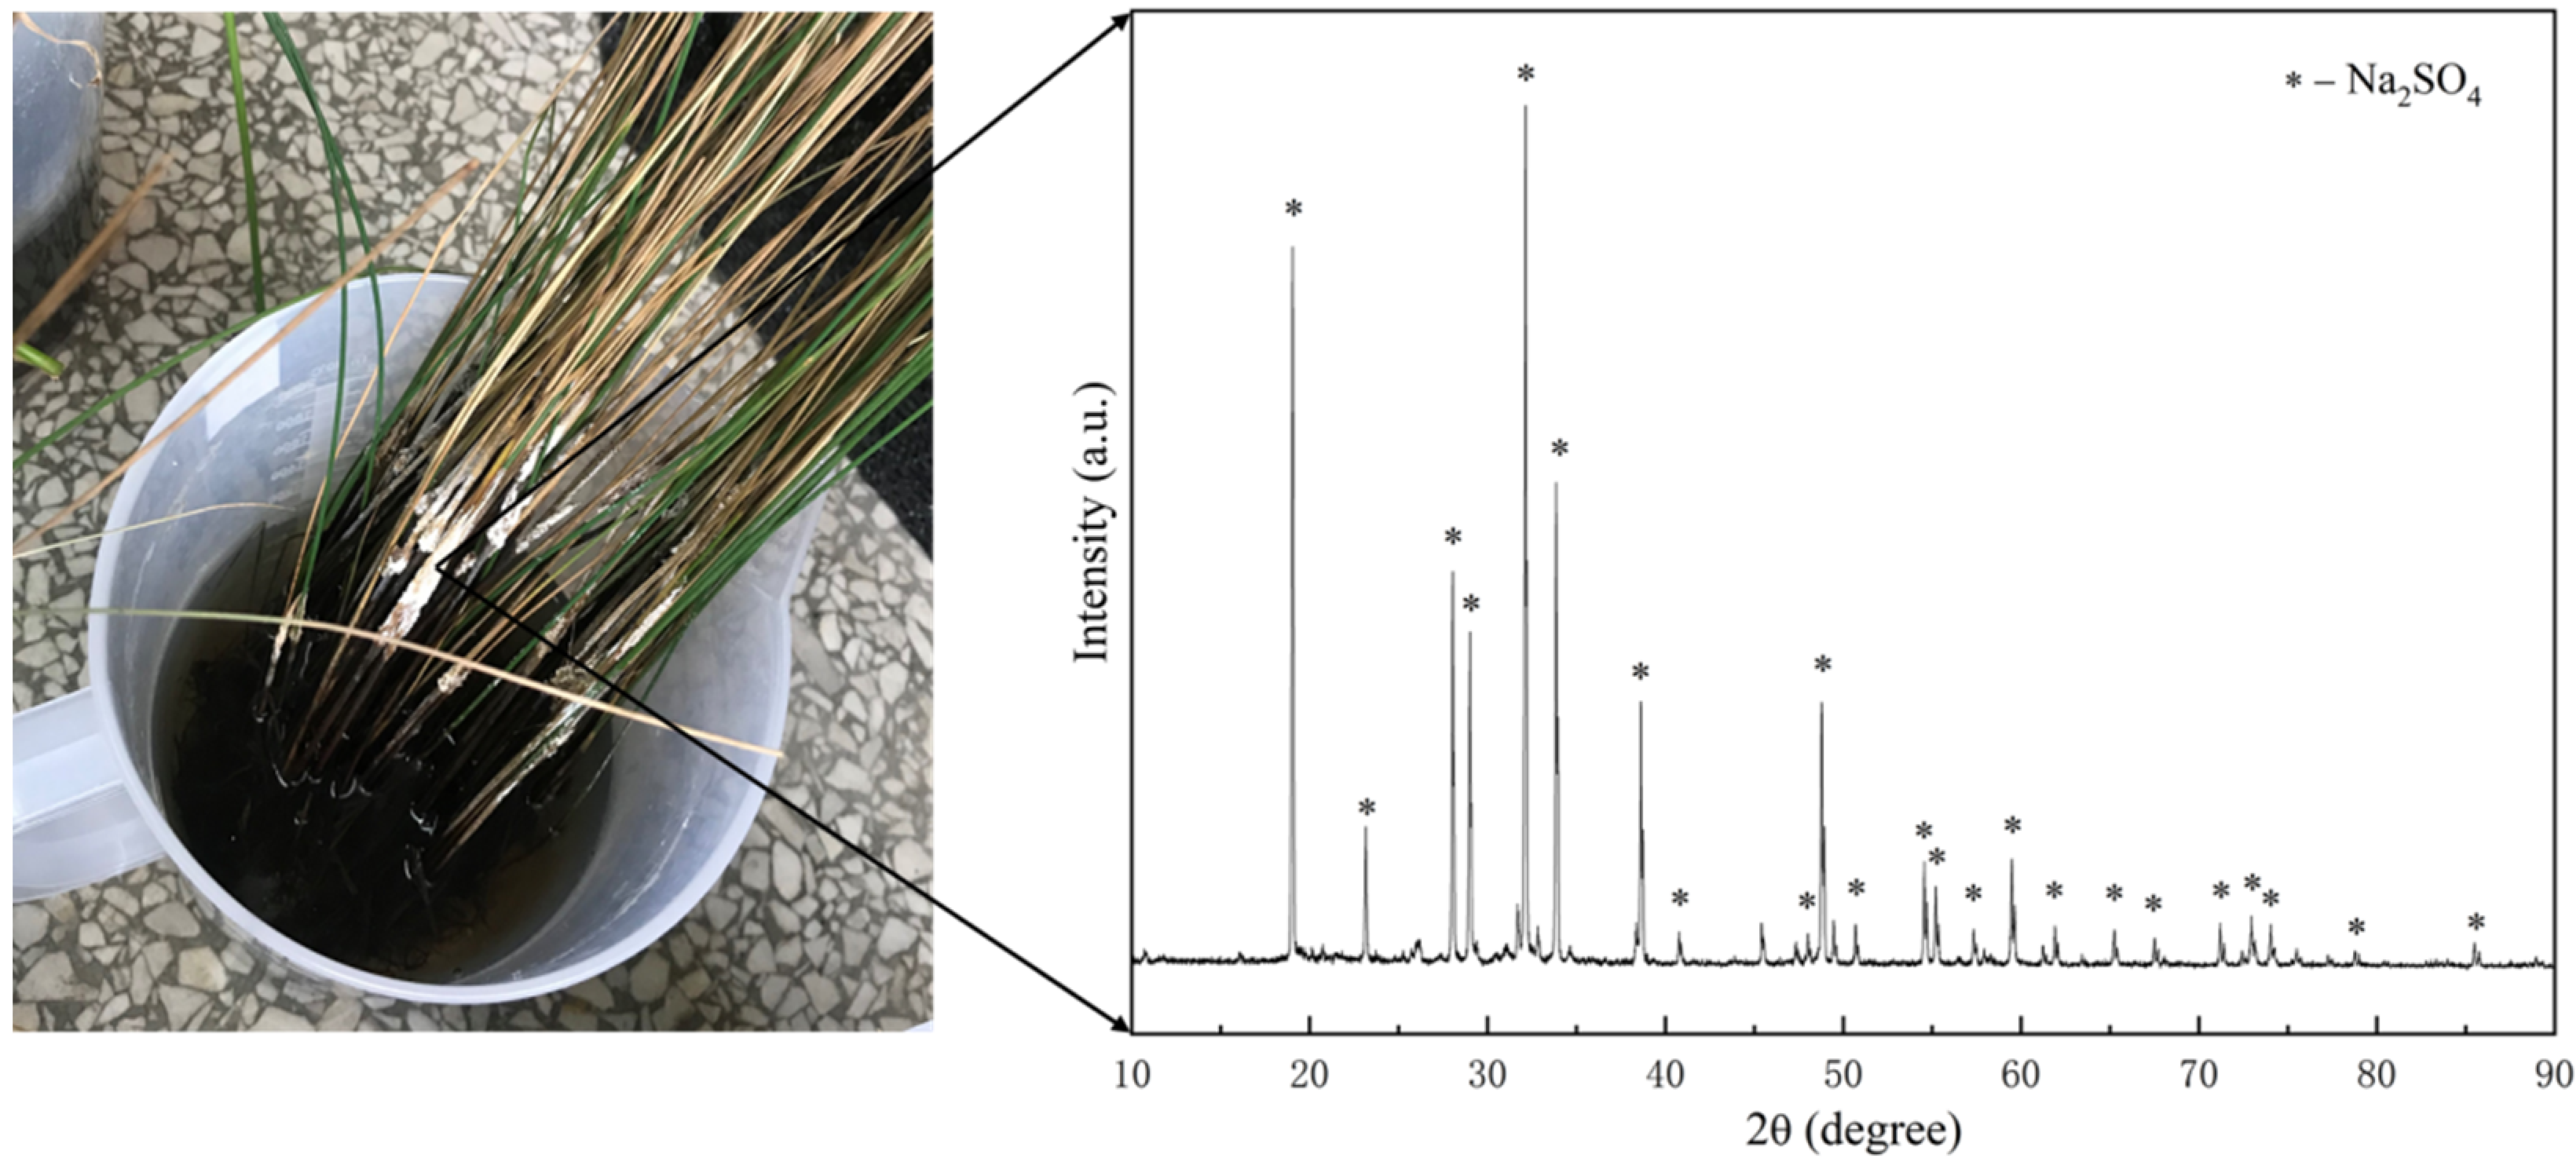
Figure 8.
XRD patterns of precipitates in water samples.


Table 1.
Chemical composition and target pollutant concentrations in AMD.
| Theoretical Concentration (mg/L) | Reagent Used | Amount (mg) Per L Water | |
|---|---|---|---|
| SO42− | 500 (C1) | Na2SO4 | 739.5833 |
| 2000 (C2) | 2958.3333 | ||
| 4000 (C3) | 5916.6667 | ||
| Mn | 18 | MnCl2 | 41.1853 |
| Zn | 10 | Zn (NO3)2·6H2O | 45.7677 |
| Cd | 0.5 | Cd (NO3)2·4H2O | 1.3721 |
| pH | 4 | HCl |
Table 2.
Ecological habits and economic value of tested plants [22].
Table 2.
Ecological habits and economic value of tested plants [22].
| The Plant | Ecological Habits | Economic Value |
|---|---|---|
| P. australis | The perennial aquatic herb that grows along irrigation ditches, riverbank marshes, etc. It is found throughout the world and often forms contiguous reed colonies due to its rapidly expanding reproductive capacity. | It can be used for making medicine, paper, weaving, and construction, and has ornamental value. |
| T. orientalis | Perennial aquatic or marsh herb grows in lakes, ponds, ditches, rivers in slow-flowing shallow water, also seen in wetlands and swamps, can withstand low temperatures of −30 °C. | It is a weaving material, can be used for making medicine, paper, food, and has ornamental value |
| C. glomeratus | A perennial herb of the Cyperaceae family, growing mostly in wet places or swamps. | It can be used for weaving and making medicinal |
| S. validus | Perennial emergent aquatic herb, produced in many provinces in China, growing in lakesides or shallow ponds, and can tolerate low temperatures. | It can be used for weaving and has ornamental value. |
| I. wilsonii | Perennial herb, with fibers of old leaves remaining at the base of the plant, born on mountain slopes, forest margins, and wetlands along riverside ditches, light-loving, also more shade-tolerant, cold-hardy. | It has great ornamental value and can also be used to make medicine. |
| J. effusus | Perennial herbaceous aquatic plants, suitable for growing by rivers, ponds, ditches, rice fields, grasslands, marshes. | It can be used to weave utensils and make medicines, and the pith of the stem can be used to make lamp wicks and pillow wicks, etc. |
Table 3.
Schemes for hydroponic experiments.
| Code | Experimental Water | pH | SO42− | Mn | Zn | Cd |
|---|---|---|---|---|---|---|
| mg/L | ||||||
| CK | Control group (distillate water) | 4 | 0 | 0 | 0 | 0 |
| C1 | Low sulfate concentration AMD | 500 | 18 | 10 | 0.5 | |
| C2 | Medium sulfate concentration AMD | 2000 | 18 | 10 | 0.5 | |
| C3 | High sulfate concentration AMD | 4000 | 18 | 10 | 0.5 | |
Table 4.
The growth state of each plant at the end of the experiment.
| The Plant | Large Number of New Shoots | Old Branches in Good Condition | No Root Rotted | No Pest Infestation | Aggregate |
|---|---|---|---|---|---|
| P. australis | × | √ | √ | √ | 3√ 1× |
| T. orientalis | × | × | × | × | 0√ 4× |
| C. glomeratus | √ | × | × | √ | 2√ 2× |
| S. validus | × | √ | × | × | 1√ 3× |
| I. wilsonii | × | √ | × | √ | 2√ 2× |
| J. effusus | √ | × | √ | √ | 3√ 1× |
The “√” indicates that the plant meets the growth status described in the table header, while the “×” does the opposite.
Table 5.
Metal concentrations and bioconcentration factors (BCFs) of six plants in C3 water samples.
Table 5.
Metal concentrations and bioconcentration factors (BCFs) of six plants in C3 water samples.
| Parameters | The Plant | Mn | Zn | Cd |
|---|---|---|---|---|
| Concentration(mg/kg) | P. australis | 171.75 ± 11.24 | 71.01 ± 5.68 | 5.67 ± 0.96 |
| T. orientalis | 210.55 ± 16.69 | 101.76 ± 10.57 | 5.54 ± 0.57 | |
| C. glomeratus | 406.12 ± 20.25 | 86.32 ± 8.98 | 6.03 ± 0.84 | |
| S. validus | 450.23 ± 15.55 | 111.83 ± 13.54 | 7.12 ± 1.11 | |
| I. wilsonii | 503.89 ± 23.57 | 171.00 ± 15.14 | 11.48 ± 1.21 | |
| J. effusus | 393.27 ± 8.89 | 121.38 ± 9.63 | 9.11 ± 0.98 | |
| BCF | P. australis | 9.54 | 7.10 | 11.35 |
| T. orientalis | 11.70 | 10.18 | 11.08 | |
| C. glomeratus | 22.56 | 8.63 | 12.06 | |
| S. validus | 25.01 | 11.18 | 14.24 | |
| I. wilsonii | 27.99 | 17.10 | 22.96 | |
| J. effusus | 21.85 | 12.14 | 18.23 |
Publisher’s Note: MDPI stays neutral with regard to jurisdictional claims in published maps and institutional affiliations. |
© 2022 by the authors. Licensee MDPI, Basel, Switzerland. This article is an open access article distributed under the terms and conditions of the Creative Commons Attribution (CC BY) license (https://creativecommons.org/licenses/by/4.0/).
Share and Cite
MDPI and ACS Style
Wu, A.; Zhang, Y.; Zhao, X.; Li, J.; Zhang, G.; Shi, H.; Guo, L.; Xu, S. Experimental Study on the Hydroponics of Wetland Plants for the Treatment of Acid Mine Drainage. Sustainability 2022, 14, 2148. https://doi.org/10.3390/su14042148
AMA Style
Wu A, Zhang Y, Zhao X, Li J, Zhang G, Shi H, Guo L, Xu S. Experimental Study on the Hydroponics of Wetland Plants for the Treatment of Acid Mine Drainage. Sustainability. 2022; 14(4):2148. https://doi.org/10.3390/su14042148
Chicago/Turabian StyleWu, Aijing, Yongbo Zhang, Xuehua Zhao, Jiamin Li, Guowei Zhang, Hong Shi, Lina Guo, and Shuyuan Xu. 2022. "Experimental Study on the Hydroponics of Wetland Plants for the Treatment of Acid Mine Drainage" Sustainability 14, no. 4: 2148. https://doi.org/10.3390/su14042148
Note that from the first issue of 2016, this journal uses article numbers instead of page numbers. See further details here.