
Seasonal Abundance and Distribution Patterns of Microplastics in the Lis River, Portugal


1
MARE—Marine and Environmental Sciences Centre, NOVA School of Science and Technology, NOVA University Lisbon, 2829-516 Caparica, Portugal
2
CENTIMFE—Technological Centre for the Mouldmaking, Special Tooling and Plastic Industries, 2430-028 Marinha Grande, Portugal
*
Author to whom correspondence should be addressed.
Sustainability 2022, 14(4), 2255; https://doi.org/10.3390/su14042255
Submission received: 15 January 2022
/
Revised: 13 February 2022
/
Accepted: 14 February 2022
/
Published: 16 February 2022
(This article belongs to the Special Issue Microplastics and Their Potential Effects in Aquatic Organisms and Ecosystems)
Abstract
:The majority of microplastics (MP) found in the marine environment have land-based sources and rivers are known as carriers of these particles to the ocean. This work is the first to study MP in the Lis River Basin and coastal shoreline (total nine sampling sites) and the potential relationship with inputs from 105 companies/units. We report the seasonal abundance, typology, colour, size, and polymer distribution of MP in surface water and sediment. To the collected samples, a digestion protocol was applied, followed by filtration. For sediment, an MP density separation was performed prior to filtration. MP were mostly fibres (0.02 to 1111.11 items.m−3 in water and 10.66 to 1609.64 items.kg−1 in sediment) and fragments (0.02 to 2311.11 items.m−3 in water and 10.66 to 501.01 items.kg−1 in sediment). The most frequent colours were transparent and blue, and MP were mostly smaller than 1 mm in water and 2 mm in sediment samples. The most abundant polymers in water were polyethylene (37%), polyacrylate (18%) and polystyrene (18%), and in sediment, polyethylene terephthalate (29%) and polyacrylate (23%). Population density, plastic processing companies and meteorological factors were found to be associated with seasonal MP abundance and distribution patterns in the Lis River Basin.
1. Introduction
Ocean pollution is dramatically changing the marine ecosystem and our climate, negatively impacting life on Earth. Synthetic plastics (SP), produced since 1950 [1], are made of synthetic organic polymers, which are usually produced through the polymerisation of monomers derived from oil, gas, or coal [2]. Nowadays, around 30,000 polymers are registered in the European Union [3], and polyethylene (PE), polypropylene (PP), polystyrene (PS), polyethylene terephthalate (PETE), polyvinyl chloride (PVC) and polyurethane (PU) make up 82% of the total plastic consumption (by weight) [4].
Accumulated production of virgin SP is estimated to have reached 8300 million metric tons (Mt), and 6300 Mt of plastic waste was generated between 1950 and 2015, of which 9% was recycled, 12% incinerated and 79% accumulated in dumps or the natural environment [5]. If the current trend does not change, roughly 12,000 Mt of plastic waste will end up in landfills or the natural environment by 2050. The exponential growth in plastic production associated with inefficient waste management at the global scale is leading to negative effects on the environment [5].
The breakdown of SP in the environment results in smaller plastic particles, mainly microplastics (MP) within the size range of 1 µm to 5 mm [6]. MP are emerging environmental pollutants, ubiquitous in the atmosphere, water and soil [7,8,9].
Depending on their density, MP can remain at the water surface, be suspended in the water column, or sink [10], while weathering and biofouling enhance the transport to the seabed and the ingestion by pelagic and benthic organisms [11]. According to an online database [12], 3475 species have ingested plastics in marine ecosystems.
MP are known to adsorb trace metals and persistent organic pollutants from the environment and leach out toxic chemicals added to plastics during manufacture to enhance performance; therefore ingestion poses an additional threat to organisms and food webs [13] and can ultimately affect human health [14].
MP can be classified as primary or secondary, and various typologies are present in the environment [6]. Primary MP comprise manufactured plastic particles, such as pellets used as feedstock for plastic packaging and moulding [15,16], and microbeads used in personal care products [17]. Secondary MP result from the degradation and fragmentation of larger plastic items exposed, for example, to UV radiation and wave action [11].
Pellets are common in locations near plastic processing plants due to losses during transport and operation [18], while microbeads may be present in industrial and domestic wastewater and enter the ocean via rivers and estuaries [19]. Pellets can also be found in remote areas far from pellet processing plants [8]. These findings suggest that their transport from one point to the other is assisted by natural environmental conditions [20]. Microbeads are present in exfoliating facial scrubs, toothpaste and shower gels and can enter the marine environment through wastewater discharges [19]. Fragments are considered irregular-shaped hard particles that break down from larger items [20] by photo-degradation and mechanical abrasion (such as on exposed shorelines or at the sea surface), which causes the plastic to become brittle [11]. Fibres are fibrous materials with a length substantially longer than their width, originating from the shedding of synthetic fabrics and ropes [21]. Foam is a lightweight thermoplastic with shock-absorbing properties, used for insulation in construction and as packaging material [22]. Films can be associated with shopping bags or greenhouse coverings that can accumulate in soils [23], and are also linked to plastic mulching, a technique used to increase agricultural yield [24].
Nearly 80% of the plastic in the ocean originates from land-based sources, either from voluntary or involuntary dumping, urban discharges and surface runoff [25,26]. Rivers are crucial pathways for anthropogenic waste and transport 0.41 to 4 Mt of plastic to the oceans every year [25]. The top 20 polluting rivers are responsible for 67% of the global plastic input to the ocean, and 15 of these rivers are in Asia [27]. In Europe, the Danube and the Rhine River are the two major contributors to ocean pollution. Annually, they move plastic loads of 530 to 1500 tonnes and 20 to 31 tonnes towards the Black and the North Sea, respectively [28]. Studies assessing MP pollution in rivers in France [29,30] and Australia [31] confirmed that MP abundance was mostly influenced by urban areas, industrial and agriculture activities. In Portugal, high concentrations of MP in relation to wastewater treatment plants (WWTP) effluents, boat docks and urban/industrial zones were reported in the Douro [32] and Antuã rivers [33]. Despite these important findings, there are no data regarding the seasonal variation in MP abundance and flux. Insight into the interplay between regimes along a river catchment is required. While anthropogenic activity will determine MP pollution levels at a given river section, different river discharge regimes will dictate the total MP fluxes downstream [25], and interaction with microorganisms that promptly colonise plastic, modifying its density, will drive particle behaviour in the water column, adding further complexity to MP spatial distribution [34,35]. The study of MP properties (typology, colour, size, and polymer composition) contributes to elucidating their origin and provide insight into the drivers of their ingestion by aquatic organisms [36,37,38]. Field data on abundance and distribution patterns of MP are essential to understand sources and transport, and is a prerequisite for managing, preventing and reducing pollution. This work documents MP found in the Lis River, Portugal, over four seasons (2019–2020) with the following objectives: (1) to characterise MP in water and sediment along the river and determine their spatial and temporal distribution and abundance, (2) to evaluate relations between MP and watershed attributes, such as population density, plastic processing companies (manufacturers, suppliers and recycling units), solid waste management units and WWTP contributions, to further develop collaborative actions to mitigate plastic pollution in the Lis River watershed.
2. Materials and Methods
2.1. Study Area—The Lis River
The hydrographic basin of the Lis River, with an S–NW dominant orientation and a total area of 850 km2, is in the central region of Portugal, covering all or part of the following municipalities: Leiria, Batalha, Marinha Grande, Porto de Mós and Ourém. It runs across the city of Leiria, extensive agricultural zones and reaches the Atlantic Ocean at Vieira Beach, covering a length of approximately 39.5 km. The river and its tributaries show strong seasonal regimes, with water deficits during dry periods. The Lis River is an important inland water resource for domestic, industrial, and irrigation purposes in the Leiria region, where several industrial units operate, such as plastic products manufacturers, suppliers and recyclers, solid waste management units and WWTP [39]. According to the model in [40], 1500 kg of plastic are discharged annually by the Lis River to the ocean.
A total of eight sampling sites were selected considering the location of the potential contributors to MP pollution along the river, including two points located on the coast: one to the north and the other to the south of the river mouth to assess river contributions to the coastal zone. Characteristics of sampling sites and their location are shown in Table 1 and Figure 1.
2.2. Sampling
Samples were collected in July 2019, November 2019, February 2020 and May 2020. The methods used were adapted from [42] for water and [43] for sediment samples. Water samples were collected in the river using two plankton nets (150 µm mesh size) with different sizes according to the depth at each site (Ø 25.5 cm in shallow areas and Ø 40 cm in deeper areas). Depending on the river width and ease of access for collection, nets were deployed at the midpoint between margins, from the margin, or bridges, for 3 to 20 min and surface current velocity was calculated by counting the time that a floating object would take to travel a known distance. Sediment samples were collected from a 25 cm × 25 cm area in triplicate, with a metal shovel and placed directly in a metal box, or by underwater pumping and filtered in situ onto a metal sieve (63 µm mesh size) when the bottom was rocky and/or covered with shallow. Due to terrain conditions and the artificial river bottom, it was not possible to collect sediment samples at Arrabalde and Bóia. All samples were kept frozen until analysis.
2.3. Laboratory Procedures
2.3.1. Water
Samples were defrosted at room temperature and processed according to the methods described in [42]. A digestion protocol using a 10% KOH filtered solution was applied to eliminate the organic matter (OM—algae, organisms, and plant debris). Digestion took 24 h to 168 h depending on the amount of OM. Samples were then filtered with a Millipore vacuum pump onto glass fibre filters (GF/C 1.2 µm pore, Ø of 47 mm), which were dried at room temperature and stored individually in labelled Petri dishes.
2.3.2. Sediment
After defrosting, a sediment subsample (50 g in triplicate) was dried at 60 °C for 24 h and a digestion protocol was applied (10% H2O2 filtered solution). Once digestion was considered complete, which took 24 h, samples were rinsed with filtered Type II water over a metal sieve (63 µm mesh size) to cleanse the digestion solution, and a density separation procedure was performed to isolate MP using a 10% ZnCl2 filtered solution (1.5 g.cm−3) in a sediment microplastic isolation unit (SMI), as described in [44]. After this process, the supernatant was filtered using the same methodology of water samples.
2.4. Microplastics Characterisation
Visual direct analysis of the filtered material was made under a stereoscopic microscope (Leica MZ12.5), with a magnification of 0.8 to 10×, for both water and sediment samples. Suspected MP were sorted by (1) typology: fibres (thin lengthened particles), fragments (irregular-shaped particles), pellets (spherule/cylindrical particles), microbeads (perfect spheres), foams (sponge-like, compressible and/or lightweight particles) and films (thin flexible sheets), and (2) colour (black, blue, white, transparent, red, green, multicolour and other). Particles and fibres were photographed with a Leica DFC480 digital camera using Irfanview Graphic Viewer and Leica Application Suite X version 3.0.14.23224 and measured with ImageJ software, and 5 size classes were considered: <1 mm; 1 to <2 mm; 2 to <3 mm; 3 to <4 mm; 4 to 5 mm. Particles and fibres were separated onto concave microscope slides and covered until the polymer analysis.
2.5. Polymer Identification
To confirm that sorted particles and fibres had a synthetic plastic origin and to determine their polymer type, a subsample of 30% of the total particle observed was selected, to cover as much as possible the diversity found within each of the typologies, according to the best expert judgement on the similarity of texture, thickness, shine, shape, size and colour. Polymer identification was performed by Fourier transform infrared (FTIR) spectroscopy in attenuated total reflectance (ATR) mode. For particles in the 0.30 to 5 mm size range, spectra were acquired using a Spectrum Two FT-IR spectrometer with an MTC detector and a diamond ATR sample interface. For smaller particles and fibres (in the 0.01 to 4 mm size range), analyses were carried out at Instituto Hidrográfico (IH, Portuguese Navy Agency), on a µ-FTIR spectrometer (Spotlight 200i Microscope System), equipped with an MCT detector to collect spectra with a microscope aperture of 100 μm × 100 μm, using a strong Norton–Beer apodization. All spectra were acquired at room temperature under reflectance mode with a resolution of 4 cm−1 and 1 cm−1 wavenumber intervals, within the range of 4000 to 500 cm−1 by accumulating 4 scans. A background scan was performed before any analysis series. Polymer identification relied on a match > 90% between the sample and a referenced database [45] and the assignments were confirmed by analysis of the polymer’s characteristic bands [46,47,48].
2.6. Contamination Control
All used materials were made of glass or metal, and plastic was always avoided during field or laboratory work. Type II water and digestion solutions were filtered before use and samples were kept covered as much as possible. During laboratory procedures, special caution was taken regarding airborne MP contamination by using cotton lab coats and placing blank filters throughout the working area. MP present in blanks were discounted from the samples.
2.7. Statistical Analysis
Nonparametric statistical analyses were performed, after invalidation of homogeneity of variances as determined by Levene’s test. The Mann–Whitney U test (p < 0.05) was used for pairwise comparisons between MP abundances, characteristics (typologies, polymer type and colours) and sampling sites along the Lis River, in distinct seasons. Principal component analysis (PCA) was conducted to evaluate the possible contribution of several variables to MP abundance (including typologies) during the year and for each season. The variables studied were: population density [41] associated with each sampling site, the number of companies/units (plastic products manufacturers and suppliers, recycling units, solid waste management units and WWTP) with potential MP inputs located less or more than 10 km away from each sampling site, seasonal precipitation and wind averages [49] and current velocity measured in situ. The significance level established was 95% (α = 0.05) for all the analyses. All calculations were performed with Statistica 11 (Stastsoft) software.
3. Results
3.1. Microplastics in Water
MP abundance was highly variable in water samples as shown in Figure 2, ranging from 0.05 items.m−3 at the Lis River mouth in summer to 3422.22 items.m−3 at Fontes in autumn, with an annual average of 203.60 ± 727.80 items.m−3. Despite this variability, the average abundance was higher at Fontes (the most upstream site) and at Lis River mouth (867.38 ± 1475.05 and 233.78 ± 397.97 items.m−3, respectively), and lower at the middle river course, from Olhalvas to Bóia (5.33 ± 3.77 items.m−3).
In summer, MP spatial distribution decreased downstream to the river mouth, while in autumn and winter a decrease was observed at the middle river course (MdP and A sites, respectively), followed by an increase downstream. In spring, a decrease in MP abundance was observed from Fontes to Olhalvas, and then it remained within the same order of magnitude downstream to the river mouth (Figure 2).
MP abundance found at Fontes (3422.22 items.m−3) was significantly higher compared to other sampling sites. At Olhalvas, a significant abundance of MP (13.84 items.m−3) was found in summer (Mann–Whitney, p < 0.05). From Moinho de Papel down to Bóia, the abundance averages were in the same order of magnitude (autumn: 7.69 ± 3.62; winter: 3.49 ± 1.77; spring: 5.24 ± 0.22 items.m−3) except in summer, when the values were lower (0.56 ± 0.11 items.m−3). At Moinho de Papel, the highest abundance was registered in spring (5.33 items.m−3), while at Arrabalde, Bóia and Lis River mouth, the highest values were registered in autumn (10.48, 10.02 and 923.08 items.m−3, respectively) (Figure 2).
3.2. Microplastics in Sediment
The abundance of MP in the sediment ranged from 102.22 ± 6.29 items.kg−1 (at South Vieira Beach in spring) to 2206.59 ± 182.78 items.kg−1 (at Moinho de Papel in autumn), and the annual average was 565.23 ± 85.94 items.kg−1. Considering all seasons, MP average abundance was the highest at Moinho de Papel (918.52 ± 769.38 items.kg−1) and lower upstream (556.98 ± 348.36 items.kg−1) and downstream (452.96 ± 297.56 items.kg−1) (Figure 3).
As shown in Figure 3, the spatial distribution of MP showed an increasing pattern from Fontes to Moinho de Papel, where abundance was significantly higher in autumn (2206.59 ± 182.78 items.kg−1), followed by a significant decrease to LRM (Mann–Whitney U test, p < 0.05). The inverse was observed in winter, when a decrease occurred from Fontes to Moinho de Papel, which had the lowest MP abundance (170.56 ± 91.70 items.kg−1), followed by an increase to LRM (Mann–Whitney U test, p < 0.05).
At Fontes, the highest MP abundance was registered in winter (1097.96 ± 128.80 items.kg−1) and showed similar average values in the other seasons (316.24 ± 13.30 items.kg−1) (Mann–Whitney test, p < 0.05). At Olhalvas, significantly higher values were found in autumn and winter (1129.94 ± 404.79 and 714.21 ± 60.30 items.kg−1, respectively) when compared with summer and spring (277.16 ± 120.60 and 287.82 ± 26.11 items.kg−1, respectively) (Mann–Whitney U test, p < 0.05). At Lis River mouth (LRM), the abundance was significantly lower in summer and spring (180.00 ± 55.24 and 164.44 ± 8.31 items.kg−1, respectively), when compared with autumn and winter (673.33 ± 158.61 and 722.22 ± 43.66 items.kg−1, respectively) (Mann–Whitney U test, p < 0.05). At the beach (NVB and SVB), MP abundances were significantly higher in autumn (1060.00 ± 56.57 and 786.67 ± 51.93 items.kg−1, respectively), when compared to other seasons (Mann–Whitney U test, p < 0.05) (Figure 3).
3.3. Microplastics Types
Fibres and fragments were the most abundant typologies of MP in water (0.02 to 1111.11 items.m−3 and 0.02 to 2311.11 items.m−3, respectively) and sediment (10.66 to 1609.64 items.kg−1 and 10.66 to 501.01 items.kg−1, respectively) as shown in Figure 4. Significantly higher amounts of fibres and fragments were found in water in autumn, and in the sediment along the year (Mann–Whitney U test, p < 0.05) when compared with the other MP typologies.
Foams occurred occasionally and were significantly abundant at Olhalvas (Mann–Whitney test, p < 0.05) in summer (127.92 ± 78.33 items.kg−1). Pellets, microbeads and films were also found in water at different sampling points, however, no significant differences in abundance were found (Mann–Whitney U test, p > 0.05).
Except at Fontes, the most upstream point, pellets were found in sediment from all sampling sites, but their abundance was only significantly higher (Mann–Whitney U test, p < 0.05) in winter on the coast (NVB, 195.56 ± 49.09 items.kg−1). Films were significantly more abundant in autumn at Olhalvas (106.60 ± 91.70 items.kg−1) (Mann–Whitney U test, p < 0.05) when compared with the other seasons. The abundance of microbeads was significantly higher at MdP in summer (7.11 ± 10.05 items.kg−1) (Mann–Whitney U test, p < 0.05), and occurred in small numbers in the water upstream (at Fontes—F), and in autumn in the sediment downstream (at LRM) and on the coast (SVB).
3.4. Microplastics’ Colour and Size
Fibres in water and sediment were predominantly transparent (74 and 44%, respectively), namely in autumn and winter (Mann–Whitney test, p < 0.05). In summer, dominance shifted to black (75 and 54%, respectively) (Mann–Whitney U test, p < 0.05) (Figure 5a,c). Fragment colours were significantly more varied than fibres (Mann–Whitney test, p < 0.05) and predominantly blue (30%) in water (Figure 5b,d). Pellets in water were mostly black (50%) and blue (50%), while in the sediment a significantly higher number of transparent ones were found (Mann–Whitney test, p < 0.05). Microbeads were mostly black (87% in water and 48% in sediment) and transparent (52% in sediment), foams were white, and all films were transparent.
Except for pellets and films, MP found in the water were generally smaller than those in the sediment. In water samples, fibres (ranging from 99 to 4884 µm), fragments (14 to 4726 µm), microbeads (177 to 435 µm) and foams (86 to 935 µm) were predominantly smaller than 1 mm. Although MP in the sediment showed more variable size ranges, fibres (20 to 5000 µm), fragments (27 to 5000 µm), microbeads (406 to 689 µm) and foams (475 to 2126 µm) were mostly smaller than 2 mm. Pellets ranged from 4 to 5 mm in water and 1 to 5 mm in sediment, and films had the same size range in water and sediment (3 to 4 mm).
3.5. Microplastics’ Polymer Composition
FTIR analyses (Figure 6) showed that 79% of the particles were plastic polymers, while 21% were non-plastic or could not be identified. The most common polymers in water samples were polyethylene (PE, 37%), polyacrylate (PAcr, 18%) and polystyrene (PS, 18%), while polyethylene terephthalate (PETE, 29%) and PAcr (23%) were the most common in sediment (Figure 7).
Other polymers such as polypropylene (PP), polyvinyl chloride (PVC), polycarbonate (PC) and nylon were also identified (Figure 6 and Figure 7). The highest diversity in MP polymer composition was registered in winter. Olhalvas registered a higher diversity of polymers when compared with other locations, as all types of polymers were present at this site (Mann–Whitney test, p < 0.05).
Fibres were essentially made of PAcr, PETE and PP and were present at all sampling points, either in the water or the sediment, all seasons considered. PAcr was the only polymer found in fibres in Olhalvas sediment, near the WWTP in summer, and it was also abundant in the water at the Lis River mouth (LRM). PETE was dominant (max. 73%) upstream, from Fontes to Moinho de Papel, except in autumn and winter where a higher proportion was found downstream to the beach, especially in the sediment, probably due to higher precipitation levels. PP (max. 67%) showed roughly the same pattern with a higher proportion downstream in autumn. PE fibres (max. 42%) were only found in winter and spring, occurring mostly in water at all sampling points, but predominantly upstream from Bóia (B) in winter and in the sediment at the Lis River mouth (LRM) and beaches (NVB and SVB) in spring. No significant differences in the temporal or spatial distribution of polymers were found, except for PS fibres (1–5%) in sediment which were significantly more abundant in autumn at Moinho de Papel, an urban area after the WWTP (Mann–Whitney test, p < 0.05) (Figure 7a,c).
Fragments were mainly PE, PP and PVC. Due to its higher density, PVC was mostly found in sediment. PS fragments were found upstream (F, O and MdP, 12–75%), except in winter, when they were also found at the middle course of the river (Arrabalde, 21%). In winter, two sporadic occurrences in sediment were registered, PC fragments at Fontes and Olhalvas (9 and 44%, respectively) and PAcr fragments at Fontes (50%) (Figure 7b,d). Pellets and microbeads made of PE, and foams and films made of PS, were present in small numbers (Figure 4). Foams, however, were significantly more abundant in summer near the WWTP at Olhalvas, as mentioned above.
4. Discussion
4.1. Microplastics’ Spatial and Temporal Abundance in Water and Sediment
The high MP variability can be associated with several factors, namely population density, plastic processing companies [33], waste management units [50], WWTP [32] and meteorological factors [51,52]. Once introduced in the water, MP sedimentation can be induced by several factors, namely MP properties (e.g., polymer density), river current, river geomorphology [53] and soil permeability (associated with predominant storage, retention, and deposition of particles) [54]. MP pollution is also highly variable within catchments, with differences up to a factor of 250 times as already reported [29]. According to the model in [40], 1500 kg of plastic are discharged from the Lis River to the ocean per year; however, there are no data regarding MP contributions.
Comparison with other studies is limited due to the lack of standardisation of methodologies. However, it is possible to understand that the MP abundance in water samples (0.05 to 3422.22 items.m−3), collected with a 150 µm mesh, was higher than those reported for the Rhône River (2.4 to 88.4 items.m3) [30], Great Lakes tributaries (0.05 to 32 items.m−3) [55] and Danube River (0.00 to 141.65 items.m3) [56], collected with larger meshes (300, 333 and 500 μm respectively). Using smaller mesh sizes, in the Henares River (in the upper Tagus River Basin in Spain), MP abundance ranged from 850 to 11,550 items.m−3, using a 55 μm mesh [57] and in the Hunter River, Australia from 431 to 1892 items.m3, using a 37 μm mesh [31]. Considering other studies in Portugal, our values were lower than those reported for the Douro River (26,000 to 372,000 items.m−3), which drains a much larger watershed and where samples were collected without any filtration [32], and were higher than those found in the Antuã River (58 to 1265 items.m−3, using a 55 µm mesh size), similar in length to the Lis River, but with a much smaller watershed area supporting a high population density, industrial and tourism activities and WWTP [33].
The MP abundance range in sediment (102.22 to 2206.59 items.kg−1) was higher than the one registered in the Brisbane River, Australia (10 to 520 items.kg−1) [58] but similar to the Rhine River, Germany (228 to 3763 items.kg−1) [59]. When compared with other rivers of the Iberian Peninsula, the values were similar to those reported for the Henares River (0 to 2910 items.kg−1) [57] but higher than those found in the Antuã River (18 to 629 items.kg−1) [33], consistent with what was mentioned above in the water.
The high concentrations of MP, in particular fibres and fragments (Figure 4), registered at Fontes (F), closest to headwaters with no plastic processing companies upstream, could be related to the manual washing of clothes in the river (observed in situ), and also influenced by the low current velocity (Figure S1), which increases the residence time of these particles, as described in [29].
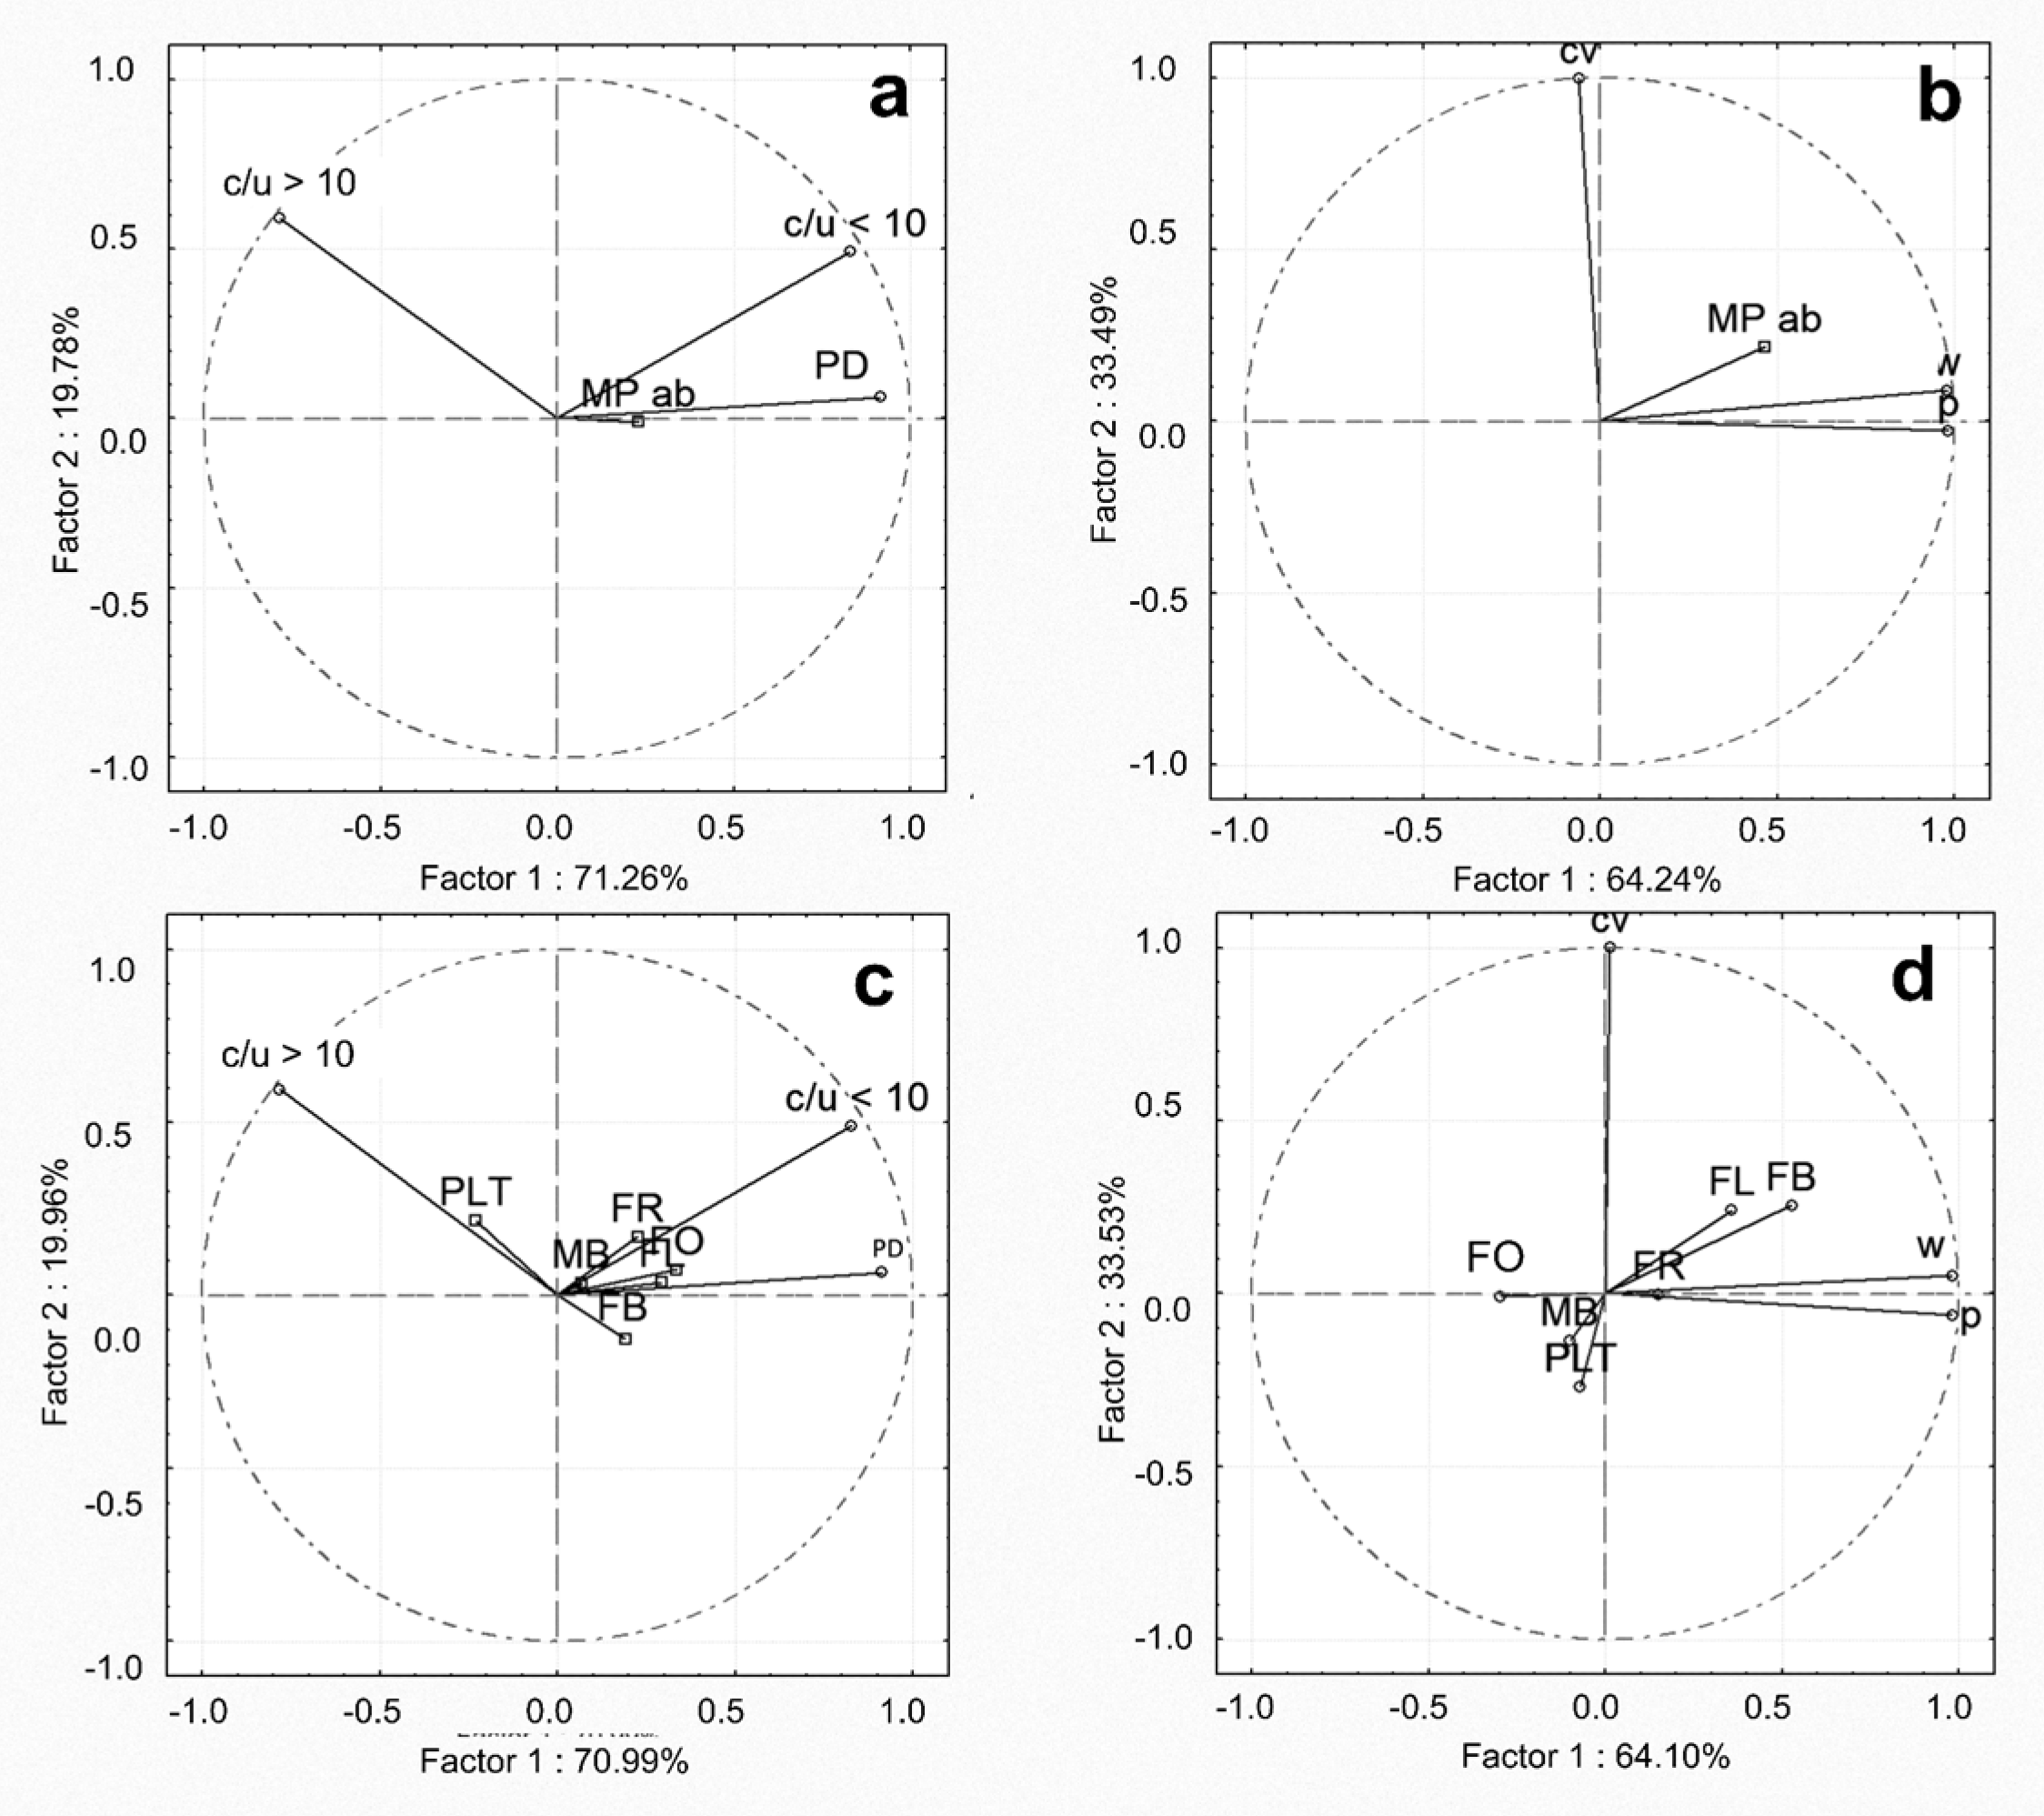
In summer, low precipitation levels (Figure S2) and low current velocity (Figure S1), may have increased MP residence time, which could explain the high concentration of MP in the water at Olhalvas (O), an urban area located next to the WWTP and close to plastic products manufacturers and suppliers. Plastic processing companies, WWTP located less than 10 km away, and population density, seem to contribute to the predominance of foam in summer at O, (Figure 4a) as confirmed by PCA (Figure S3c), while in sediment in autumn, they generally contribute to the high MP abundance (Figure S4a). In contrast, the high current velocity observed in autumn explains the abundance of films (Figure S4d). Correlations between MP abundance and urban-related attributes have been already reported [33]. Moreover, a previous study [29] demonstrated that spatial variability in MP abundance observed at the catchment level was powered by urbanisation.
MP abundance in sediment increased upstream from F to MdP, except in winter when the reverse was observed (Figure 3). Population density and plastic processing companies, solid waste management units and WWTP located at less than 10 km were found to be correlated with MP abundance, namely fragments, foams, and films (Figure 8a,c). Wind, precipitation and current velocity also explained MP abundance during the year, namely fibres, fragments and films (Figure 8b,d), which could justify the transport of these particles from F to MdP. In particular, the abundance of fibres can be related to runoff events [60] and wet deposition [61]. Higher MP values found in sediment at MdP suggests this is an accumulation (Figure 3), possibly due to low flow conditions (Figure S1). Another study [29] also demonstrated that higher MP abundance was observed in low flow conditions.
Heavy rains in autumn seem to have contributed to the transport of MP downstream to Arrabalde, Bóia and to the Lis River mouth (LRM), where the second-highest MP abundance in water was registered (923.08 items.m−3). The presence of plastic processing companies, a solid waste management unit and WWTP in this area does not explain the abundance of MP found in water (Figure S5a) but explained MP abundance in sediment (Figure S5a), probably reflecting the accumulation of long-term MP inputs. Theoretically, particles present in the river may accumulate at the river mouth, after which, they can be dragged to the ocean, as reported before [62], thus a fraction of MP transported by the river may sink at the river mouth, while another fraction may be carried to the ocean, depending on the interplay of particles properties and hydrodynamics at the river mouth.
River current velocity, plastic processing companies and WWTP located less than 10 km away could explain MP abundance at the coastal beach in autumn (Figure S4a,b, respectively), in relation to the high precipitation registered then (Figure S2). Wind action also favours atmospheric transport of fibres to freshwater ecosystems [7]. Nevertheless, MP found at the beach, showed high variation, which may be influenced by other factors, such as tides which can also contribute to inputs from the ocean [63].
4.2. Microplastic Types
The predominance of fibres and fragments among MP types (Figure 4) is not surprising and agrees with previous works from several parts of the world [30,32,33,57,64,65]. Effluents from WWTP seem to be an important source of fibres coming from laundry, as already reported [66]. It was found that a single garment can produce more than 1900 fibres per wash [67]. Dense polymers may remain in the soil while lighter polymers can be easily transported by wind and water runoff [68]. Plastic mulching [24,68], municipal waste [32,69] and plastic-coated fertilizers [3] are also sources of MP.
Microbeads, films and foams were registered occasionally or in low numbers and the same was reported in the Henares River (Spain) [57], and the Rhône and Têt Rivers (France) [30]. The presence of microbeads in water and sediment was also reported in the Ebro River [64]. Microbeads can be found in personal care products, and due to their small size, are not retained by WWTP [19]. Films and foams are currently used in many applications from shopping bags [70], to packaging [71,72], from wrapping and greenhouse coverings in agriculture [73] to insulation in the construction industry and, therefore their presence in the Lis River water and sediment may originate from various points of entry, including diffuse sources, and are dependent on multiple factors, from littering to losses from inadequate waste management combined with co-variating environmental and weather conditions [22].
Plastic pellets have been associated with urban-related watershed attributes (i.e., urban land cover, imperviousness and population density) [55], however, in the Lis River, they were negligible, becoming slightly more numerous at the beach, as reported for the Antuã River [33]. Coastal currents may transport plastic particles from different places along the coast, and tides [63] and other hydrodynamic features can also contribute to their deposition and accumulation at the beach [40]. Though it seems unlikely that these pellets represent an input from the Lis River, plastic processing companies have been operating in the watershed for decades and therefore long-term inputs leading to accumulation cannot be discarded.
4.3. Microplastics’ Colour, Size and Polymer Composition
Except for PAcr and PC, the polymers found in water and sediment (PE, PP, PS, PVC and PETE) reflect the materials used by the plastic processing companies, as well as other land uses (e.g., agriculture) in the Lis River Basin. They are also in agreement with the global demand [74] for these materials and are similar to those found in other systems of the world as reviewed before [3,75,76].
Fibres were predominantly transparent, blue, and black, as previously reported in other rivers [33,53,77,78] and essentially composed of PAcr, PP and PETE (Figure 6 and Figure 7). PAcr fibres have not been commonly reported but were found in high amounts in this study. PAcr is commonly used in fabrics [79], optic fibre cables [80] and paints [81]. Although none of the mapped industries in the Lis Basin reported the use of PAcr materials, shedding from fabrics in clothing and optic fibre cable waste from network installation and maintenance procedures, inadequately discarded in the environment, may account for these inputs.
Fragments in water were predominantly blue [33]. PE and PP were the most common polymers, which is in accordance with other studies [33,58,60]. PC, which is used in technical applications (e.g., automotive, and electronic industries [82]), was registered occasionally. Not surprisingly, a higher diversity of colours was found in the sediment, which is a sink for MP present in the water. Pellets were all PE, mostly black and blue in water, and transparent in sediment, which is in line with the MP colours observed in the Rhine River in Germany [59], though this must vary according to plastic production and applications by the different industrial units in each watershed [83,84]. Foams were predominantly white, made of expanded polystyrene, and films were transparent PS, as observed in the Antuã River [33].
MP abundances were inversely related to particle size, as reported by other studies [29,85,86]. The size of fibres and fragments was predominantly < 1 mm in the water, and < 2 mm in the sediment. In the vicinity of the Leiria WWTP, at Olhalvas, a large number of < 1 mm MP was found, possibly in relation to its effluent since WWTP are reported as sources of small plastic fragments and fibres [66,87,88]. At the Lis River mouth and beach, higher variability in size distribution was observed which could be linked with the accumulation of MP from various inputs along the course of the river, combined with the influence of tides, as mentioned above. MP distribution and abundance is largely associated with diffuse and point source inputs (including discharges) [89] and differences in the local hydrodynamic conditions leading to different behaviours of the floating, suspended and deposited items [52,53].
5. Conclusions
Spatial and temporal MP abundance in the Lis River is associated with meteorological and hydrological factors occurring in the river basin. Watershed attributes, such as population density, plastic processing companies, solid waste management units and WWTP located within 10 km of the river course are drivers for MP abundance. However, MP pollution dynamics are complex, due to the covariation of the many factors at play as a result of multiple uses, thus further research, including more frequent sampling, should be conducted to improve our understanding of the temporal variation of MP inputs to aquatic systems, in order to better prevent and reduce this global problem. As no legislation is in place so far, we stress the need for strategies to be designed and implemented in collaboration with the main plastic litter contributors in the watershed, to create co-responsibility towards plastic pollution and the willingness to change their practices, mitigate losses from the industry and improve the efficiency of MP reduction. These proactive steps towards the MP reduction in aquatic systems could protect the ocean and its resources, thus making a valuable contribution to the blue economy.
Supplementary Materials
The following are available online at https://www.mdpi.com/article/10.3390/su14042255/s1. Figure S1: Current velocity measured in situ (m.s−1) during the year along Lis River. Figure S2: Seasonal precipitation level * (mm) and wind velocity * (km.h−1) averages regarding the Lis River Basin; * [49]. Figure S3: Principal components analysis (PCAS), during summer between (a) MP abundance (MP ab, items.m−3) in water samples, population density * (PD, hab.km−2) and proximity to companies/units < and >10 km (c/u < 10 and c/u > 10), that include plastic products manufacturers and suppliers, recycling units, solid waste management units and WWTP; (b) MP abundance (MP ab, items.m−3), wind ** (w, km.h−1), precipitation ** (p, mm) and current velocity (cv, m.s−1); (c) abundances (items.m−3) of different MP typologies (fibres—FB, fragments—FR, foams—FO and microbeads—MB), population density * (PD, hab.km−2) and proximity to companies/units < and >10 km (c/u < 10 and c/u > 10) and (d) abundances (items.m−3) of different MP typologies (fibres—FB, fragments—FR, foams—FO and microbeads—MB), wind ** (w, km.h−1), precipitation ** (p, mm) and current velocity (cv, m.s−1); * [41]; ** [49]. Figure S4: Principal components analysis (PCAS), during autumn between (a) MP abundance (MP ab, items.kg−1) in sediment samples, population density * (PD, hab.km−2) and proximity to companies/units < and >10 km (c/u < 10 and c/u > 10), that include plastic products manufacturers and suppliers, recycling units, solid waste management units and WWTP; (b) MP abundance (MP ab, items.kg−1), wind ** (w, km.h−1), precipitation ** (p, mm) and current velocity (cv, m.s−1); (c) abundances (items.kg−1) of different MP typologies (fibres—FB, fragments—FR, pellets—PLT, foams—FO, films—FL and microbeads—MB), population density* (PD, hab.km−2) and proximity to companies/units < and >10 km (c/u < 10 and c/u > 10) and (d) abundances (items.kg−1) of different MP typologies (fibres—FB, fragments—FR, pellets—PLT, foams—FO, films—FL and microbeads—MB), wind ** (w, km.h−1), precipitation ** (p, mm) and current velocity (cv, m.s−1); * [41]; ** [49]. Figure S5: Principal components analysis (PCAS), during autumn between (a) MP abundance (MP ab, items.m−3) in water samples, population density * (PD, hab.km−2) and proximity to companies/units < and >10 km (c/u < 10 and c/u > 10), that include plastic products manufacturers and suppliers, recycling units, solid waste management units and WWTP; (b) MP abundance (MP ab, items.m−3), wind ** (w, km.h−1), precipitation ** (p, mm) and current velocity (cv, m.s−1); (c) abundances (items.m−3) of different MP typologies (fibres—FB, fragments—FR, pellets—PLT and films—FL), population density * (PD, hab.km−2) and proximity to companies/units < and >10 km (c/u < 10 and c/u > 10) and (d) abundances (items.m−3) of different MP typologies (fibres—FB, fragments—FR, pellets—PLT and films—FL), wind ** (w, km.h−1), precipitation ** (p, mm) and current velocity (cv, m.s−1); * [41]; ** [49].
Author Contributions
Conceptualisation and design, P.S.; methodology, B.S., J.P. (Joana Pais), J.A., J.P. (João Pequeno) and A.P.; writing—original draft preparation, J.P. (Joana Pais) and B.S.; writing—review and editing, B.S., J.P. (Joana Pais), J.A., J.P. (João Pequeno) and P.S.; supervision, P.S. All authors have read and agreed to the published version of the manuscript.
Funding
This research was funded by Fundação para a Ciência e a Tecnologia (FCT-MCTES, Portugal), through project RIVERSEA (ref. PTDC/EAM-AMB/30726/2017) and the strategic project UIDB/04292/2020 granted to MARE.
Institutional Review Board Statement
Not applicable.
Informed Consent Statement
Not applicable.
Data Availability Statement
The data presented in this study are available on request from the corresponding author.
Acknowledgments
All authors acknowledge Pedro Santos, Diana Rodrigues, Filipe Borges, Carolina Dias, Marta Silva and Marta Pereira from Nova School of Science and Technology, NOVA University Lisbon, for support during the intensive fieldwork, and José Almeida from Instituto Hidrográfico (IH, Portuguese Navy Agency) for the support with polymer analysis.
Conflicts of Interest
The authors declare no conflict of interest. The funders had no role in the design of the study; in the collection, analyses, or interpretation of data; in the writing of the manuscript, or in the decision to publish the results.
References
- Barnes, D.K.A.; Galgani, F.; Thompson, R.C.; Barlaz, M. Accumulation and Fragmentation of Plastic Debris in Global Environments. Philos. Trans. R. Soc. B Biol. Sci. 2009, 364, 1985–1998. [Google Scholar] [CrossRef] [PubMed] [Green Version]
- Ivleva, N.P.; Wiesheu, A.C.; Niessner, R. Microplastic in Aquatic Ecosystems. Angew. Chem. Int. Ed. 2017, 56, 1720–1739. [Google Scholar] [CrossRef] [PubMed]
- Horton, A.A.; Walton, A.; Spurgeon, D.J.; Lahive, E.; Svendsen, C. Microplastics in Freshwater and Terrestrial Environments: Evaluating the Current Understanding to Identify the Knowledge Gaps and Future Research Priorities. Sci. Total Environ. 2017, 586, 127–141. [Google Scholar] [CrossRef] [PubMed] [Green Version]
- PlasticsEurope. Available online: https://plasticseurope.org/knowledge-hub/plastics-the-facts-2021/ (accessed on 9 February 2022).
- Geyer, R.; Jambeck, J.R.; Law, K.L. Production, Use, and Fate of All Plastics Ever Made. Sci. Adv. 2017, 3, e1700782. [Google Scholar] [CrossRef] [Green Version]
- Frias, J.P.G.L.; Nash, R. Microplastics: Finding a Consensus on the Definition. Mar. Pollut. Bull. 2019, 138, 145–147. [Google Scholar] [CrossRef]
- Zhang, Y.; Kang, S.; Allen, S.; Allen, D.; Gao, T.; Sillanpää, M. Atmospheric Microplastics: A Review on Current Status and Perspectives. Earth-Sci. Rev. 2020, 203, 103118. [Google Scholar] [CrossRef]
- Antunes, J.C.; Frias, J.G.L.; Micaelo, A.C.; Sobral, P. Resin Pellets from Beaches of the Portuguese Coast and Adsorbed Persistent Organic Pollutants. Estuar. Coast. Shelf Sci. 2013, 130, 62–69. [Google Scholar] [CrossRef]
- Rillig, M.C. Microplastic in Terrestrial Ecosystems and the Soil? Environ. Sci. Technol. 2012, 46, 6453–6454. [Google Scholar] [CrossRef]
- Issac, M.N.; Kandasubramanian, B. Effect of Microplastics in Water and Aquatic Systems. Environ. Sci. Pollut. Res. 2021, 28, 19544–19562. [Google Scholar] [CrossRef]
- Kooi, M.; van Nes, E.H.; Scheffer, M.; Koelmans, A.A. Ups and Downs in the Ocean: Effects of Biofouling on Vertical Transport of Microplastics. Environ. Sci. Technol. 2017, 51, 7963–7971. [Google Scholar] [CrossRef] [Green Version]
- LITTERBASE: Online Portal for Marine Litter. Available online: https://litterbase.awi.de/interaction_graph (accessed on 5 February 2022).
- Espinosa, C.; Esteban, M.Á.; Cuesta, A. Microplastics in Aquatic Environments and Their Toxicological Implications for Fish. In Toxicology–New Aspects to this Scientific Conundrum; Books on Demand: Norderstedt, Germany, 2016. [Google Scholar] [CrossRef] [Green Version]
- Smith, M.; Love, D.C.; Rochman, C.M.; Neff, R.A. Microplastics in Seafood and the Implications for Human Health. Curr. Environ. Health Rep. 2018, 5, 375–386. [Google Scholar] [CrossRef] [PubMed] [Green Version]
- Redford, D.P.; Trulli, H.K.; Trulli, W.R. Sources of Plastic Pellets in the Aquatic Environment. Rangel. Syst. 1997, 335–343. [Google Scholar] [CrossRef]
- Massos, A.; Turner, A. Cadmium, Lead and Bromine in Beached Microplastics. Environ. Pollut. 2017, 227, 139–145. [Google Scholar] [CrossRef]
- Hidayaturrahman, H.; Lee, T.G. A Study on Characteristics of Microplastic in Wastewater of South Korea: Identification, Quantification, and Fate of Microplastics during Treatment Process. Mar. Pollut. Bull. 2019, 146, 696–702. [Google Scholar] [CrossRef]
- Hidalgo-Ruz, V.; Gutow, L.; Thompson, R.C.; Thiel, M. Microplastics in the Marine Environment: A Review of the Methods Used for Identification and Quantification. Environ. Sci. Technol. 2012, 46, 3060–3075. [Google Scholar] [CrossRef]
- Rochman, C.M.; Kross, S.M.; Armstrong, J.B.; Bogan, M.T.; Darling, E.S.; Green, S.J.; Smyth, A.R.; Veríssimo, D. Scientific Evidence Supports a Ban on Microbeads. Environ. Sci. Technol. 2015, 49, 10759–10761. [Google Scholar] [CrossRef] [Green Version]
- Eerkes-Medrano, D.; Thompson, R.C.; Aldridge, D.C. Microplastics in Freshwater Systems: A Review of the Emerging Threats, Identification of Knowledge Gaps and Prioritisation of Research Needs. Water Res. 2015, 75, 63–82. [Google Scholar] [CrossRef]
- Cole, M. A Novel Method for Preparing Microplastic Fibers. Sci. Rep. 2016, 6, srep34519. [Google Scholar] [CrossRef] [Green Version]
- Altan, M. Thermoplastic Foams: Processing, Manufacturing, and Characterization. Recent Res. Polym. 2018, 6, 117–137. [Google Scholar] [CrossRef] [Green Version]
- Espí, E.; Salmerón, A.; Fontecha, A.; García, Y.; Real, A.I. Plastic Films for Agricultural Applications. J. Plast. Film. Sheeting 2006, 22, 85–102. [Google Scholar] [CrossRef]
- Zhou, B.; Wang, J.; Zhang, H.; Shi, H.; Fei, Y.; Huang, S.; Tong, Y.; Wen, D.; Luo, Y.; Barceló, D. Microplastics in Agricultural Soils on the Coastal Plain of Hangzhou Bay, East China: Multiple Sources Other than Plastic Mulching Film. J. Hazard. Mater. 2020, 388, 121814. [Google Scholar] [CrossRef] [PubMed]
- Mani, T.; Burkhardt-Holm, P. Seasonal Microplastics Variation in Nival and Pluvial Stretches of the Rhine River–From the Swiss Catchment towards the North Sea. Sci. Total Environ. 2020, 707, 135579. [Google Scholar] [CrossRef]
- Williams, A.T.; Simmons, S.L. The Degradation of Plastic Litter in Rivers: Implications for Beaches. J. Coast. Conserv. 1996, 2, 63–72. [Google Scholar] [CrossRef]
- Löhr, A.; Savelli, H.; Beunen, R.; Kalz, M.; Ragas, A.; van Belleghem, F. Solutions for Global Marine Litter Pollution. Curr. Opin. Environ. Sustain. 2017, 28, 90–99. [Google Scholar] [CrossRef] [Green Version]
- Lebreton, L.C.M.; van der Zwet, J.; Damsteeg, J.W.; Slat, B.; Andrady, A.; Reisser, J. River Plastic Emissions to the World’s Oceans. Nat. Commun. 2017, 8, 15611. [Google Scholar] [CrossRef] [PubMed]
- de Carvalho, A.R.; Garcia, F.; Riem-Galliano, L.; Tudesque, L.; Albignac, M.; ter Halle, A.; Cucherousset, J. Urbanization and Hydrological Conditions Drive the Spatial and Temporal Variability of Microplastic Pollution in the Garonne River. Sci. Total Environ. 2021, 769, 144479. [Google Scholar] [CrossRef] [PubMed]
- Constant, M.; Ludwig, W.; Kerhervé, P.; Sola, J.; Charrière, B.; Sanchez-Vidal, A.; Canals, M.; Heussner, S. Microplastic Fluxes in a Large and a Small Mediterranean River Catchments: The Têt and the Rhône, Northwestern Mediterranean Sea. Sci. Total Environ. 2020, 716, 136984. [Google Scholar] [CrossRef]
- Hitchcock, J.N.; Mitrovic, S.M. Microplastic Pollution in Estuaries across a Gradient of Human Impact. Environ. Pollut. 2019, 247, 457–466. [Google Scholar] [CrossRef]
- Prata, J.C.; Godoy, V.; da Costa, J.P.; Calero, M.; Martín-Lara, M.A.; Duarte, A.C.; Rocha-Santos, T. Microplastics and Fibers from Three Areas under Different Anthropogenic Pressures in Douro River. Sci. Total Environ. 2021, 776, 145999. [Google Scholar] [CrossRef]
- Rodrigues, M.O.; Abrantes, N.; Gonçalves, F.J.M.; Nogueira, H.; Marques, J.C.; Gonçalves, A.M.M. Spatial and Temporal Distribution of Microplastics in Water and Sediments of a Freshwater System (Antuã River, Portugal). Sci. Total Environ. 2018, 633, 1549–1559. [Google Scholar] [CrossRef]
- Augspurger, C.; Karwautz, C.; Mußmann, M.; Daims, H.; Battin, T.J. Drivers of Bacterial Colonization Patterns in Stream Biofilms. FEMS Microbiol. Ecol. 2010, 72, 47–57. [Google Scholar] [CrossRef] [PubMed]
- Rummel, C.D.; Jahnke, A.; Gorokhova, E.; Kühnel, D.; Schmitt-Jansen, M. Impacts of Biofilm Formation on the Fate and Potential Effects of Microplastic in the Aquatic Environment. Environ. Sci. Technol. Lett. 2017, 4, 258–267. [Google Scholar] [CrossRef] [Green Version]
- Garcia, F.; de Carvalho, A.R.; Riem-Galliano, L.; Tudesque, L.; Albignac, M.; ter Halle, A.; Cucherousset, J. Stable Isotope Insights into Microplastic Contamination within Freshwater Food Webs. Environ. Sci. Technol. 2021, 55, 1024–1035. [Google Scholar] [CrossRef] [PubMed]
- Wang, T.; Zou, X.; Li, B.; Yao, Y.; Zang, Z.; Li, Y.; Yu, W.; Wang, W. Preliminary Study of the Source Apportionment and Diversity of Microplastics: Taking Floating Microplastics in the South China Sea as an Example. Environ. Pollut. 2019, 245, 965–974. [Google Scholar] [CrossRef]
- Collard, F.; Gasperi, J.; Gabrielsen, G.W.; Tassin, B. Plastic Particle Ingestion by Wild Freshwater Fish: A Critical Review. Environ. Sci. Technol. 2019, 53, 12974–12988. [Google Scholar] [CrossRef]
- Vieira, J.; Fonseca, A.; Vilar, V.J.P.; Boaventura, R.A.R.; Botelho, C.M.S. Water Quality in Lis River, Portugal. Environ. Monit. Assess. 2012, 184, 7125–7140. [Google Scholar] [CrossRef]
- Meijer, L.J.J.; van Emmerik, T.; van der Ent, R.; Schmidt, C.; Lebreton, L. More than 1000 Rivers Account for 80% of Global Riverine Plastic Emissions into the Ocean. Sci. Adv. 2021, 7, eaaz5803. [Google Scholar] [CrossRef]
- Portal Do INE. Available online: https://www.ine.pt/xportal/xmain?xpgid=ine_main&xpid=INE (accessed on 9 January 2021).
- Gago, J.; Filgueiras, A.; Pedrotti, M.L.; Caetano, M.; Frias, J. Standardised Protocol for Monitoring Microplastics in Seawater. Deliverable 4.1. JPI-Oceans BASEMANproject. 2018, p. 32. Available online: https://www.researchgate.net/publication/330931801_Standardised_protocol_for_monitoring_microplastics_in_seawater?channel=doi&linkId=5c5c2491a6fdccb608aefbf9&showFulltext=true (accessed on 14 January 2022).
- Frias, J.; Pagter, E.; Nash, R.; O’Connor, I.; Carretero, O.; Filgueiras, A.; Viñas, L.; Gago, J.; Antunes, J.; Bessa, F.; et al. Standardised Protocol for Monitoring Microplastics in Sediments. Deliverable 4.2. JPI-Oceans BASEMANproject. 2018, p. 24. Available online: https://www.researchgate.net/publication/326552185_Standardised_protocol_for_monitoring_microplastics_in_sediments?channel=doi&linkId=5b572280aca27217ffb7ccb2&showFulltext=true (accessed on 14 January 2022).
- Coppock, R.L.; Cole, M.; Lindeque, P.K.; Queirós, A.M.; Galloway, T.S. A Small-Scale, Portable Method for Extracting Microplastics from Marine Sediments. Environ. Pollut. 2017, 230, 829–837. [Google Scholar] [CrossRef] [Green Version]
- Primpke, S.; Wirth, M.; Lorenz, C.; Gerdts, G. Reference Database Design for the Automated Analysis of Microplastic Samples Based on Fourier Transform Infrared (FTIR) Spectroscopy. Anal. Bioanal. Chem. 2018, 410, 5131–5141. [Google Scholar] [CrossRef] [Green Version]
- Jung, M.R.; Horgen, F.D.; Orski, S.V.; Rodriguez, C.V.; Beers, K.L.; Balazs, G.H.; Jones, T.T.; Work, T.M.; Brignac, K.C.; Royer, S.J.; et al. Validation of ATR FT-IR to Identify Polymers of Plastic Marine Debris, Including Those Ingested by Marine Organisms. Mar. Pollut. Bull. 2018, 127, 704–716. [Google Scholar] [CrossRef] [PubMed]
- Marković, G.; Marinović-Cincović, M.; Vodnik, V.; Radovanović, B.; Budinski-Simendić, J.; Veljković, O. Thermal Stability of Acrylonitrile/Chlorosulphonated Polyethylene Rubber Blend. J. Therm. Anal. Calorim. 2009, 97, 999–1006. [Google Scholar] [CrossRef]
- Zheng, W.; Kobayashi, Y.; Hirata, K.; Miura, T.; Kobayashi, T.; Iwaki, M.; Oka, T.; Hama, Y. Three-Group Type Mechanism in the Curing Behavior of Polyacrylate and Blocked Toluene Diisocyanate. J. Appl. Polym. Sci. 2002, 83, 112–120. [Google Scholar] [CrossRef]
- Instituto Português do Mar e da Atmosfera. Available online: https://www.ipma.pt/en/index.html (accessed on 10 January 2021).
- He, P.; Chen, L.; Shao, L.; Zhang, H.; Lü, F. Municipal Solid Waste (MSW) Landfill: A Source of Microplastics?-Evidence of Microplastics in Landfill Leachate. Water Res. 2019, 159, 38–45. [Google Scholar] [CrossRef] [PubMed]
- Hitchcock, J.N. Storm Events as Key Moments of Microplastic Contamination in Aquatic Ecosystems. Sci. Total Environ. 2020, 734, 139436. [Google Scholar] [CrossRef] [PubMed]
- Horton, A.A.; Svendsen, C.; Williams, R.J.; Spurgeon, D.J.; Lahive, E. Large Microplastic Particles in Sediments of Tributaries of the River Thames, UK–Abundance, Sources and Methods for Effective Quantification. Mar. Pollut. Bull. 2017, 114, 218–226. [Google Scholar] [CrossRef] [Green Version]
- Sekudewicz, I.; Dąbrowska, A.M.; Syczewski, M.D. Microplastic Pollution in Surface Water and Sediments in the Urban Section of the Vistula River (Poland). Sci. Total Environ. 2021, 762, 143111. [Google Scholar] [CrossRef] [PubMed]
- Nizzetto, L.; Bussi, G.; Futter, M.N.; Butterfield, D.; Whitehead, P.G. A Theoretical Assessment of Microplastic Transport in River Catchments and Their Retention by Soils and River Sediments. Environ. Sci. Processes Impacts 2016, 18, 1050–1059. [Google Scholar] [CrossRef]
- Baldwin, A.K.; Corsi, S.R.; Mason, S.A. Plastic Debris in 29 Great Lakes Tributaries: Relations to Watershed Attributes and Hydrology. Environ. Sci. Technol. 2016, 50, 10377–10385. [Google Scholar] [CrossRef]
- Lechner, A.; Keckeis, H.; Lumesberger-Loisl, F.; Zens, B.; Krusch, R.; Tritthart, M.; Glas, M.; Schludermann, E. The Danube so Colourful: A Potpourri of Plastic Litter Outnumbers Fish Larvae in Europe’s Second Largest River. Environ. Pollut. 2014, 188, 177–181. [Google Scholar] [CrossRef] [Green Version]
- Schell, T.; Hurley, R.; Nizzetto, L.; Rico, A.; Vighi, M. Spatio-Temporal Distribution of Microplastics in a Mediterranean River Catchment: The Importance of Wastewater as an Environmental Pathway. J. Hazard. Mater. 2021, 420, 126481. [Google Scholar] [CrossRef]
- He, B.; Goonetilleke, A.; Ayoko, G.A.; Rintoul, L. Abundance, Distribution Patterns, and Identification of Microplastics in Brisbane River Sediments, Australia. Sci. Total Environ. 2020, 700, 134467. [Google Scholar] [CrossRef] [PubMed]
- Klein, S.; Worch, E.; Knepper, T.P. Occurrence and Spatial Distribution of Microplastics in River Shore Sediments of the Rhine-Main Area in Germany. Environ. Sci. Technol. 2015, 49, 6070–6076. [Google Scholar] [CrossRef] [PubMed]
- Yonkos, L.T.; Friedel, E.A.; Perez-Reyes, A.C.; Ghosal, S.; Arthur, C.D. Microplastics in Four Estuarine Rivers in the Chesapeake Bay, U.S.A. Environ. Sci. Technol. 2014, 48, 14195–14202. [Google Scholar] [CrossRef] [PubMed]
- Dris, R.; Gasperi, J.; Saad, M.; Mirande, C.; Tassin, B. Synthetic Fibers in Atmospheric Fallout: A Source of Microplastics in the Environment? Mar. Pollut. Bull. 2016, 104, 290–293. [Google Scholar] [CrossRef] [PubMed]
- Zhang, Z.; Wu, H.; Peng, G.; Xu, P.; Li, D. Coastal Ocean Dynamics Reduce the Export of Microplastics to the Open Ocean. Sci. Total Environ. 2020, 713, 136634. [Google Scholar] [CrossRef]
- Balthazar-Silva, D.; Turra, A.; Moreira, F.T.; Camargo, R.M.; Oliveira, A.L.; Barbosa, L.; Gorman, D. Rainfall and Tidal Cycle Regulate Seasonal Inputs of Microplastic Pellets to Sandy Beaches. Front. Environ. Sci. 2020, 8, 8. [Google Scholar] [CrossRef]
- Simon-Sánchez, L.; Grelaud, M.; Garcia-Orellana, J.; Ziveri, P. River Deltas as Hotspots of Microplastic Accumulation: The Case Study of the Ebro River (NW Mediterranean). Sci. Total Environ. 2019, 687, 1186–1196. [Google Scholar] [CrossRef]
- Zhao, S.; Zhu, L.; Li, D. Microplastic in Three Urban Estuaries, China. Environ. Pollut. 2015, 206, 597–604. [Google Scholar] [CrossRef]
- Edo, C.; González-Pleiter, M.; Leganés, F.; Fernández-Piñas, F.; Rosal, R. Fate of Microplastics in Wastewater Treatment Plants and Their Environmental Dispersion with Effluent and Sludge. Environ. Pollut. 2020, 259, 113837. [Google Scholar] [CrossRef]
- Browne, M.A.; Crump, P.; Niven, S.J.; Teuten, E.; Tonkin, A.; Galloway, T.; Thompson, R. Accumulation of Microplastic on Shorelines Woldwide: Sources and Sinks. Environ. Sci. Technol. 2011, 45, 9175–9179. [Google Scholar] [CrossRef]
- Petersen, F.; Hubbart, J.A. The Occurrence and Transport of Microplastics: The State of the Science. Sci. Total Environ. 2021, 758, 143936. [Google Scholar] [CrossRef] [PubMed]
- Mason, S.A.; Garneau, D.; Sutton, R.; Chu, Y.; Ehmann, K.; Barnes, J.; Fink, P.; Papazissimos, D.; Rogers, D.L. Microplastic Pollution Is Widely Detected in US Municipal Wastewater Treatment Plant Effluent. Environ. Pollut. 2016, 218, 1045–1054. [Google Scholar] [CrossRef]
- Alfei, S.; Schito, A.M.; Zuccari, G. Biodegradable and Compostable Shopping Bags under Investigation by Ftir Spectroscopy. Appl. Sci. 2021, 11, 621. [Google Scholar] [CrossRef]
- Horodytska, O.; Valdés, F.J.; Fullana, A. Plastic Flexible Films Waste Management–A State of Art Review. Waste Manag. 2018, 77, 413–425. [Google Scholar] [CrossRef] [PubMed]
- Sobhani, Z.; Lei, Y.; Tang, Y.; Wu, L.; Zhang, X.; Naidu, R.; Megharaj, M.; Fang, C. Microplastics Generated When Opening Plastic Packaging. Sci. Rep. 2020, 10, 4841. [Google Scholar] [CrossRef] [PubMed] [Green Version]
- Vox, G.; Loisi, R.V.; Blanco, I.; Mugnozza, G.S.; Schettini, E. Mapping of Agriculture Plastic Waste. Agric. Agric. Sci. Procedia 2016, 8, 583–591. [Google Scholar] [CrossRef] [Green Version]
- Koelmans, A.A.; Nor, N.H.M.; Hermsen, E.; Kooi, M.; Mintenig, S.M.; de France, J. Microplastics in Freshwaters and Drinking Water: Critical Review and Assessment of Data Quality. Water Res. 2019, 155, 410–422. [Google Scholar] [CrossRef]
- Kumar, R.; Sharma, P.; Manna, C.; Jain, M. Abundance, Interaction, Ingestion, Ecological Concerns, and Mitigation Policies of Microplastic Pollution in Riverine Ecosystem: A Review. Sci. Total Environ. 2021, 782, 146695. [Google Scholar] [CrossRef]
- Avio, C.G.; Gorbi, S.; Regoli, F. Plastics and Microplastics in the Oceans: From Emerging Pollutants to Emerged Threat. Mar. Environ. Res. 2017, 128, 2–11. [Google Scholar] [CrossRef]
- de Villiers, S. Microfibre Pollution Hotspots in River Sediments Adjacent to South Africa’s Coastline. Water SA 2019, 45, 97–102. [Google Scholar] [CrossRef] [Green Version]
- Dris, R.; Gasperi, J.; Rocher, V.; Tassin, B. Synthetic and Non-Synthetic Anthropogenic Fibers in a River under the Impact of Paris Megacity: Sampling Methodological Aspects and Flux Estimations. Sci. Total Environ. 2018, 618, 157–164. [Google Scholar] [CrossRef] [PubMed] [Green Version]
- Nayak, R.; Kanesalingam, S.; Houshyar, S.; Wang, L.; Padhye, R.; Vijayan, A. Evaluation of Thermal, Moisture Management and Sensorial Comfort Properties of Superabsorbent Polyacrylate Fabrics for the next-to-Skin Layer in Firefighters’ Protective Clothing. Text. Res. J. 2017, 88, 1077–1088. [Google Scholar] [CrossRef]
- Baghsiahi, H.; Wang, K.; Selviah, D.R. Optical Loss and Crosstalk in Multimode Photolithographically Fabricated Polyacrylate Polymer Waveguide Crossings. Integr. Opt. Devices Mater. Technol. XVIII 2014, 8988, 38–44. [Google Scholar] [CrossRef] [Green Version]
- van Faassen, A.; Borm, P.J.A. Composition and Health Hazards of Water-Based Construction Paints: Results from a Survey in the Netherlands. Environ. Health Perspect. 1991, 92, 147–154. [Google Scholar] [CrossRef]
- Jadhav, V.D.; Patil, A.J.; Kandasubramanian, B. Polycarbonate Nanocomposites for High Impact Applications. In Handbook of Consumer Nanoproducts; Springer: Berlin, Germany, 2021; pp. 1–25. [Google Scholar] [CrossRef]
- Karkanorachaki, K.; Kiparissis, S.; Kalogerakis, G.C.; Yiantzi, E.; Psillakis, E.; Kalogerakis, N. Plastic Pellets, Meso- and Microplastics on the Coastline of Northern Crete: Distribution and Organic Pollution. Mar. Pollut. Bull. 2018, 133, 578–589. [Google Scholar] [CrossRef] [PubMed]
- Turner, A.; Wallerstein, C.; Arnold, R. Identification, Origin and Characteristics of Bio-Bead Microplastics from Beaches in Western Europe. Sci. Total Environ. 2019, 664, 938–947. [Google Scholar] [CrossRef]
- Cózar, A.; Echevarría, F.; González-Gordillo, J.I.; Irigoien, X.; Úbeda, B.; Hernández-León, S.; Palma, Á.T.; Navarro, S.; García-de-Lomas, J.; Ruiz, A.; et al. Plastic Debris in the Open Ocean. Proc. Natl. Acad. Sci. USA 2014, 111, 10239–10244. [Google Scholar] [CrossRef] [Green Version]
- Isobe, A.; Uchida, K.; Tokai, T.; Iwasaki, S. East Asian Seas: A Hot Spot of Pelagic Microplastics. Mar. Pollut. Bull. 2015, 101, 618–623. [Google Scholar] [CrossRef]
- Alvim, C.B.; Mendoza-Roca, J.A.; Bes-Piá, A. Wastewater Treatment Plant as Microplastics Release Source–Quantification and Identification Techniques. J. Environ. Manag. 2020, 255, 109739. [Google Scholar] [CrossRef]
- Conley, K.; Clum, A.; Deepe, J.; Lane, H.; Beckingham, B. Wastewater Treatment Plants as a Source of Microplastics to an Urban Estuary: Removal Efficiencies and Loading per Capita over One Year. Water Res. X 2019, 3, 100030. [Google Scholar] [CrossRef]
- Estahbanati, S.; Fahrenfeld, N.L. Influence of Wastewater Treatment Plant Discharges on Microplastic Concentrations in Surface Water. Chemosphere 2016, 162, 277–284. [Google Scholar] [CrossRef] [PubMed]
Figure 1.
Lis River course with identification of each sampling site ![Sustainability 14 02255 i001]() (Fontes—F, Olhalvas—O, Moinho de Papel—MdP, Arrabalde—A, Bóia—B, Lis River mouth—LRM, North Vieira Beach—NVB and South Vieira Beach—SVB) and potential contributors of MP to the Lis River (plastic products manufacturers
(Fontes—F, Olhalvas—O, Moinho de Papel—MdP, Arrabalde—A, Bóia—B, Lis River mouth—LRM, North Vieira Beach—NVB and South Vieira Beach—SVB) and potential contributors of MP to the Lis River (plastic products manufacturers ![Sustainability 14 02255 i002]() and suppliers
and suppliers ![Sustainability 14 02255 i003]() , recycling units
, recycling units ![Sustainability 14 02255 i004]() , solid waste management
, solid waste management ![Sustainability 14 02255 i005]() and wastewater treatment plant—WWTP
and wastewater treatment plant—WWTP ![Sustainability 14 02255 i006]() ).
).
 (Fontes—F, Olhalvas—O, Moinho de Papel—MdP, Arrabalde—A, Bóia—B, Lis River mouth—LRM, North Vieira Beach—NVB and South Vieira Beach—SVB) and potential contributors of MP to the Lis River (plastic products manufacturers
  and suppliers
  , recycling units
  , solid waste management
  and wastewater treatment plant—WWTP
  ).
).
Figure 1.
Lis River course with identification of each sampling site ![Sustainability 14 02255 i001]() (Fontes—F, Olhalvas—O, Moinho de Papel—MdP, Arrabalde—A, Bóia—B, Lis River mouth—LRM, North Vieira Beach—NVB and South Vieira Beach—SVB) and potential contributors of MP to the Lis River (plastic products manufacturers
(Fontes—F, Olhalvas—O, Moinho de Papel—MdP, Arrabalde—A, Bóia—B, Lis River mouth—LRM, North Vieira Beach—NVB and South Vieira Beach—SVB) and potential contributors of MP to the Lis River (plastic products manufacturers ![Sustainability 14 02255 i002]() and suppliers
and suppliers ![Sustainability 14 02255 i003]() , recycling units
, recycling units ![Sustainability 14 02255 i004]() , solid waste management
, solid waste management ![Sustainability 14 02255 i005]() and wastewater treatment plant—WWTP
and wastewater treatment plant—WWTP ![Sustainability 14 02255 i006]() ).
).
(Fontes—F, Olhalvas—O, Moinho de Papel—MdP, Arrabalde—A, Bóia—B, Lis River mouth—LRM, North Vieira Beach—NVB and South Vieira Beach—SVB) and potential contributors of MP to the Lis River (plastic products manufacturers and suppliers , recycling units , solid waste management and wastewater treatment plant—WWTP ).
Figure 2.
Seasonal MP abundance (items.m−3) in water along Lis River: Fontes—F, Olhalvas—O, Moinho de Papel—MdP, Arrabalde—A, Bóia—B and Lis River mouth—LRM; (#) no data; (*) outliers.
Figure 2.
Seasonal MP abundance (items.m−3) in water along Lis River: Fontes—F, Olhalvas—O, Moinho de Papel—MdP, Arrabalde—A, Bóia—B and Lis River mouth—LRM; (#) no data; (*) outliers.

Figure 3.
Seasonal MP abundance (items. kg−1) in sediment along Lis River: Fontes—F, Olhalvas—O, Moinho de Papel—MdP, Lis River Mouth—LRM, North Vieira Beach—NVB and South Vieira Beach—SVB; (mean ± SD, n = 3).
Figure 3.
Seasonal MP abundance (items. kg−1) in sediment along Lis River: Fontes—F, Olhalvas—O, Moinho de Papel—MdP, Lis River Mouth—LRM, North Vieira Beach—NVB and South Vieira Beach—SVB; (mean ± SD, n = 3).
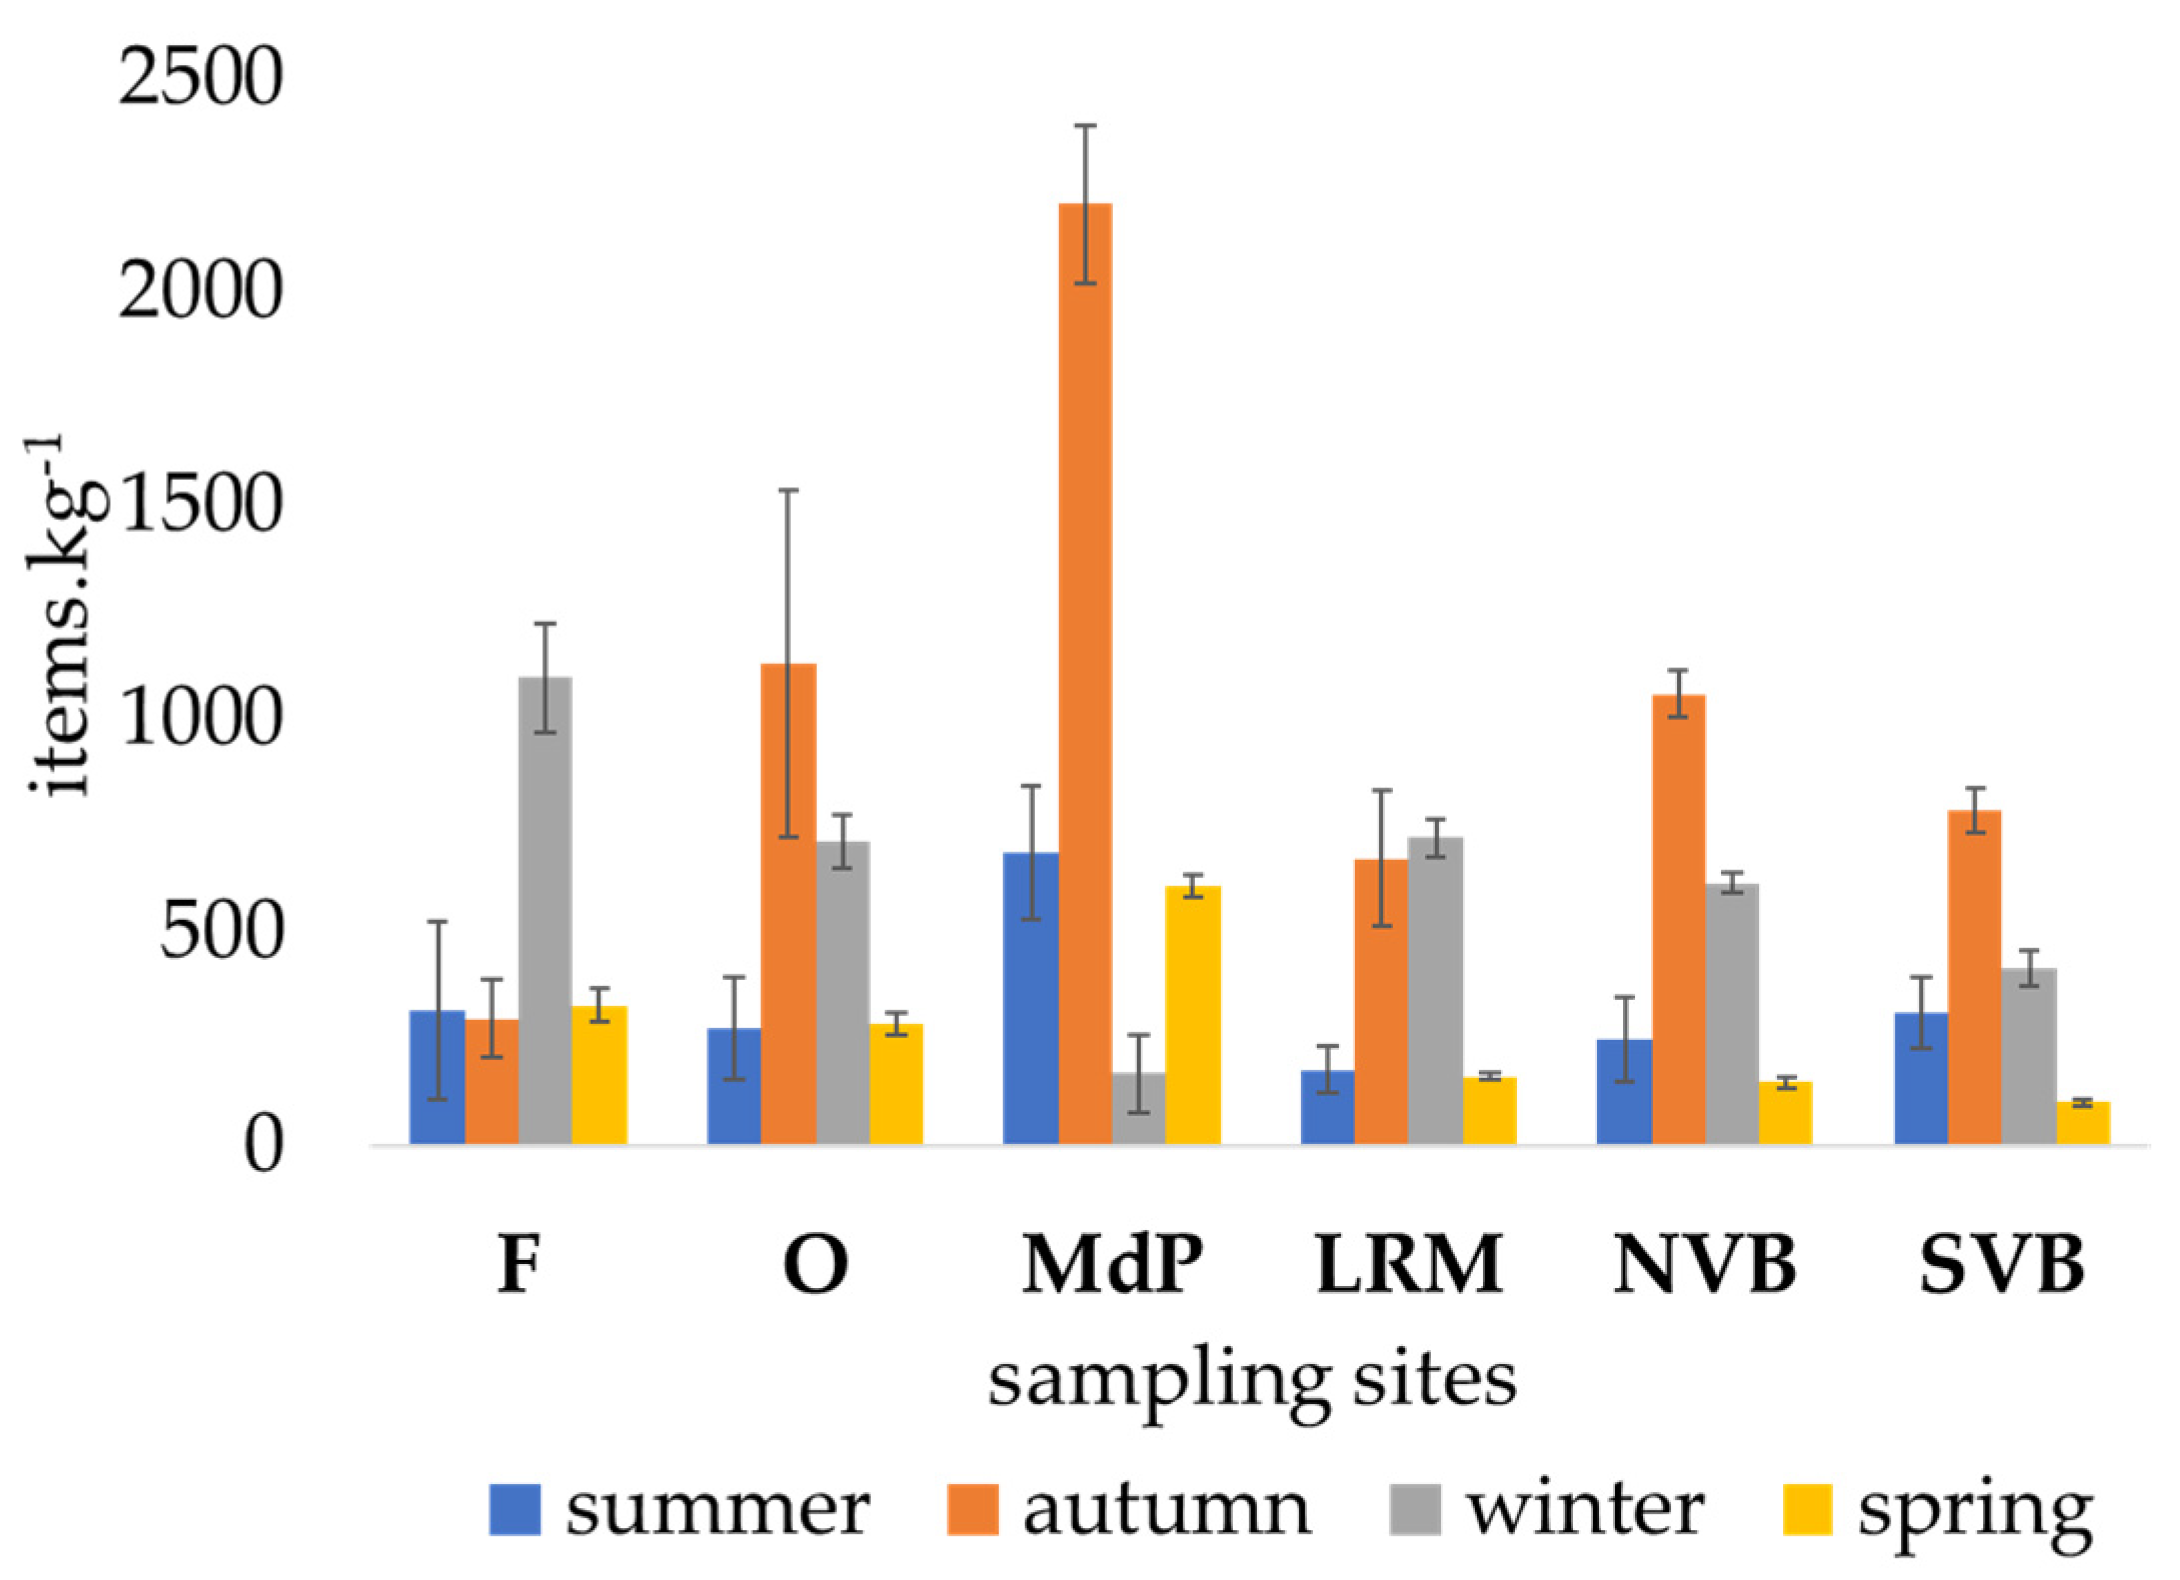
Figure 4.
Seasonal abundance of MP types in (a) water (items.m−3) and (b) sediment (items.kg−1) along Lis River: Fontes—F, Olhalvas—O, Moinho de Papel—MdP, Arrabalde—A, Bóia—B, Lis River mouth—LRM, North Vieira Beach—NVB and South Vieira Beach—SVB; (#) no data; (*) outliers.
Figure 4.
Seasonal abundance of MP types in (a) water (items.m−3) and (b) sediment (items.kg−1) along Lis River: Fontes—F, Olhalvas—O, Moinho de Papel—MdP, Arrabalde—A, Bóia—B, Lis River mouth—LRM, North Vieira Beach—NVB and South Vieira Beach—SVB; (#) no data; (*) outliers.
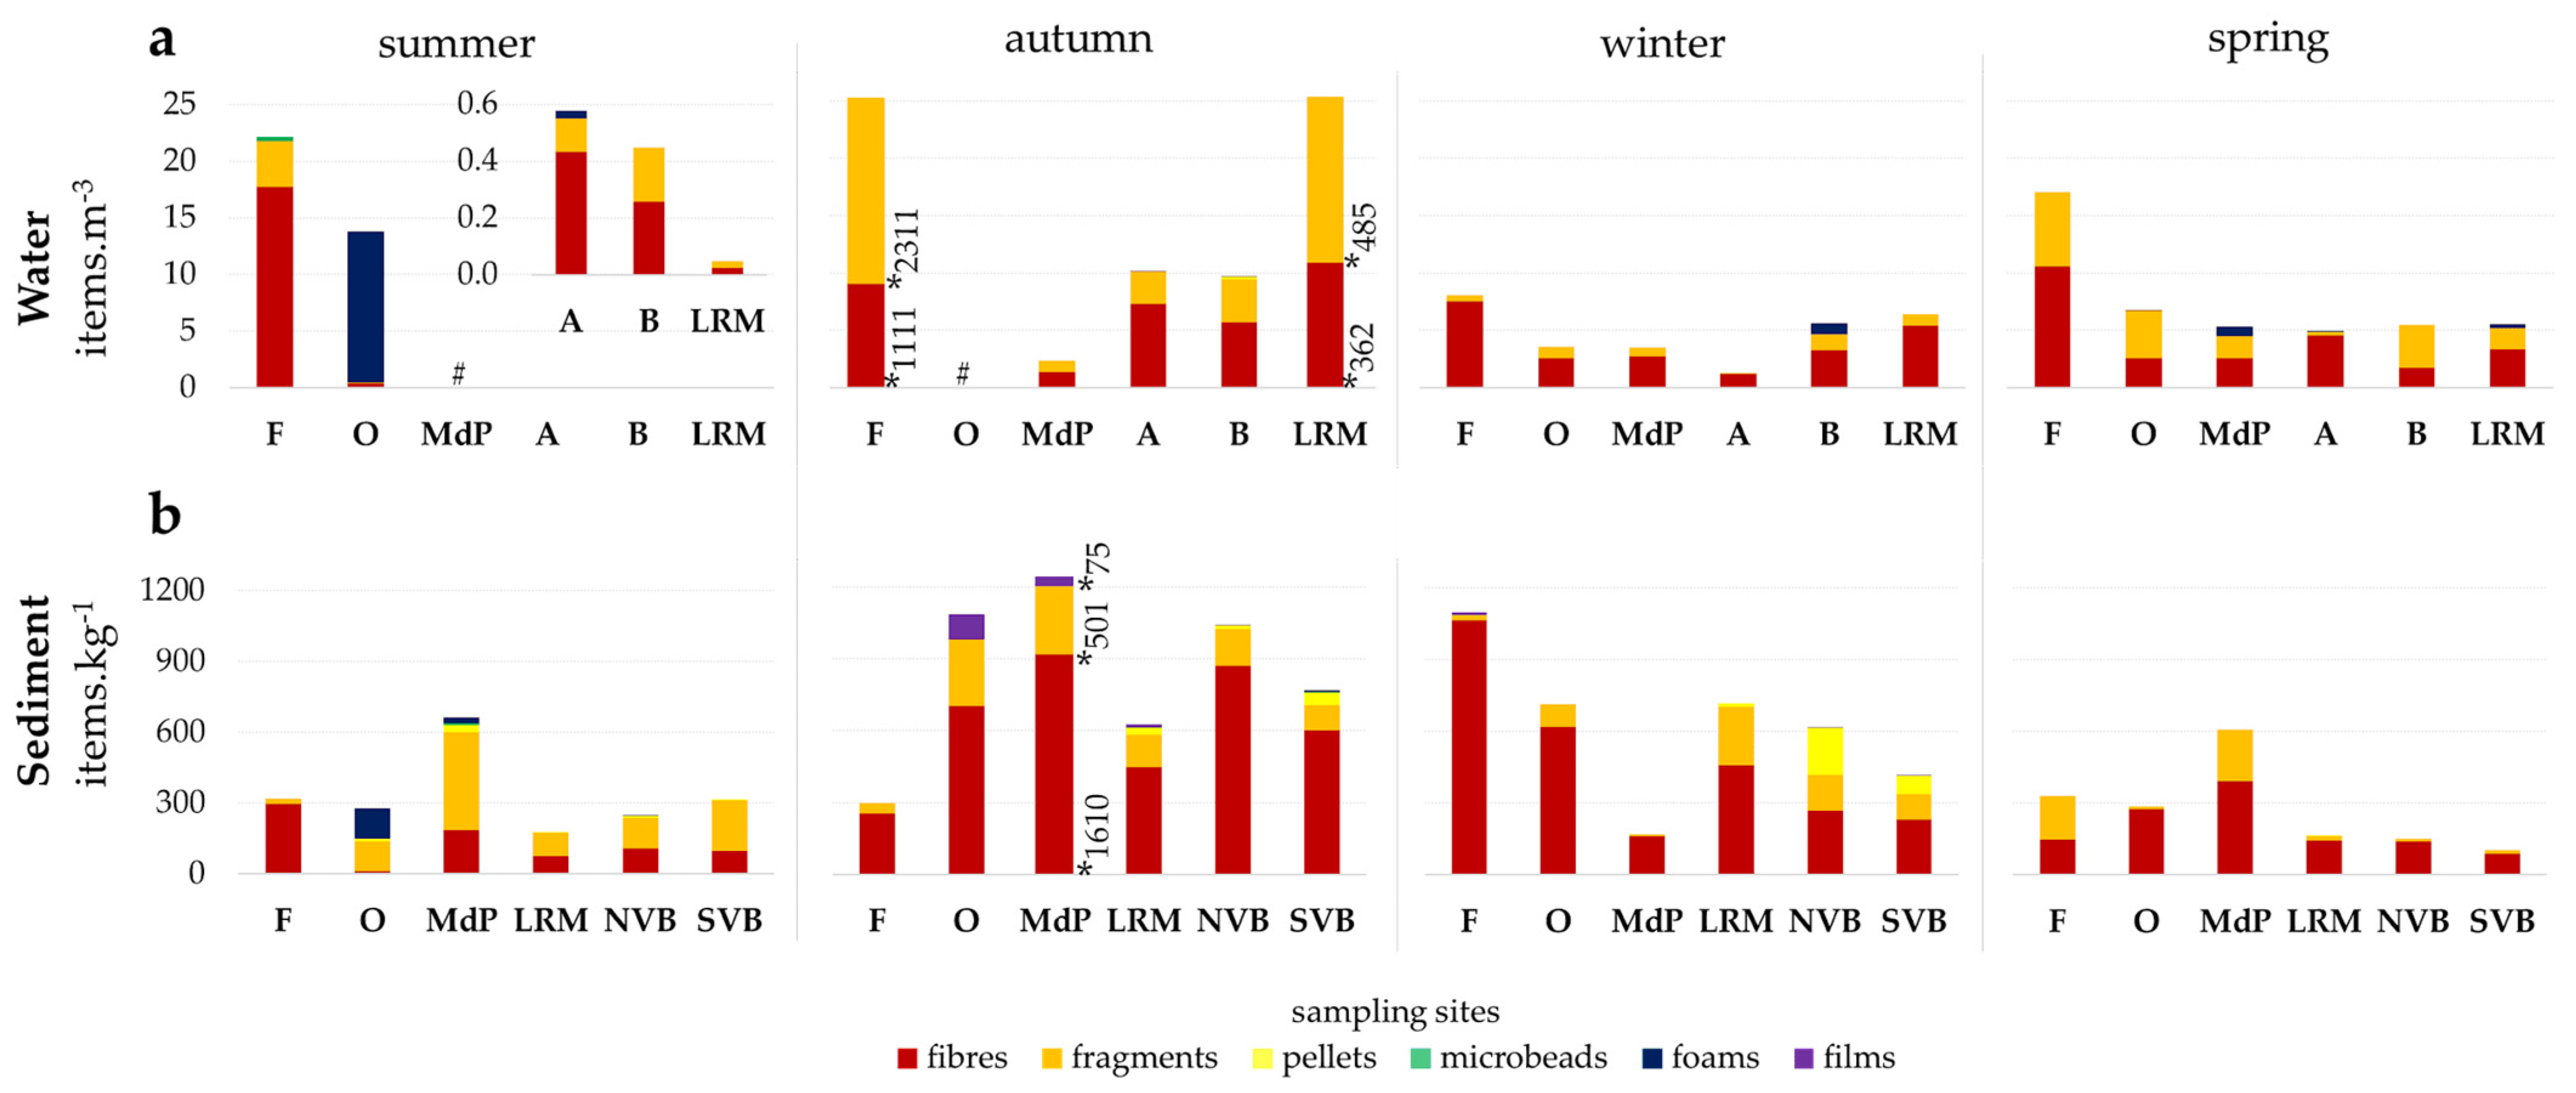
Figure 5.
Seasonal variation of MP colours (%) for fibres and fragments in (a,b) water and (c,d) sediment along Lis River: Fontes—F, Olhalvas—O, Moinho de Papel—MdP, Arrabalde—A, Bóia—B, Lis River mouth—LRM, North Vieira Beach—NVB and South Vieira Beach—SVB; (#) no data.
Figure 5.
Seasonal variation of MP colours (%) for fibres and fragments in (a,b) water and (c,d) sediment along Lis River: Fontes—F, Olhalvas—O, Moinho de Papel—MdP, Arrabalde—A, Bóia—B, Lis River mouth—LRM, North Vieira Beach—NVB and South Vieira Beach—SVB; (#) no data.
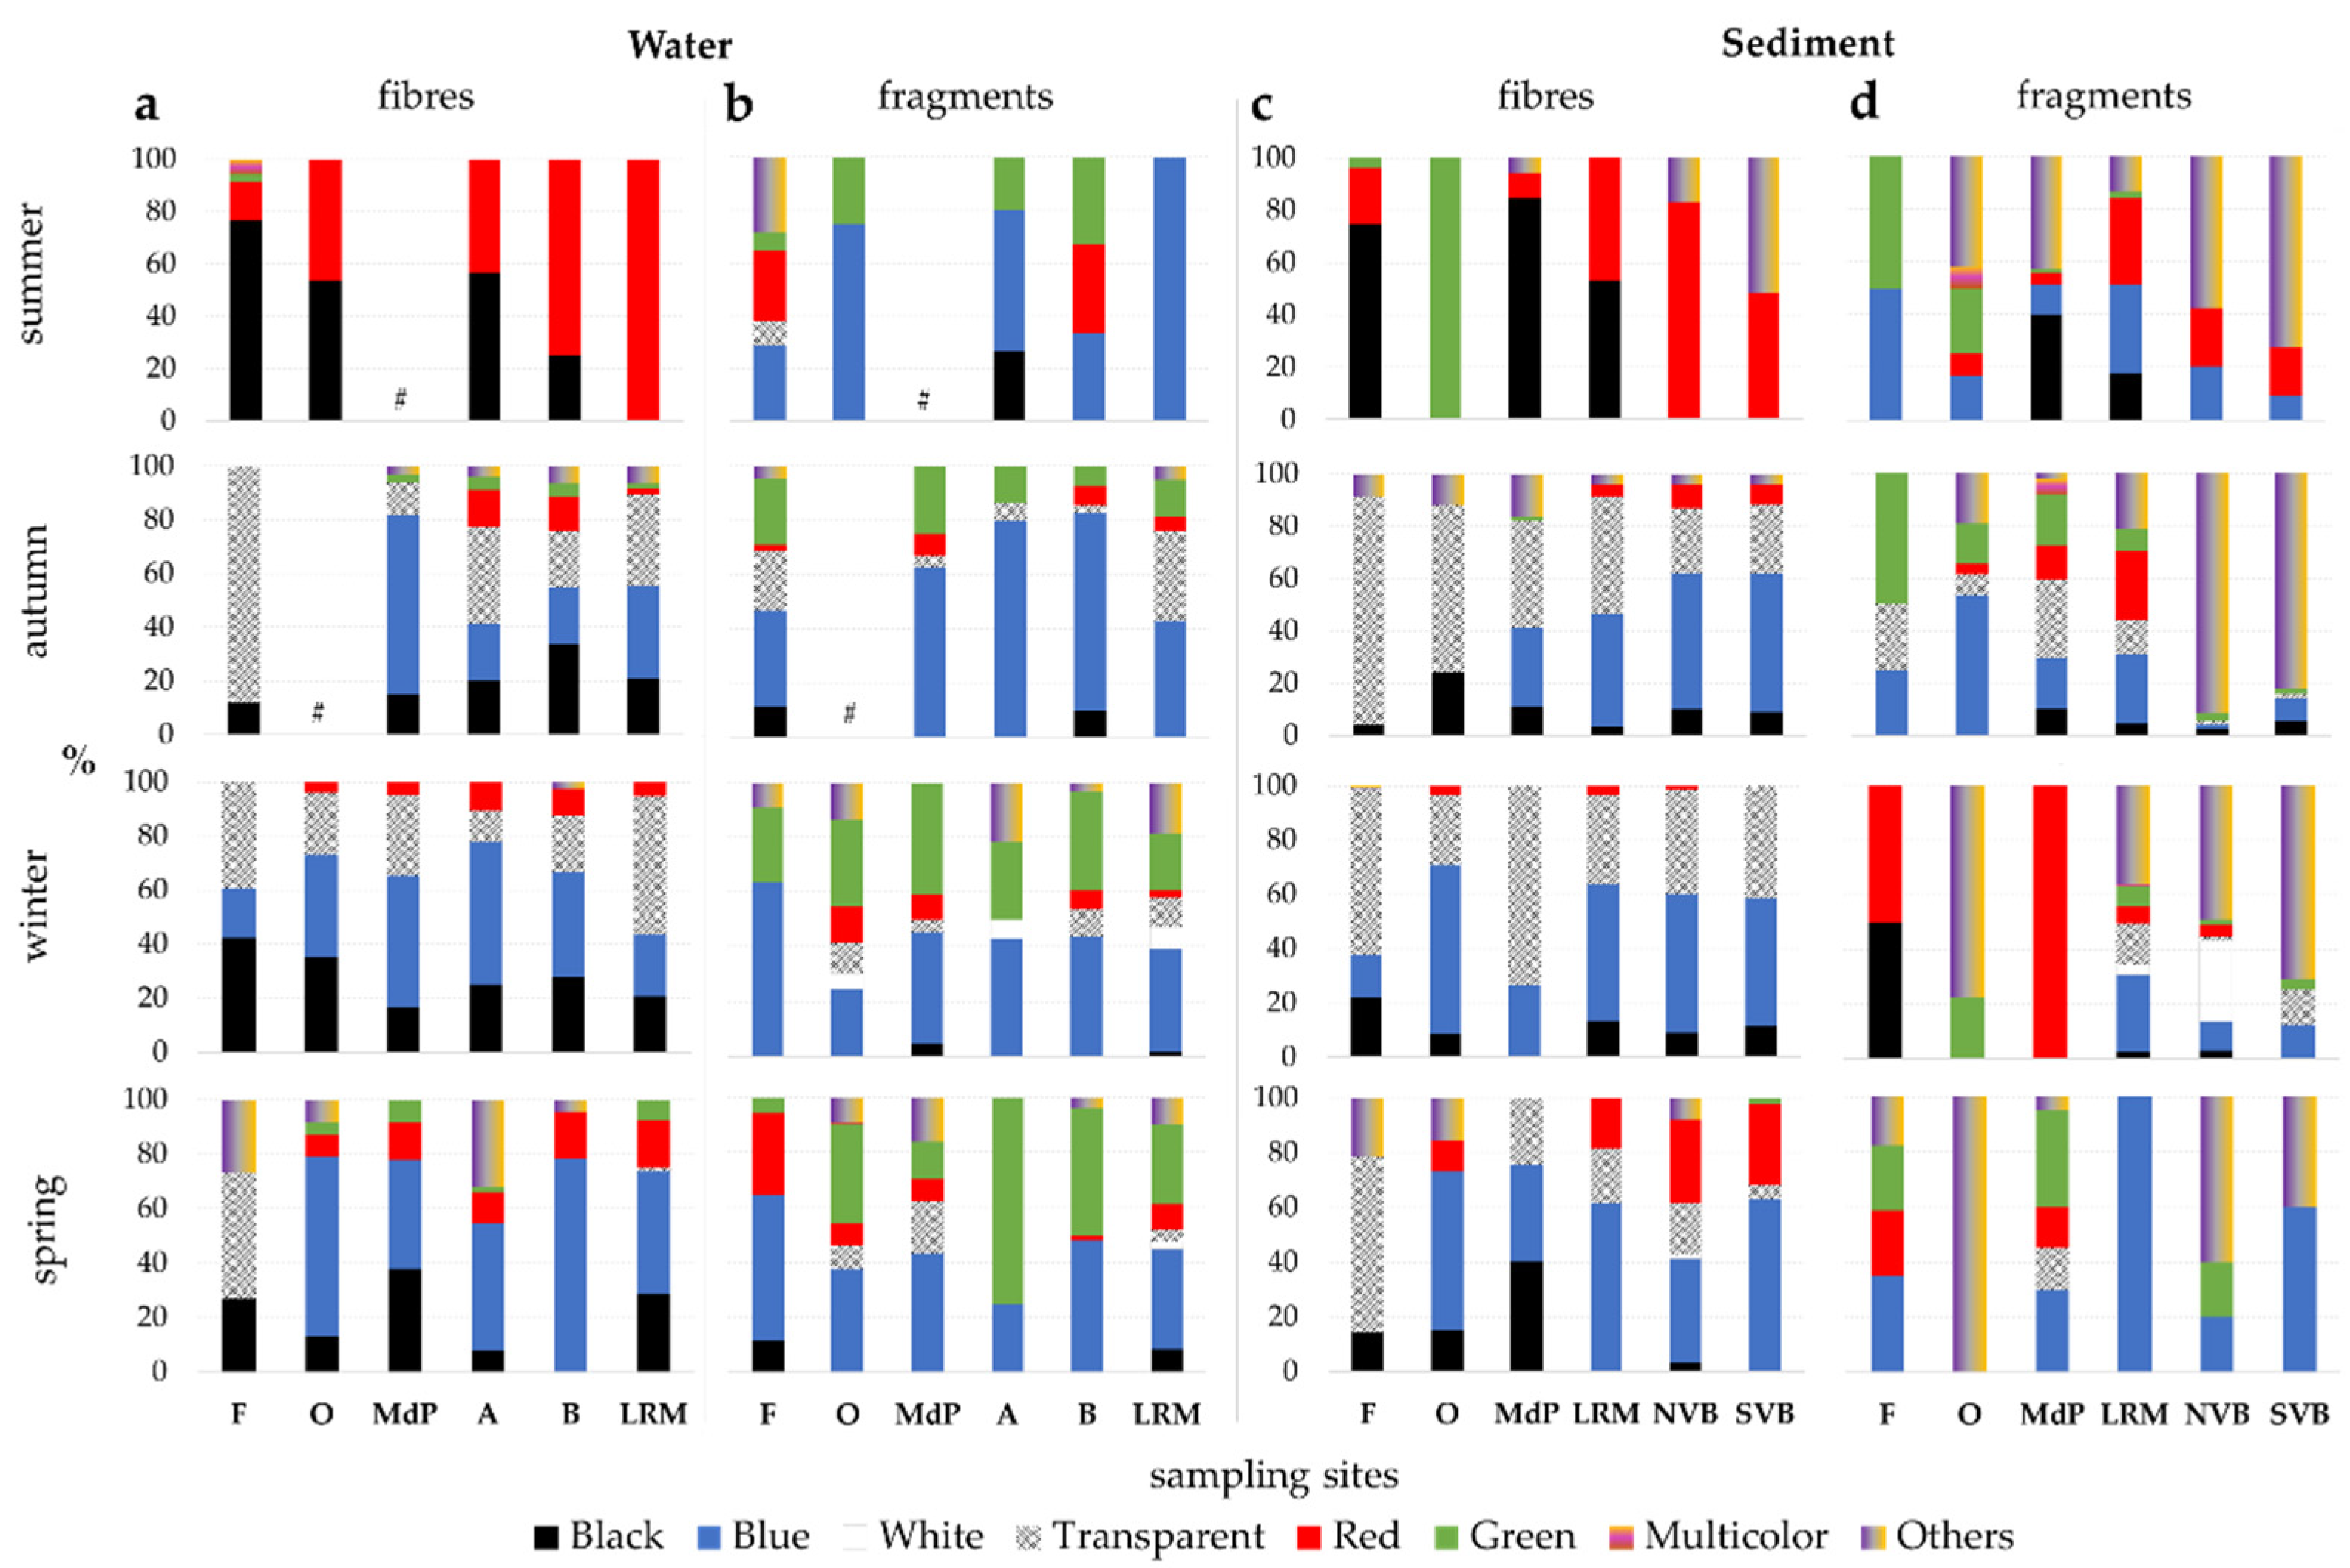
Figure 6.
Selected FTIR spectra of MP polymers from the Lis River: PETE fibres found at Arrabalde and south Vieira beach, PE pellets and fragments found at Lis River mouth and Fontes, PAcr fibre and fragment found at Olhalvas and Fontes, PP fragment and fibre found at Lis River mouth and Olhalvas, PVC fragments found at south Vieira beach and Lis River mouth, PS fibre and fragments found at Fontes, PC fragments found at Moinho de Papel and Olhalvas and one nylon fibre found at Olhalvas. Scale bar: 1000 μm; magnification: 0.8 to 2.0×.
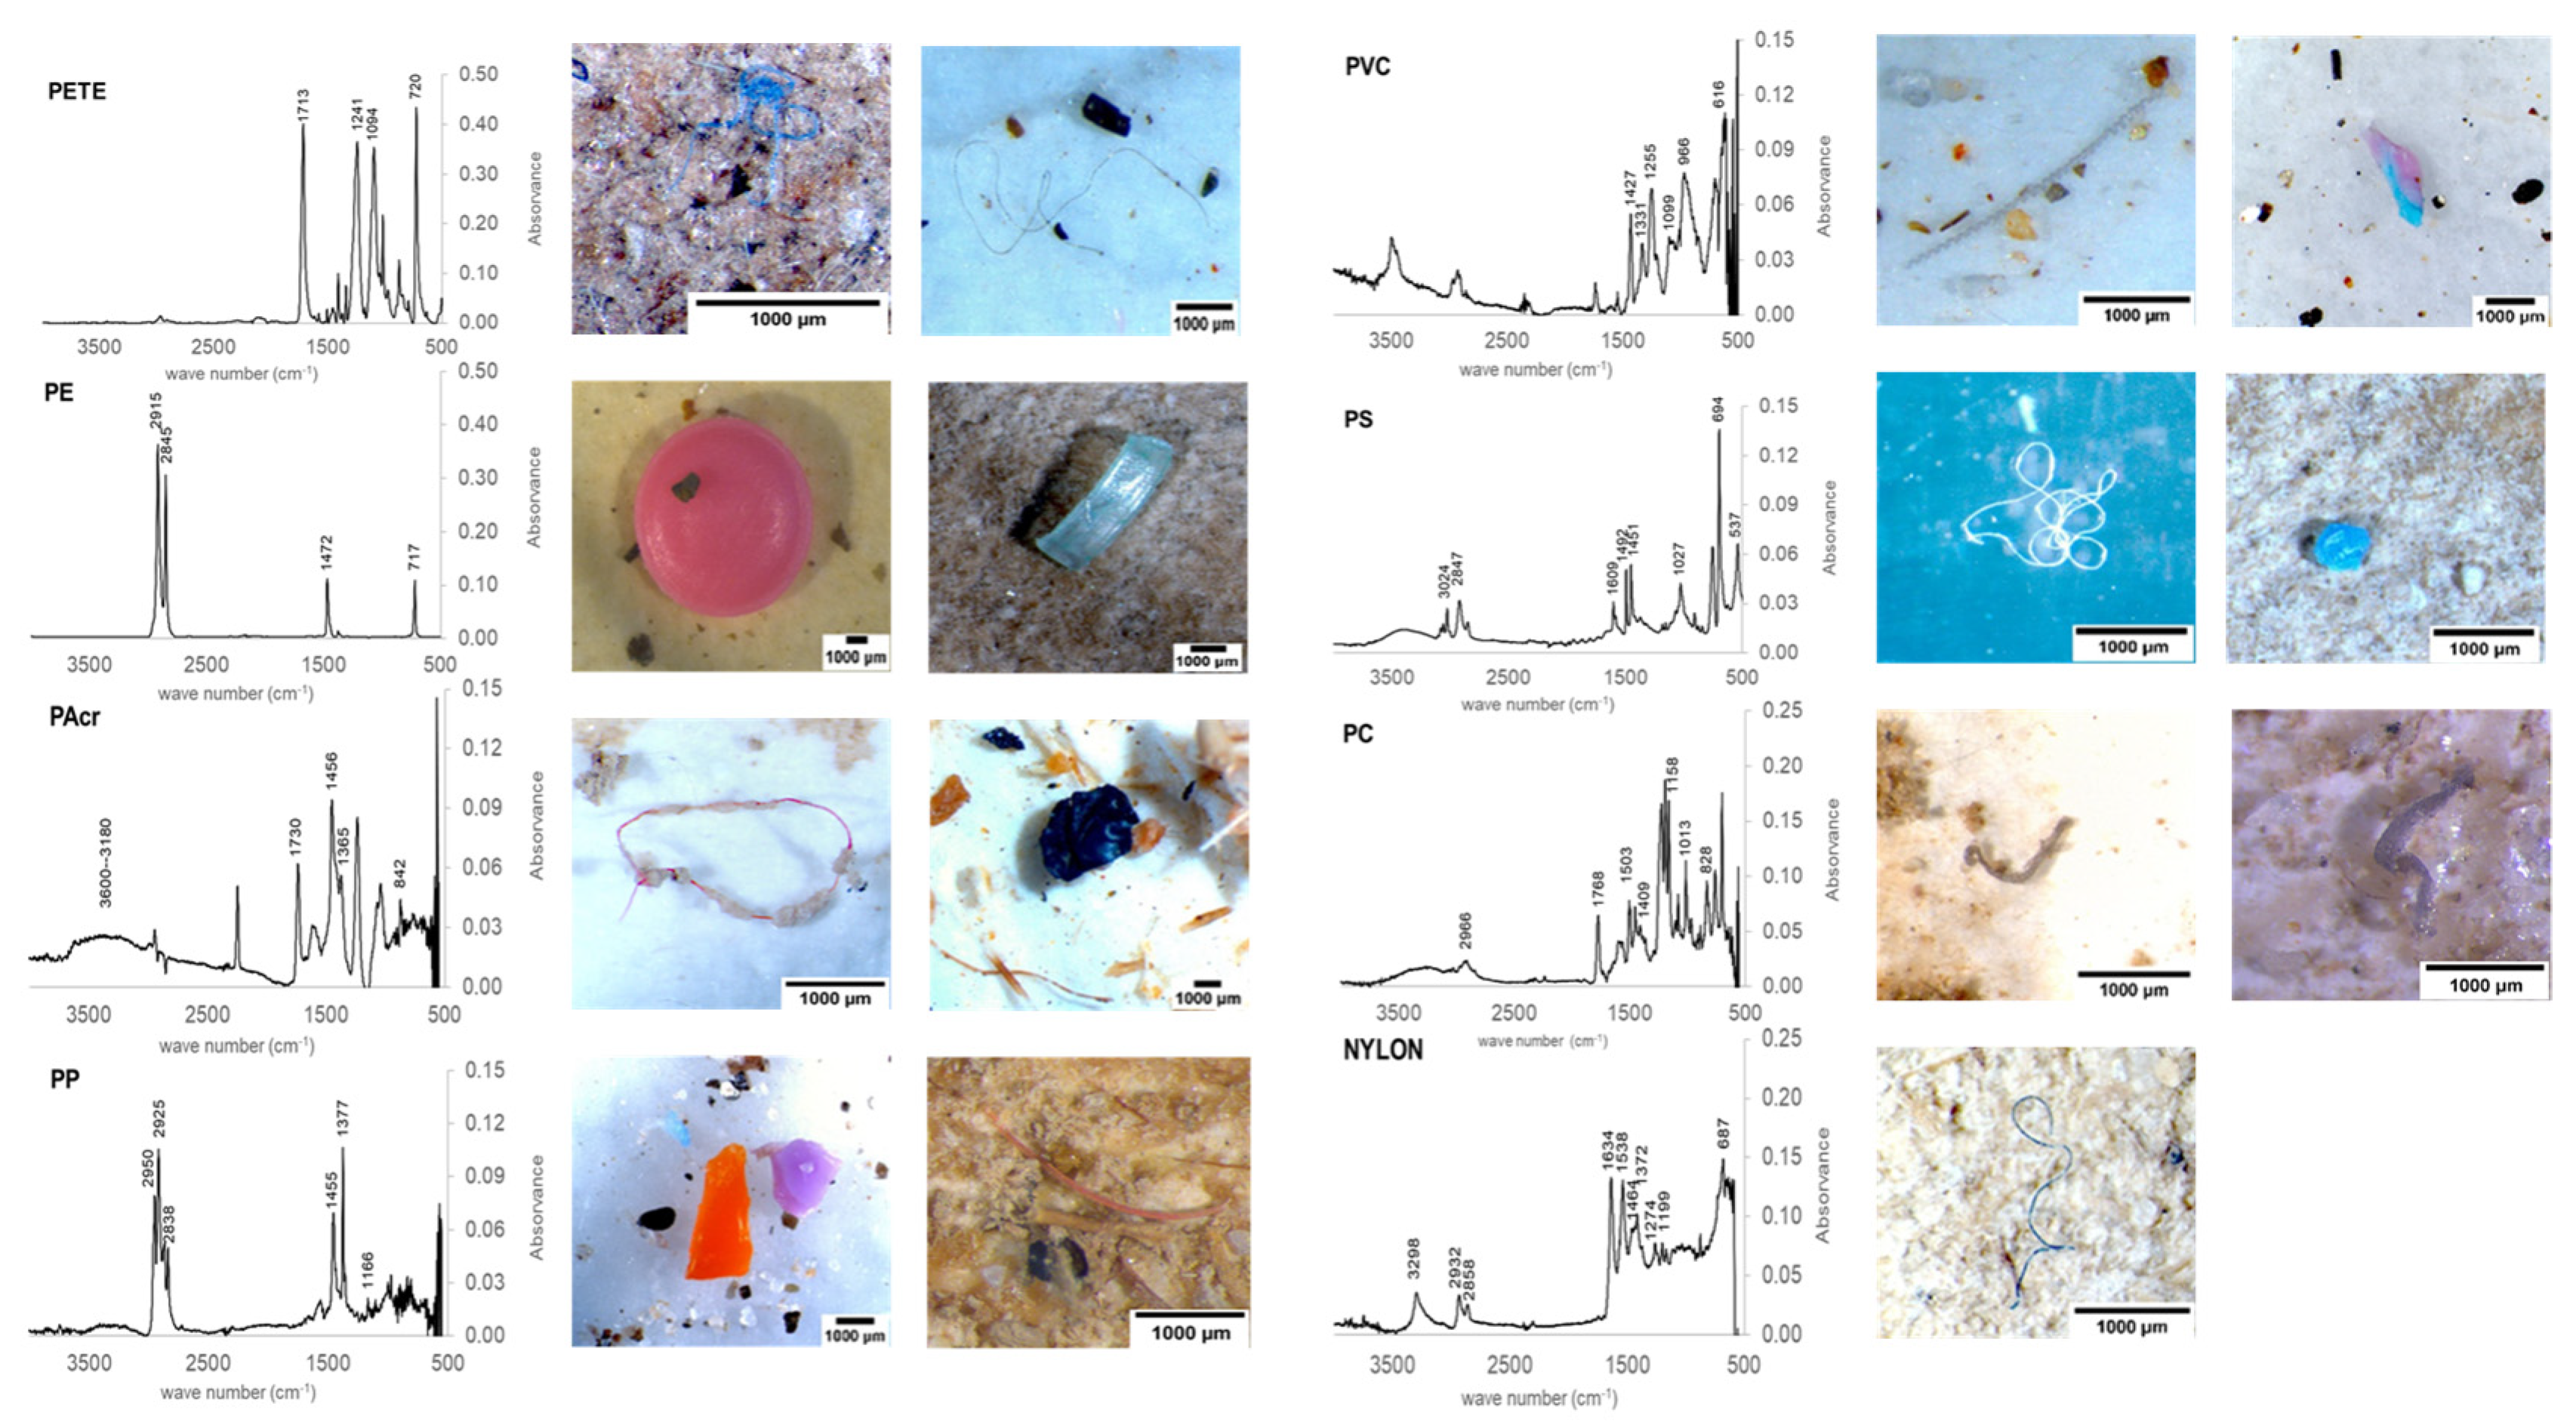
Figure 7.
Seasonal variation of MP polymer type (%) for fibres and fragments in (a,b) water and (c,d) sediment along Lis River: Fontes—F, Olhalvas—O, Moinho de Papel—MdP, Arrabalde—A, Bóia—B, Lis River mouth—LRM, North Vieira Beach—NVB and South Vieira Beach—SVB; (#) no data.
Figure 7.
Seasonal variation of MP polymer type (%) for fibres and fragments in (a,b) water and (c,d) sediment along Lis River: Fontes—F, Olhalvas—O, Moinho de Papel—MdP, Arrabalde—A, Bóia—B, Lis River mouth—LRM, North Vieira Beach—NVB and South Vieira Beach—SVB; (#) no data.
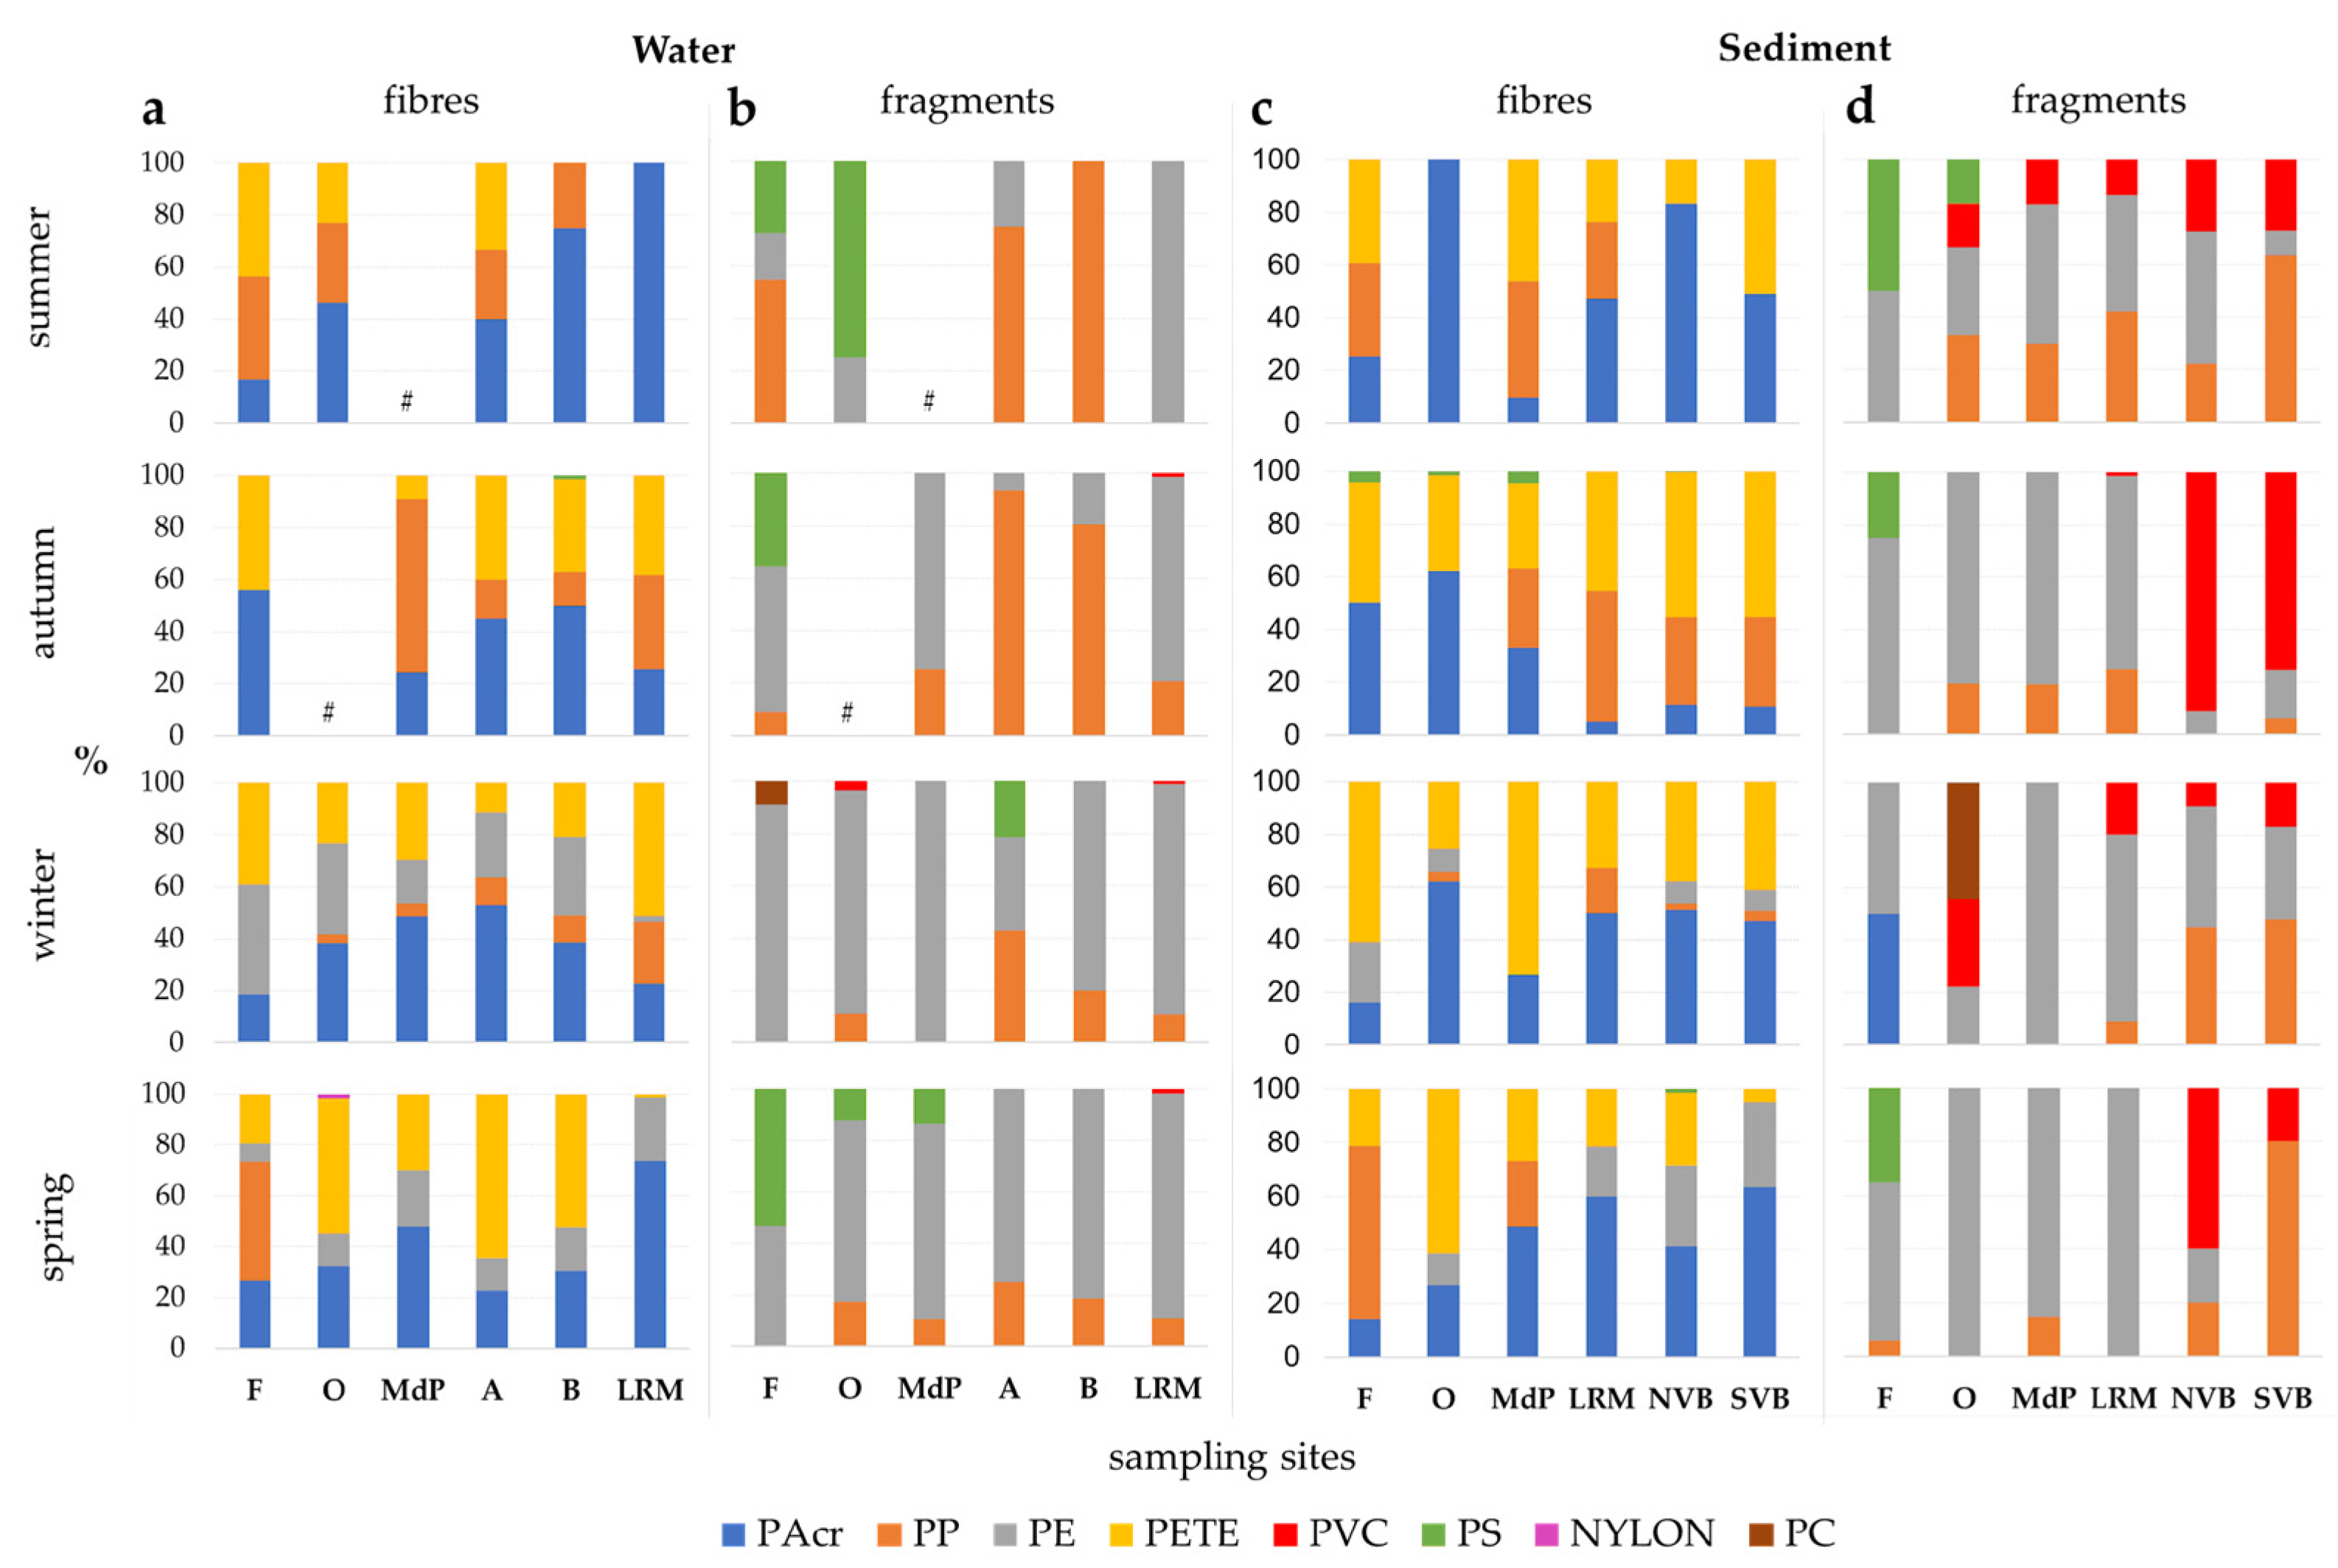
Figure 8.
Principal components analysis (PCA), during the year, between (a) MP abundance (MP ab, items.kg−1) in sediment samples, population density * (PD, hab.km−2) and proximity to companies/units < and >10 km (c/u < 10 and c/u > 10), that include plastic products manufacturers and suppliers, recycling units, solid waste management units and WWTP; (b) MP abundance (MP ab, items.kg−1), wind ** (w, km.h−1), precipitation ** (p, mm) and current velocity (cv, m.s−1); (c) abundances (items.kg−1) of different MP typologies (fibres—FB, fragments—FR, pellets—PLT, foams—FO, films—FL and microbeads—MB), population density * (PD, hab.km−2) and proximity to companies/units < and >10 km (c/u < 10 and c/u > 10) and (d) abundances (items.kg−1) of different MP typologies (fibres—FB, fragments—FR, pellets—PLT, foams—FO, films—FL and microbeads—MB), wind ** (w, km.h−1), precipitation ** (p, mm) and current velocity (cv, m.s−1); * [41]; ** [49].

Table 1.
Characteristics of the selected sampling sites: coordinates, population density * (hab.km−2), characterisation and number of potential contributors of MP (plastic products manufacturers and suppliers, recycling units, solid waste management units and wastewater treatment plants—WWTP) in the Lis River Basin, number of same potential contributors of MP that are closer and further than 10 km from the sampling site, and type of sample collected. * [41].
| Sites | Coordinates | Population Density (hab.km−2) | Characterisation and Potential Contributors | No of Potential Contributors < 10 km from Site | No of Potential Contributors > 10 km from Site | Type of Sample |
|---|---|---|---|---|---|---|
| Fontes (F) | 39°41′07.7″ N 8°46′15.9″ W | 179.3 | Closest to headwaters; Local village; Family farms; Washing clothes in the river; No plastic units upstream | 0 | 0 | water and sediment |
| Olhalvas (O) | 39°44′17.0″ N 8°47′44.3″ W | 566.6 | Next to WWTP (1); Plastic manufacturers (9); Plastic suppliers (1) | 11 | 0 | water and sediment |
| Moinho de Papel (MdP) | 39°44′25.9″ N 8°47′58.7″ W | 224.6 | Urban zone; Plastic manufacturers (9); Plastic suppliers (1); Solid waste management (1); WWTP (1) | 11 | 1 | water and sediment |
| Arrabalde (A) | 39°45′04.5″ N 8°48′44.4″ W | 1177.6 | Urban zone; Plastic manufacturers (10); Plastic suppliers (1); Solid waste management (1); WWTP (1) | 11 | 2 | water |
| Bóia (B) | 39°51′43.8″ N 8°51′45.8″ W | 210.5 | Intensive agriculture zone; Plastic manufacturers (82); Plastic suppliers (6); Recycling units (4); Solid waste management (6); WWTP (1) | 6 | 93 | water |
| Lis River mouth (LRM) | 39°52′49.6″ N 8°57′47.9″ W | 137.5 | River mouth; Pine forest of Leiria; Plastic manufacturers (87); Plastic suppliers (6); Recycling units (4); Solid waste management (6); WWTP (2) | 4 | 101 | water and sediment |
| North Vieira Beach (NVB) | 39°52′52.9″ N 8°58′11.4″ W | 137.5 | Beach; River’s disemboguement; Plastic manufacturers (87); Plastic suppliers (6); Recycling units (4); Solid waste management (6); WWTP (2) | 4 | 101 | sediment |
| South Vieira Beach (SVB) | 39°52′41.2″ N 8°58′14.3″ W | 137.5 | Beach; River’s disemboguement; Plastic manufacturers (87); Plastic suppliers (6); Recycling units (4); Solid waste management (6); WWTP (2) | 4 | 101 | sediment |
Publisher’s Note: MDPI stays neutral with regard to jurisdictional claims in published maps and institutional affiliations. |
© 2022 by the authors. Licensee MDPI, Basel, Switzerland. This article is an open access article distributed under the terms and conditions of the Creative Commons Attribution (CC BY) license (https://creativecommons.org/licenses/by/4.0/).
Share and Cite
MDPI and ACS Style
Sá, B.; Pais, J.; Antunes, J.; Pequeno, J.; Pires, A.; Sobral, P. Seasonal Abundance and Distribution Patterns of Microplastics in the Lis River, Portugal. Sustainability 2022, 14, 2255. https://doi.org/10.3390/su14042255
AMA Style
Sá B, Pais J, Antunes J, Pequeno J, Pires A, Sobral P. Seasonal Abundance and Distribution Patterns of Microplastics in the Lis River, Portugal. Sustainability. 2022; 14(4):2255. https://doi.org/10.3390/su14042255
Chicago/Turabian StyleSá, Bárbara, Joana Pais, Joana Antunes, João Pequeno, Ana Pires, and Paula Sobral. 2022. "Seasonal Abundance and Distribution Patterns of Microplastics in the Lis River, Portugal" Sustainability 14, no. 4: 2255. https://doi.org/10.3390/su14042255
Note that from the first issue of 2016, this journal uses article numbers instead of page numbers. See further details here.