Article

Responses of Soil Phosphorus Fractions to Land-Use Change in Colombian Amazon

by
Juan P. Chavarro-Bermeo
1,†,
Bruna Arruda
2,†,
Dúber A. Mora-Motta
1,
Wilfrand Bejarano-Herrera
3,
Fausto A. Ortiz-Morea
1,
Anil Somenahally
4 and
Adriana M. Silva-Olaya
1,*
1
Amazonian Research Center CIMAZ-MACAGUAL, University of the Amazon, Florencia 180002, Colombia
2
Department of Soil Science, “Luiz de Queiroz” College of Agriculture, University of São Paulo, Piracicaba 13418, Brazil
3
Colombian Corporation for Agricultural Research (AGROSAVIA)-Obonuco, Pasto 520038, Colombia
4
Department of Soil and Crop Sciences, Texas A&M University, Overton, TX 79016, USA
*
Author to whom correspondence should be addressed.
These authors contributed equally to this work.
Sustainability 2022, 14(4), 2285; https://doi.org/10.3390/su14042285
Submission received: 11 January 2022 / Revised: 10 February 2022 / Accepted: 13 February 2022 / Published: 17 February 2022
(This article belongs to the Special Issue Assessment and Monitoring of Land Degradation)

Abstract

:
Intensive land-use change, the overgrazing of pastures, and the poor soil management in the Amazon region induce significant soil chemical degradation, causing alterations in the soil phosphorus (P) dynamics. Here, we studied the changes in P fractions and availability throughout the soil profile along a chronosequence composed of four study areas representing the typical land-use transition from forest to pasture for extensive cattle ranching in the Colombian Amazon region: (i) Forest—Deforested—Pasture 4 years old and Pasture established >25 years after deforestation. Soil samples collected at 0–10, 10–20, 20–30, and 30–40 cm depth were used for the sequential fractionation of P, determination of acid phosphatase activity and soil organic carbon (C) content, and calculation of C:organic P (Po) ratio and P stocks. Our results showed that the land-use change caused a decrease of 31.1% in the fractions of labile inorganic P, with the mineralization of organic P by phosphatase enzyme playing an essential role in the P availability. Although according to the C:Po ratio of the deeper layer the P seems to be sufficient to satisfy the plant needs of all the land uses assessed, the exploitation of soil nutrients in pastures reduced by 6.1% the moderately and non-labile P stock. Given the role of cattle ranching in the economy of tropical countries, it is imperative to adopt strategies of soil P management to improve P-use efficiency, avoiding the degradation of grazing land resources while ensuring the long-term sustainability of rangeland livestock and decrease further deforestation of the Amazon rainforest.

1. Introduction

The Amazon forest is the largest tropical forest in the world and plays a valuable role in global carbon flow and the water cycle [1,2]. However, despite the importance of this biome, the expansion of the agricultural frontier has been causing alarming deforestation rates [3], with an important portion of the forest loss occurring in the Colombian territory, where the establishment of pastures for livestock production has maintained an arc of deforestation since 2015 [4].
The land-use change process, overgrazing of pastures, and the poor soil management practiced by the farmers in the Colombian Amazon induce significant soil degradation, leading to unproductive pastures over time. Alterations in the soil nutrient dynamics [5,6,7] and possibly in the cycling of phosphorus (P) [8], one of the most limiting elements for plant growth [9,10], are related to the soil chemical degradation in this region.
Soil P is found in inorganic and organic forms, and its distribution varies according to soil use and composition in both natural ecosystems and agroecosystems [11,12,13,14]. In tropical soils, where the high acidity and concentration of iron (Fe) and aluminum (Al) sesquioxides favor the absorption and chemical fixation of P in non-labile fractions, the organic P plays an important role [15,16,17,18]. The turnover of organic P and the rapid recycling of P from litterfall are the main processes driving the P availability to plants in natural ecosystems, where there is no P addition [19]. Therefore, with the forest clearing, a redistribution of different P pools in the soil could be expected [5,10,14], potentially aggravating the natural condition of low P availability in tropical soils.
Although different techniques have been developed in order to explore the distinct P pools in the soil and their responses to land use and soil management [20,21,22,23], comprehensive studies revealing the impact of land-use change on soil P fractions are still scarce in the Amazon region and particularly in the Colombian portion.
Investigating the alterations in this soil P bioavailability along the land-use transition from forest to extensive pastures can provide important insights for developing management strategies that promote sustainable land use, the restoration of degraded land, and therefore the reduction of further deforestation of this important biome. Hedley chemical sequential P fractionation [21] is a convenient analytical approach for assessing P bioavailability. This approach allows the partitioning of soil total P into fractions of different plant availabilities, often grouped into a labile pool, supplying the short-term P demand of plants; a moderately labile pool involving inorganic and organic P that can be converted into labile P forms; and a pool of stable or occluded P that contributes in negligible quantities to the plant nutrition [19,24,25].
In this context, this study aimed to verify the changes in soil P fractions and availability throughout the soil profile caused by the typical land-use transition from rainforest to pasture in the northwestern Colombian Amazon. Additionally, we also assessed the alterations in the soil P nutritional status by using the C:Po ratio indicator, as well as the influence of acid phosphatase activity on labile P fractions. We hypothesized that the forest clearing for cattle ranching in the Colombian Amazon region alters the soil P dynamics by decreasing labile P fractions and the C:Po ratio in the soil profile. We further believe that phosphatase enzymatic activity plays an important role in the short-term P supply.

2. Materials and Methods

2.1. Description of Study Areas

The study was carried out in northwestern Colombian Amazon, in Caquetá state, specifically in the Solano municipality (0°42′00.9231″ N, 75°15′23.3993″ W) (Figure 1a), a region with a climate classified as a tropical rainforest (Af type in Koppen classification), with an average annual rainfall of 3793 mm, an average annual temperature of 25.5 °C, and relative humidity greater than 80%. The soil is classified as Typic Hapludult, which is highly weathered, moderately deep, and very acidic, with high Al saturation, low cation exchange capacity, and basic cation content (Ca2+, Mg2+, K+, and Na+) [26].
We used the chronosequence approach to study the impact of land-use transition on soil P fractions. Four areas with the same soil type and similar climatic and topographic conditions but different land-use histories were selected (Figure 1b). The land-use chronosequence consisted of (i) natural forest area (Forest), a relatively undisturbed dense high ground primary forest; (ii) recently deforested area (Deforested), where the natural primary forest was cut down, burned, and a transitory crop of maize (Zea mays L.) was established 1 year after deforestation; (iii) Pasture4, where pasture (Brachiaria sp.) was established 4 years after the deforestation event; and (iv) Pasture >25: pasture (Brachiaria sp.) established more than 25 years ago after slash-and-burn of native forests. Both pasture areas have an occupation of approximately one cattle head per hectare.

2.2. Soil Sampling and Analysis

A sampling grid composed of six plots (25 m−2; spaced 120 m apart) was established in each study area, and then ten soil cores (5 cm internal diameter × 10 cm depth) were collected at 10 cm depth increments until reaching 40 cm depth within each sampling plot. Soil subsamples from the same layer were mixed to form a composite sample per layer per plot, for a total of 240 subsamples and 24 composite samples per study area.
A small trench (30 × 30 × 40 cm) was also opened in each sampling plot to collect undisturbed soil samples from the 0–10, 10–20, 20–30, and 30–40 cm layers using a steel cylinder (5 × 5 cm; ~98 cm−3), which were analyzed to determine soil bulk density [27,28].
Before the analysis, samples for P determination were air-dried and homogenized (2 mm sieved). Chemical P fractionation was performed as described by Hedley et al. [21], with modifications proposed by Condron et al. [29]. Briefly, a sequential extraction of the P pools, either inorganic P (Pi) or organic P (Po), was performed in individual soil samples in solution extractant as follows: first, the labile Pi was extracted using an anion exchange resin (P_resin) saturated with 0.5 M NaHCO3. Subsequently, the same soil sample was submitted to sequential extractions with 0.5 M NaHCO3 (Pi_bic); 0.1 M NaOH (Pi_hyd 0.1); 1.0 M HCl (Pi_HCl); and 0.5 M NaOH (Pi_hyd 0.5). After the sequential soil P extractions, the residual P (P_residual) was determined in the dried soil by subjecting it to digestion (H2SO4, H2O2, and saturated MgCl2). The alkaline extractants were digested with H2SO4 and (NH4)2S2O8 to obtain the total P for each extractant, where the organic P was released as inorganic P. The organic P fractions (Po_bic; Po_hyd 0.1; and Po_hyd 0.5) were estimated based on the difference between the P (from the digestion) and the inorganic P (from the extractant). P concentrations were determined using the colorimetric method; for acidic extracts using the method of Murphy and Riley [30]; and in the alkaline extracts, the method of Dick and Tabatabai [31].
The P fractions were grouped according to their lability as follows: labile P pool (P_resin + Pi_bic + Po_bic), moderately labile P pool (Pi_hyd 0.1 + Po_hyd 0.1 + Pi_HCl), and non-labile P pool (Pi_hyd 0.5 + Po_hyd 0.5 + P_residual). The total P was calculated as the sum of all the fractions. In addition, the P fractions were grouped into biological and geochemical P, following the methodology proposed by Cross and Schlesinger [32] which includes all organic fractions (Po_bic + Po_hyd 0.1 + Po_hyd 0.5) and the second includes all inorganic fractions (P_resin + Pi_bic + Pi_hyd 0.1 + Pi_HCl + Pi_hyd 0.5 + P_residual). The C:Po ratio was also calculated according to Equation (1):
C : P o = C ( Po _ bic +   Po _ hyd 0.1 +   Po _ hyd 0.5 )
where C : P o : is the ratio between soil C and soil organic P; C is soil C (%); Po _ bic (%); and Po _ hyd 0.1   (%) and Po _ hyd 0.5 (%) is the soil organic P obtained by Hedley fractionation.
For soil C quantification, the samples were ground to a fine powder and sieved to 150 µm before determination by dry combustion [33] using a CN 802 carbon-nitrogen elemental analyzer (furnace at 1000 °C in pure oxygen).
P stock was calculated using Equation (2) [34] and then adjusted by the fixed mass method using the forest site as a reference [35].
S = B · P · L
where S is soil P Stock (Mg ha−1); B is soil bulk density (g cm−3); P is soil P concentration (%); and L is the soil layer thickness (cm).
P labile pools (labile, moderately labile, and non-labile) were calculated per layer. The total P stocks were calculated as the sum of all the P stock labilities per soil layer.
For the soil phosphatase activity assessment, a sampling grid composed of four plots (25 m−2; spaced 120 m apart) was established in each study area. Within each plot, six soil subsamples were collected at a depth of 0–10 cm and then mixed to form a composite sample, which was refrigerated (4 °C) and transported (<24 h) to the Biogeochemical Process Laboratory at the University of the Amazon for enzymatic analysis according to Bell et al. [36]. Briefly, a soil suspension was prepared in 0.05 M sodium acetate buffer solution with a pH close to the soil pH. Then, 800 µL of soil slurry was pipetted into 96-well deep plates. Separate plates were prepared to obtain 4-methylumbelliferone standard curves for each sample. Appropriate standards and substrates (200 µL) were then added to the soil slurries. The samples and standards were then incubated for 3 h at room temperature. The supernatants were pipetted into black 96-well plates and the fluorescence was measured at excitation and emission wavelengths of 365 and 450 nm, respectively, in the VarioSkan Lux multimode microplate reader. Absolute enzyme absolute activity was expressed in units of nmol of product per gram of oven-dry weight soil/litter per hour.

2.3. Statistical Analysis

A linear mixed effects model (lmer) was adjusted by considering land-use systems and soil depths as fixed factors and field plots as random factors. The assumptions of normality and homogeneity of variance were checked using an exploratory residual analysis. Variables with abnormality were sought for their best distribution, using the set of Gamma family’s distribution or failing to look for the most significant transformation according to the lambda values for each variable. Differences in mean values of P fractions, labilities, C:Po ratio, and P stock between land-use systems assessed were tested for each soil layer (0–10; 10–20; 20–30; 30–40 cm) or weighted mean profile (0–40 cm), applying the HSD Tukey test (p < 0.05), using the “multcomp” package [37]. The correlation between acid phosphatase activity and labile P fractions was verified using the Pearson’s correlation coefficient (p < 0.05).
Principal component analysis (PCA) was performed by using the “FactoMineR” package [38] and the “factoextra” package [39] in association with the “ggplot2” package [40]. The Monte-Carlo test (999 permutations) was applied to evaluate the overall effect of land use and depth on soil P fractions, and the test was performed by using the “Ade4” package [41]. All analyses were conducted using the statistical software R version 4.0.4 [42] and the programming language RStudio version 1.3.1 [43].

3. Results

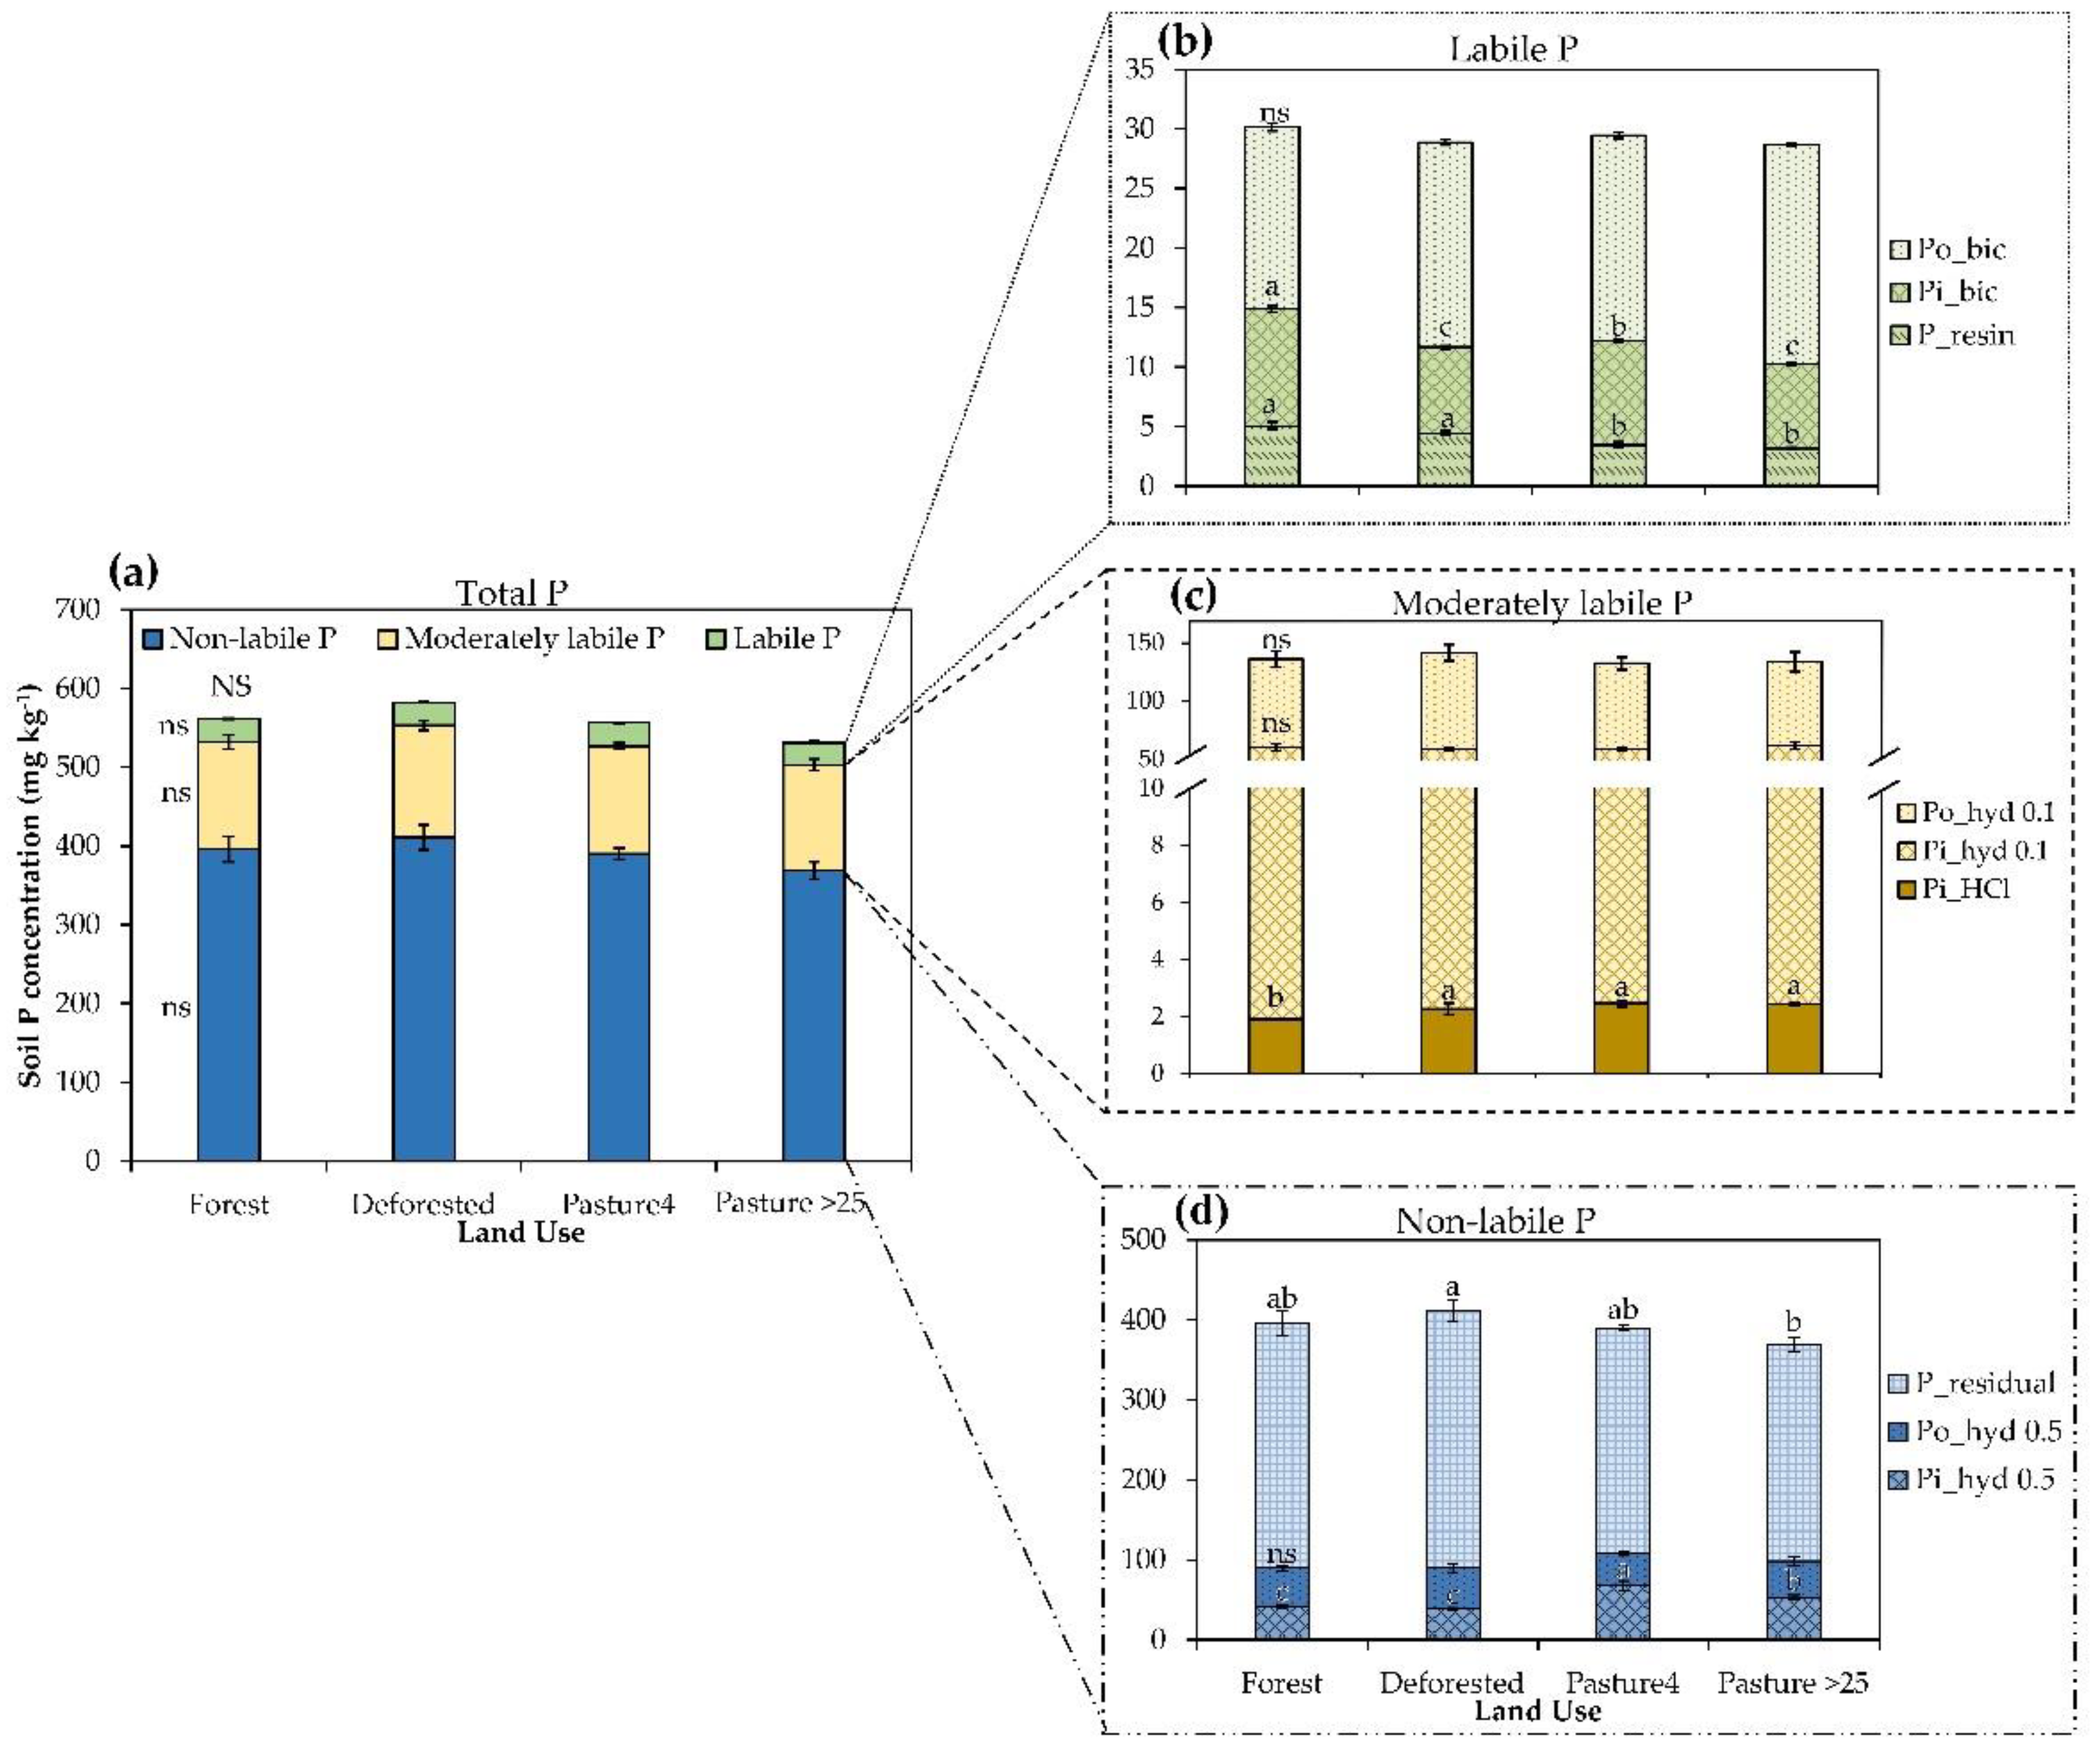
3.1. Effect of Land-Use Change in the Soil P Fractions

The relationship between the soil P fractions and the land-use systems and the soil depths was investigated using PCA (Figure 2a). The first two components explained 46.3% of the variance, with P fractions grouped into two clusters clearly defined according to land use (Figure 2b) (p < 0.001; 25% of explained variance), indicating that the distribution of P in the forest and deforested areas was more similar to each other, with higher values than those observed in pastures (4 and >25 years old). The upper soil layers (0–10 cm) showed a different trend than the other layers, being highly related to organic and inorganic labile P fractions (P_resin; Pi_bic; Po_bic) (Figure 2c) (p < 0.001; 20% of explained variance).
Although by considering the soil 0–40 cm layer no differences in the total P neither in the P lability were observed due to the land-use changes (Figure 3a), some particularities for the different P fractions as well as for each lability pool were observed across the profile (Figure 3b–d). In general, no differences were detected in the organic pools, regardless of the lability. For Pi, Forest showed the highest labile P concentration compared to the other systems (Figure 3b), while the opposite trend was observed for the moderately labile P pool, where an increment in Pi_HCl was observed as a response to the establishment of agricultural systems (Figure 3c).
Regarding the non-labile P pool, lower Pi_hyd 0.5 values were found in Forest and Deforested areas than in Pasture areas (Figure 3d). Residual P was the most abundant fraction along the chronosequence. Although no differences were observed among Forest, Deforested, and Pastures 4 years old, a reduction in the concentration of this fraction was observed under Pasture >25 area.
Analysis of the soil P fractions in the assessed soil layers showed some alterations in response to land-use changes (Table 1). In general, there was a decreasing trend in the levels of labile Pi from forest to pastures, with P_resin and Pi_bic showing higher values in Forest and Deforested areas than in pastures in all the studied soil layers. In contrast, the opposite trend was observed in the moderately labile inorganic P fraction, Pi_HCl, where an accumulation in P concentration due to the land-use transition to pasture was detected in the soil profile (Table 1).
Regarding the Po, in the upper layer (0–10 cm), the moderately labile fraction (Po-hyd 0.1) showed a similar pattern to that observed in Pi_HCl. Differences in the labile organic P fraction were observed only in the deepest layer (30–40 cm), where Pasture >25 years old showed the highest values of Po_bic, Pasture 4 years old and Deforested areas showed intermediated values, and Forest showed the lowest Po_bic (Table 1).

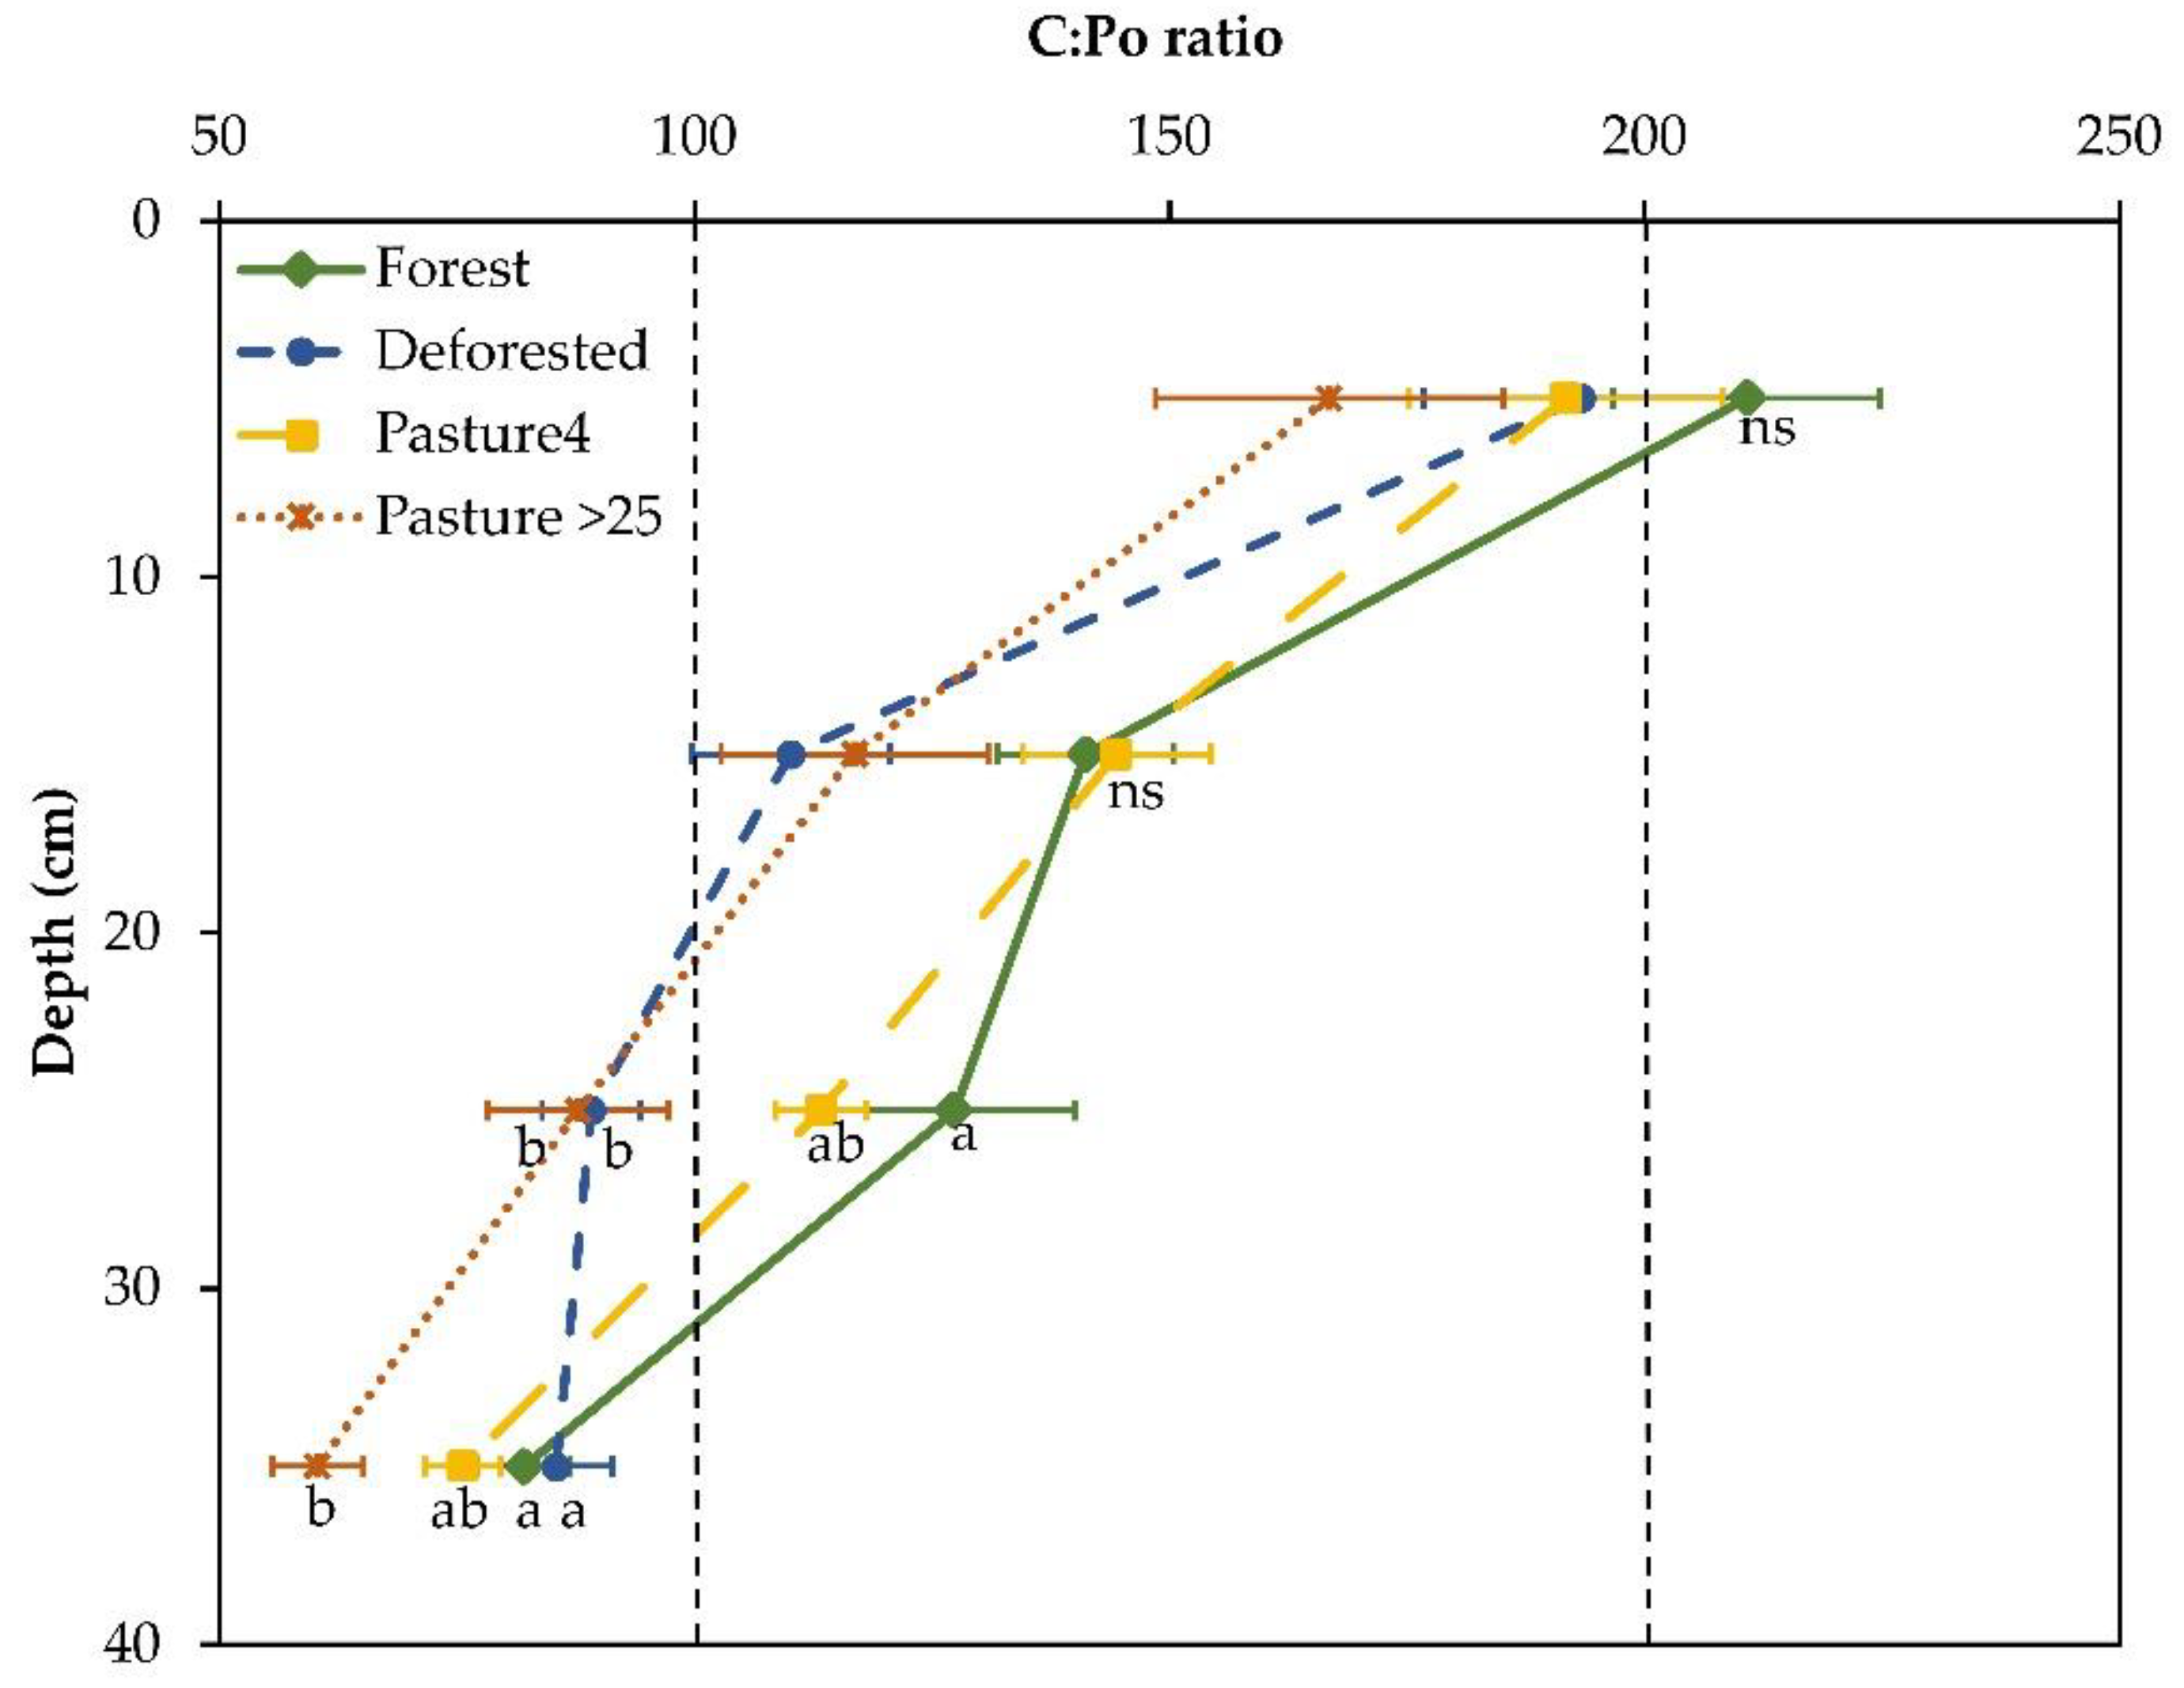
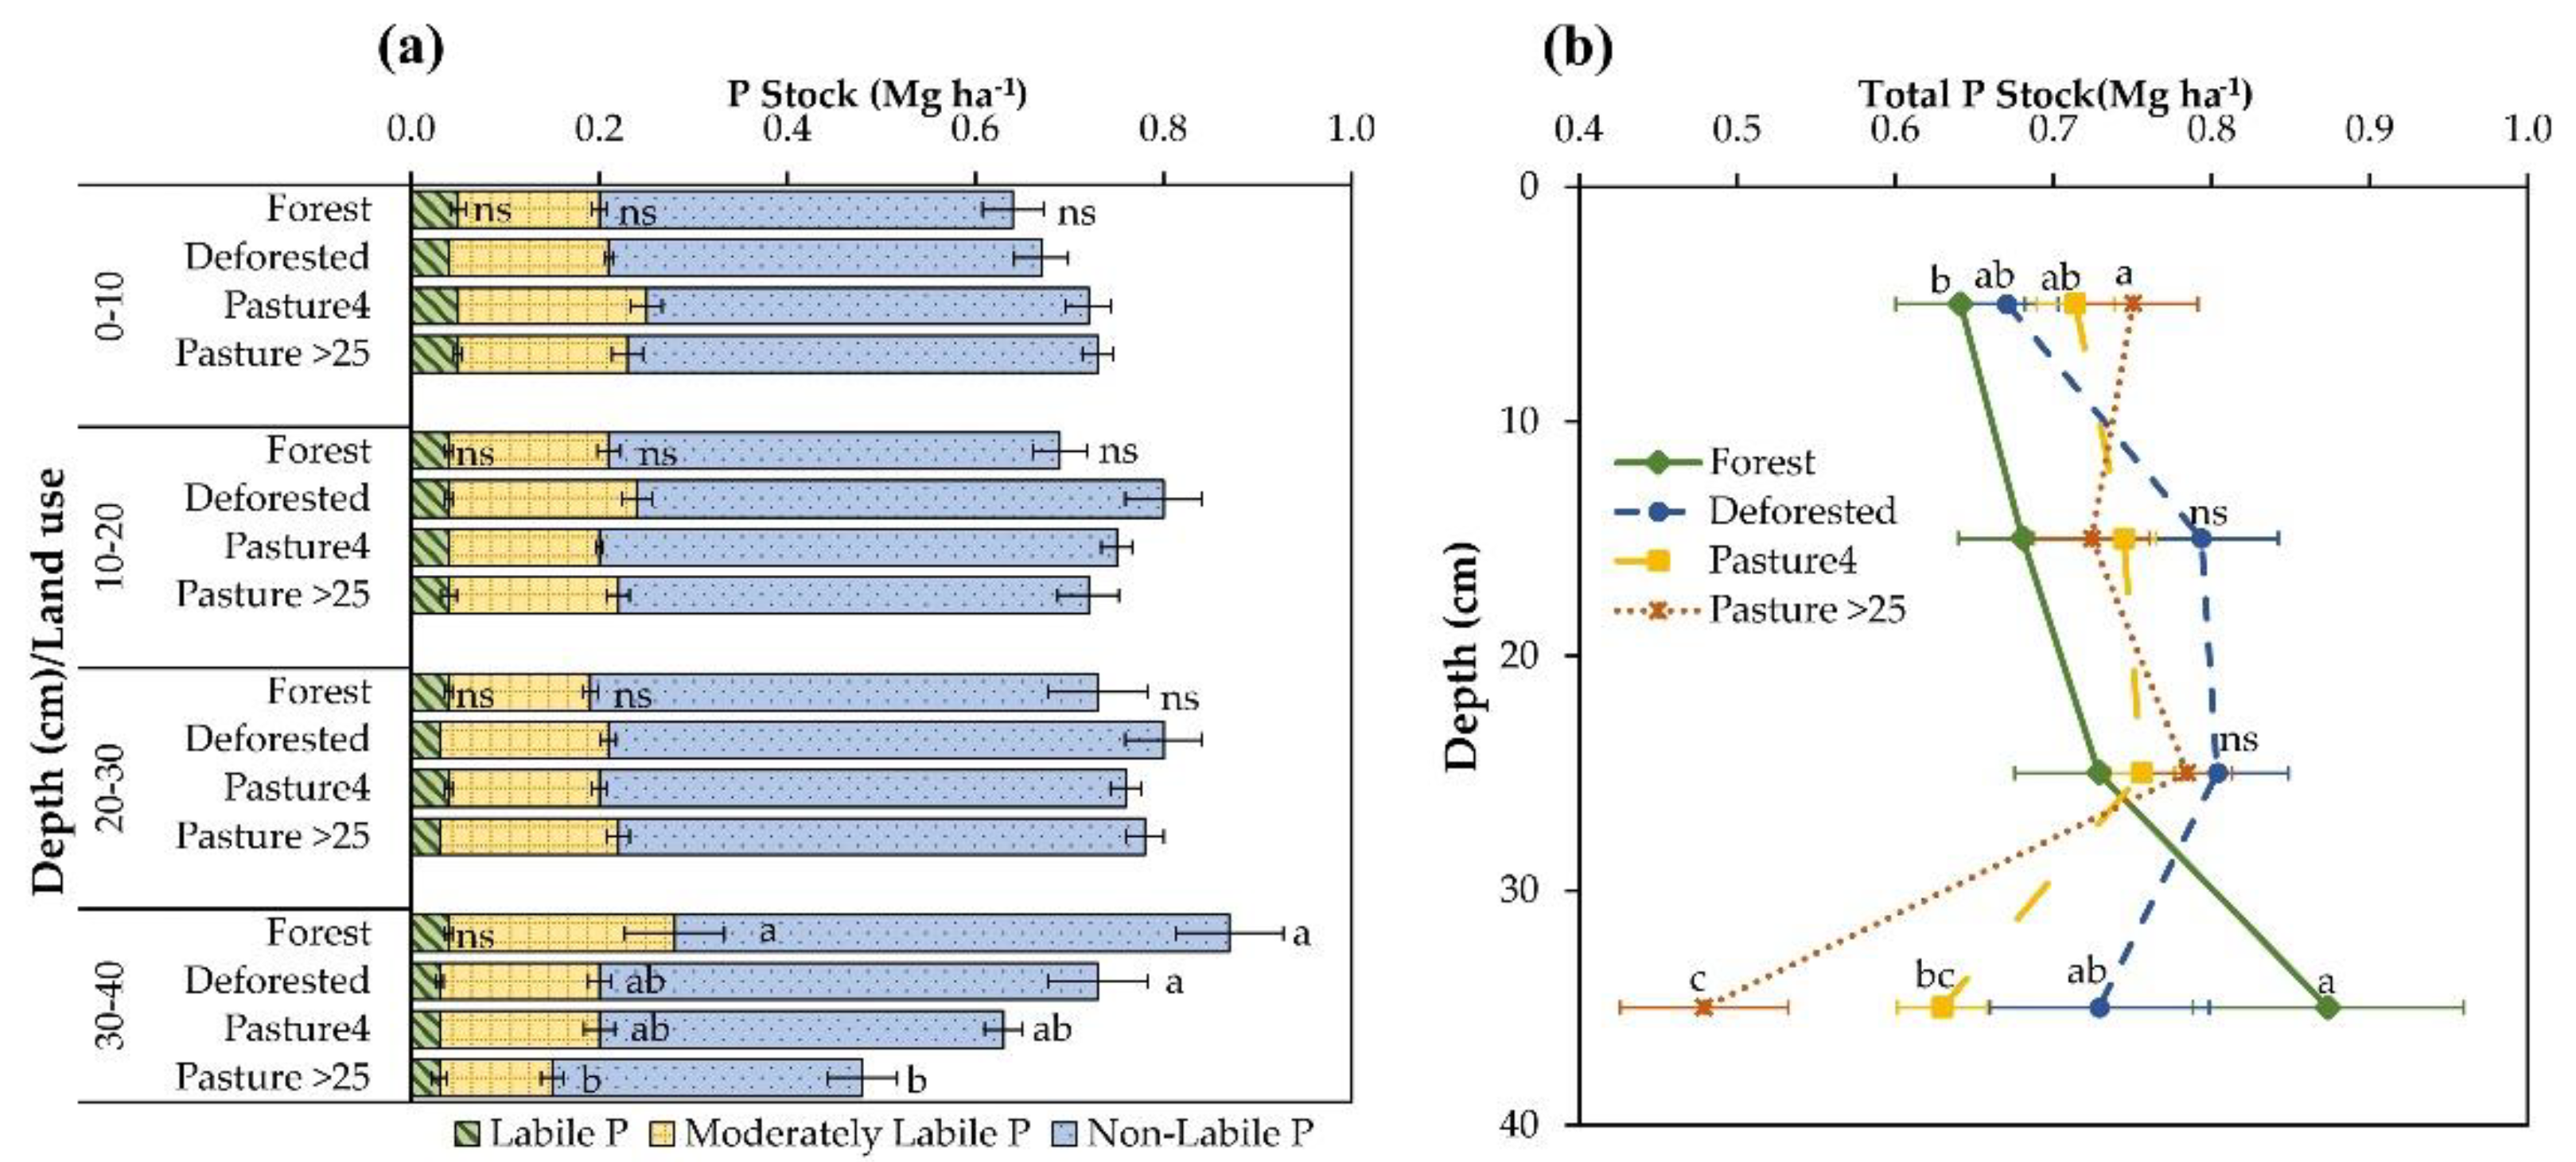
3.2. Responses of C:Po Ratio, P Stocks, and Phosphatase Activity to Land-Use Change

In general, along the chronosequence, the C:Po ratio tended to decrease with increasing soil depth (Figure 4). In the upper layers (0–10 and 10–20 cm), no significant differences among land uses were observed for C:Po ratio; however, alterations were detected in the subsoil. In 20–30 cm, Forest and Pasture 4 year areas presented the highest C:Po ratio (average of 140 and 131, respectively), followed by Deforested area (average of 119) and Pasture >25 years old (average of 108). In the deepest layer (30–40 cm), most areas maintained the same decreasing trend observed in the previous layer, except for the Deforested area which showed a similar C:Po ratio to the 20–30 cm layer.
For P stock, no significant changes were observed in the 0–10, 10–20, and 20–30 cm layers regarding the P lability (Figure 5a). Differences were just observed in the sub-superficial soil layer (30–40 cm), where alterations in the moderately labile and non-labile P stocks were detected, with Forest showing higher values than Pasture >25 years old (Figure 5a).
Alterations in the total P stock in response to land-use change were found in the upper layer (0–10 cm) and 30–40 cm soil depth. The establishment of long-term pastures (Pasture >25) resulted in higher total P stocks than those observed in the Forest area in the 0–10 cm layer. Meanwhile, the opposite trend was detected as the soil depth increased to 30–40 cm, with Forest showing higher values than Pasture >25 (Figure 5b).
Finally, since PCA analysis indicated that organic and inorganic labile P fractions are related to the 0–10 soil layer (Figure 2c), we sought to investigate the potential relationship between the labile P and acid phosphatase activity in this layer in order to assess the effect of that soil enzyme on labile P across the chronosequence.
Pearson’s correlation analysis between labile P fractions (P_resin; Pi_bic; and Po_bic) and acid phosphatase activity (Figure 6) indicated no correlation between the enzyme activity and P_resin or Po_bic. However, a significant and positive correlation (r = 0.67) was observed between acid phosphatase activity and Pi_bic, where Forest showed higher values of both variables, followed by Pasture4 with intermediate values and Deforested area and Pasture >25, which exhibited low values of both acid phosphatase activity and Pi_bic.

4. Discussion

The results evidenced the low soil P availability typically found in tropical soils of low natural fertility, with a considerable proportion of P in the less labile pools. The moderately labile and non-labile fractions jointly represented 95% of the total P found in the soil, which was in the range of the proportion reported in tropical soils by Soltangheisi et al. [44] and Rodrigues et al. [45] in highly weathered soils from the Brazilian Amazon and Cerrado, respectively.
Despite the small proportion (~5%) of P in the labile pool, the land-use change affected the soil P fractions in the 0–40 cm depth. The higher availability of Pi detected in Forest compared to Pasture areas is likely influenced by the organic matter and nutrient cycling from the native vegetation, which are responsible for enhancing P availability to the plants, maintaining this system in equilibrium because no losses by harvest occur [19]. A higher turnover rate and annual release of P via microbial biomass in forests than in pastures have also been reported and indicated as a cause of the higher inorganic labile P in forest ecosystems [44,46].
The soil organic matter can directly enrich the P pool in soil, affecting the adsorption and desorption of this element [47]. It has been found that organic substances can increase the availability of P in P-fixing soils and that humic substances interacting with P in soils may reduce P fixation [48,49], making P more available to plants.
In the northwestern Colombian Amazon, once the native vegetation is slashed and burned, the ashes become the only source of available nutrients to the transitory and subsistence crops, such as maize (Zea mays L.), plantain (Musa paradisiaca), or cassava (Manihot esculenta Crantz), which are usually planted to uptake the high availability of nutrients resulting from that event. After the first harvest of these crops, the area is converted to pasture for livestock production [50,51]; however, once soil nutrients are depleted by poor soil management and no or low inflow of P, via fertilizer application, the outflow leads to reduce labile P [52], as observed mainly in this study. This reduction in P availability under forest clearing and pasture establishment in the Amazon region is corroborated by results found by other authors [5,10,44], highlighting the need for P fertilization management to fulfill plant nutritional P needs appropriately and avoid pasture degradation.
The need for P inputs to maintain pasture productivity is supported by the increase in pastures of P fractions with moderate lability such as Pi_HCl and Po_ hyd 0.1, which are considered unavailable for plant uptake in the short term [32], replenishing labile P just over longer periods. Although the concentration of Pi_HCl corresponded to a very negligible proportion of total P (0.4%), significant differences (p < 0.05) between the study areas suggest a slight accumulation of calcium phosphates in pastures (Table 1), which could be a response to both the lime added during its establishment as well as the ashes resulting from the forest burning, components that supply a considerable amount of calcium to the soil [53,54,55,56].
Changes in the structure and quality of soil organic matter have been related to the higher content of Po_hyd 0.1 in pastures than in forest [5,57]. As reported in previous studies, the native and perennial grasses have the capacity to maintain a greater proportion of native or fertilizer-P in relatively available organic forms over time [13,58], thus demonstrating the important role of the mineralization of Po in P availability to the grasses.
Because phosphatase enzymes carry out Po mineralization in response to P deficiency [59], we assessed the C:Po ratio to verify the P nutritional status. According to our results, in the upper layer (0–10 cm), Po mineralization was higher than soil C mineralization, revealing a high demand for Pi and suggesting that the available P may not be sufficient to satisfy the plant needs in all the systems evaluated here [59]. In the upper layers, the root systems are more active and constantly absorb nutrients, such as P, which may reduce the nutrient availability in that soil layer compared to the deeper soil layers, where the root activity decreased [60].
However, according to our data, the mineralization of the Po_bic fraction by the acid phosphatase enzyme did not contribute to the content of the freely exchangeable and most plant-available Pi (P_resin) because no correlation between this enzyme and P_resin or Po_bic was observed. Instead, the enzymatic activity of acid phosphatase seems to influence the availability of Pi_bic, a fraction that is also considered as readily plant available [61]. The results indicated that when the enzymatic activity is high, the concentration of Pi_bic increases; thus, this fraction is likely the result of the mineralization of the Po [32].
Across the chronosequence, Forest showed higher values of enzymatic activity and Pi-bic. When the forest is subjected to deforestation and then converted to agricultural purposes, there is a reduction in the biodiversity and thus in acid phosphatase sources, which decreases the mineralization and causes alterations in P dynamics [5,62]. Some authors have found that anthropogenic actions affect the soil organic matter dynamics, its mineralization, and the availability of P to the plants [63,64,65].
On the other hand, endorsed by a C:Po ratio < 100, the P seems to be sufficient to satisfy the plant needs in more profound layers of all the land uses assessed. However, the P stock reduces as the soil nutrients are exploited in intensive systems, such as pastures. Forest and Deforested areas were able to maintain higher moderately and non-labile P stocks, which, although are considered not readily available pools, may constitute a reservoir of this nutrient [45]. By studying the contribution of the different P fractions, Gatiboni et al. [66] concluded that, depending on the P management, all soil P fractions can become a source of P to the plants.
The land-use change associated with the expansion of extensive pastures for cattle ranching in the Colombian Amazon region affects the soil organic matter dynamics [67,68] and consequently alters the bioavailability of P throughout the soil profile, aggravating the P limitation problem of those highly weathered soils and leading to a soil chemical degradation process. Given the role of cattle ranching in Colombia’s economy and other tropical countries, it is imperative to adopt adequate strategies for soil P management that can contribute to decreasing further deforestation processes associated with the expansion of the agricultural frontier by improving degraded grazing land resources while ensuring the long-term sustainability of rangeland livestock and the provision of multiple ecosystem services.

5. Conclusions

The expansion of the agricultural frontier for cattle ranching in the Amazon region altered the P dynamics in soil, decreasing by 31% the labile inorganic P, a fraction readily available for plants, making the typical condition of low P availability in those tropical soils even worse.
Alterations in the enzymatic activity of acid phosphatase were also detected due to the land-use transition from forest to pasture. This enzyme appears to play an important role in the P levels of the Pi_bic fraction, confirming that the turnover of Po is a fundamental source of available P in these soils.
In a soil bulk base, our results showed that the exploitation of soil nutrients in pastures reduced by 6.1% the moderately and non-labile P stock, pools which may constitute an important reservoir of this nutrient in the soil of forests and recently deforested areas.

Author Contributions

J.P.C.-B.: data curation, formal analysis, methodology, and writing—original draft. B.A.: formal analysis, methodology, and writing—original draft. D.A.M.-M.: data curation, writing—review and editing. W.B.-H.: writing—review and editing. F.A.O.-M.: conceptualization, funding acquisition, writing—review and editing. A.S.: writing—review and editing. A.M.S.-O.: conceptualization, formal analysis, funding acquisition, investigation, methodology, project administration, resources, supervision, writing—original draft, and writing—review and editing. All authors have read and agreed to the published version of the manuscript.

Funding

This work was part of a research project studying the functional diversity of microbial communities of rainforest soil and litter in the Colombian Amazon region, supported by Sistema General de Regalías (grant number 2018000100114).

Institutional Review Board Statement

Not applicable.

Informed Consent Statement

Not applicable.

Data Availability Statement

Data are available from the authors upon request.

Acknowledgments

The authors thank the farmers for allowing us to work on their land.

Conflicts of Interest

The authors declare no conflict of interest.

References

  1. Cherubin, M.R.; Chavarro-Bermeo, J.P.; Silva-Olaya, A.M. Agroforestry systems improve soil physical quality in northwestern Colombian Amazon. Agrofor. Syst. 2019, 93, 1741–1753. [Google Scholar] [CrossRef]
  2. Marengo, J.A.; Souza, C.M.; Thonicke, K.; Burton, C.; Halladay, K.; Betts, R.A.; Alves, L.M.; Soares, W.R. Changes in Climate and Land Use Over the Amazon Region: Current and Future Variability and Trends. Front. Earth Sci. 2018, 6, 228. [Google Scholar] [CrossRef]
  3. Finer, M. Deforestación en la Amazonía 2020 (Final). MAAP: 136. 2020. Available online: https://maaproject.org/2021/amazon-2020/ (accessed on 20 September 2021).
  4. Finer, M. Deforestación en la Amazonía Colombiana—2020. MAAP #120. 2020. Available online: https://maaproject.org/2020/colombia-2020/#:~:text=En%20nuestro%20primer%20vistazo%20al,desde%20el%20acuerdo%20de%20paz (accessed on 21 September 2021).
  5. Garcia-Montiel, D.C.; Neill, C.; Melillo, J.; Thomas, S.; Steudler, P.A.; Cerri, C.C. Soil Phosphorus Transformations Following Forest Clearing for Pasture in the Brazilian Amazon. Soil Sci. Soc. Am. J. 2000, 64, 1792–1804. [Google Scholar] [CrossRef]
  6. Liu, J.; Cade-Menun, B.J.; Yang, J.; Hu, Y.; Liu, C.W.; Tremblay, J.; LaForge, K.; Schellenberg, M.; Hamel, C.; Bainard, L.D. Long-term land use affects phosphorus speciation and the composition of phosphorus cycling genes in agricultural soils. Front. Microbiol. 2018, 9, 1643. [Google Scholar] [CrossRef] [PubMed]
  7. Olaya-Montes, A.; Llanos-Cabrera, M.P.; Cherubin, M.R.; Herrera-Valencia, W.; Ortiz-Morea, F.A.; Silva-Olaya, A.M. Restoring soil carbon and chemical properties through silvopastoral adoption in the Colombian Amazon region. Land Degrad. Dev. 2020, 32, 3720–3730. [Google Scholar] [CrossRef]
  8. Silva-Olaya, A.M.; Mora-Motta, D.A.; Cherubin, M.R.; Grados, D.; Somenahally, A.; Ortiz-Morea, F.A. Soil enzyme responses to land use change in the tropical rainforest of the Colombian Amazon region. PLoS ONE 2021, 16, e0255669. [Google Scholar] [CrossRef] [PubMed]
  9. Elser, J.J.; Bracken, M.E.S.; Cleland, E.E.; Gruner, D.S.; Harpole, W.S.; Hillebrand, H.; Ngai, J.T.; Seabloom, E.W.; Shurin, J.B.; Smith, J.E. Global analysis of nitrogen and phosphorus limitation of primary producers in freshwater, marine and terrestrial ecosystems. Ecol. Lett. 2007, 10, 1135–1142. [Google Scholar] [CrossRef] [Green Version]
  10. Hamer, U.; Potthast, K.; Burneo, J.I.; Makeschin, F. Nutrient stocks and phosphorus fractions in mountain soils of Southern Ecuador after conversion of forest to pasture. Biogeochemistry 2013, 112, 495–510. [Google Scholar] [CrossRef]
  11. Aguiar, A.D.C.F.; Cândido, C.S.; Carvalho, C.S.; Monroe, P.H.M.; De Moura, E.G. Organic matter fraction and pools of phosphorus as indicators of the impact of land use in the Amazonian periphery. Ecol. Indic. 2013, 30, 158–164. [Google Scholar] [CrossRef]
  12. Cherubin, M.R.; Franco, A.L.C.; Cerri, C.E.P.; Karlen, D.L.; Pavinato, P.S.; Rodrigues, M.; Davies, C.A.; Cerri, C.C. Phosphorus pools responses to land-use change for sugarcane expansion in weathered Brazilian soils. Geoderma 2016, 265, 27–38. [Google Scholar] [CrossRef]
  13. Crews, T.E.; Brookes, P.C. Changes in soil phosphorus forms through time in perennial versus annual agroecosystems. Agric. Ecosyst. Environ. 2014, 184, 168–181. [Google Scholar] [CrossRef]
  14. Wright, A.L. Soil phosphorus stocks and distribution in chemical fractions for long-term sugarcane, pasture, turfgrass, and forest systems in Florida. Nutr. Cycl. Agroecosyst. 2009, 83, 223–231. [Google Scholar] [CrossRef]
  15. Gama-Rodrigues, A.C.; Sales, M.V.S.; Silva, P.S.D.; Comerford, N.B.; Cropper, W.P.; Gama-Rodrigues, E.F. An exploratory analysis of phosphorus transformations in tropical soils using structural equation modeling. Biogeochemistry 2014, 118, 453–469. [Google Scholar] [CrossRef]
  16. McGrath, D.A.; Duryea, M.L.; Cropper, W.P. Soil phosphorus availability and fine root proliferation in Amazonian agroforests 6 years following forest conversion. Agric. Ecosyst. Environ. 2001, 83, 271–284. [Google Scholar] [CrossRef]
  17. Pavinato, P.S.; Dao, T.H.; Rosolem, C.A. Tillage and phosphorus management effects on enzyme-labile bioactive phosphorus availability in Cerrado Oxisols. Geoderma 2010, 156, 207–215. [Google Scholar] [CrossRef]
  18. Turner, B.L.; Engelbrecht, B.M.J. Soil organic phosphorus in lowland tropical rain forests. Biogeochemistry 2011, 103, 297–315. [Google Scholar] [CrossRef]
  19. Johnson, A.H.; Frizano, J.; Vann, D.R. Biogeochemical implications of labile phosphorus in forest soils determined by the Hedley fractionation procedure. Oecologia 2003, 135, 487–499. [Google Scholar] [CrossRef] [PubMed]
  20. Chang, S.C.; Jackson, M.L. Fractionation of soil phosphorus. Soil Sci. 1957, 84, 133–144. [Google Scholar] [CrossRef]
  21. Hedley, M.J.; Stewart, J.W.B.; Chauhan, B.S. Changes in Inorganic and Organic Soil Phosphorus Fractions Induced by Cultivation Practices and by Laboratory Incubations. Soil Sci. Soc. Am. J. 1982, 46, 970–976. [Google Scholar] [CrossRef]
  22. Tiessen, H.; Moir, J.O. Characterization of available P by sequential extraction. Soil Sampling and Methods of Analysis. Ed. MR Cart. P 1993, 7, 75–86. [Google Scholar]
  23. Gatiboni, L.C.; Condron, L.M. A rapid fractionation method for assessing key soil phosphorus parameters in agroecosystems. Geoderma 2021, 385, 114893. [Google Scholar] [CrossRef]
  24. Negassa, W.; Leinweber, P. How does the Hedley sequential phosphorus fractionation reflect impacts of land use and management on soil phosphorus: A review. J. Plant Nutr. Soil Sci. 2009, 172, 305–325. [Google Scholar] [CrossRef]
  25. Richter, D.D.; Allen, H.L.; Li, J.; Markewitz, D.; Raikes, J. Bioavailability of slowly cycling soil phosphorus: Major restructuring of soil P fractions over four decades in an aggrading forest. Oecologia 2006, 150, 259–271. [Google Scholar] [CrossRef]
  26. IGAC. Estudio General de Suelos y Zonificación de tierras: Departamento de Caquetá, Escala 1:100.000; Imprenta Nacional de Colombia: Bogotá, Colombia, 2014; ISBN 78 958 8323 73-2.
  27. Dane, J.H.; Hopmans, J.W.; Topp, G.C. Pressure plate extractor. Methods Soil Anal. Part 2002, 4, 688–690. [Google Scholar]
  28. Grossman, R.B.; Reinsch, T.G. 2.1 Bulk Density and Linear Extensibility; John Wiley & Sons, Ltd.: Hoboken, NJ, USA, 2002; pp. 201–228. [Google Scholar]
  29. Condron, L.M.; Goh, K.M.; Newman, R.H. Nature and distribution of soil phosphorus as revealed by a sequential extraction method followed by 31P nuclear magnetic resonance analysis. J. Soil Sci. 1985, 36, 199–207. [Google Scholar] [CrossRef]
  30. Murphy, J.; Riley, J.P. A modified single solution method for the determination of phosphate in natural waters. Anal. Chim. Acta 1962, 27, 31–36. [Google Scholar] [CrossRef]
  31. Dick, W.A.; Tabatabai, M.A. Determination of Orthophosphate in Aqueous Solutions Containing Labile Organic and Inorganic Phosphorus Compounds. J. Environ. Qual. 1977, 6, 82–85. [Google Scholar] [CrossRef]
  32. Cross, A.F.; Schlesinger, W.H. A literature review and evaluation of the. Hedley fractionation: Applications to the biogeochemical cycle of soil phosphorus in natural ecosystems. Geoderma 1995, 64, 197–214. [Google Scholar] [CrossRef]
  33. Nelson, D.W.; Sommers, L.E. Total Carbon, Organic Carbon, and Organic Matter; John Wiley & Sons, Ltd.: Hoboken, NJ, USA, 1996; pp. 961–1010. [Google Scholar]
  34. Ellert, B.H.; Bettany, J.R. Calculation of organic matter and nutrients stored in soils under contrasting management regimes. Can. J. Soil Sci. 1995, 75, 529–538. [Google Scholar] [CrossRef] [Green Version]
  35. Lee, J.; Hopmans, J.W.; Rolston, D.E.; Baer, S.G.; Six, J. Determining soil carbon stock changes: Simple bulk density corrections fail. Agric. Ecosyst. Environ. 2009, 134, 251–256. [Google Scholar] [CrossRef]
  36. Bell, C.W.; Fricks, B.E.; Rocca, J.D.; Steinweg, J.M.; McMahon, S.K.; Wallenstein, M.D. High-throughput fluorometric measurement of potential soil extracellular enzyme activities. J. Vis. Exp. 2013, 15, 50961. [Google Scholar] [CrossRef] [PubMed]
  37. Hothorn, T.; Bretz, F.; Westfall, P. Simultaneous Inference in General Parametric Models. Biom. J. 2008, 50, 346–363. [Google Scholar] [CrossRef] [PubMed] [Green Version]
  38. Husson, F.; Josse, J.; Le, S.; Maintainer, J.M. Package “FactoMineR”. Multivar. Explor. Data Anal. Data Min. 2016, 96, 698. [Google Scholar]
  39. Kassambara, A.; Mundt, F. Package ‘factoextra’. Extr. Vis. Results Multivar. Data Anal. 2017, 76, 71–74. [Google Scholar]
  40. Wickham, H.; Chang, W. Package “ggplot2”. Creat. Elegant Data Vis. Using Gramm. Graph. Version 2016, 2, 1–189. [Google Scholar]
  41. Dray, S.; Dufour, A.B. The ade4 Package: Implementing the Duality Diagram for Ecologists. J. Stat. Softw. 2007, 22, 1–20. [Google Scholar] [CrossRef] [Green Version]
  42. R Core Team. R: A Language and Environment for Statistical Computing. 2021. Available online: https://www.r-project.org/ (accessed on 21 September 2021).
  43. RStudio Team. RStudio: Integrated Development Environment for R. 2021. Available online: https://www.kdnuggets.com/2011/03/rstudio-ide-for-r.html#:~:text=a%20new%2C%20free%20and%20open,environment%20(IDE)%20for%20R (accessed on 21 September 2021).
  44. Soltangheisi, A.; Withers, P.J.A.; Pavinato, P.S.; Cherubin, M.R.; Rossetto, R.; Do Carmo, J.B.; Rocha, G.C.; Martinelli, L.A. Improving phosphorus sustainability of sugarcane production in Brazil. GCB Bioenergy 2019, 11, 1444–1455. [Google Scholar] [CrossRef]
  45. Rodrigues, M.; Pavinato, P.S.; Withers, P.J.A.; Teles, A.P.B.; Herrera, W.F.B. Legacy phosphorus and no tillage agriculture in tropical oxisols of the Brazilian savanna. Sci. Total Environ. 2016, 542, 1050–1061. [Google Scholar] [CrossRef]
  46. Chen, C.R.; Condron, L.M.; Xu, Z.H. Impacts of grassland afforestation with coniferous trees on soil phosphorus dynamics and associated microbial processes: A review. For. Ecol. Manage. 2008, 255, 396–409. [Google Scholar] [CrossRef]
  47. Yang, X.; Chen, X.; Yang, X. Effect of organic matter on phosphorus adsorption and desorption in a black soil from Northeast China. Soil Tillage Res. 2019, 187, 85–91. [Google Scholar] [CrossRef]
  48. Ding, Y.Z.; Li, Z.A.; Zou, B. Low-molecular weight organic acids and their ecological roles in soil. Soils 2005, 37, 243–250. [Google Scholar]
  49. Guppy, C.N.; Menzies, N.W.; Moody, P.W.; Blamey, F.P.C.; Guppy, C.N.; Menzies, N.W.; Moody, P.W.; Blamey, F.P.C. Competitive sorption reactions between phosphorus and organic matter in soil: A review. Soil Res. 2005, 43, 189–202. [Google Scholar] [CrossRef]
  50. Armenteras, D.; Rudas, G.; Rodriguez, N.; Sua, S.; Romero, M. Patterns and causes of deforestation in the Colombian Amazon. Ecol. Indic. 2006, 6, 353–368. [Google Scholar] [CrossRef]
  51. Murad, C.A.; Pearse, J. Landsat study of deforestation in the Amazon region of Colombia: Departments of Caquetá and Putumayo. Remote Sens. Appl. Soc. Environ. 2018, 11, 161–171. [Google Scholar] [CrossRef]
  52. Rueda, B.L.; McRoberts, K.C.; Blake, R.W.; Nicholson, C.F.; Valentim, J.F.; Fernandes, E.C.M. Nutrient status of cattle grazing systems in the western brazilian amazon. Cogen Food Agri. 2020, 6, 1722350. [Google Scholar] [CrossRef]
  53. Juo, A.S.R.; Manu, A. Chemical dynamics in slash-and-burn agriculture. Agric. Ecosyst. Environ. 1996, 58, 49–60. [Google Scholar] [CrossRef]
  54. Numata, I.; Chadwick, O.A.; Roberts, D.A.; Schimel, J.P.; Sampaio, F.F.; Leonidas, F.C.; Soares, J.V. Temporal nutrient variation in soil and vegetation of post-forest pastures as a function of soil order, pasture age, and management, Rondônia, Brazil. Agric. Ecosyst. Environ. 2007, 118, 159–172. [Google Scholar] [CrossRef]
  55. Martínez, J.; Cajas, Y.S.; León, J.D.; Osorio, N.W. Silvopastoral systems enhance soil quality in grasslands of Colombia. Appl. Environ. Soil Sci. 2014, 2014, 359736. [Google Scholar] [CrossRef] [Green Version]
  56. Zin Battisti, L.F.; Schmitt Filho, A.L.; Loss, A.; Sinisgalli, P.A. de A. Soil chemical attributes in a high biodiversity silvopastoral system. Acta Agronómica 2018, 67, 486–493. [Google Scholar] [CrossRef]
  57. Townsend, A.R.; Asner, G.P.; Cleveland, C.C.; Lefer, M.E.; Bustamante, M.M.C. Unexpected changes in soil phosphorus dynamics along pasture chronosequences in the humid tropics. J. Geophys. Res. Atmos. 2002, 107, LBA 34-1–LBA 34-9. [Google Scholar] [CrossRef] [Green Version]
  58. Motavalli, P.P.; Miles, R.J. Soil phosphorus fractions after 111 years of animal manure and fertilizer applications. Biol. Fertil. Soils 2002, 36, 35–42. [Google Scholar] [CrossRef]
  59. McGill, W.B.; Cole, C.V. Comparative aspects of cycling of organic C, N, S and P through soil organic matter. Geoderma 1981, 26, 267–286. [Google Scholar] [CrossRef]
  60. Ge, Z.; Rubio, G.; Lynch, J.P. The importance of root gravitropism for inter-root competition and phosphorus acquisition efficiency: Results from a geometric simulation model. Plant Soil 2000, 218, 159–171. [Google Scholar] [CrossRef]
  61. Bowman, R.A.; Cole, C. V An exploratory method for fractionation of organic phosphorus from grassland soils. Soil Sci. 1978, 125, 95–101. [Google Scholar] [CrossRef]
  62. Dinesh, R.; Ghoshal Chaudhuri, S.; Sheeja, T.E. Soil biochemical and microbial indices in wet tropical forests: Effects of deforestation and cultivation. J. Plant Nutr. Soil Sci. 2004, 167, 24–32. [Google Scholar] [CrossRef]
  63. Lilienfein, J.; Wilcke, W.; Ayarza, M.A.; Vilela, L.; Do Carmo Lima, S.; Zech, W. Chemical fractionation of phosphorus, sulphur, and molybdenum in Brazilian savannah Oxisols under different land use. Geoderma 2000, 96, 31–46. [Google Scholar] [CrossRef]
  64. Moore, A.; Reddy, K.R. Role of Eh and pH on Phosphorus Geochemistry in Sediments of Lake Okeechobee, Florida. J. Environ. Qual. 1994, 23, 955–964. [Google Scholar] [CrossRef]
  65. Wright, C.J.; Coleman, D.C. Cross-site comparison of soil microbial biomass, soil nutrient status, and nematode trophic groups. Pedobiologia. 2000, 44, 2–23. [Google Scholar] [CrossRef]
  66. Gatiboni, L.C.; Schmitt, D.E.; Tiecher, T.; Veloso, M.G.; dos Santos, D.R.; Kaminski, J.; Brunetto, G. Plant uptake of legacy phosphorus from soils without P fertilization. Nutr. Cycl. Agroecosyst. 2021, 119, 139–151. [Google Scholar] [CrossRef]
  67. Fonte, S.J.; Nesper, M.; Hegglin, D.; Velásquez, J.E.; Ramirez, B.; Rao, I.M.; Bernasconi, S.M.; Bünemann, E.K.; Frossard, E.; Oberson, A. Pasture degradation impacts soil phosphorus storage via changes to aggregate-associated soil organic matter in highly weathered tropical soils. Soil Biol. Biochem. 2014, 68, 150–157. [Google Scholar] [CrossRef]
  68. Navarrete, D.; Sitch, S.; Aragão, L.E.O.C.; Pedroni, L. Conversion from forests to pastures in the Colombian Amazon leads to contrasting soil carbon dynamics depending on land management practices. Glob. Change Biol. 2016, 22, 3503–3517. [Google Scholar] [CrossRef] [PubMed] [Green Version]
Figure 1. (a) Location of the study sites in the northwestern region of the Colombian Amazon. (b) Schematization of the land-use history in the studied chronosequence: (i) Forest: dense high ground primary forest; (ii) Deforested: the existing primary forest was cut down and burned and transitory crops corn established 1 year after deforestation; (iii) Pasture4: pasture established 4 years after the harvest of transitory crops; and (iv) Pasture >25: pasture established more than 25 years after the deforestation event.
Sustainability 14 02285 g001
Figure 2. Principal component analysis (PCA) with the soil P fractions projected on the ordination plane PC1/PC2 (a) and the sampling sites grouped according to the land use (b) and the soil depth (c). The color of the vectors indicated the contribution of the variable.
Sustainability 14 02285 g002
Figure 3. Mean soil P concentration in the 0–40 cm depth under a chronosequence of land-use change (Forest, transitory crop established 1 year after the deforestation event—Deforested, pasture 4 years old—Pasture4 and pasture ~25 years old—Pasture >25) at northwestern Colombian Amazon. (a) Total soil P splitted by P lability (labile, moderately labile, and non-labile pools); (b) labile P pool splitted as P_resin; Pi_bic; and Po_bic fractions; (c) moderately labile P pool splitted as: Pi_HCl; Pi_hyd 0.1; and Po_hyd 0.1 fractions; and (d) non-labile P pool splitted as Pi_hyd 0.5; Po_hyd 0.5; P_residual fractions. Means followed by the same letter do not differ according to Tukey test (p < 0.05); ns: not significant. Error bars denote the standard error.
Sustainability 14 02285 g003
Figure 4. C:Po ratio at 0–10, 10–20, 20–30, and 30–40 cm soil layers under a chronosequence of land-use change (Forest, transitory crop established 1 year after the deforestation event—Deforested, pasture 4 years old—Pasture4 and pasture ~25 years old—Pasture >25) at northwestern Colombian Amazon. Means followed by the same letter do not differ according to Tukey test (p < 0.05); ns: not significant. Horizontal error bars denote the standard error.
Sustainability 14 02285 g004
Figure 5. Soil P stock at 0–10, 10–20, 20–30, and 30–40 cm soil layers under a chronosequence of land-use change (Forest, transitory crop established 1 year after the deforestation event—Deforested, pasture 4 years old—Pasture4 and pasture ~25 years old—Pasture >25) at northwestern Colombian Amazon. (a) P stock splitted by P lability (labile, moderately labile, and non-labile pools); (b) Total P stock. Means followed by the same letter do not differ according to Tukey test (p < 0.05); ns: not significant. Error bars denote the standard error.
Sustainability 14 02285 g005
Figure 6. Relationship between acid phosphatase activity and labile P (P_resin; Pi_bic; and Po_bic) in the 0–10 cm layer under a chronosequence of land-use change (Forest, transitory crop established 1 year after the deforestation event—Deforested, pasture 4 years old—Pasture4 and pasture ~25 years old—Pasture >25) at northwestern Colombian Amazon. Green, red, and blue regression lines represent Po_bic, Pi_bic, and P_resin, respectively. r(P) Pearson correlation (p < 0.01 **).
Sustainability 14 02285 g006
Table 1. P fraction concentration under a chronosequence of land-use change (Forest, transitory crop established 1 year after the deforestation event—Deforested, pasture 4 years old—Pasture4 and pasture ~25 years old—Pasture >25) at northwestern Colombian Amazon.
P (mg kg−1)
Soil Depth
(cm)
P LabilityP FractionLand Use
ForestDeforestedPasture4Pasture >25
0–10Labile P_resin5.6 ± 0.3 a5.5 ± 0.2 a4.4 ± 0.5 ab3.7 ± 0.2 b
Pi_bic11.6 ± 0.3 a8.3 ± 0.6 b11.9 ± 0.5 a8.9 ± 0.3 b
Po_bic19.6 ± 1.3 ns24.7 ± 1.122.7 ± 1.021.3 ± 1.8
Total37.1 ± 5.1 ns38.5 ± 2.939.0 ± 3.432.3 ± 1.5
Moderately labilePi_hyd 0.160.5 ± 2.7 ns62.3 ± 2.757.3 ± 2.859.5 ± 1.7
Po_hyd 0.165.3 ± 2.6 b85.0 ± 7.7 ab103.8 ± 14.6 a74.1 ± 7.3 ab
Pi_HCl2.0 ± 0.1 b2.1 ± 0.1 b2.6 ± 0.1 a2.6 ± 0.1 a
Total133.5 ± 16.3 ns149.8 ± 14.7164.0 ± 35.2139.3 ± 28.7
Non-labilePi_hyd 0.544.4 ± 2.4 c50.8 ± 6.4 bc82.3 ± 8.4 a58.7 ± 4.8 b
Po_hyd 0.549.8 ± 3.1 ab52.1 ± 5.4 a31.4 ± 2.1 b47.7 ± 7.2 ab
P_residual285.7 ± 4.4 ns301.7 ± 14.9274.8 ± 13.8271.8 ± 4.4
Total381.0 ± 20.9 ns379.3 ± 23.1370.1 ± 18.1378.2 ± 22.5
10–20LabileP_resin5.1 ± 0.3 a4.1 ± 0.1 b3.2 ± 0.1 c3.1 ± 0.1 c
Pi_bic10.1 ± 0.3 a7.1 ± 0.2 c8.6 ± 0.2 b6.9 ± 0.1 c
Po_bic14.9 ± 1.2 ns15.1 ± 1.218.4 ± 1.415.1 ± 1.2
Total 30.1 ± 3.7 ns32.4 ± 8.030.2 ± 3.525.1 ± 2.7
Moderately labilePi_hyd 0.156.3 ± 4.4 ns52.5 ± 1.860.9 ± 2.359.3 ± 3.4
Po_hyd 0.174.6 ± 7.4 ab98.70 ± 11.0 a53.3 ± 4.4 b61.2 ± 10.5 b
Pi_HCl1.8 ± 0.1 c1.9 ± 0.1 bc2.4 ± 0.1 a2.3 ± 0.1 ab
Total132.6 ± 15.2 ns153.5 ± 27.3116.7 ± 11.0122.8 ± 18.7
Non-labilePi_hyd 0.543.5 ± 2.6 bc38.0 ± 0.6 c70.4 ± 6.3 a52.4 ± 3.9 b
Po_hyd 0.547.1 ± 4.9 ns47.1 ± 2.047.9 ± 3.243.8 ± 5.2
P_residual289.0 ± 11.4 ab308.5 ± 7.7 a285.4 ± 5.5 ab247.5 ± 23.3 b
Total379.7 ± 31.7 ab393.6 ± 16.2 ab403.7 ± 22.5 a343.7 ± 57.6 b
20–30LabileP_resin4.3 ± 0.1 a3.9 ± 0.1 a3.1 ± 0.1 b3.0 ± 0.1 b
Pi_bic9.5 ± 0.7 a6.8 ± 0.2 bc7.9 ± 0.4 b6.9 ± 0.1 c
Po_bic11.9 ± 0.6 ns13.4 ± 0.614.4 ± 1.515.1 ± 1.2
Total28.4 ± 5.9 a24.4 ± 1.9 ab25.4 ± 3.7 ab21.9 ± 2.5 b
Moderately labilePi_hyd 0.155.7 ± 2.6 ns49.5 ± 1.552.4 ± 1.659.3 ± 3.4
Po_hyd 0.157.8 ± 5.3 ns78.7 ± 5.754.3 ± 9.161.2 ± 10.5
Pi_HCl1.9 ± 0.1 c2.0 ± 0.1 bc2.2 ± 0.1 ab2.3 ± 0.1 ab
Total115.5 ± 12.1 ns130.2 ± 13.3112.9 ± 13.1128.7 ± 20.9
Non-labilePi_hyd 0.543.1 ± 3.0 b35.9 ± 1.8 b63.8 ± 6.4 a52.4 ± 3.9 b
Po_hyd 0.536.4 ± 0.5 ns47.1 ± 4.140.4 ± 3.243.8 ± 5.2
P_residual285.9 ± 11.0 ab331.5 ± 16.7 a278.7 ± 5.1 b247.5 ± 23.3 b
Total358.5 ± 16.4 b428.2 ± 59.6 a383.0 ± 15.6 b378.9 ± 27.4 b
30–40LabileP_resin4.1 ± 0.1 a3.8 ± 0.17 a3.1 ± 0.1 b3.0 ± 0.1 b
Pi_bic8.1 ± 0.5 a6.4 ± 0.1 b6.6 ± 0.2 b6.1 ± 0.1 b
Po_bic12.0 ± 1.0 b12.4 ± 0.6 ab13.5 ± 1.1 ab16.7 ± 3.1 a
Total24.2 ± 2.3 ab22.7 ± 1.6 b23.2 ± 2.9 b31.1 ± 14.1 a
Moderately labilePi_hyd 0.154.9 ± 4.6 ns60.6 ± 5.352.6 ± 1.953.3 ± 0.7
Po_hyd 0.179.4 ± 7.4 ns70.3 ± 11.883.8 ± 7.688.9 ± 11.2
Pi_HCl1.9 ± 0.1 b2.0 ± 0.03 b2.2 ± 0.1 a2.3 ± 0.1 a
Total131.8 ± 13.5 ns133.1 ± 18.7153.5 ± 40.1144.4 ± 27.5
Non-labilePi_hyd 0.537.3 ± 1.5 b30.6 ± 3.0 b50.1 ± 1.6 a50.3 ± 2.7 a
Po_hyd 0.551.4 ± 6.0 ns52.2 ± 6.139.8 ± 3.244.0 ± 7.6
P_residual312.3 ± 9.8 a304.5 ± 15.8 ab280.8 ± 4.6 b280.4 ± 4.0 b
Total401.0 ± 24.4 ns399.5 ± 57.5384.7 ± 26.5374.8 ± 19.2
Note: Means followed by the same letter did not differ among themselves according to Tukey (p < 0.05); LSD-); ± denote the standard error of the mean.
Publisher’s Note: MDPI stays neutral with regard to jurisdictional claims in published maps and institutional affiliations.

