
Characterization of Emissions in Fab Labs: An Additive Manufacturing Environment Issue


Univ. Grenoble Alpes, CNRS, Grenoble INP, G-SCOP, 38000 Grenoble, France
*
Author to whom correspondence should be addressed.
Sustainability 2022, 14(5), 2900; https://doi.org/10.3390/su14052900
Submission received: 28 January 2022
/
Revised: 15 February 2022
/
Accepted: 23 February 2022
/
Published: 2 March 2022
(This article belongs to the Topic Industrial Engineering and Management)
Abstract
:The emergence of additive manufacturing (AM) technologies, such as 3D printing and laser cutting, has created opportunities for new design practices covering a wide range of fields and a diversity of learning and teaching settings. The potential health impact of particulate matter and volatile organic compounds (VOCs) emitted from AM technologies is, therefore, a growing concern for makers. The research behind this paper addresses this issue by applying an indoor air quality assessment protocol in an educational fabrication laboratory. The paper presents the evaluation of the particle emission rate of different AM technologies. Real-time monitoring of multiple three-dimensional Polylactic Acid (PLA), Acrylonitrile Butadiene Styrene (ABS) and Thermoplastic Elastomers (TPE) printers and Polymethyl methacrylate (PMMA) laser cutters was performed in different usage scenarios. Non-contact electrical detectors and off-line gas chromatography–mass spectrometry (GC-MS) were used to detect VOCs. The results show that the emitted particle surface area concentrations vary between 294 and 406.2 μm2/cm3 for three-dimensional printers, and between 55.06 and 92.3 μm2/cm3 for laser cutters. The experiments demonstrate that the emission concentrations were highly dependent on the filtration systems in place. The highest quantities of VOCs emitted included Cyclohexene and Benzyl Alcohol for PLA, ABS and TPE 3D printers, and formic acid and Xylene for PMMA laser cutters. The experiment concludes that signature emissions are detectable for a given material type and an AM technology pair. A suitable mitigation strategy can be specified for each signature detected. Finally, this paper outlines some guidelines for improving indoor air quality in such specific environments. The data provided, as well as the proposed indoor air quality protocol, can be used as a baseline for future studies, and thus help to determine whether the proposed strategies can enhance operator and bystander safety.
1. Introduction
Manufacturing technologies, materials and design methods are developing rapidly. Additive manufacturing is playing an important role in the changes being made to the processes, contexts, organization and business models associated with product and service development in our industrial societies. The techniques used to manufacture components by removing materials from forged blocks or melting and molding materials can today be considered as conventional. Objects created by additive manufacturing (AM) are the result of materials being joined together, usually layer upon layer [1,2]. AM processes complement traditional ones, hence facilitating and accelerating the customized machining of small parts. Thanks to AM, new shapes and new functions can sometimes be designed faster, without requiring substantial investment from the manufacturer. Innovative components can now be introduced to the production line in an accurate, reliable and repeatable manner [3,4]. The massive development of AM technology (including design software) has made it possible to produce novel, individualized parts with complex structures faster and at a lower cost [5]. Materials are also undergoing changes and benefiting from technological innovation processes. Rapid prototyping is now more frequently used during product and service design and development, and not only in an industrial context.
The AM industry is a rapidly growing sector addressing commitments to sustainability that are discussed in terms of the environmental impacts generated by the equipment and its usage, as well as the socio-technical changes that it may drive. Start-ups and Small and Medium Enterprises (SMEs) around the world are producing low-cost equipment for different applications. Both professionals and non-professionals from a range of public and private sectors are using AM technology [6]. The AM market is predicted to reach USD 51.77 billion by 2026 with an annual growth rate of 25.8%. AM is now widely used by universities to escalate their design and engineering courses using 3D printers. AM is introduced because it helps to visualize ideas and solve complex design problems [7]. AM technologies are widely used in places called fabrication laboratories, more commonly known as Fab Labs. The AM technologies with which these labs are typically equipped are fused deposition modeling (FDM) 3D printers using polymer filaments (ABS, PLA, Polyethylene terephthalate glycol (PETG), Polyamide (PA), etc.) in Material EXtrusion (MEX, is the standard terminology for FDM, Fused filament fabrication technology (FFF)); Powder-Based Fusion fabrication systems (PBF: Electron Beam Melting (EBM), etc.), used for printing metallic parts; or laser cutters (for wood, plastic, metal, paper, fabric, etc.). The Fabfoundation has referenced more than 1750 Fab Labs across 109 countries (cf. the Fabfoundation website: https://fabfoundation.org/ (accessed on 27 January 2022)).
1.1. Introduction of AM Technologies and the Consequences of Air Quality on Health
A rapid increase in the commercial use of AM technologies, especially on non-industrial sites where the appropriate exposure mitigation solutions are not compulsory, is a potential source of risk for both operators and occupants [8]. However, the publications available in this field rarely address the types and magnitude of AM technology-related emissions. Precise information about emissions would be useful to prevent potential damage to users’ health. Several studies conducted both in isolated test chambers and conventional office buildings have identified that 3D printers emit UltraFine Particles (UFPs: Particulate Matter (PM) of nanometer scale size, <100 nm), as well as a mixture of potentially dangerous Volatile Organic Compounds (VOCs) such as styrene, butanol, ethylbenzene and xylene [9,10,11,12,13].
The air concentration levels of such pollutants affect human health, especially during long-term exposure [14]. The severity of health problems caused by the inhalation of ultrafine particles directly correlates with the physical properties of each particle, including its size, as well as the number of particles an individual can be exposed to over a given time period [15]. The composition and concentration of the emissions generated are affected by a wide variety of parameters, such as the filament type and color, the machine nozzle, the process temperature, the environment volume, the test environment characteristics, the air volume renewal per hour, the printer model, the number of printers operating together, the extrusion temperature and the temperature of the bed [16,17,18]. ABS is classified as a high emitter [6], and remains the most commonly used filament, followed by PLA and High impact polystyrene (HIPS). New filaments are being invented for the market every year, and are introduced without any emission profile being defined. In practice, 3D printers can be used simultaneously in the same room. Of course, this significantly increases the concentrations of UFPs and VOCs emitted. Human exposure to high concentrations of UFPs and VOCs leads to a wide variety of health issues [14,19]. Publications on related topics usually cover 3D plastic printers rather than metal AM technologies, and yet there are particular dangers connected with the use of powder bed-based technologies, such as selective laser melting (SLM) and electron beam melting (EBM). The powder particle size used ranges between 50 and 100 μm for EBM and 15 to 45 μm for SLM, incurring multiple occupational health risks, such as respiratory problems and explosions for small-sized particles [20]. Today, all Fab Labs are equipped with laser cutters that generate inhalable small-size particulates, VOCs, and other gases including formaldehyde, which is recognized as toxic when inhaled [21]. Finally, the type of emission highly depends on technical and contextual factors, such as the type of laser machine used, the associated laser patterns, the laser wavelength, or the media components [22].
1.2. Indoor Air Quality (IAQ) Regulations and Policies Issued for AM Environments
Some distinctions should be made to understand regulations and policies for AM environments: industrial vs. non-industrial sites; levels and emission types concerned; detection methods and mitigation strategies according to the level of responsibility of the person in charge. ISO Standard 16000:2004 for industrial sites and office environments is unclear about AM technology indicators and emission levels related to health protection.
IAQ regulations and local policies for non-industrial sites are published by several international agencies. These policies depend on several factors: the place where the technologies are used (private or public), the type of public exposed to the indoor environment (age, context, e.g., for educational purposes), the potential period of air inhalation, etc. Furthermore, the level of acceptable emissions varies between countries, as do the target pollutants to be monitored. The responsibility of the persons in charge of the usage of these machines or technologies also has an impact on the measures adopted. The risks taken vary according to the context and have a price. A person working in a private workshop will not take the same risks as a person in charge of public premises or private industrial premises. The level of liability may also depend on insurances taken, and on the laws and policies implemented in the country, according to the context and type of use of AM technology. Because the AM environment is relatively new, the European Commission IAQ standard guidelines do not provide exhaustive reference emission values.
The Indoor Material Labelling Schemes provided by the European harmonized framework propose criteria and methods for evaluating indoor chemical emissions and can be used as a reference for choosing the appropriate method. Specific guidelines have also been developed by international scientific centers such as the WHO and the Environmental and Occupational Health and Safety Agency (ANSES). These aim to prevent exposure to indoor emissions and are based on a 10-year assessment by IAQ experts, as well as input from the WHO and the French IAQ Observatory analysis. However, there are no EU official target values for PM and Total VOCs (TVOCs), or sampling methods to refer to when dealing with health issues stemming from the harmful effects of carbon dioxide (CO2), nitrogen dioxide (NO2), formaldehyde, carbon monoxide (CO), sulfur dioxide (SO2) and PM.
An IAQ management protocol was proposed in previous research [23]. This protocol addresses the issue of targeting potentially harmful limitation values and exposure durations for specific contexts, such as Fac Labs and Fab Labs. A Fac Lab (faculty laboratory) is very similar to a Fab Lab, but is located in a university environment. It is a place for experimentation and collaboration.
Recommendations were provided for measurement methods adapted to these contexts and organizations. The aim of the protocol is to provide the organization (e.g., Fab Lab) with support for managing its assessment strategy and targeting specific pollutants detected during the initial IAQ assessment. The pollutants targeted include a number of “signature” pollutants stemming from the use of specific materials or machines as yet not considered in IAQ recommendations, but which have a genuine impact in such contexts.
1.3. Paper’s Originality and Objective
A review of the literature in this field reveals that introducing AM processes into an industrial plant increases the risks associated with the exposure of indoor workers to contaminants [24]. However, there are few publications studying the exposure of AM machine operators to the related emissions as part of a scientific protocol. The potential occupational risks associated with the contextual usage of AM are therefore not yet available [25,26]. This gap is the first considerable hurdle to be overcome by any non-industrial initiative aiming to develop a safe operating space for design, manufacture and repair work using accessible technologies such as 3D printers and laser cutters. The second challenge is linked to the ability of such places to comply with IAQ standards or local regulations and policies. The contextual diversity and rapid changes occurring in AM environments, technologies, and associated material flows necessarily require IAQ management processes to be appropriated by users.
The research on which this paper is based addresses the need to determine the physical and chemical characteristics of the particles and VOCs potentially released by AM technologies. To fulfil this objective, it applies the protocol for IAQ management in Fab Labs published in [3,23]. The paper details the results of measurements performed to quantify emitted PM and VOCs, and describes the measurement methods and tools used to do this, together with some possible mitigation systems adapted to AM environments [5]. The originality of this paper is that it identifies some signature pollutants associated with a machine and material couple in a specific context. This specific context is characterized by the IAQ management method that enables one to identify the parameters that have an effect on the emitted PM and VOCs, such as the air filtration in place (and the effects of filters—saturated, adapted) or the context in which the machine operates (isolated or collectively).
1.4. Paper Contents and Results
This paper outlines the quantification of both the particles and the VOCs released during operations with fused deposition modeling (FDM) 3D printers using five adjuncts and laser cutters using polymethyl methacrylate (PMMA). Tests were conducted in the pre-defined zones of a conventional room in a fabrication laboratory. The test process, described in detail in the following sections, focuses on operations under controlled conditions allowing the user’s potential exposure to gas and particle emissions to be directly assessed [6]. To gain a fuller understanding of the magnitude of the effect of filament type, further studies were performed on ABS and PLA separately. The results obtained from these measurements are presented in a separate document. The main results presented in this paper were used to analyze the occupant’s potential exposure to hazardous pollutants when using machines. Several suitable mitigation solutions are proposed to tackle indoor air pollution.
1.5. Paper Structure
Section 2 presents the method used in this research to measure VOCs and UFPs, which is based on a previous research paper [23]. The context of the experiment is described, together with the choices made for the measurements and sampling tool and the results analysis method. To allow for repeatability in a different context, the test method applied is described in detail. Section 3 shows the results obtained for UFPs and VOCs, respectively. Section 4 analyzes these results according to the IAQ’s Plan–Do–Check–Act approach, where the primary aim is to protect workers’ health. Various mitigation solutions able to neutralize the potentially negative effects on health caused by AM machines are discussed. Finally, the research limitations are addressed in the last section, together with medium-term IAQ improvement prospects.
2. Materials and Methods
2.1. Methodological Context: Application of the IAQ Monitoring Protocol
Measuring VOCs and PM in an AM environment is crucial to achieving acceptable indoor air quality. The measurements conducted in this research are therefore considered part of the IAQ monitoring protocol process presented in [23]. This protocol follows a Plan–Do–Check–Act/Adjust (PDCA) approach intended to foster continuous improvement. It is an iterative process and will be briefly described below. It is typically supported by ISO standards and has therefore been widely documented and made operational (cf. Environmental and Quality Management Systems standards). The PDCA protocol published by Khaki et al. (2020), entitled Monitoring Indoor Air Quality in Additive Manufacturing Environment [23], is used as a methodological guide, and is applied in this case study at every step.
- Step 1: Plan
The protocol starts with the careful observation of the manufacturing area: organization, working conditions, material used, movements, etc. A first assessment of the manufacturing area helps to determine the threats, estimate exposure, and analyze emission sources and their potential impacts. This step inventories quantified data for the appropriate IAQ measures to be taken. Table 1 presents the main assessment parameters (first column) based on criteria influencing the pollution rate. Occupants’ feelings and advice are captured through observations and interviews. Their feedback is the starting point for the detection of emissions dangerous to health, and identifying other parameters for which additional assessment is needed. This step requires questionnaires to help with measurement planning.
As presented in [23], the audit for this research is based on three phases:
1—Choosing appropriate ANSES guidelines;
2—Targeting pollutants—PM (UFPs) and VOCs, including benzene, trichloroethylene, tetrachloroethylene, ethylbenzene, toluene, acetaldehyde and acrolein;
3—Organizing the measurement method—Choosing instruments, renting tools and locating sampling points. The sampling zones and potential AM test models are illustrated in the following.
- Step 2: Do
The VOC and PM measurements are performed over four distinct periods: (1) a background measurement while there is no manufacturing in progress; (2) another background measurement around the targeted machines and zones; (3) a measurement while the machines are operating; (4) a final measurement during the post-operative time-lapse in order to take into account decay time, i.e., the time needed to halve the environmental concentrations.
The air temperature is recorded in each zone during measurements, as well as any other operating factor able to contribute to the interpretation of results. The measurement machine, material and technology used are also carefully reported.
- Step 3: Check
This step consists of recording the emissions and analyzing the VOC and PM results.
The composition and concentration of emissions generated are affected by several variables, such as filament type, color, test environment volume, test environment characteristics, air changes per hour, printer model, number of printers operating, and the manufacturing process extrusion temperature and bed temperature [16,17,18].
- Step 4: Act
The VOC and UFP results are analyzed and contextualized in this step. A suitable mitigation strategy is built based on the interpretation of the measurement results. This step can also be referred to as the “adjust” step. Emissions from AM technologies such as 3D printers can be mitigated using filtration technologies able to decompose inorganic and organic pollutants or trap particles of a specific size.
The signature pollutants for each machine and material used should be identified in this step. A new PDCA process must then be planned to check that the mitigation strategy has reduced the most health-damaging signature pollutants based on the quantitative estimation obtained during the previous process.
2.2. Step 1: Experimentation Case Study Context
The PDCA IAQ protocol was first conducted in 2020 in a Fab Lab situated in Grenoble (France). The results published in this paper provide the baseline for IAQ monitoring in an AM context.
The experiment was conducted at an inter-university technological platform called GINOVA managed by the S.mart network located in the Grenoble Industrial Engineering School (Grenoble, France). This Fac Lab is a place for experimentation and collaboration (cf. the S.mart website: https://s-mart.fr (accessed on 27 January2022)).
- Machines and materials
The Fac Lab was equipped with a regular set of six 3D fused filament fabrication (FFF—based on fused deposition modeling (FDM), originally trademarked by Stratasys) Zortrax printers (cf. machine reference online, https://www.machines-3d.com/images/Image/Image/02_Fiches_articles/PIECES%20DE%20RECHANGE/ZORTRAX/m200/capot_zortrax_m200_accante.png (accessed on 27 January 2022)), one “LOGresse” printer (cf. wiki page, https://wiki.logre.eu/index.php/LOGresse/en (accessed on 27 January 2022)), a laser cutter (Epilog Laser Fusion Plus) and a Computer Numerical Control (CNC) milling machine. In addition, it also had an electron beam melting (EBM) machine using 10–100 μm material powder as is generally implemented for research projects. MEX printers (FFF or FDM) use polymer filaments, whereas EBM requires metallic powder as input. The platform equipment was dedicated to the simulation of mechanical systems and workflows, prototyping, and additive technologies. Indeed, with the emergence of AM, new market opportunities have arisen with research and development, producing new materials, designs, machines and tools.
The six Zortrax printers were equipped with High-Efficiency Particulate Air significant (HEPA) filters, designed with a closed printer chamber, and equipped with a fan to pull the air through the filter. Zortrax printed ABS and PolyCarbonate-ABS materials. The “LOGresse” printer designed and built onsite without a closed chamber or a filter printed PLA and TPE (a flexible synthetic material).
- Concerns reported by staff mainly include:
- The non-ventilated area where the 3D printers were located and its potential impact on health (even if the cause–effect relationship between the printers’ fumes (odors) and health issues was not proven by the makers);
- Students’ non-use of the laser cutter ventilation and its potential impact on the surrounding air quality. The fumes and odors emitted in the laser cutter area were particularly strong.
There had been reports of potential headaches, dizziness, and irritation to the nose, throat and eyes from people using the equipment. These are the potential short-term effects of exposure to air pollution. No medium- to long-term effects were reported or identified.
Considering these and additional subjective issues identified at this initial stage, work was performed to define the IAQ objectives and limits, the targeted pollutants, the type of sensor and the measurement procedure.
- Measurement protocol application
The VOC and UFP measurements were conducted separately but under the same conditions. Metal-based machines were not operated during the 3D printers’ sampling activities. The VOC experiments were carried out over four distinct operational periods: (1) an overall laboratory background measurement was performed before operations began; (2) another background measurement was performed on the target machines and zones separately (i.e., closed rooms 1 and 2) [26,27]; (3) further measurements were carried out while the machines were operating (over a period of roughly 60 min for the 3D printers and a total of about 20 min for the laser cutter (1200 s)); (4) finally, postoperative measurements were performed to take into account the decay time, which is the time needed to halve concentrations in the environment. Short-term sampling was carried out in this experiment to evaluate the maximum contaminant concentration value. Table 2 summarizes the measurements conducted and provides details about the location (zone), the material–machine pair, the duration of the experiment and the air temperature.
Any space in the building hosting a manufacturing activity was identified as a separate “zone”. A zone was defined as a set of spaces characterized by the following criteria: (1) ventilated with the same air circulation strategy and served by the same air handling unit; (2) having similar activities, similar thermal loads and similar types of pollutant emissions; and (3) having spaces with equivalent compliancy records or able to host a maximum number of occupants [27]. Dividing the targeted spaces into separate zones significantly simplified the measurement process. Print jobs per zone were operated separately. Durations depend on the material and machine selection. In zone 3 (central zone), three 3D printers were operated simultaneously. Specific IAQ measurement software can be used to model the zones (cf. Figure 1).
The minimum number of sampling points in each zone is calculated using the formula below [28]:
where N is the number of sampling points and Ai is the area of zone “i” inside a square meter, as recommended. According to ISO standard 16001, sampling must be performed at least 1 m away from the wall and 1 to 1.5 m above the floor. This covers the approximate breathing volume of an average person.
The 3D printed object chosen in this experiment was based on the model proposed by the National Institute of Standards and Technology (NIST) for additive manufacturing. Illustrated in Figure 2, this model was originally developed as a test part to evaluate AM technology performance. The object measures 10 cm × 10 cm × 1 cm and offers a range of features. Made up of a combination of solid volumes, thin protrusions and holes [29], the part can influence dynamic printer emissions. Indeed, this model has been used in several previous studies with printing times varying from 2.5 to 4 h [9,17]. In the research reported here, short-term sampling was conducted with the printing time reduced to approximately 60 min. The variation in printing time was due to the difference in extruder temperature, layer height and printing feed rate for each material, and also to a scale factor of 0.6 applied to the initial model.
Additional printing sample measurements could have been conducted to verify whether downsizing the part decreased the emissions proportionally. However, this sensitivity analysis was not considered relevant to address the IAQ monitoring protocol, as the first measurement becomes the baseline for the next measurement when keeping the same print sample. Any variations could be accounted for through a comparison process.
2.3. Step 2: Sampling Tools and Analysis
The VOCs were collected using solid-phase microextraction (SPME) syringes with a flow rate of 35 mL/min. Each of the measurements took place over 5 min with 175 mL of air being collected and analyzed by a portable Gas Chromatograph–Mass Spectrometer (GC/MS, Torion T-9, PerkinElmer, Waltham, MA, USA, cf. machine reference website; https://www.perkinelmer.com/fr/product/torion-t-9-portable-gc-ms-instrument-ntsst090500 (accessed on 27 January 2022)). A first sample before the machine started was used to detect the “air background composition”. GC/MS analysis can easily and accurately segregate complex compounds found in the air. Less volatile chemicals move more slowly than more volatile chemicals. They can therefore be separated using the GC/MS. The VOCs were identified here by matching their mass spectral characteristics and retention times using a laboratory-specific mass spectral database containing approximately 700 VOCs. VOC identification was validated by PerkinElmer laboratory experts. The method used by these experts was based on EPA TO-15 and ISO 16000-6 guidelines.
The total volatile organic compound (TVOC) rate was calculated; individual substances presenting concentrations ≥ 5 µg/m3 in the retention time interval C6–C16 were added and expressed as toluene equivalents, as defined by ISO 16000-6 and EN 16516. The determined toluene equivalent TVOC is indeed a semi-quantitative estimation. The individual compounds in the mixture can have response factors that vary greatly in relation to the toluene response factor. Each compound also causes different health toxicity in occupants (e.g., benzaldehyde, styrene, toluene, cyclopentane 1,2-dimethyl). Measuring and providing individual VOC information is therefore more relevant for IAQ monitoring than providing a TVOC concentration, as this would only provide the average potential toxicity [30]. It is therefore preferable to first detect each VOC concentration and then assess its effects on health. After this, the TVOC concentrations can be calculated. However, the validity of this is sometimes questionable. The “acceptable” TVOC concentration should be discussed with respect to the possible mitigation strategies for each specific zone. The compositions of VOCs, measured separately, should also be taken into account.
The sizes of the particulate matter emitted from 3D printers usually varies between 7.8 to 10.5 µm [6]. Particulate matter was therefore measured in this experiment using the Naneos–Partector (cf. the product reference website: http://www.naneos.ch/partector.html (accessed on 27 January 2022)), scientific references on health effects of particulat matter and Lung Deposited Surface Area (LDSA): https://www.naneos.ch/pdf/LDSA.pdf (accessed on 27 January 2022). This instrument measures the LDSA concentration of nanoparticles based on a non-contact electrical detection principle. The LDSA concentration is considered a relevant metric for the negative health effects of certain aerosol particles, measuring particles that penetrate deeply into the lungs (an absorption surface area). As presented in the documentation associated with the LDSA, some particles have the capacity to transport absorbed toxins on their surface, acting as a catalyst inside a cell creating reactive oxygen species that have toxic effects. The sensor’s concentration range is 0–12,000 µm2/cm3, and its particle detection range is between 10 nm and 10 µm. The sensor measures the particles with a time resolution of 1 s.
The limits of exposure to nanoparticles measured by LDSA sensors are defined by color codes: “green” for ranges below 50 μm2/cm3; “yellow” for ranges between 50 and 250 μm2/cm3; and “red” for amounts higher than 250 μm2/cm3. This scale makes the LDSA sensor easy to handle for an IAQ measurement novice wishing to apply the protocol to an AM environment, especially for 3D printers and laser cutter. The size of the powder used by the EBM machine is on the micrometer scale. A part of this powder released in the air may be detected by LDSA sensors, as the detection range is between 10 nm and 10 µm. However, additional equipment should be required to precisely measure the particles emitted by the EBM, in addition to the powder used during the manufacturing process, which could be present in the operating zone together.
3. Results
3.1. Step 3: Results for Ultrafine Particle Emissions
3.1.1. Ultrafine Particle Emissions for Adjunct 3D Printers
The measurements were conducted by making variations in the following parameters: the type of machine (Zortrax vs. LOGresse), the number of machines operating together (one in the closed room zones 1 and 2 vs. five in zone 3), the filtration (HEPA filters and closed chamber for Zortrax vs. Open chamber and no filter for LOGresse), and the material filament (ABS and PC-ABS for zones 3 and 2 vs. TPE or PLA for zone 1).
To ease the interpretation of results, ultrafine particle emissions are presented for ABS and PC-ABS printing with and without filtration systems, in case of multiple printers operating together (zone 3, Figure 3) and in case of one printer alone (zone 2, Figure 4). Then, ultrafine particle emissions are presented using the same 3D printer in a closed room in zone 1 without a filtration system and in an open chamber for PLA (Figure 5) and TPE filaments, respectively (Figure 6). The results show the effect of filters, air saturation, and filament material type on the emissions of ultrafine particles.
ABS and PC-ABS filaments printing with and without filtration in zone 3 (Figure 3) and in zone 2 (Figure 4). The aim was to measure and deduce the extent of the filter’s effectiveness for three distinct periods: (1), (2) and (3). The pre-operation period (1) lasted 15 min. During this period, the concentration was relatively stable with a mean value of 27 μm2/cm3 in the case of five printers operating together (Figure 3), and a mean value of 9 μm2/cm3 in the case of one printer operating alone (Figure 4), both with filters. The second period was the operation phase (2), lasting 60 min (900–4500 s). The average particle concentration reached was 43.9 μm2/cm3 using filters and 46.4 μm2/cm3 without filters in the case of five printers working together. During this phase, the concentrations in both cases fluctuated, reaching a maximum of 406 μm2/cm3 without filtration and 294 μm2/cm3 with filtration. This variation cannot be associated in these experiments with any specific printing phase, but previous studies demonstrate that certain build steps (e.g., raft, side walls) influence emission concentrations [31,32]. In the case of one printer operating alone (Figure 4), the mean value concentration was only 12 μm2/cm3. The third post-operation period (3) lasted 15 min. The UFP measurement once again revealed steady concentrations, averaging 30 μm2/cm3 and 37 μm2/cm3, respectively, for five printers operating together.
The results show that the concentrations of particles are higher in the case of five printers operating together than one alone without filters (which is rather logical), using the same filament type. However, the results also show that the chosen filters lose their efficiency in cases of multiple (five) printers operating for one hour together. The sealing of the printers was checked and did not present any default. More precisely, measurements in Figure 3 are confusing as they clearly show that the filtration system is not effective, as peaks are visible. However, the overlapping of curves is not easy to understand either. This interpretational difficulty may be due to the variety of HEPA filters (same grade) used on different machines, and to the fact that some filters are potentially saturated. However, publications have shown that the collection efficiency of HEPA filters increases with loading, which does not seem to be the case in Figure 3. Several studies published underline that the continuous or simultaneous operation of 3D printers can lead to a PM2.5 level ten times greater than the standard (344 vs. 35 mg/m3) and a PM10 level three times higher than the standard (474 vs. 150 mg/m3) (Environment Institute of European Commission (EIEC), www.ec.europa.eu (accessed on 27 January 2022)). This may explain why it is difficult to pinpoint the cause–effect relationship in the case of multiple 3D printers operating together. It certainly suggests that a new series of experiments should be conducted to reach a more reliable conclusion in the context wherein multiple printers are working together. The data of Figure 3 and Figure 4 are available in the Data Availability Statement named “Supplementary_UFP_per_Zone_and_mode” (cf. https://zenodo.org/record/5913708 (accessed on 27 January 2022)), in the tabs referring to “Zone 2” and “Zone 3”, with and without filters in both cases.
As can be seen from the measurements displayed in Figure 4, showing experimental results conducted with ABS filaments on one isolated machine, the 3D printer filter has a positive impact on PM concentration mitigation. This experiment was not conducted to explain the peaks during printing, but rather to verify that the filters “absorb” irregular releases.
The ultrafine particle emissions are shown for the zone 1 closed room without filtration systems for PLA (Figure 5) and TPE filaments (Figure 6). In this experiment, only one printer was operating under the same conditions, except for the fact that the material was varied. The “LOGresse” printer was chosen because of its open chamber, without a filtration system, and its wider range of options for material choices. Figure 5 presents the results of using PLA filaments for the 45 min of the (2) operation stage, and Figure 6 shows the same for the TPE filaments during the 60 min of the (2) operation stage.
The results are displayed in different scales on the y-axis. Therefore, a careful comparison should be made referring to the Data Availability Statement named “Supplementary_UFP_per_Zone_and_mode” (cf. https://zenodo.org/record/5913708 (accessed on 27 January 2022)), in the tab “Zone 1 PLA” (Figure 5) and “Zone 1 TPE” (Figure 6). Another distinction relates to the temperature of the bed and nozzle, and to the duration of the stage of printing the parts. The temperature of the extruder nozzle was 205 °C for PLA and 230 °C for TPE. The build platform was at a temperature of 65 °C for PLA and 50 °C for TPE. The PLA printing phase lasted 20 min more, which means that zones 1, 2 and 3 in Figure 5 and Figure 6 indicate the mean time between periods.
Firstly, the results show that the PLA causes higher emission peaks than TPE. Both concentrations remain in the same scaling range, but the mean concentrations emitted during the operating period of 1000–4000 s are 23 μm2/cm3 for TPE and 20 μm2/cm3 for PLA. Secondly, the emissions do not follow the same variation curves. Factors explaining these differences could include that the printed model demanded a longer printing time and a cooler nozzle for PLA than for TPE, for instance. Thirdly, in both cases, the emission concentrations during the operation stage were in the same scaling range as with ABS (22 μm2/cm3 during the operating period of 1000–4000 s). Emissions in the air remain in the closed room after the operation stage, and decrease steadily.
3.1.2. Ultrafine Particle Emissions for Laser Cutter
The laser cutter cuts and engraves a wide range of materials with different thicknesses (<3 mm, 5 mm, or 8 mm). A 5 mm-thick PMMA was chosen for this case study. The laser cutting machine is configured with a closed space, with a transparent door made of glass, and closed walls on every sides. The ventilation system was “plug” in the engraving place, extracting the air of the closed space. The tests designed for the laser cutting machine cover cases with and without a ventilation system (integrated in the engraving place) over 4 distinct periods (cf. Figure 7): pre-operation, engraving, cutting and post-operation. The engraving process lasted 5 min (300 s). The data from Figure 7 are available in the Data Availability Statement named “Supplementary_UFP_per_Zone_and_mode” (cf. https://zenodo.org/record/5913708 (accessed on 27 January 2022)), in the tabs referring to “Zone 5” with and without ventilated filtration.
During this time, the average emission concentration increased by 1.4 μm2/cm3 in comparison with the 5 min (300 s) pre-operation measurement. The concentration rate then continuously increased during the 3 min (180 s) cutting operation. The average rates reached were 33 and 44 μm2/cm3, respectively, for operations with and without ventilation. During the post-operation measurements (about 5 min (300 s)), the parts were taken out of the machine. The highest concentration reached was 469 μm2/cm3 without ventilation and 90 μm2/cm3 with ventilation. The large peaks correspond to an accumulation of UFPs in the inner space of the engraving zone. A steady-state condition was not reached at the end of the post-operation (i.e., decay) period without ventilation.
Table 3 summarizes the maximum UFP concentrations measured with the LDSA sensor in μm2/cm3 for each of the machines during different phases for each of the scenarios examined.
3.2. Step 3: Measurement Results for Gaseous Compound Emissions
The gaseous emissions detected for VOCs and VVOCs (very volatile organic compounds) during the additive manufacturing processes and laser-cutting operations were measured under controlled conditions according to the protocol and equipment presented earlier. The results obtained were evaluated and calculated in terms of toluene equivalents.
3.2.1. Gaseous Compound Emissions for Adjunct 3D Printers Operating in Zone 3
The VOC concentrations were measured in three separate phases: (1) before printer loading, (2) 30 min after the start of the operation, and (3) at the end of printing. Table 3 presents the VOCs identified. Toluene, ethanol, xylene and trimethylbenzene were detected during all the measurement phases, as shown in Figure 8, presenting the top five VOCs detected (left). The concentrations of toluene, xylene and trimethylbenzene remained relatively steady throughout the sampling process. By contrast, the ethanol concentration increased from 1537 to 2323 µg/m3 in the operation phase, and then steadied towards the end.
The main VOC detected by the background measurements was ethanol, with approximately 1537 µg/m3, accounting for 22% of the total sample taken. During the operating stage and the final measurement stage, isobornyl propionate and cyclohexene showed the highest concentrations, reaching 2395 and 3202 µg/m3, respectively. The fact that isobornyl propionate and cyclohexene, along with eight other VOCs or VVOCs, were only detected during and after 3D printer operation suggests that the printing process alone is the source of these substances. The inconsistency in the other VOCs identified may be due to the wide range of chemical formulations currently available for 3D printer filaments.
3.2.2. Gaseous Compound Emissions for Laser Cutter Operating in Zone 5
The concentration of VOCs was measured in three separate phases: after 5, 10 and 30 min of cutting and engraving a 5 mm PMMA sheet. For this experiment, the machine ran successive jobs lasting 5, 10 and 30 min. The air sample was taken from the inside operating space. Xylene, trimethylbenzene and ethanol were detected, as well as toluene, in every measurement. Their concentrations steadily increased during the operations, but in different proportions. The concentration of toluene, for instance, increased from 528 µg/m3 in the initial sampling to 1419 µg/m3 towards the end of the 30 min operation cycle. Figure 8 summarizes the concentrations of the top five VOCs emitted as a result of the PMMA laser cutting operation. Table 4 provides a detailed list of the VOCs and VVOCs measured by the GC/MS sensor.
Ethylbenzene was only detected after 5 min of operation, but proved to have a relatively high concentration. By contrast, the xylene concentration detected was low. However, the xylene concentration increased significantly as the operation resumed, reaching 1470 and 2015 µg/m3 after 10 and 30 min, respectively. During the final operation measurement, the most prominent gas detected was formic acid propyl ester, which reached 3258 µg/m3, accounting for 26% of the sample taken. Seven additional compounds were also detected during the operation of the machine, confirming the laser cutter as the primary emitter.
3.2.3. Significant Gaseous Compound Emissions per Machine and per Material
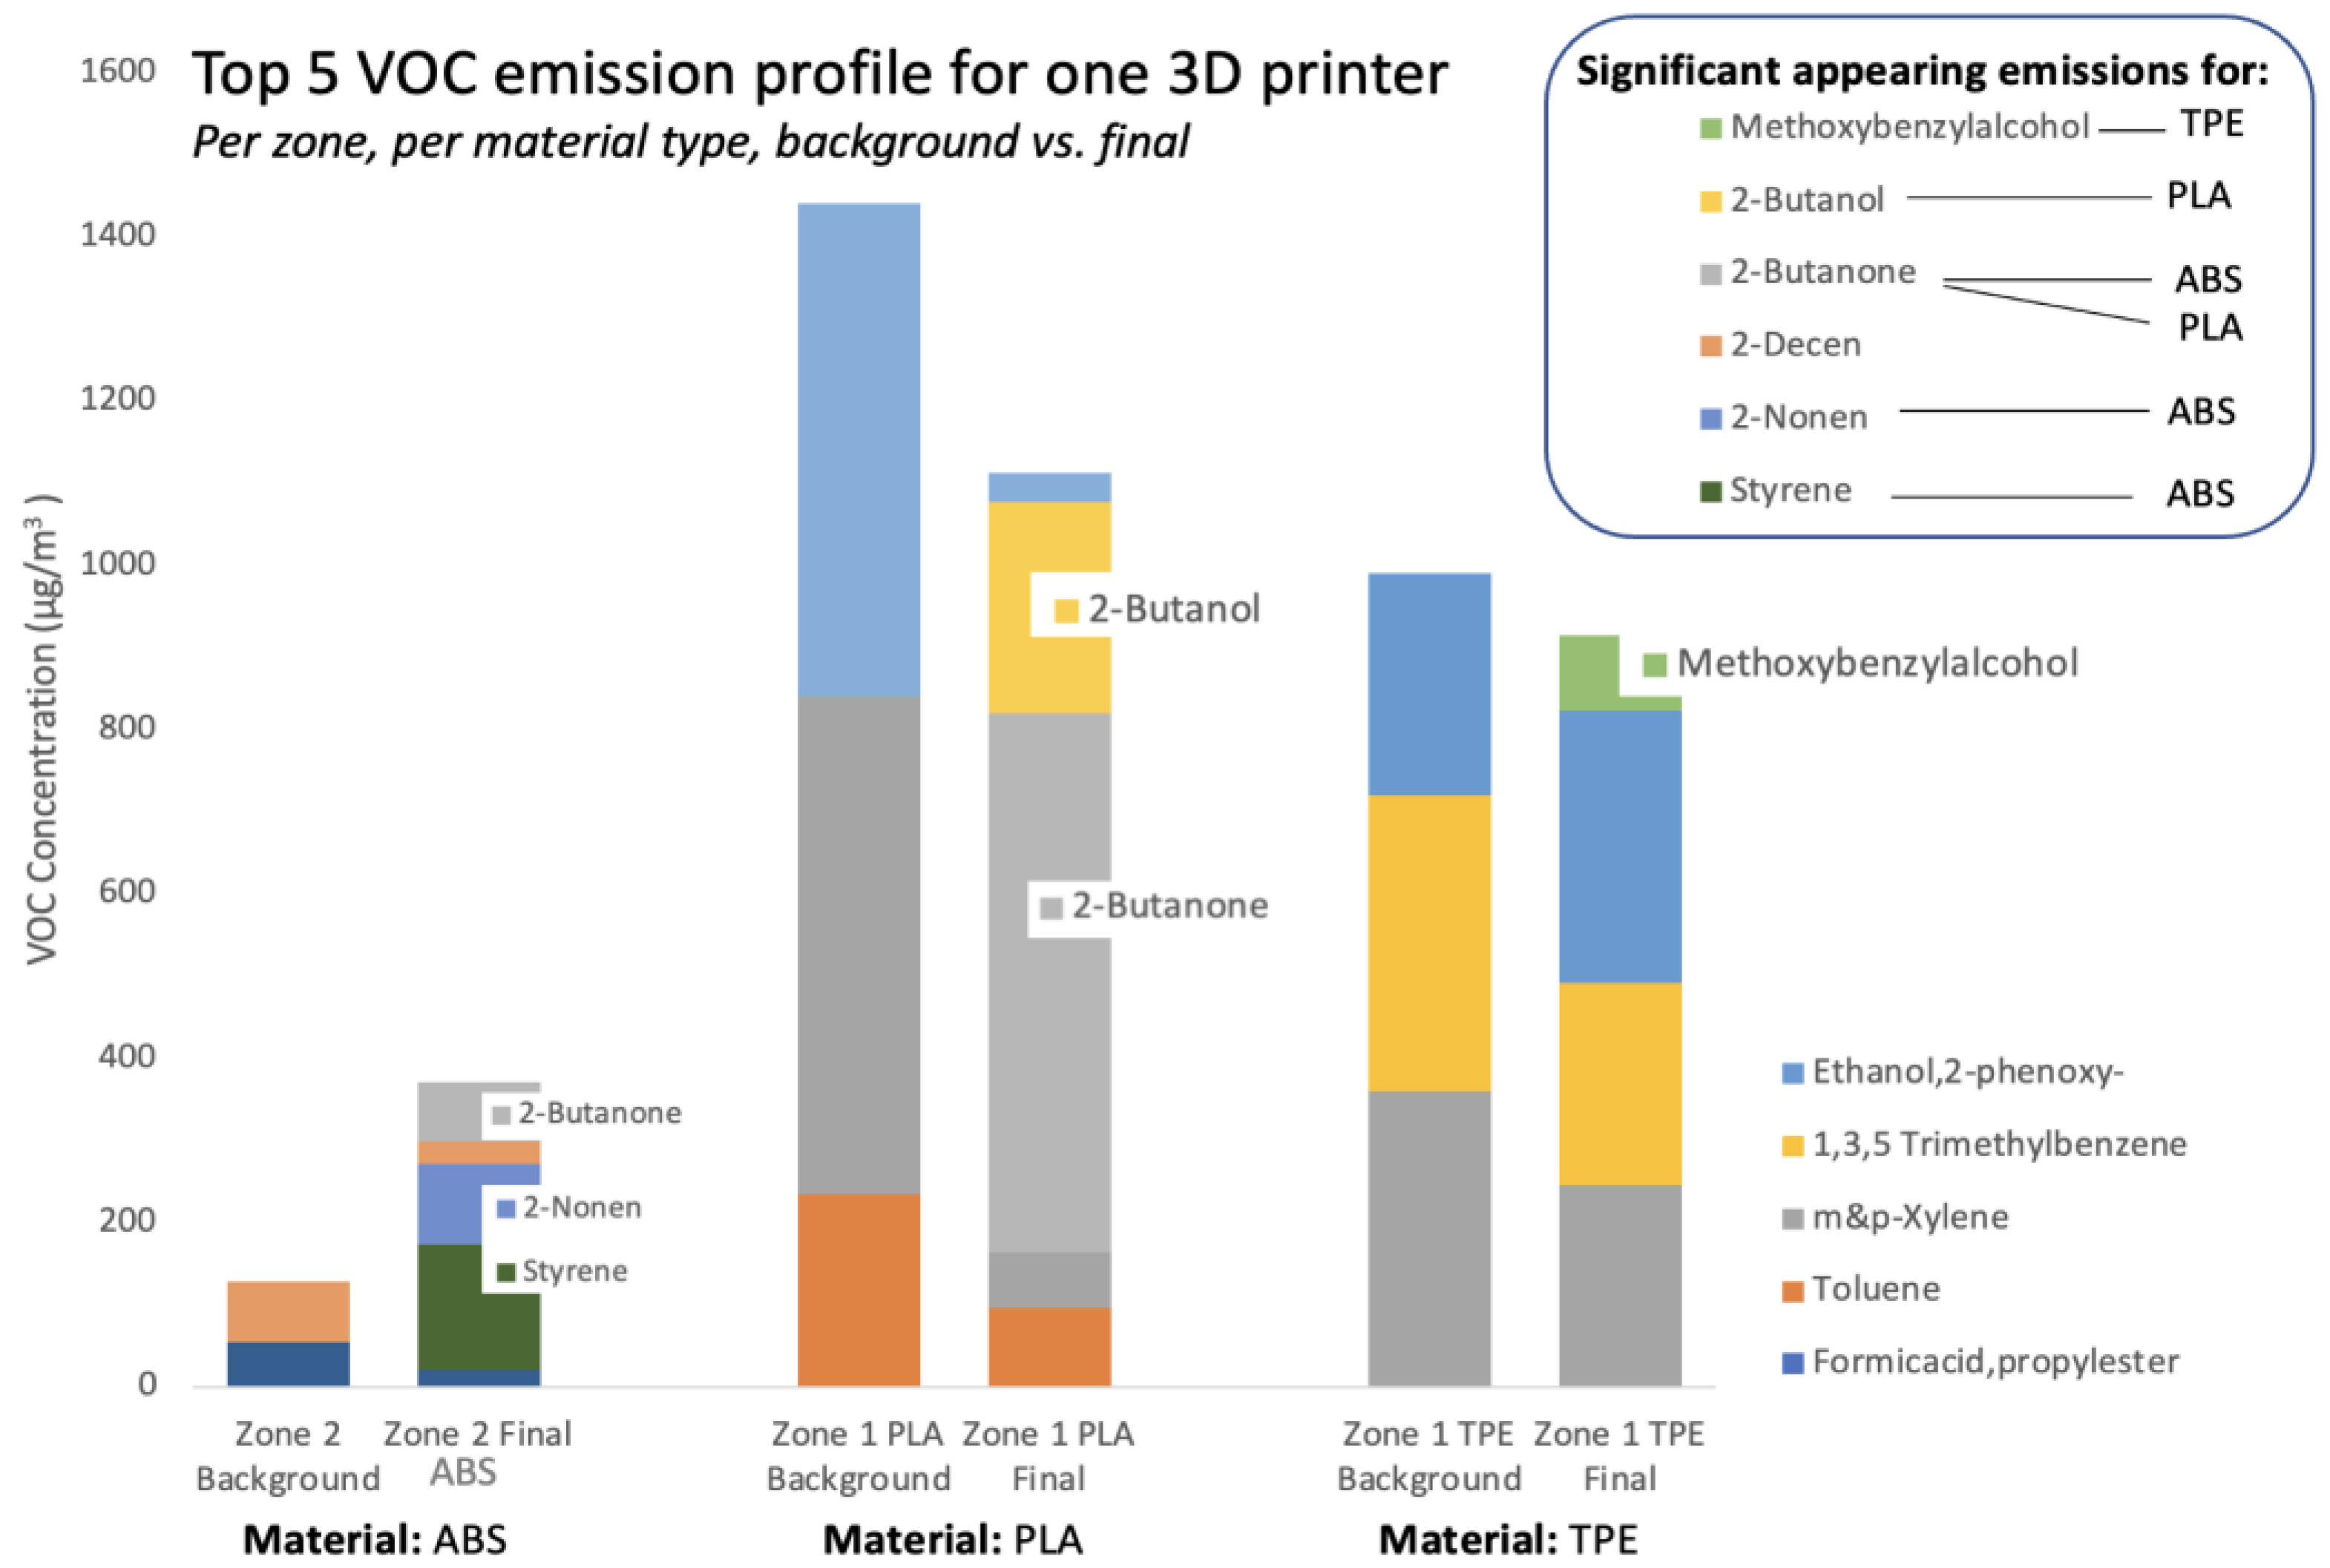
The individual pollutants detected during printing ABS and PC-ABS, and during laser cutting and engraving PMMA (Table 4 and Figure 8), revealed that signature pollutants could be attributed to a material, and to a manufacturing process in particular. Two series of additional experiments have been conducted to better identify those so-called signature pollutants in the Fac Lab: firstly, in high-concentration zones 3 and 5 for PMMA laser cutting and engraving, and for PC and PC-ABS 3D printing (Figure 9); secondly, in closed-chamber zones 1 and 2, isolating ABS, TPE and PLA from 3D printing under similar conditions to those present in the UFP experiments (Figure 10). All data are available in the Data Availability Statement named “Supplementary_VOC_PER_ZONE” (cf. https://zenodo.org/record/5913708 (accessed on 27 January 2022)), in the tabs “Zone 1 TPE”, “Zone 1 PLA”, and “Zone 2 ABS”.
Not surprisingly, the VOC concentrations were higher (and in the same value range) in cases of multiple printers operating together and laser cutting compared to one printer operating alone. Formicacid propylester and m&p-Xylene have been identified as signature emissions when cutting and engraving PMMA. For 3D printers, the signature PC-ABS- and ABS-associated emissions detected are mainly 3-cyclohexene, nonanal and benzyl alcohol (Figure 9). The second experimental measurements conducted in closed rooms recorded lower concentrations with the Zortrax (closed chamber and HEPA filters equipped with a fan—zone 2) than with the LOGresse (open chamber and no filters—zone 1). PLA’s signature emissions are mainly 2-butanol and 2-butanone. The ABS signatures also recorded 2-butanone, as well as two other significant emissions: 2-nonen and styrene. Finally, only methoxybenzylalcohol iwass significantly identified for TPE (Figure 10).
4. Discussion
4.1. Complementary Measurements and Identification of “Signature” Indoor Pollutants
These indoor experiments conducted in the Fac Lab show that ultrafine particle emissions and volatile organic compound emissions should be measured with specific equipment, but could be conducted under similar conditions. Closed chambers are required to isolate a specific “machine–material” couple to identify: (1) the related concentrations of UFP with and without a filtration system, and (2) the potential signature VOC. The proposed protocol published in this paper provides guidance in the process of measurement to ease the cause-to-effect relation between the design parameters and the emissions one wishes to mitigate. Among the various design parameters of this study are included the machine and material type, the temperature of the room, the nozzle and the plater, the filtration systems, the manufacturing operation and its duration, the number of machines operating together, the volume of the place, etc. In addition, the number of operators moving around machines and the possible volume of air that could circulate during the experiments are important factors affecting results. A Fac Lab is a place that is supposed to embrace all kinds of human activities, actively participating in the design processes of parts and products, in all seasons, and sometimes for many days.
4.2. TVOC Exposure Level
The total volatile organic compound (TVOC) rate in an air sample is a key indicator of indoor hygiene and indoor air quality management standards [33]. This explains why scientific studies tend to focus on TVOC measurements rather than providing a detailed list of VOCs detected. This helps with standard compliance and simplifies the interpretation of each individual VOC. The EU Commission has published a TVOC assessment method based on a simple detector reported as a toluene equivalent (followed in this study). There are, however, no general agreements on compounds to be included in the TVOC (as a sum of VOCs). The detailed VOC list and the concentrations needed to calculate TVOC rates remain unclear and are subject to different interpretations. The standard reporting level defined by different organizations consequently varies widely. For instance, in the UK, exposure to a TVOC rate of 300 µg/m3 for an average of 8 h is considered a danger limit. In Finland, being exposed to the same rate over the same amount of time is not considered dangerous.
The second limiting factor for TVOC rate usage is that it minimizes the specific health effect of a signature gas. Benzene and formaldehyde, for instance, have a high potential for seriously impacting health over the long term, or following intense exposure [34]. Specific measuring equipment is required to measure such emissions.
The TVOC value should therefore be used with caution, especially in non-industrial indoor areas where the exposure to chemical pollutants must be as low as possibly achievable in both economic and technological contexts [35]. This notion is a representation of the “precautionary principle”. This has been included in several national and international legislations, such as that of the European Union, and is considered the backbone of acceptable occupational health practice [30]. As such, it is still widely encouraged to evaluate the concentrations of both TVOCs and individual VOCs, especially in the context of occupant health and comfort.
4.3. Step 4: Adjusting Mitigation Strategies
The classic risk management hierarchy remains the basis for adjusting mitigation strategies. Indoor environments are typically characterized by the density of people present in the same volume of air, who are potentially exposed to air pollutants. This is why ensuring proper indoor air quality is so important. Understanding exposure sources and magnitudes is a prerequisite for the development of control and mitigation strategies. Emissions during the 3D printing process seem to be inevitable and inherent to the process. To successfully 3D print a part out of plastic, the filament needs to be softened using temperatures that far exceed the glass transition temperature. This causes particle emissions. The key to making 3D printing safer may be to try to mitigate printer operator and user exposure, rather than trying to eliminate it altogether. Filtration is a common solution to many particulate and dust problems. HEPA filters can remove particles less than 0.3 μm in size, as indicated by our findings. These particle sizes are the most penetrating (and an indicator of the “worst” performance of an HEPA filter). HEPA filters are still quite effective for 3D printing processes, since the particles emitted are in the size range between 10 and 116 nm [36]. In the case reported here, the emissions from the 3D printers working simultaneously in zone 3 were saturating the air. Emissions could be mitigated by placing them inside a sealed enclosure using new air filtration technology, such as photocatalytic filtration. This technology is able to decompose inorganic and organic pollutants [13]. Another solution might be to implement a multi-layered filtration system, hence ensuring that nearly all the particles, even the smallest ones, together with almost all VOCs, are trapped. For high-emitting machines such as laser cutters, some providers propose up to five-layer filtering units, including dust pre-filtering, HEPA filters, Ultraviolet light systems and activated carbon filters. These filtration systems operate all together with a high-flow air extraction of 100 to 1000 cubic feet per minute (CFM), up to more than 450 L/s.
General emission control strategies able to mitigate the pollution rate in other zones include standalone air cleaners, ventilation systems, and upgraded central Heating, Ventilation and Air Conditioning (HVAC) filtration. It should be noted that some of these control strategies are more cost-effective and practical than others. For example, a high-flow rate ventilation system moving air outdoors is likely to be cost-prohibitive (for a Fab Lab) and impractical in many locations (e.g., in a city or town with densely populated areas). Furthermore, utilizing standalone air cleaners can have a significant impact on the PM concentrations in all zones. This type of solution may also require a substantial source of energy [37]. Different strategies can therefore be implemented in each zone or grouped zones, depending on what the zones are used for and the emission rates detected in them.
The additive manufacturing platforms designed for educational purposes are modular. The related risk can be assessed and managed accordingly [38]. There are numerous factors and variables to be considered, such as the platform’s ventilation status and utilization rate, materials used, human activities taking place, season, and even the time of day. An extensive analysis of these factors is therefore required to properly understand their impacts on air quality. Only once this has been done can the best exposure control approaches be chosen. It is, therefore, crucial to detect the activity patterns from which pollution can arise. This can be achieved by either further intensive investigations into each environment usage scenario, or by simulating the accumulation of contaminants using indoor air quality and ventilation analysis simulation software. In addition, a continuous real-time assessment of the impact of the strategies implemented should be conducted. Air quality simulation requires input data related to each machine and process. These data can only be obtained by real-time and task-based measurements. Thus, a series of real situation measurements must be carried out. The first measurements are the starting point for either implementing immediate mitigation means or performing further studies using simulation, and then comparing the different mitigation strategies before choosing and implementing the most promising one. In addition, IAQ results can help one to choose the filaments and their associated manufacturing process, as well as the new machine to be used in the Fab Lab.
5. Conclusions
In this study, the emissions produced by the operation of adjunct 3D printers and laser cutters were evaluated in a Fac Lab environment. The results reveal potential exposure to high concentrations of particles, ranging from 44 to 46 μm2/cm3 on average for one hour of printing, and from 29 to 40 μm2/cm3 for 8 min of cutting and engraving with the laser cutter. The efficiency of the HEPA filtration system for 3D printers and the ventilation system for laser cutters was also studied. Various VOCs were detected, of which toluene, ethanol, xylene and trimethylbenzene proved to have the highest concentrations. Some VVOCs, including butanol, acetone and propanol, were also detected but at lower concentrations.
The assessment of various AM technologies showed that while emission rates could vary greatly for different filaments (material types) and different manufacturing circumstances, exposure to these ultrafine particles and VOCs is possible for all the configurations tested.
Undoubtedly, additive manufacturing is a promising technology offering many new opportunities. However, extra caution should be taken when several machines are used concurrently, especially in a non-industrial environment. In the context of Fab Labs and other indoor environments where technical prototyping activities are performed and members of the general public are welcome, it is advisable to implement a series of mitigation strategies. These mitigation strategies should include the local capture of emitted particles, the multi-layer filtration of the polluted air from each machine, and high-flow air renewal in the room. Additionally, air pollutants should be regularly monitored. This monitoring should be applied systematically to allow possible drifts in the air quality to be detected. The aim of such measures would be to identify filter deterioration or saturation, and the need to change materials or perform maintenance operations on the technologies implemented. This type of regular or even continuous indoor air quality monitoring could be supported using low-cost air quality sensors. The typical sensors available on the market pick up approximate PM concentrations varying from 0.3 to 10 μm. Additional (and more low-cost) sensors provide TVOC estimations. These sensors are able to send a warning when thresholds are exceeded during continuous monitoring.
Although the research described in this paper has afforded new insights into the problems linked to the use of AM technologies, it was to a certain extent limited in terms of the measurement and monitoring operations performed. First, due to a lack of access to high performance liquid chromatography, it was not possible to measure the concentration of formaldehyde in the experiments conducted. Secondly, no direct exposure monitoring was undertaken as part of the study, and the tests could only be conducted when the laboratory was vacated. Such limitations could be addressed in future studies.
A standardized method to assess emissions in additive manufacturing environments would offer many advantages: the accurate measurement of VOC and PM emission rates, the identification of potential exposure risks, and support for the integration of a mitigation plan. The results obtained in this study could be used as a baseline. As mentioned, there are various possible mitigation strategies, such as multilayer filtration, photocatalytic filtration and spot ventilation. Additionally, based on the outcome of this research, investigations to systematically analyze the impacts of potential control strategies using standardized emission testing procedures should be performed. It should also be noted that even though the current literature suggests that exposure to PM poses a serious health risk, no acceptable PM levels have been suggested by the ANSES indoor air quality guidelines. More explicit guidelines should be drawn up in each country to ensure the safety of AM operators and users.
Author Contributions
S.K. has fully and mainly contributed to the research study, to the measurements and to the writing of the paper; M.R. and P.M. supervised the research project and have contributed to the results interpretation, and supported the paper writing. M.R. has particularly contributed to the review process and to the improvement of the paper. All authors have read and agreed to the published version of the manuscript.
Funding
This research received no external funding.
Institutional Review Board Statement
Ethic approval was not necessary in this study. Approval for this study was not required in accordance with French legislation at the moment of the experiment.
Informed Consent Statement
Participant consent was waived due to the agreement to participate in the research project of their own will and anonymously. No record or written results have been captured.
Data Availability Statement
Data supporting the reported results can be found at https://zenodo.org/record/5913708 (accessed on 27 January 2022).
Acknowledgments
The authors are thankful to the resource centre S.mart Grenoble Alpes, which provided access to the academic Fac Lab and the prototyping machines, as well as the G-SCOP laboratory Product Process Design team. We are also highly grateful to the PerkinElmer company, which graciously provided its expertise, and the GC/MS measuring device for a high-sensitivity and a high-accuracy analysis of VOC emissions; we also thank Solan Developement for its support in the measurement interpretation.
Conflicts of Interest
No conflicts of interest to declare. The funders had no role in the design of the study; in the collection, analyses, or interpretation of data; in the writing of the manuscript, or in the decision to publish the results.
References
- Chtioui, N.; Raoudha, G.; Benamara, A. Eco-design and Additive Manufacturing: Analysis and proposals. In Proceedings of the 24th Congrès Français de Mécanique, Brest, France, 26–30 August 2019. [Google Scholar]
- Kruth, J.-P.; Leu, M.C.; Nakagawa, T. Progress in Additive Manufacturing and Rapid Prototyping. CIRP Ann. 1998, 47, 525–540. [Google Scholar] [CrossRef]
- Attaran, M. The rise of 3-D printing: The advantages of additive manufacturing over traditional manufacturing. Bus. Horiz. 2017, 60, 677–688. [Google Scholar] [CrossRef]
- Luomaranta, T.; Martinsuo, M. Supply chain innovations for additive manufacturing. Int. J. Phys. Distrib. Logist. Manag. 2019, 50, 54–79. [Google Scholar] [CrossRef]
- Huang, Y.; Leu, M.C.; Mazumder, J.; Donmez, A. Additive Manufacturing: Current State, Future Potential, Gaps and Needs, and Recommendations. J. Manuf. Sci. Eng. 2015, 137, 014001. [Google Scholar] [CrossRef] [Green Version]
- Mendes, L.; Kangas, A.; Kukko, K.; Mølgaard, B.; Säämänen, A.; Kanerva, T.; Flores Ituarte, I.; Huhtiniemi, M.; Stockmann-Juvala, H.; Partanen, J.; et al. Characterization of Emissions from a Desktop 3D Printer. J. Ind. Ecol. 2017, 21, S94–S106. [Google Scholar] [CrossRef]
- McDonnell, B.; Jimenez Guzman, X.; Dolack, M.; Simpson, T.W.; Cimbala, J.M. 3D Printing in the Wild: A Preliminary Investigation of Air Quality in College Maker Spaces. In Proceedings of the 27th Annual International Solid Freeform Fabrication Symposium—An Additive Manufacturing Conference, Austin, TX, USA, 8–10 August 2016; pp. 2456–2469. [Google Scholar]
- Short, D.B.; Sirinterlikci, A.; Badger, P.; Artieri, B. Environmental, health, and safety issues in rapid prototyping. Rapid Prototyp. J. 2015, 21, 105–110. [Google Scholar] [CrossRef]
- Afshar-Mohajer, N.; Wu, C.-Y.; Ladun, T.; Rajon, D.A.; Huang, Y. Characterization of particulate matters and total VOC emissions from a binder jetting 3D printer. Build. Environ. 2015, 93, 293–301. [Google Scholar] [CrossRef]
- Azimi, P.; Zhao, D.; Pouzet, C.; Crain, N.E.; Stephens, B. Emissions of Ultrafine Particles and Volatile Organic Compounds from Commercially Available Desktop Three-Dimensional Printers with Multiple Filaments. Environ. Sci. Technol. 2016, 50, 1260–1268. [Google Scholar] [CrossRef] [PubMed]
- Gu, J.; Wensing, M.; Uhde, E.; Salthammer, T. Characterization of particulate and gaseous pollutants emitted during operation of a desktop 3D printer. Environ. Int. 2019, 123, 476–485. [Google Scholar] [CrossRef] [PubMed]
- John, U.; Matthew, R.C.; Chris, K.; John, J.M. Airborne Emissions of Carcinogens and Respiratory Sensitizers during Thermal Processing of Plastics. Ann. Occup. Hyg. 2013, 57, 399–406. [Google Scholar] [CrossRef]
- Wojtyła, S.; Klama, P.; Baran, T. Is 3D printing safe? Analysis of the thermal treatment of thermoplastics: ABS, PLA, PET, and nylon. J. Occup. Environ. Hyg. 2017, 14, D80–D85. [Google Scholar] [CrossRef]
- Oberdörster, G.; Oberdörster, E.; Oberdörster, J. Nanotoxicology: An Emerging Discipline Evolving from Studies of Ultrafine Particles. Environ. Health Perspect. 2005, 113, 823–839. [Google Scholar] [CrossRef]
- Madl, A.K.; Pinkerton, K.E. Health effects of inhaled engineered and incidental nanoparticles. Crit. Rev. Toxicol. 2009, 39, 629–658. [Google Scholar] [CrossRef] [PubMed]
- Rao, C.; Gu, F.; Zhao, P.; Sharmin, N.; Gu, H.; Fu, J. Capturing PM2.5 Emissions from 3D Printing via Nanofiber-based Air Filter. Sci. Rep. 2017, 7, 10366. [Google Scholar] [CrossRef] [Green Version]
- Kim, K.-H.; Kabir, E.; Kabir, S. A review on the human health impact of airborne particulate matter. Environ. Int. 2015, 74, 136–143. [Google Scholar] [CrossRef]
- Byrley, P.; George, B.J.; Boyes, W.K.; Rogers, K. Particle emissions from fused deposition modeling 3D printers: Evaluation and meta-analysis. Sci. Total Environ. 2019, 655, 395–407. [Google Scholar] [CrossRef] [PubMed]
- Peters, A.; Wichmann, H.E.; Tuch, T.; Heinrich, J.; Heyder, J. Respiratory effects are associated with the number of ultrafine particles. Am. J. Respir. Crit. Care Med. 1997, 155, 1376–1383. [Google Scholar] [CrossRef]
- Lunetto, V.; Catalano, A.R.; Priarone, P.C.; Settineri, L. Comments about the Human Health Risks Related to Additive Manufacturing. In Sustainable Design and Manufacturing 2018; Dao, D., Howlett, R.J., Setchi, R., Vlacic, L., Eds.; Springer International Publishing: Cham, Switzerland, 2019; Volume 130, pp. 95–104. ISBN 978-3-030-04289-9. [Google Scholar]
- Chan, Y.-J.; Yuan, T.-H.; Sun, H.-C.; Lin, T.-C. Characterization and Exposure Assessment of Odor Emissions from Laser Cutting of Plastics in the Optical Film Industry. Aerosol Air Qual. Res. 2016, 16, 2216–2226. [Google Scholar] [CrossRef] [Green Version]
- O’Neill, K. Laser-Generated Airborne Contaminants from a Desktop Laser Cutter and Engraver; University of Oklahoma: Norman, OK, USA, 2017. [Google Scholar]
- Khaki, S.; Rio, M.; Marin, P. Monitoring indoor air quality in additive manufacturing environment. Procedia CIRP 2020, 90, 455–460. [Google Scholar] [CrossRef]
- Yi, J.; LeBouf, R.F.; Duling, M.G.; Nurkiewicz, T.; Chen, B.T.; Schwegler-Berry, D.; Virji, M.A.; Stefaniak, A.B. Emission of particulate matter from a desktop three-dimensional (3D) printer. J. Toxicol. Environ. Health A 2016, 79, 453–465. [Google Scholar] [CrossRef]
- Baumers, M.; Duflou, J.R.; Flanagan, W.; Gutowski, T.G.; Kellens, K.; Lifset, R. Charting the Environmental Dimensions of Additive Manufacturing and 3D Printing: Environmental Dimensions of AM. J. Ind. Ecol. 2017, 21, S9–S14. [Google Scholar] [CrossRef] [Green Version]
- Rejeski, D.; Zhao, F.; Huang, Y. Research needs and recommendations on environmental implications of additive manufacturing. Addit. Manuf. 2018, 19, 21–28. [Google Scholar] [CrossRef] [Green Version]
- Asadi, E.; da Silva, M.C.G.; Costa, J.J. A systematic indoor air quality audit approach for public buildings. Environ. Monit. Assess. 2013, 185, 865–875. [Google Scholar] [CrossRef] [PubMed]
- ISO Standard. ISO 16000 Indoor Air—Part 1: General Aspects of Sampling Strategy. 2004. Available online: https://cobaz.afnor.org/ (accessed on 10 June 2021).
- Moylan, S.; Slotwinski, J.; Cooke, A.; Jurrens, K.; Donmez, M. Proposal for a standardized test artifact for additive manufacturing machines and processes. In Proceedings of the Solid Freeform Fabrication Symposium, Austin, TX, USA, 6–8 August 2012. [Google Scholar]
- Recuerda, M.A. Risk and Reason in the European Union Law. Eur. Food Feed. Law Rev. 2006, 5, 270. [Google Scholar]
- Deng, Y.; Cao, S.J.; Chen, A.; Guo, Y. The impact of manufacturing parameters on submicron particle emissions from a desktop 3D printer in the perspective of emission reduction. Build. Environ. 2016, 104, 311–319. [Google Scholar] [CrossRef]
- Simon, T.R.; Aguilera, G.A.; Zhao, F. Characterization of particle emission from fuse deposition modeling printers. In Proceedings of the International Manufacturing Science and Engineering Conference, Los Angeles, CA, USA, 4–8 June 2017; American Society of Mechanical Engineers: Los Angeles, CA, USA, 2017; Volume 50732, p. V002T01A040. [Google Scholar]
- Molhave, L.; Clausen, G.; Berglund, B.; Ceaurriz, J.; Kettrup, A.; Lindvall, T.; Maroni, M.; Pickering, A.C.; Risse, U.; Rothweiler, H.; et al. Total Volatile Organic Compounds (TVOC) in Indoor Air Quality Investigations. Indoor Air 1997, 7, 225–240. [Google Scholar] [CrossRef]
- Abdul-Wahab, S.A.; Chin Fah En, S.; Elkamel, A.; Ahmadi, L.; Yetilmezsoy, K. A review of standards and guidelines set by international bodies for the parameters of indoor air quality. Atmos. Pollut. Res. 2015, 6, 751–767. [Google Scholar] [CrossRef]
- Tuomi, T.; Vainiotalo, S. The guideline and target values for total volatile organic compound concentrations in industrial indoor environments in Finland. Indoor Built Environ. 2014, 25, 424–434. [Google Scholar] [CrossRef]
- Stephens, B.; Azimi, P.; El Orch, Z.; Ramos, T. Ultrafine particle emissions from desktop 3D printers. Atmos. Environ. 2013, 79, 334–339. [Google Scholar] [CrossRef]
- Azimi, P.; Fazli, T.; Stephens, B. Predicting Concentrations of Ultrafine Particles and Volatile Organic Compounds Resulting from Desktop 3D Printer Operation and the Impact of Potential Control Strategies: 3D Printer Emissions-Exposure and Control. J. Ind. Ecol. 2017, 21, S107–S119. [Google Scholar] [CrossRef] [Green Version]
- Leso, V.; Ercolano, M.L.; Mazzotta, I.; Romano, M.; Cannavacciuolo, F.; Iavicoli, I. Three-Dimensional (3D) Printing: Implications for Risk Assessment and Management in Occupational Settings. Ann. Work. Expo. Health 2021, 65, 617–634. [Google Scholar] [CrossRef] [PubMed]
Figure 1.
A Fac Lab model showing sampling zones for the IAQ management protocol. The EBM machine (e-beam power of 3 kW) is delimitating a specific closed room in grey equipped with a specific system of air filtration. The wire arc additive manufacturing machine (WAAM) is operating in zone 6 with flexible walls made of plastic fabrics (also in grey), and with a high-debit air extractor and filtration system embedded in the installation system, similar and distinct from the laser cutter one in zone 5. Approximate room dimensions are given in meters (blue arrow).

Figure 2.
NIST standard printed part.
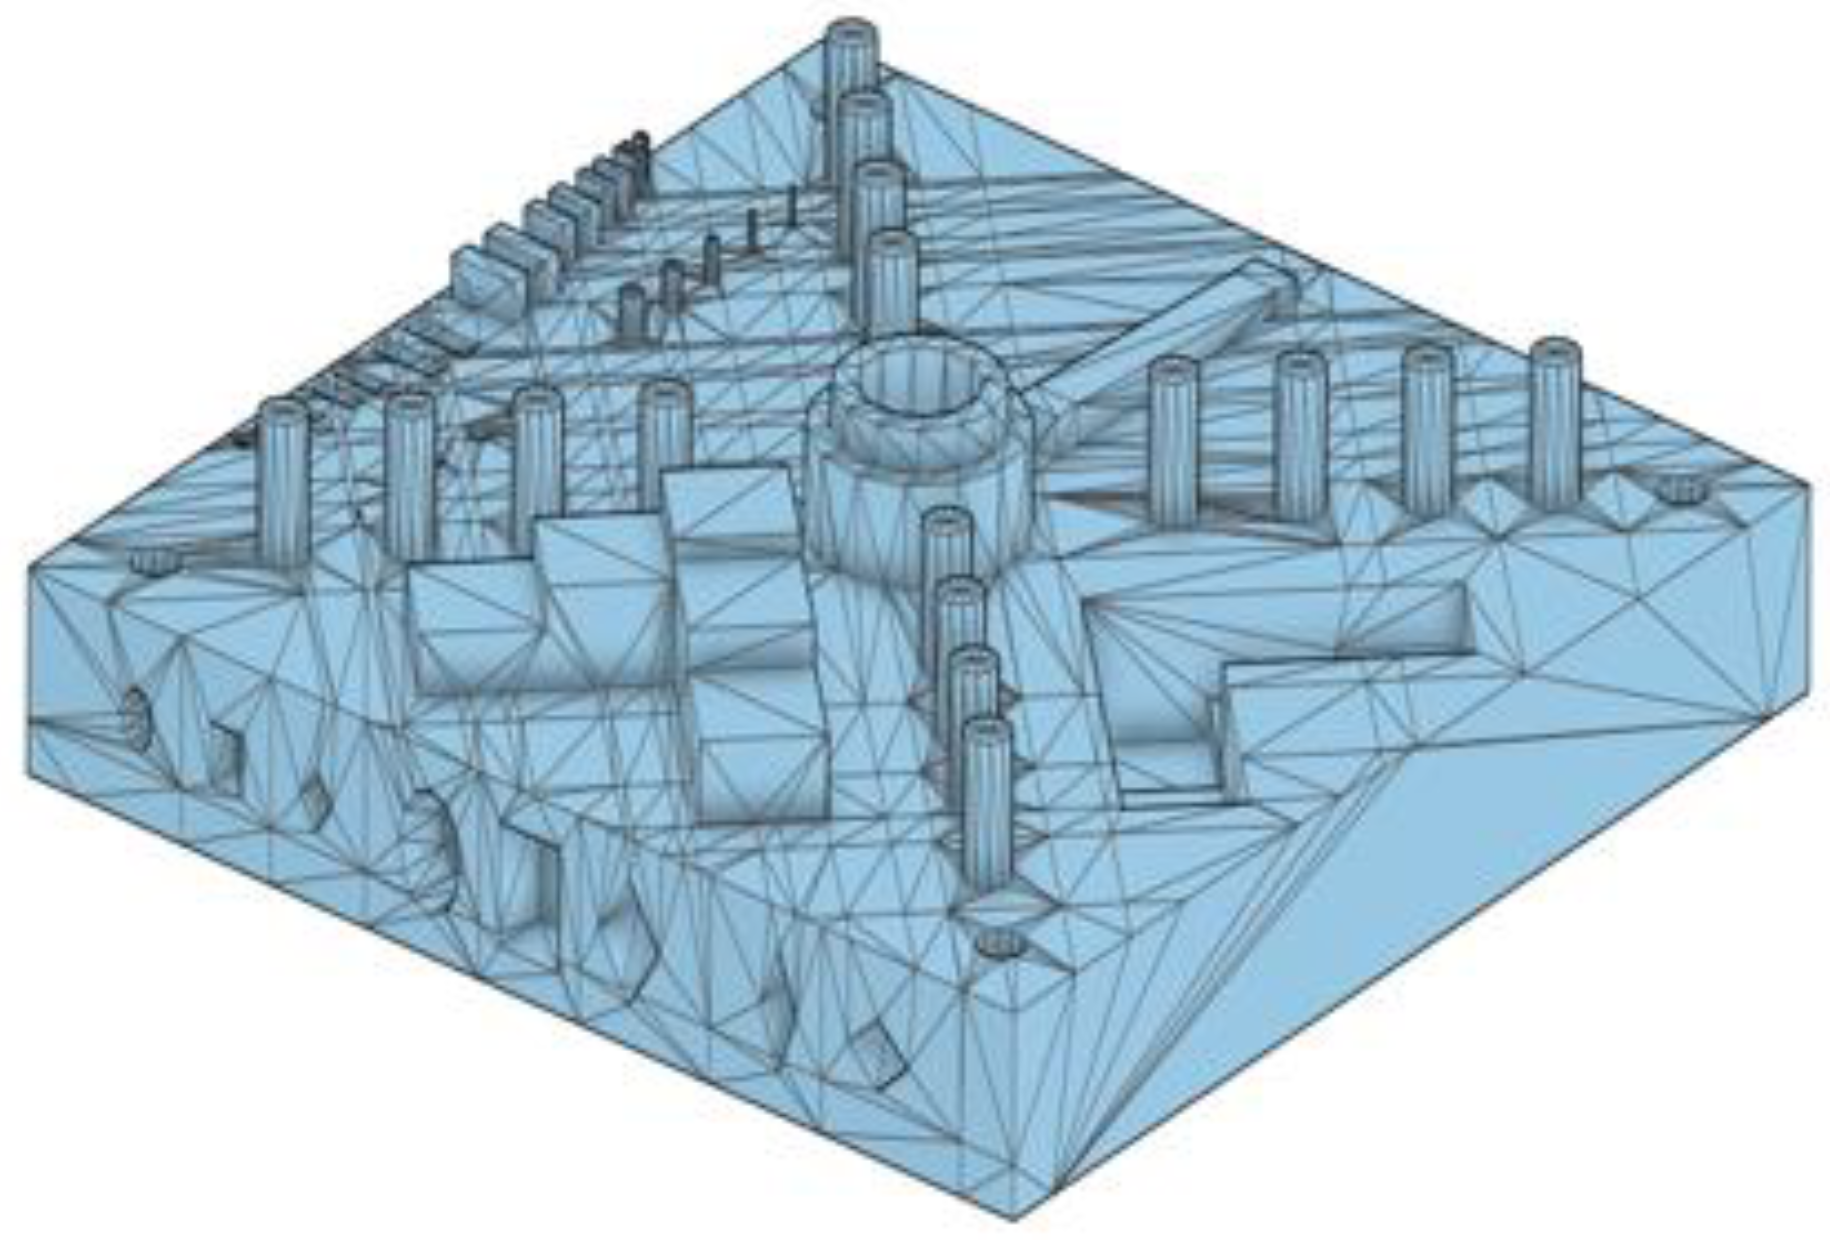
Figure 3.
Concentration of UFPs measured with an LDSA sensor during the (1) pre-operation, (2) operation and (3) post-operation utilization periods of five 3D printers with and without HEPA filters, with ABS and PC-ABS filaments on zone 3.
Figure 3.
Concentration of UFPs measured with an LDSA sensor during the (1) pre-operation, (2) operation and (3) post-operation utilization periods of five 3D printers with and without HEPA filters, with ABS and PC-ABS filaments on zone 3.

Figure 4.
Concentration of UFPs measured with an LDSA sensor during the utilization of one 3D printer with and without HEPA filter, with an ABS filament in zone 2 (a closed room).
Figure 4.
Concentration of UFPs measured with an LDSA sensor during the utilization of one 3D printer with and without HEPA filter, with an ABS filament in zone 2 (a closed room).
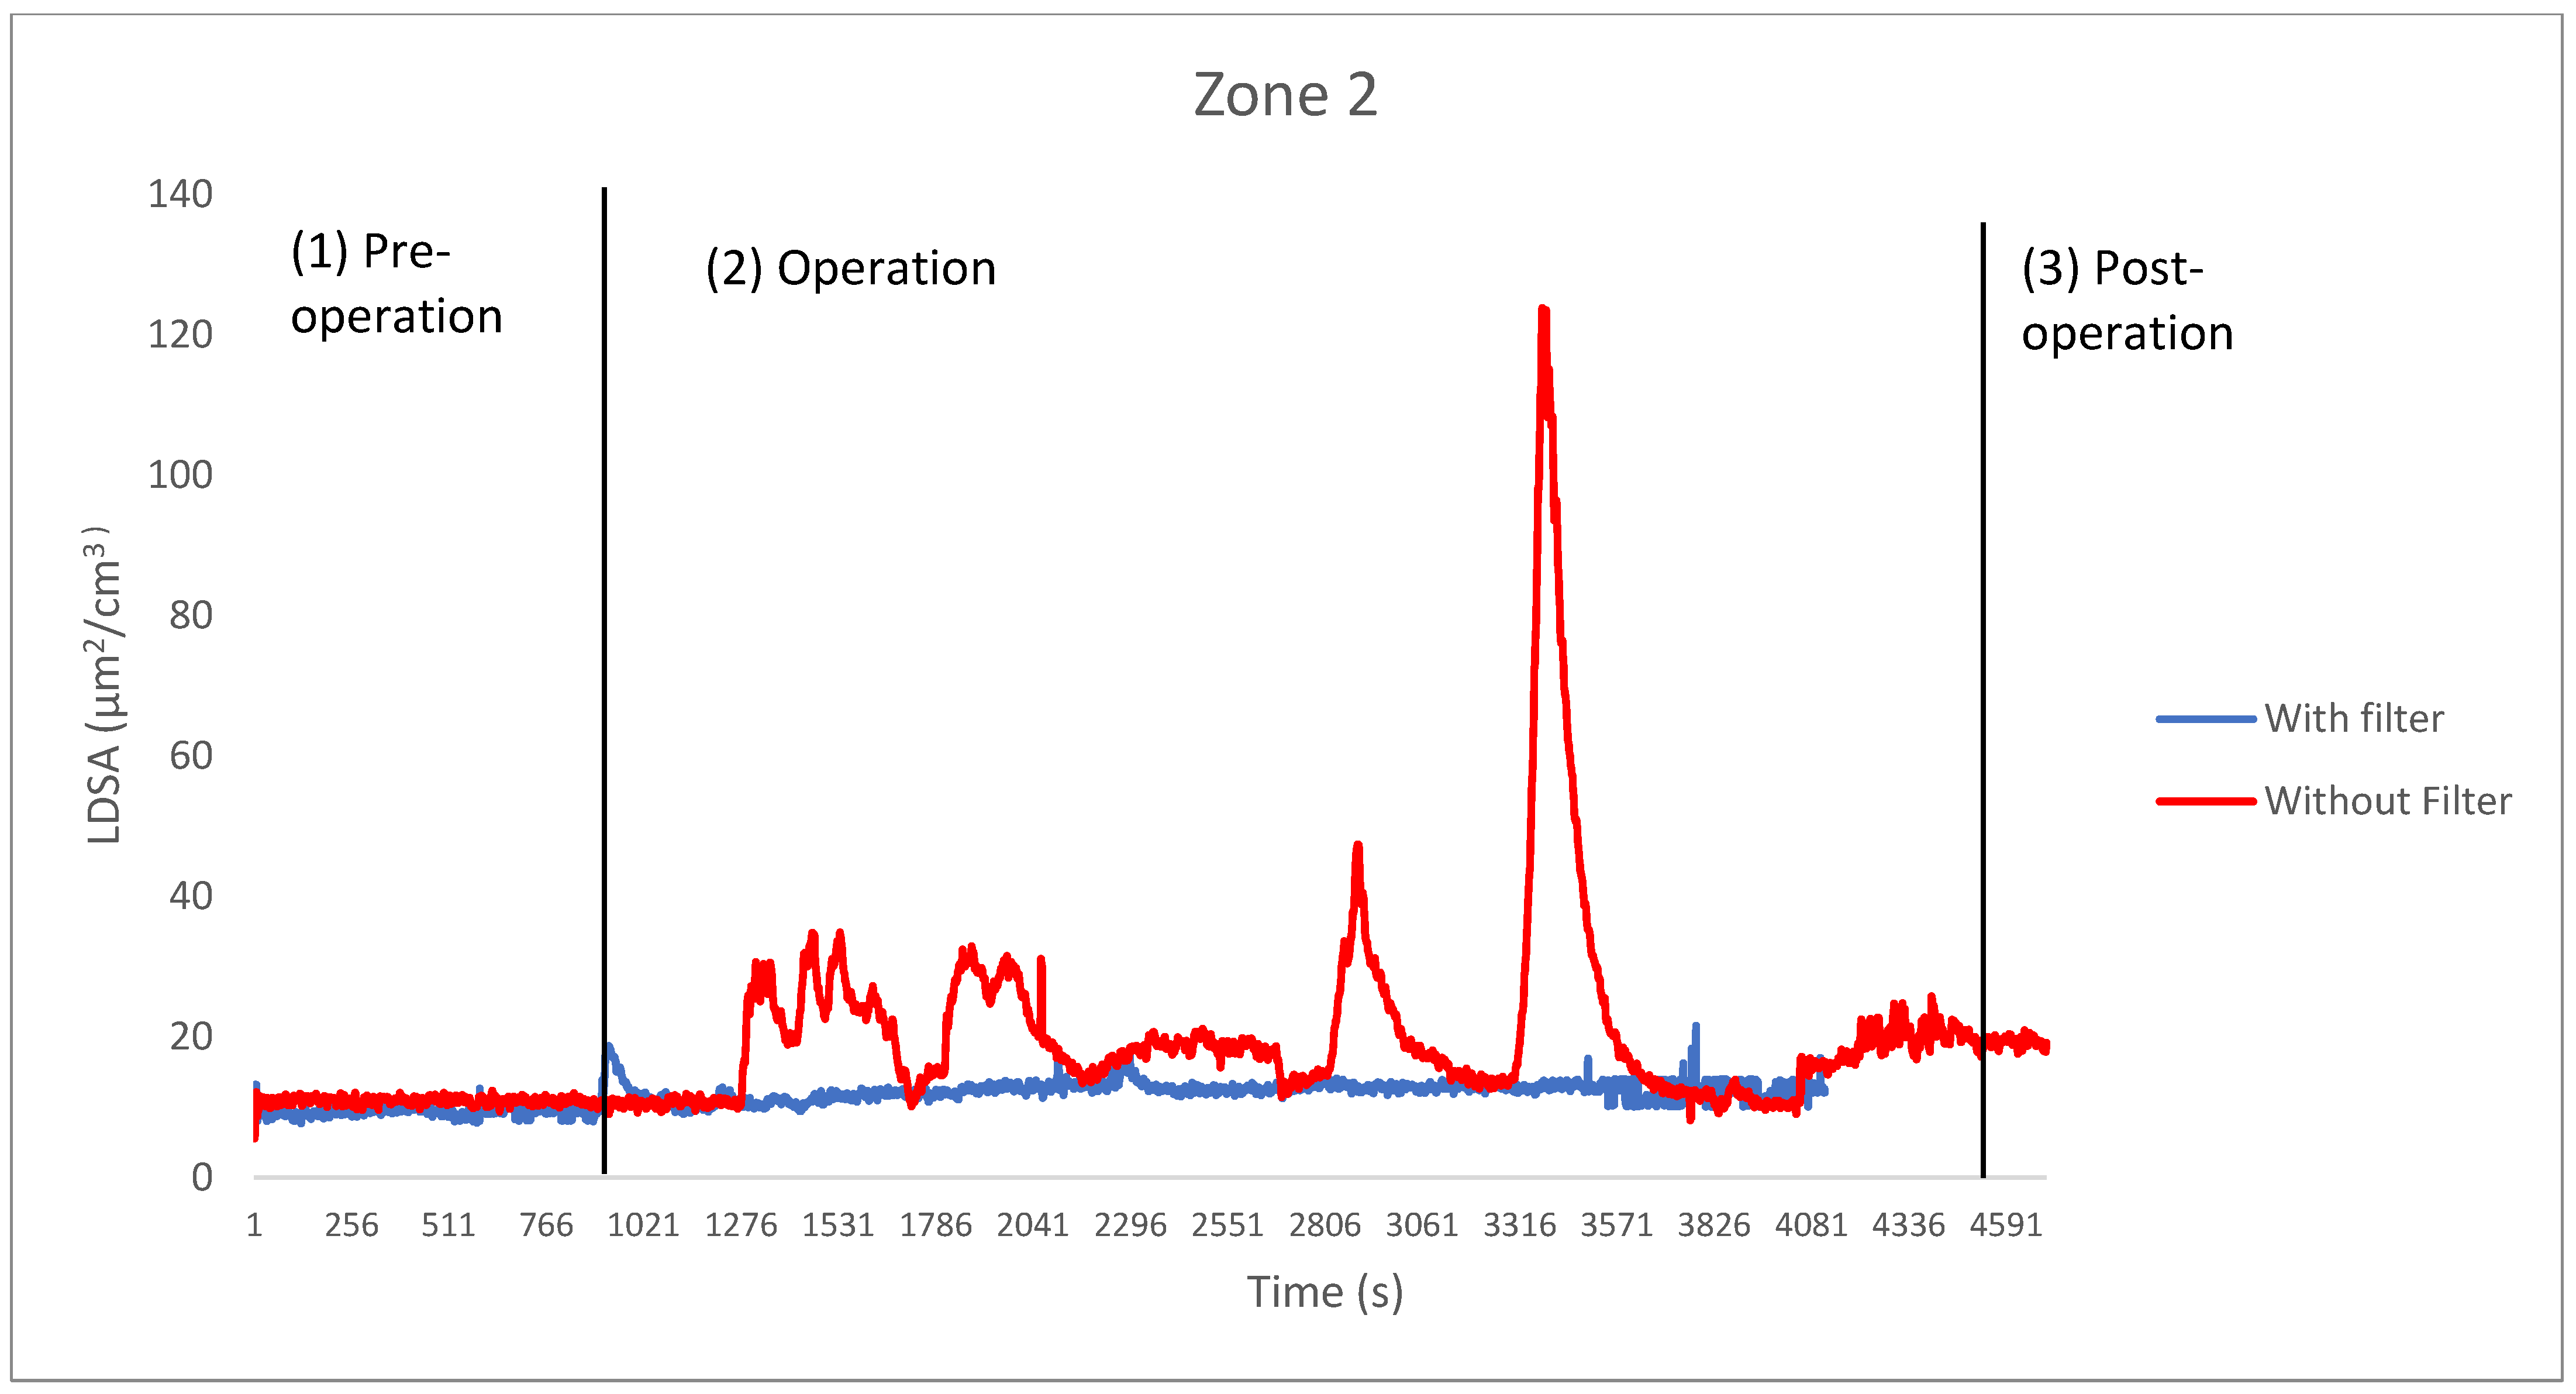
Figure 5.
Concentration of UFPs measured with an LDSA sensor in the closed room of zone 1 during the utilization of the PLA filament printed with a “LOGresse” 3D printer with an open chamber and no filter (the reference of the machine can be found on Wikipedia).
Figure 5.
Concentration of UFPs measured with an LDSA sensor in the closed room of zone 1 during the utilization of the PLA filament printed with a “LOGresse” 3D printer with an open chamber and no filter (the reference of the machine can be found on Wikipedia).
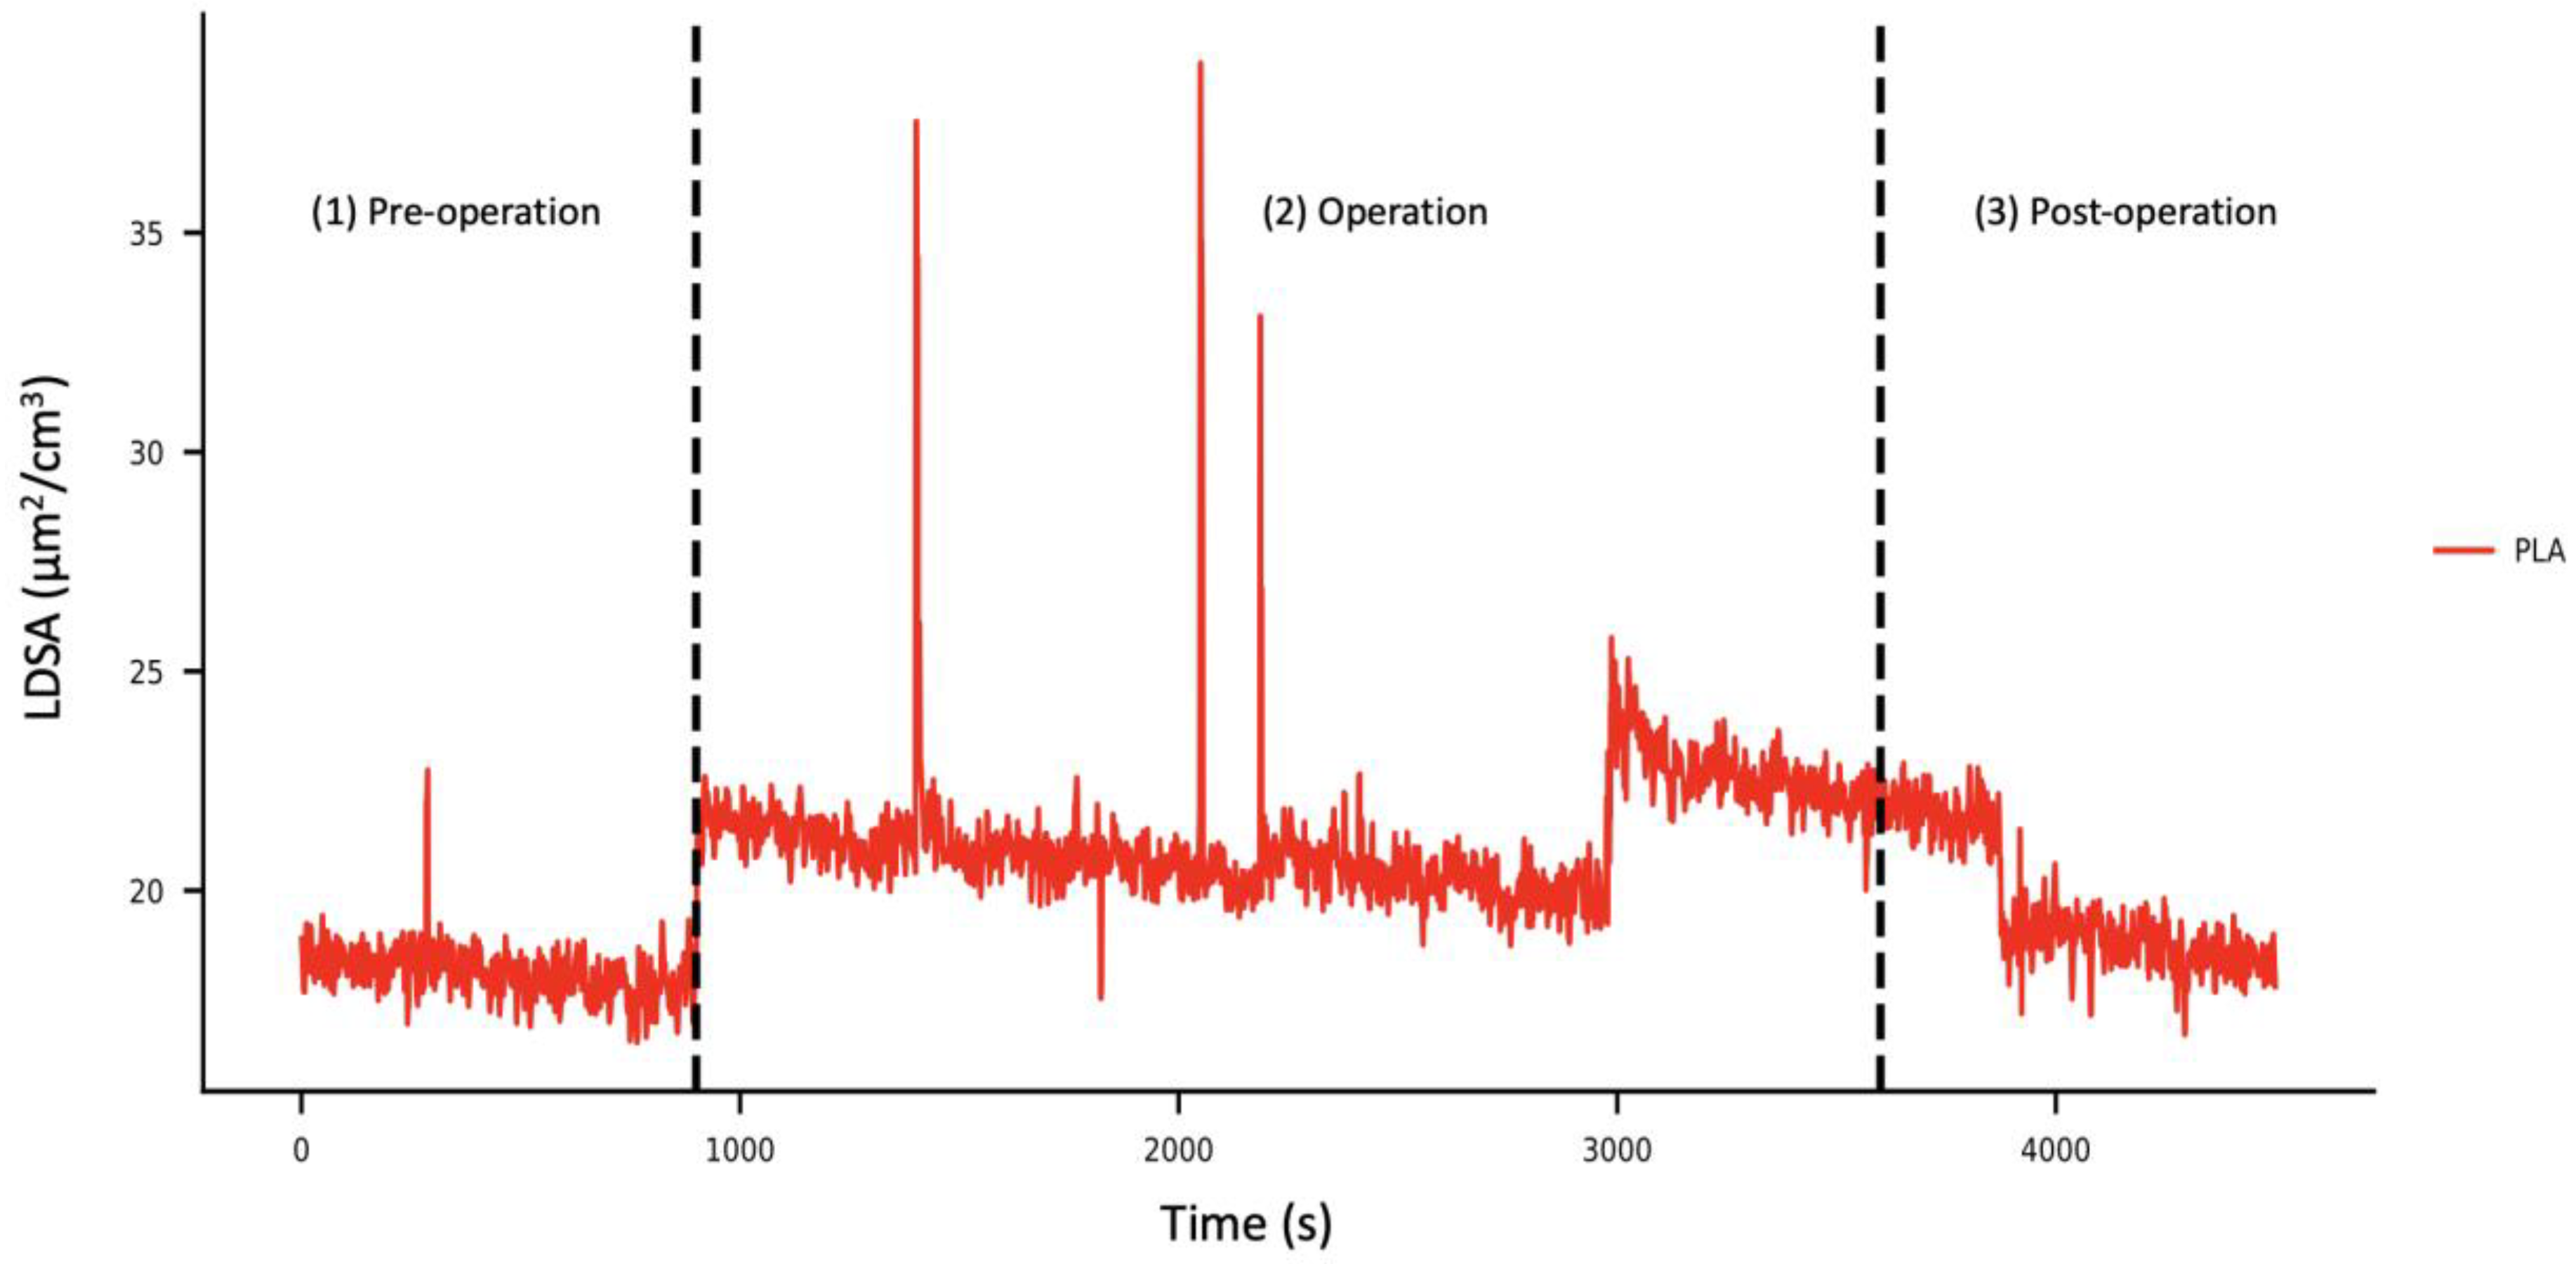
Figure 6.
Concentration of UFPs measured with an LDSA sensor in the closed room of zone 1 during the utilization of the TPE filament printed with a “LOGresse” 3D printer with an open chamber and no filter (the reference of the machine can be found on Wikipedia).
Figure 6.
Concentration of UFPs measured with an LDSA sensor in the closed room of zone 1 during the utilization of the TPE filament printed with a “LOGresse” 3D printer with an open chamber and no filter (the reference of the machine can be found on Wikipedia).
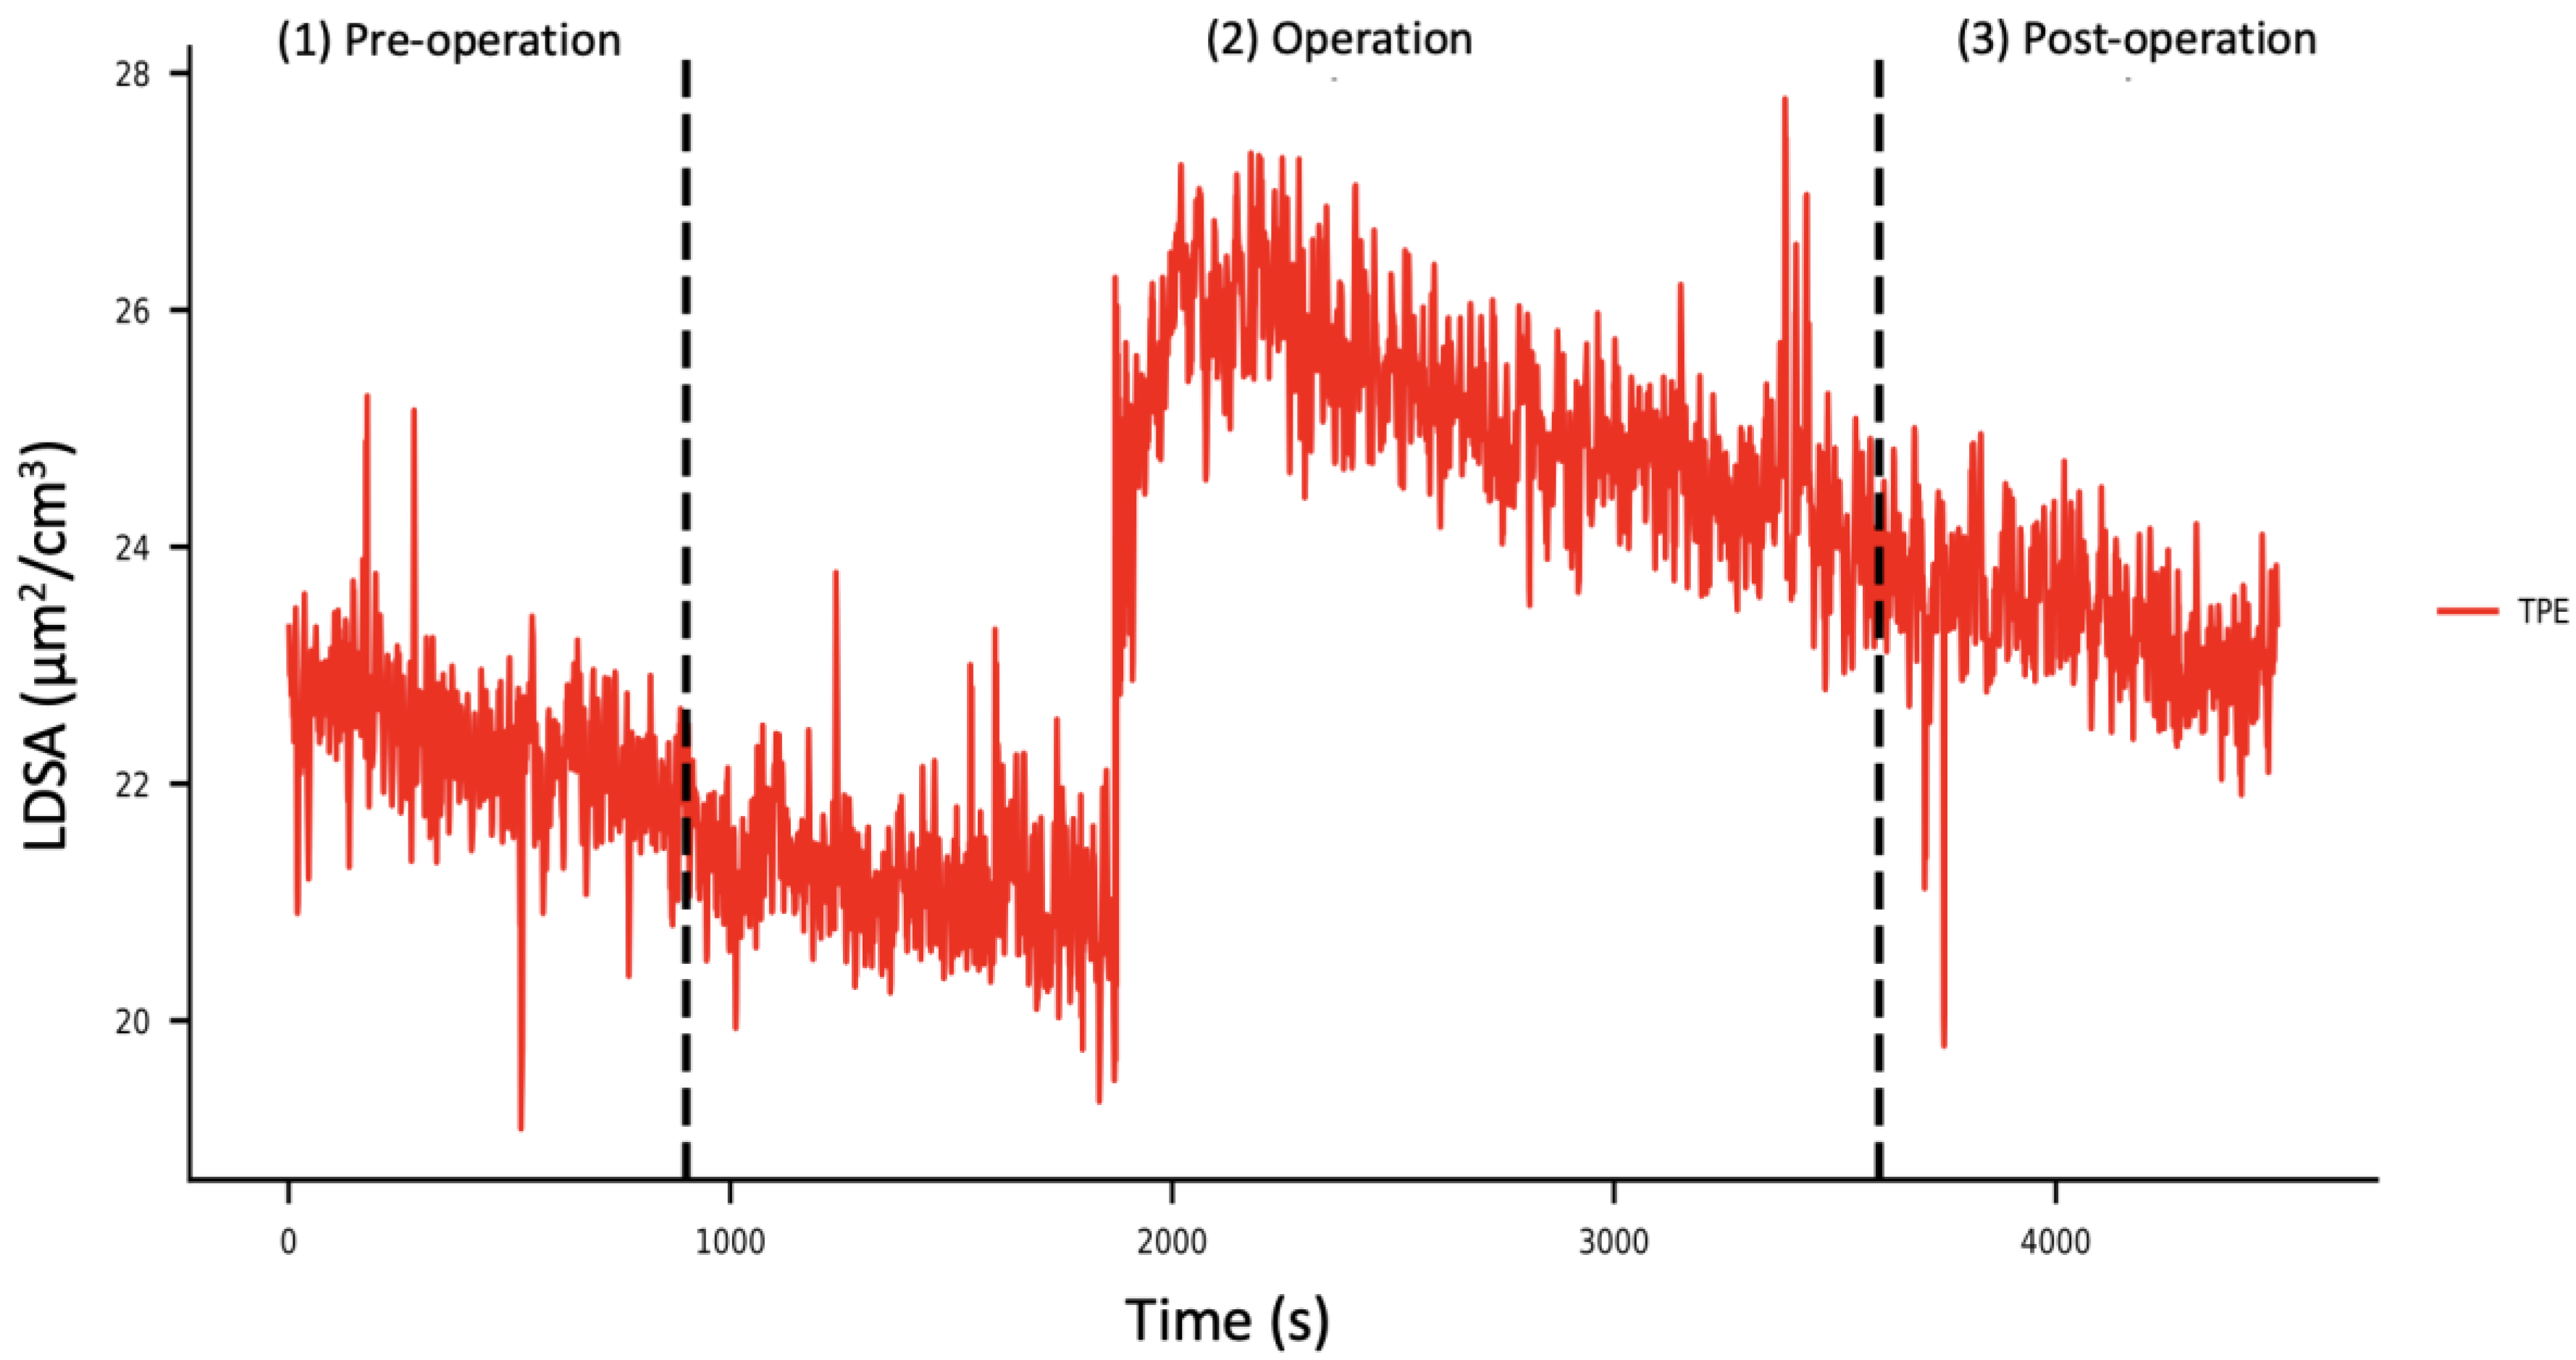
Figure 7.
Concentration of UFPs measured with an LDSA sensor during different stages of laser cutter utilization in zone 5 published in Khaki et al. (2020) [23]; 2–4 stage measurements with stage (1) being the background measurement, stage (2) engraving for 300 s, (3) cutting for 180 s, and (4) post-operation for 400 s.
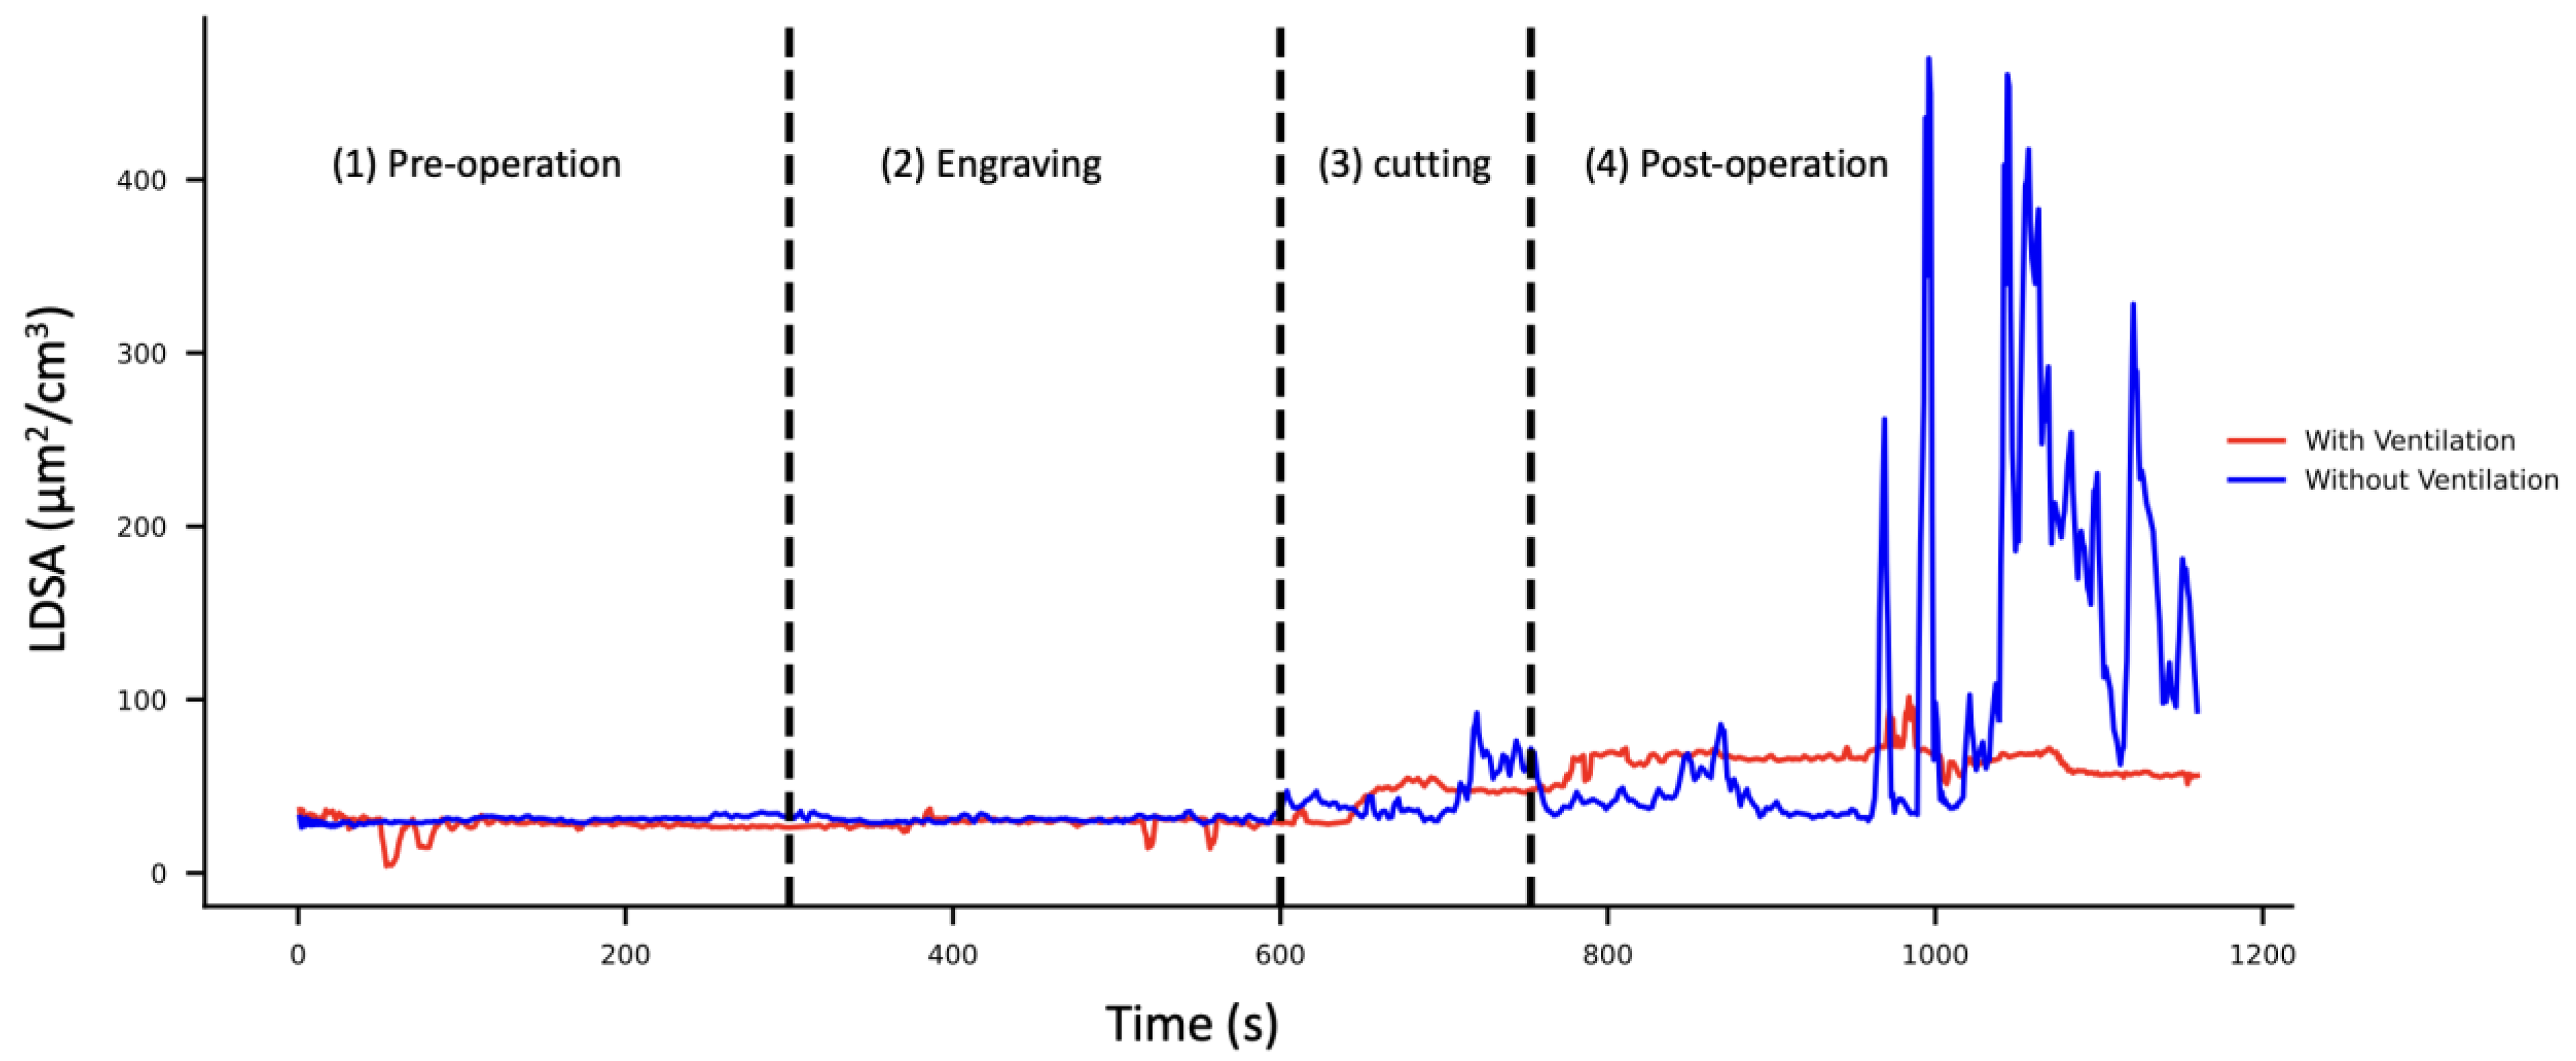
Figure 8.
VOC emission profile for each distinct operational phase for both the 3D printers (left) from zone 3 and the laser cutter (right) from zone 5. The remaining VOCs are listed in the “other VOCs” category.
Figure 8.
VOC emission profile for each distinct operational phase for both the 3D printers (left) from zone 3 and the laser cutter (right) from zone 5. The remaining VOCs are listed in the “other VOCs” category.
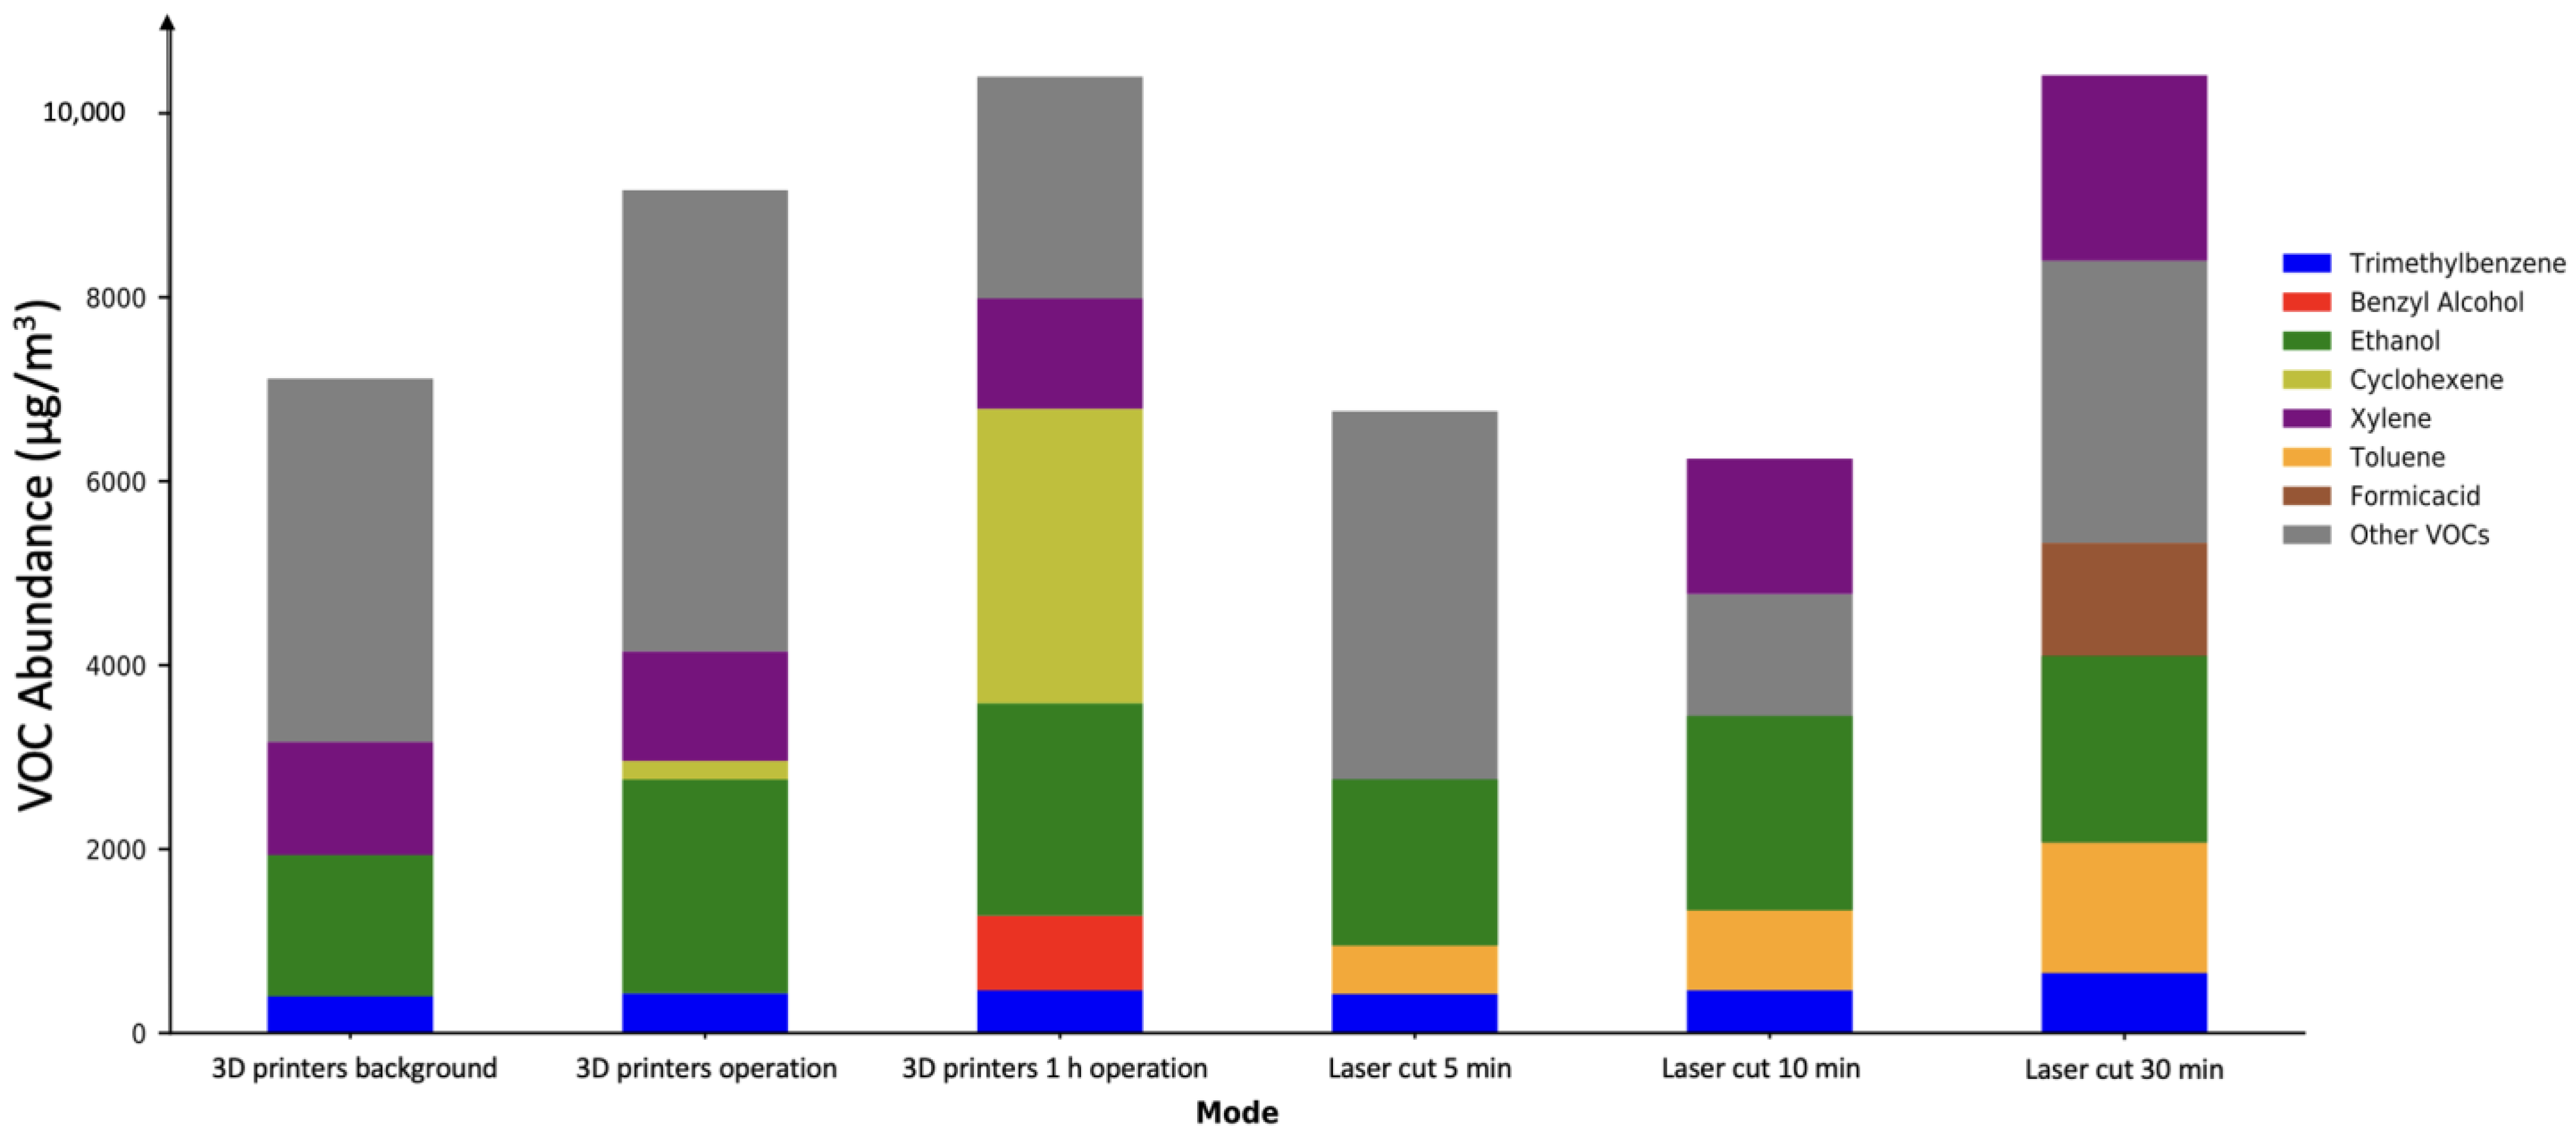
Figure 9.
Top five VOC emission profiles showing distinct and significant emissions for PMMA laser cutting and engraving from zone 5 (left), and for PC and PC-ABS 3D printing from zone 3 (right).
Figure 9.
Top five VOC emission profiles showing distinct and significant emissions for PMMA laser cutting and engraving from zone 5 (left), and for PC and PC-ABS 3D printing from zone 3 (right).
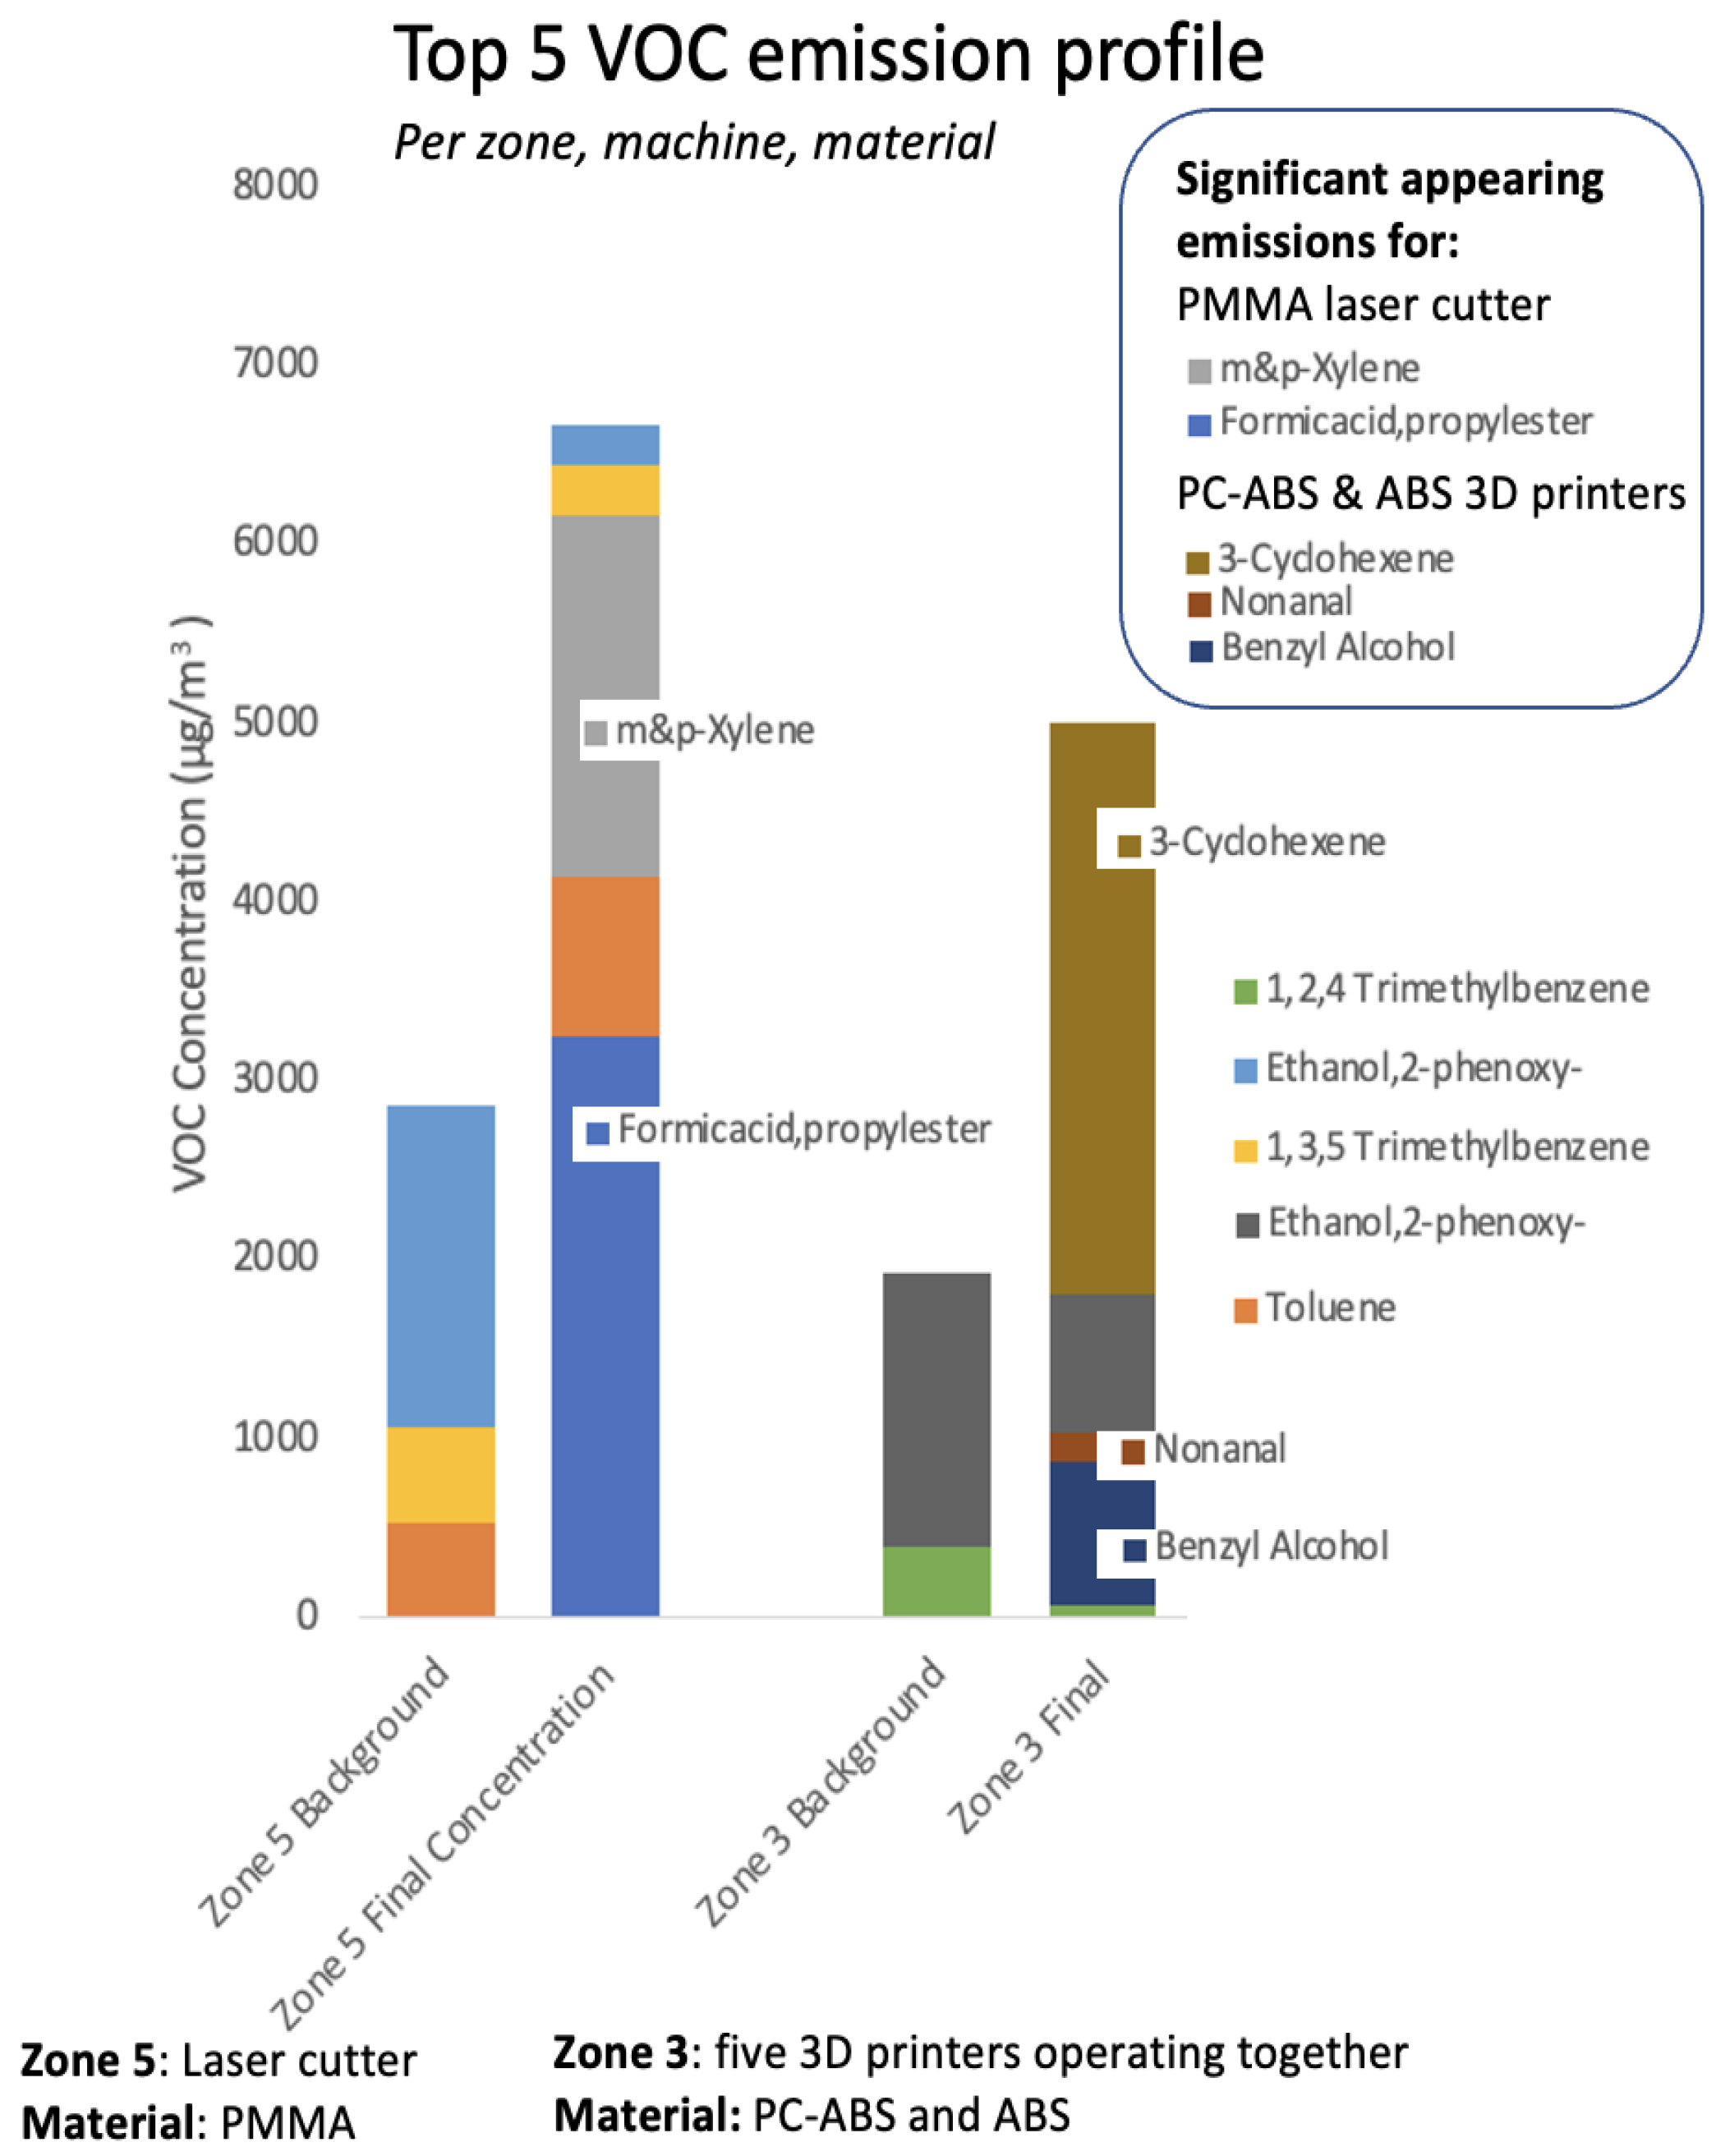
Figure 10.
Top five VOC emission profiles measured in a closed room showing distinct and significant emissions for 3D printing of ABS (left), PLA (middle) and TPE (right).
Figure 10.
Top five VOC emission profiles measured in a closed room showing distinct and significant emissions for 3D printing of ABS (left), PLA (middle) and TPE (right).

Table 1.
Main assessment parameters for monitoring emission rates in Fab Lab environments.
| Assessment Parameters | Descriptive Criterion | Results Targeted |
|---|---|---|
| Internal organization | Machine type and usage rate, materials and liquids used, material renewals, production process patterns, fabrication durations, pre- and post-production and cleaning processes | Pollution pattern detection aligned with seasons and time of day and night |
| Makers’ practices and behavior | Time spent inside, personal movements, physical protection | Occupation schedules |
| Building system technology in place, energy policies | IAQ requirement management processes: indicators, measurement devices and technologies, mitigation processes (ventilation and extraction, filters), assessment frequencies, internal/external data processing | Monitoring and control management system operation |
Table 2.
Experimental conditions for emission measurement. Note: the 3D printers in zones 2 and 3 are “Zortrax”, designed with sides, top, and sealing door, and individually equipped with HEPA filters; in zone 1 the 3D printer is a “LOGresse” type designed with an open chamber and no filter; the laser cutter is equipped with a high-debit air extractor and filtration system embedded in the installation system, releasing the filtrated air four meters behind in the same room.
| Machine | Material Type Filament | Location | Duration of Machine Use for Each Print (in minute) | Temperature (in °C) | ||
|---|---|---|---|---|---|---|
| Room | Extruder Nozzle | Build Platform | ||||
| 3D Printers | PLA | Zone 1 | 45 | 27.3 °C | 205 °C | 65 °C |
| PC-ABS | Zone 3 | 55 | 27.3 °C | 295 °C | 95 °C | |
| ABS | Zones 2 and 3 | 55 | 27.3 °C | 275 °C | 80 °C | |
| TPE | Zone 1 | 65 | 27.3 °C | 230 °C | 50 °C | |
| Laser cutter | PMMA 5 mm | Zone 5 | 5 engraving 3 cutting | 27.3 °C | ||
Table 3.
Summary of the maximal UFP concentrations measured by the LDSA sensor for three 3D printers operating together in zone 3, and for the laser cutting machine operating in zone 5.
Table 3.
Summary of the maximal UFP concentrations measured by the LDSA sensor for three 3D printers operating together in zone 3, and for the laser cutting machine operating in zone 5.
| 3D Printers of Zone 3 | Laser Cutter of Zone 5 | ||||||
|---|---|---|---|---|---|---|---|
| Particulate Matter Concentration (μm2/cm3) | Background | Operation | Final | Background | Engraving | Cutting | Post-operation |
| With HEPA Filtration/Ventilation | 33.4 | 294.15 | 36.63 | 36.53 | 37.01 | 55.06 | 101.54 |
| Without HEPA Filtration/Ventilation | 39.51 | 406.2 | 49.22 | 35.09 | 35.56 | 92.3 | 469.91 |
Table 4.
Summarizes the average and total concentrations of VOC and VVOCs detected, measured as toluene equivalents by the GC/MS sensor in µg/m3. Empty cells refer to undetected compounds. Data are available in the Data Availability Statement named “Supplementary_VOC_PER_ZONE” (cf. https://zenodo.org/record/5913708 (accessed on 27 January 2022)), in the tabs “Zone 3” and “Zone 5”. a Very volatile organic compound (VVOC) rate, according to WHO classification.
| Organic Compounds Detected (µg/m3) | 3D Printers (Zone 3) | Laser Cutter (Zone 5) | ||||
|---|---|---|---|---|---|---|
| Background | During Operation | After 1 h Operation | 5 min | 10 min | 30 min | |
| Acetone a | 76.38 | |||||
| Formic acid a | 259.47 | |||||
| Ethanol a | 204.61 | |||||
| 1-Propanol a | 42.57 | 42.52 | 24.02 | 49.10 | 32.27 | |
| Isopropyl Alcohol a | 473.54 | 204.14 | 457.50 | 214.35 | 215.42 | |
| Propane,1-methoxy a | 238.77 | 296.28 | ||||
| Acetaldehyde a | 288.18 | 178.02 | ||||
| Hydrazine a | 360.13 | 150.62 | 232.73 | |||
| Ethanol,2-methoxy- | 168.59 | |||||
| Acetic Acid a | 66.91 | 47.31 | 26.25 | 74.85 | 47.09 | |
| Formic acid,propylester a | 3258.88 | |||||
| Formic acid,1-methylpropylester a | 152.63 | 196.30 | ||||
| 2-Butanol | 197.81 | |||||
| Formicacid,1,1-dimethylethylester a | 261.95 | |||||
| Propane,2-ethoxy a | 223.36 | 278.58 | 331.35 | |||
| 1-Butanol a | 314.23 | 137.05 | 38.51 | |||
| Methyl Methacrylate a | 78.69 | 1656.80 | 51.31 | 361.10 | ||
| Propenoic acid a | 236.95 | 745.76 | ||||
| Toluene | 709.56 | 720.19 | 528.60 | 528.62 | 868.96 | 1419.06 |
| Ethylbenzene | 1260.23 | |||||
| m&p-Xylene | 1229.03 | 1191.34 | 1198.18 | 1470.99 | 2015.18 | |
| o-Xylene | 332.33 | 314.09 | 287.56 | 309.76 | 374.15 | 561.83 |
| Styrene | 6.66 | |||||
| Cyclohexene | 202.37 | |||||
| N-Propyl Benzene | 50.08 | 99.25 | 57.34 | 48.72 | 49.86 | |
| 1,3,5 Trimethylbenzene | 599.03 | 418.17 | 397.48 | 536.79 | 415.43 | 833.17 |
| 1,2,4 Trimethylbenzene | 398.46 | 432.60 | 464.68 | 423.61 | 466.70 | 653.38 |
| Benzyl Alcohol a | 812.57 | 205.92 | 223.99 | |||
| M-Cresol | 49.66 | 32.10 | 11.15 | 52.26 | 65.14 | |
| Nonanal | 160.667 | |||||
| 2-Nonen | 190.89 | |||||
| Ethanol,2-phenoxy- | 1537.31 | 2323.78 | 2308.67 | 1805.67 | 2111.67 | 2027.56 |
| 3-Cyclohexene | 3202.07 | 299.69 | 373.98 | |||
| Isobornyl propionate | 2385.87 | 321.96 | ||||
| 2-Butanone | 674.70 | |||||
| TVOC | 5728.32 | 8038.06 | 9498.46 | 5461.05 | 6299.47 | 8223.16 |
| TVVOC | 1387.78 | 1126.69 | 900.44 | 3105.93 | 2056.93 | 4218.18 |
| 7116.10 | 9164.75 | 10,398.90 | 8566.98 | 8356.40 | 12,441.33 | |
Publisher’s Note: MDPI stays neutral with regard to jurisdictional claims in published maps and institutional affiliations. |
© 2022 by the authors. Licensee MDPI, Basel, Switzerland. This article is an open access article distributed under the terms and conditions of the Creative Commons Attribution (CC BY) license (https://creativecommons.org/licenses/by/4.0/).
Share and Cite
MDPI and ACS Style
Khaki, S.; Rio, M.; Marin, P. Characterization of Emissions in Fab Labs: An Additive Manufacturing Environment Issue. Sustainability 2022, 14, 2900. https://doi.org/10.3390/su14052900
AMA Style
Khaki S, Rio M, Marin P. Characterization of Emissions in Fab Labs: An Additive Manufacturing Environment Issue. Sustainability. 2022; 14(5):2900. https://doi.org/10.3390/su14052900
Chicago/Turabian StyleKhaki, Shirin, Maud Rio, and Philippe Marin. 2022. "Characterization of Emissions in Fab Labs: An Additive Manufacturing Environment Issue" Sustainability 14, no. 5: 2900. https://doi.org/10.3390/su14052900
Note that from the first issue of 2016, this journal uses article numbers instead of page numbers. See further details here.