
Government Intervention, Human Mobility, and COVID-19: A Causal Pathway Analysis from 121 Countries


School of Economics and Finance, Xi’an Jiaotong University, Xi’an 710061, China
*
Author to whom correspondence should be addressed.
Sustainability 2022, 14(6), 3694; https://doi.org/10.3390/su14063694
Submission received: 2 March 2022
/
Revised: 17 March 2022
/
Accepted: 19 March 2022
/
Published: 21 March 2022
Abstract
:Based on data from 121 countries, the study assesses the dynamic effect and causality path of the government epidemic prevention policies and human mobility behaviors on the growth rates of COVID-19 new cases and deaths. Our results find that both policies and behaviors influenced COVID-19 cases and deaths. The direct effect of policies on COVID-19 was more than the indirect effect. Policies influence behaviors, and behaviors react spontaneously to information. Further, masks give people a false sense of security and increase mobility. The close public transport policy increased COVID-19 new cases. We also conducted sensitivity analysis and found that some policies hold robustly, such as the policies of school closing, restrictions on gatherings, stay-at-home requirements, international travel controls, facial coverings, and vaccination. The counterfactual tests suggest that, as of early March 2021, if governments had mandated masking policies early in the epidemic, the cases and deaths would have been reduced by 18% and 14% separately. If governments had implemented vaccination policies early in the pandemic, the cases and deaths would have been reduced by 93% and 62%, respectively. Without public transportation closures, cases and deaths would have been reduced by 40% and 10%, respectively.
1. Introduction
COVID-19 is one of the most serious infectious diseases that have happened worldwide in a century and has greatly endangered human health. As of early November 2021, there were more than 246.59 million cumulative cases of COVID-19 and more than 4.99 million cumulative deaths worldwide. As the pandemic has spread globally, governments have implemented differentiated interventions [1]. Some of these countries have adopted containment strategies, such as China, South Korea, and Thailand. Such countries have followed the principles of early detection, early reporting, early investigation, early isolation, and early treatment, with surveillance and tracking management measures for cases and close contacts and mandatory closure measures when necessary [2]. Others have adopted mitigation strategies, such as the United States, the United Kingdom, France, Sweden, and Japan. Mitigation measures emphasize herd immunity, prioritizing hospitalization of patients with severe cases [3].
An important outstanding issue, however, is that countries are showing different effectiveness of anti-epidemic outcomes, even when the circulating viruses are the same and the prevention policies are similar. For example, among countries using the mitigation strategy, Japan and Sweden show significant anti-epidemic outcomes, but not the United States, Britain, and France. Thus, the effectiveness of anti-epidemic may be influenced by other factors in addition to policies.
Factors influencing the effectiveness of anti-epidemic outcomes have been analyzed in studies from different aspects. Some scholars considered meteorological factors and air pollution, such as temperature [4], humidity [5], wind speed [6], PM2.5 [7,8]. Some scholars took economic, social, cultural, and government policy factors into account. For example, economic development level [9], human development index [10], level of trust [11], family structure and social habits [12], and government policy [13,14]. What is more, some scholars considered demographic factors, such as age structure [15], population size, and density [16]. Others analyzed the individual factors—for example, multi-morbidity [17] and human mobility behavior [18].
Although the existing literature has analyzed the factors influencing the effectiveness of anti-epidemic outcomes from several aspects, few studies have considered the causal relationship between multiple factors in the analysis. Currently, the following questions remain to be addressed. What are the reasons for the wide disparities in the effectiveness of anti-epidemic outcomes across countries at a global scale? To what extent has government intervention influenced the effectiveness of anti-epidemic outcomes? Is this effect direct or indirect? What are the causal relationships and pathways? What would have happened to the anti-epidemic outcomes if the government had not taken certain measures? Answering the above questions scientifically from the perspectives of economics and sociology is of great theoretical significance for gaining a deeper understanding of the COVID-19 pandemic and response strategies and for assessing the effectiveness of vaccination and non-pharmaceutical intervention policies. At the practical level, clarifying the pathways of governmental epidemic prevention policies on the case growth rate and death growth rate are of great practical significance for governments to further improve epidemic prevention measures, accumulate experience in epidemic prevention, improve people’s health and reduce economic losses.
The purpose of this study is to quantify the reasons for the differences in the anti-epidemic outcomes of different countries based on data from 121 countries, taking into account factors such as government epidemic prevention policies, human mobility behavior, information, and national characteristics, and to measure the causal path among these variables. Then we attain the direct and total effects of government epidemic prevention policies on anti-epidemic outcomes, as well as the indirect impact of government epidemic prevention policies on anti-epidemic outcomes by affecting human mobile behaviors and other variables. On this basis, this paper dynamically simulates confirmed cases and deaths in various countries under counterfactual policies such as mandatory wearing masks, implementing vaccine policy, and not shutting down public transport policy. We have further verified the effectiveness of different anti-epidemic policies.
In this study, we attempt to empirically study the factors and paths influencing the anti-epidemic outcomes after considering the causal relationships among variables. First, we construct a dynamic panel structural equation model on the anti-epidemic outcomes with full consideration of country characteristics, government policies on epidemic prevention, human mobility behaviors, and information factors. Then, the paper derived the model equations for the pathways among variables by combining the dynamic panel structural equation model and the improved SIRDS epidemic model. Finally, we conducted the empirical analysis, robustness tests, and counterfactual tests by using data from 121 countries.
This paper has the following three main innovations. One is the innovation of research content. We not only focus on the causal relationships among anti-epidemic outcomes, government policies on epidemic prevention, human mobility behaviors, information variables, and confounding factors but also consider the effects of vaccination and non-pharmaceutical intervention policies on anti-epidemic outcomes at the same time. Most of the studies examined the effects of only certain types of factors on the effectiveness of anti-epidemic. These factors include vaccination policies and confounding factors such as climatic, economic, and social factors. However, the anti-epidemic outcomes are influenced by multiple factors, and their determination is complex. Therefore, if the causal relationships of multiple factors are not systematically considered when studying the anti-epidemic outcomes, the results of their analysis may be biased. In addition, during the early stages of the COVID-19 outbreak, non-pharmaceutical intervention policies were the primary means for governments to eliminate the spread of the epidemic. With the successful clinical trials of the COVID-19 vaccines, vaccination became an important pharmacological intervention policy for governments to respond to the COVID-19. Therefore, it is necessary to consider both vaccination policies and non-pharmacological interventions in the analysis. The second innovation is the research method. We improved the susceptible–infected–recovered–dead (SIRD) epidemic model to obtain a SIRDS epidemic model applicable to the characteristics of the COVID-19 pandemic. The traditional SIRD epidemic model assumes that recovered individuals have lifelong immunity. However, in reality, COVID-19 patients still have the possibility of being re-infected after recovery. Combining this feature, we obtained the SIRDS infectious disease model based on the SIRD infectious disease model, assuming that a proportion of recovered individuals will turn susceptible. In addition, we combine a variety of other methods to analyze the research topic; these methods include dynamic panel structural equation models, econometric analysis methods, and machine learning. The third innovation is about the application of the research. We simulate the dynamic influences of different counterfactual policies on the anti-epidemic outcomes across countries. The difference between the anti-epidemic outcomes under counterfactual and real policies indirectly assesses the implementation effect of the policy.
This paper is organized as follows: Section 2 reviews relevant literature. Section 3 describes the model specification and data sources. Section 4 presents the empirical results. Section 5 follows with a sensitivity analysis. Section 6 simulates the impact of counterfactual policies on health. Finally, Section 7 presents our conclusions.
2. Literature Review
Scholars have studied the spread of the COVID-19 virus in many aspects. The existing literature related to this article can be divided into four categories.
The first category of literature studies the impact of economic, social, and environmental factors on COVID-19 transmission. Coker et al. [19] find that each unit increase in PM2.5 concentration results in a 9% increase in COVID-19 mortality. Bretschger et al. [8] conclude that improving air quality and reducing obesity both contribute to reducing the negative impact of the COVID-19 pandemic. Vera-Valdés [11] describes how alcohol consumption is positively associated with confirmed cases and deaths. Moosa and Khatatbeh [16] suggest that case rate and death rate are influenced by different factors, with case rate depending on the urban population and death rate depending on the age structure and population density. Ang et al. [20] attain two main conclusions. First, social factors are more effective than economic factors. Second, more cases and deaths in countries with high human freedom degrees. Moreover, some scholars analyze the impact of COVID-19. Łuczak and Kalinowski [21] study the epidemiological situation of the COVID-19 in Europe and use the entropy method to assess the uncertainty of the epidemiological status. They find that Europe has three epidemic states of COVID-19, namely stable, unstable, and expanding. Dudek and Śpiewak [22] analyze the effects of the COVID-19 pandemic on the sustainable food system. They find that the COVID-19 disrupted the functioning of Poland’s food system. Kalinowski et al. [23] conducted a subjective evaluation of family social security during COVID-19 and find that the effectiveness of Poland’s public policy needs to be improved. Churski et al. [24] assess the social and economic impact of COVID-19, find that the epidemic affected vulnerable groups such as migrant workers, and proposed strategies applicable to migration in the labor market. Robinson et al. [25] study the impact of COVID-19 on the industrial food system in the United States, find that the epidemic provided opportunities for small producers.
The second category of literature examines the impact of non-pharmacological interventions on COVID-19 transmission. Lai et al. [26] come to that early detection and isolation of cases are more effective than travel restrictions. Second, without non-pharmaceutical interventions, confirmed cases in China would have increased 67-fold by 29 February 2020. Awaidy and Mahomed [27] obtain two main conclusions. First, early implementation of lockdowns is important in mitigating a large-scale COVID-19 outbreak in Oman. Second, without non-pharmaceutical interventions, the entire population of Oman would have been infected within 65 days. Chen and Qiu [28] use panel data from nine countries/regions to simulate different scenarios to study the impact of non-pharmaceutical intervention policies on COVID-19 transmission. They attain two conclusions. First, mandatory school closures, masks, and centralized quarantine have similar effects on containing the spread of the outbreak. Second, the United States and Singapore need to strengthen non-pharmaceutical interventions to control the spread of the disease, while other countries should phase out these measures to reduce economic costs.
Other scholars analyze the mediating variables of non-pharmacological interventions to curb the spread of COVID-19. Lemaitre et al. [29] study the impact of non-pharmaceutical interventions on the transmission rate of COVID-19 in Switzerland. They conclude that the main reason for the decline in infection rate is behavioral change rather than natural immunity. Amuedo-Dorantes et al. [30] compare the COVID-19 epidemic curves in different regions and conclude that the main reason for the slowdown in the spread of COVID-19 is intervention measures, not the improvement of health care capacity.
In addition, some scholars evaluate and compare the effectiveness of different non-pharmaceutical interventions. Banholzer et al. [31] attain that restriction on gatherings has the best effect, followed by closing public venues and schools, while stay-at-home orders have the least effective. Jayaweera et al. [32] find that lockdown and isolation measures are the most effective, while hand hygiene and masking are the least effective. Amuedo-Dorantes et al. [33] attain that adoption of a safer-at-home order or non-essential business closure the day before infection doubles reduce COVID-19 mortality by 1.9%.
The third category of literature finds the impact of human mobility behaviors on COVID-19 transmission. Fritz and Kauermann [34] conclude that decreasing mobility and social connections reduce infection rates. Zheng et al. [35] find that reducing mobility, focusing on personal protection, and increasing social distances are more effective measures to prevent the epidemic. Moreover, scholars also study the impact of non-pharmaceutical interventions on mobility. Mamelund et al. [36] separately investigated the influence of non-pharmaceutical interventions on the magnitude and speed of mobility changes during the COVID-19 pandemic. They find that lockdowns, school closures, and business closures have a greater impact on changes in mobility, while lockdowns and restrictions on gatherings have a greater impact on the rate of change in mobility. In addition, there are scholars studying transportation after the outbreak of the COVID-19. Some literature analyzes new mobility services and their functioning during the pandemic. For example, Turoń et al. [37] propose sustainable traffic management recommendations for cities and transport service operators by studying the main factors affecting the electric shared mobility industry during and after the COVID-19 lockdown. Some other literature focuses on the practices used by new mobility service operators during the pandemic. Turoń and Kubik [38] find that car-sharing systems and ride-sharing services have mostly adapted their business models to pandemic changes.
The fourth category of literature explains the impact of vaccination policies on COVID-19 transmission. Marín-Hernández et al. [39] find that vaccination policies reduce COVID-19 mortality, and combining vaccination policies and non-pharmacological interventions would be effective in mitigating disease transmission. Giordano et al. [40] conduct a scenario analysis of COVID-19 deaths in Italy from April 2021 to January 2022. They suggest that non-pharmacological interventions have a greater impact on the epidemic than vaccination-alone and that the combination is more effective.
By combing the literature, the spread of COVID-19 is influenced by multiple factors, and any single level of analysis would be biased. There is no single action that can completely defeat the epidemic, and it is necessary to consider multiple factors mentioned above in the analysis. Chernozhukov et al. [14] examine the transmission pathways of the COVID-19 in the U.S. state from multiple perspectives. However, the paper did not use cross-country data. As a global public health emergency, the selection of a single country or region for the study of COVID-19 would ignore the influence of other aspects. Second, the authors did not consider the impact of vaccination policies, but it is a key factor in curbing the spread of the epidemic.
We systematically consider the causality of the above factors to study the impact and pathways of government interventions on anti-epidemic outcomes. By referring to the literature, this paper will expand in two aspects. First, using daily data from 121 countries, we will explore the causal pathways influencing the spread of the COVID-19 by considering a combination of country characteristic variables, information variables, government epidemic prevention policies, human mobility behaviors, and anti-epidemic outcomes. Second, consider both vaccination and non-pharmaceutical intervention policies in government epidemic prevention policies.
3. Model Specification and Data Sources
3.1. Model Specification
3.1.1. Causal Model and Its Structural Equation Form
Combined with literature and reality, the COVID-19 anti-epidemic outcomes are influenced by multiple factors. The causal model combines the dynamic panel structural equation model and econometrics. Through some mediator variables, the complicated relationship among variables is expressed, and how variables affect each other is described. In addition, the model can effectively deal with the endogeneity problem and does not need to use estimation methods such as IV, 2SLS, GMM, etc. In this paper, the model allows for government epidemic prevention policies to have direct or indirect effects on health outcomes, and these effects do not conflict. The model also allows changes in the government epidemic prevention policies and information to affect human mobility behaviors. These all help us to quantify the relationship among variables.
The variables are not only directly influenced by changes in behaviors and policies but may also be indirectly influenced by policies through changes in behavior. In addition, the variables may release new information that can influence future policies and even trigger dynamic changes over multiple periods. Referring to Chernozhukov et al. [14], we plot the pathway relationships among confounding factors, information variables, policies, behaviors, and anti-epidemic outcomes in Figure 1.
From Figure 1, we know that confounding factors Wc,t, information variables Ic,t, policies Pc,t, and behaviors Bc,t jointly affect anti-epidemic outcomes Hc,t+l.
- (1)
- Confounding factors Wc,t influence information variables Ic,t, government epidemic prevention policies Pc,t, human mobility behaviors Bc,t, and anti-epidemic outcomes Hc,t+l, as shown by the four purple directed lines in Figure 1.
- (2)
- Information variables Ic,t influence government epidemic prevention policies Pc,t, human mobility behaviors Bc,t, and anti-epidemic outcomes Hc,t+l, as shown by the three yellow directed lines in Figure 1.
- (3)
- As shown by the two green directed lines in Figure 1. Government epidemic prevention policies Pc,t not only directly affects human mobility behaviors Bc,t and anti-epidemic outcomes Hc,t+l, but also indirectly affects anti-epidemic outcomes through behavioral variables.
- (4)
- Human mobility behaviors Bc,t have a direct effect on the anti-epidemic outcomes Hc,t+l, as shown by the brown directed line in Figure 1.
The causal path among the variables in Figure 1 can be represented by the following model. Equation (1) represents the direct effects of behaviors Bc,t, policies Pc,t, information variables Ic,t and confounding factors Wc,t on health outcomes Hc,t+l in period t + l. Equation (2) shows the direct effects of governmental prevention policies Pc,t, information variables Ic,t, and confounding factors Wc,t on behaviors Bc,t in period t. Equation (3) expresses the direct effects of information variables Ic,t, and confounding factors Wc,t on governmental prevention policies Pc,t in period t.
where α represents the coefficient vector of the direct effect of behaviors on anti-epidemic outcomes. π represents the coefficient vector of the direct effect of policies on anti-epidemic outcomes. μ represents the coefficient vector of the direct effect of information variables on anti-epidemic outcomes. β represents the coefficient vector of the direct effect of policies on behaviors. γ represents the coefficient vector of the direct effect of information variables on behaviors. η represents the coefficient vector of the direct effect of information variables on policies. δH, δB, and δP are the coefficient vectors of the direct effects of confounders on anti-epidemic outcomes, behaviors, and policies, respectively. εH, εB, and εP are unobservable random error terms.
Combining Equations (1) and (2), we obtain the total effect (sum of direct and indirect effects) of policies and information variables on anti-epidemic outcomes when considering the causal path among variables.
The effect of policies and information variables on health variables can be represented by the Equation (5) if the causal path between variables is not considered.
where ϕ, φ, and represent the coefficient vectors of the total effect of policies and information variables. Confounding factors on anti-epidemic outcomes when causal pathways among variables are not considered, respectively. represents the unobservable random error term.
3.1.2. SIRDS Epidemic Model
In this paper, anti-epidemic outcomes include the new case growth rate and new death growth rate. When the health outcome is the new case growth rate
where c denotes country. t denotes time. C denotes the cumulative number of confirmed cases. indicates the number of new cases.
According to the SIRDS epidemic model, we can now abbreviate Equations (1) and (4) as Equation (6).
where X denotes behaviors, policies, information variables, and confounding factors. Fourteen days represents the time lag between infection and new cases [14,41]. T is the number of tests. represents the unobservable random error term.
The setting and interpretation of Equation (6) relies on the SIRDS epidemic model, which is our improvement on the SIRD epidemic model. In the SIRD epidemic model, the population can be divided into four categories: susceptible, infected, recovered, and dead, and the model assumes that individuals have lifelong immunity to the disease. However, in reality, immunity to some diseases gradually decreases or even disappears over time. For example, the possibility of reinfection exists for recovered COVID-19 patients. In this case, we obtained a modified SIRDS epidemic model based on the SIRD model, assuming that a proportion of recovered individuals will turn susceptible (see Figure 2).
The SIRDS epidemic model can be represented by the following equation.
where t denotes time. p denotes the infection rate. N is the total population. S is the number of susceptible persons. I is the number of infected persons. R represents the number of cured persons. D is the number of dead persons. q is the sum of the recovery rate and mortality rate. k denotes the mortality rate of the infected. u denotes the rate at which recovered persons become susceptible due to loss of immunity.
New cases can be expressed as
where τ indicates the detected infection rate.
We can attain C and D while we cannot attain I. Thus, combining Equations (8) and (11), we obtain Equation (12) after eliminating I.
By specifying as a linear function of and correlating the detection rate with the number of detections , we can set up an empirical model using the discrete-time analog of Equation (12).
3.1.3. Counterfactual Policy Analysis
Based on the above model, we also want to know what would happen to anti-epidemic outcomes if the government did not adopt certain epidemic prevention policies. To do this, we set up some counterfactual policies , and simulate the anti-epidemic outcomes of these policies. Except for the counterfactual policies, the rest is the same as the previous model. Figure 3 depicts the causal path diagram under the counterfactual policies.
According to the parameters in the model, it is possible to iteratively calculate the dynamics of anti-epidemic outcomes when the counterfactual policy is implemented. The model in Figure 3 can be approximated in the following form.
when , the new cases at time t can be calculated by the following equation.
On this basis, we can also obtain the ratio of counterfactual new cases to real new cases at t.
Counterfactual estimates for deaths are similar to those for confirmed cases.
3.2. Data Source
Considering the availability of data, we select the panel data of 121 countries (see Table 1) from 17 February 2020 to 7 March 2021 for the empirical analysis. We chose the standard correlated random effects estimation method for the following two reasons. First, the study time in this paper is short, and the sample is taken from the aggregate. Second, regarding characteristic variables that do not vary over time, the random effects estimation approach assumes that such variables affect the explanatory variables and allows the variables to appear in the model. Both of these points suggest that the random effects estimation method is more suitable for the model in this paper. At this point, the random effects can be parameterized as a function of observable characteristic variables, and the confounding variables Wc,t include country-level random effects and time random effects. Among them, the country-level random effects are modeled as a function of the country characteristic variables, and the time random effects are modeled as a function of the quarterly dummy variables and their interaction terms with the country characteristic variables.
When considering the multi-collinearity problem, the country characteristics variables include “pop density”, “aged 70 order”, “cardiovascular”, “diabetes”, and “GDP per capita”. These data are obtained from the Our Word in Data (OWID) database. The anti-epidemic outcomes Hc,t+l included the growth rate of new cases and the growth rate of new deaths. These data are from the OWID database. The behaviors Bc,t include “workplaces”, “retail”, “transit”, and “grocery”, which are derived from the “Google COVID-19 Community Mobility Reports”. These variables reflect the percentage change in the number of visits and length of stay in these places compared to the base period (The baseline is the median of the same day of the week from 3 January to 6 February 2020). The government vaccination policy variables include “school closing”, “cancel public events”, “restrictions on gatherings”, “close public transport”, “stay at home requirements”, “international travel controls”, “testing”, “contact tracing”, “facial coverings”, and “vaccination”. These data are from the Oxford COVID-19 Government Response Tracker (OxCGRT) database. We use the lag terms of some variables to reflect the information variables Ic,t; these variables include the growth rate of new cases, the growth rate of new deaths, new cases, and new deaths. Since the latter two are absolute numbers, we take logarithms for them. The data from the OWID database. Based on the results of the SIRDS model, the growth rate of new tests should also be considered in the direct and total effects model of the growth rate of new cases.
The data processing process is as follows. The health, behavior, policy, and information variables are daily data and are highly volatile. To eliminate the non-smoothness of the data, we aggregate the daily data to weekly data. Weekly data have the following advantages over daily data. First, white noise can be removed. Second, the cyclical fluctuations associated with particular days (e.g., reporting days, testing days, etc.) can be reduced. Third, weekly data (e.g., reduction in new cases over two weeks) are key indicators for government policymakers to implement policies. These data are processed as follows. First, for the health and test variables, we sum the daily number of new cases, daily number of new deaths, and daily number of detections from day t to t-6, respectively. On this basis, we obtained the weekly growth rates of new cases, the weekly growth rates of new deaths, and the weekly growth rates of new tests. Second, we attained the weekly policy and behavioral variables through 7-day moving averages from t to t-6 days. Third, for the country-level variables, we use annual data to approximate weekly data.
4. Empirical Analysis
4.1. The Effect of Policies and Information on Behaviors
The empirical results of the Equation (2) are shown in Table 2. The results suggest that behaviors are not only influenced by policies but also respond to information released on cases and deaths growth. We reached similar conclusions whether we used information from confirmed cases (Table 2a) or deaths (Table 2b). First, the school closing, close public transportation, and stay-at-home requirements policies significantly reduce people going to workplaces, retail, transit, and grocery stores. The international travel controls policy significantly reduces people going to transit. Second, the public events cancellation and vaccination policies do not affect people going to workplaces, retail, transit, and grocery. Third, the facial coverings policy significantly increases people going to workplaces, retail, transit, and grocery. Fourth, in Columns (1) and (2) of Table 2, the coefficients of “logdc” and “logdd” are significantly negative. This indicates that all other factors being equal, a 1% increase in the number of new cases decreases the percentage change in the number of visits to workplaces and retail compared to the base period by 0.009% and 0.014%, respectively. If there is a 1% increase in new deaths, the percentage change in the number of visits to workplaces and retail compared to the base period decreases by 0.009% and 0.015%, respectively. These show that the increase in the number of new cases and deaths has led to a growing awareness of the dangers of the COVID-19.
4.2. The Direct Effect of Policies, Behaviors, and Information on Cases and Deaths Growth
The empirical results of the Equation (1) are shown in Table 3. In Table 3a, l is taken as 14 days. In Table 3b, l is taken as 21 days.
Based on the empirical results, the paper draws the following conclusions. First, we analyzed the direct effect of government epidemic prevention policies on health outcomes. The international travel controls policy reduces the future growth rates of new cases and deaths by 25.3% and 33.6%, respectively. The school closing policy reduces the future growth rates of new cases and deaths by 23.3% and 17.4%, respectively. The vaccination policy reduces future growth rates of new cases and deaths by 15.8% and 14.4%, respectively. The facial coverings policy reduces future growth rates of new cases and deaths by 13.3% and 12.6%, respectively. The public events cancellation policy reduces the future growth rates of new cases and deaths by 9.3% and 7.9%, respectively. The testing and contact tracing policies reduce the growth rate of future confirmed cases by 23.5% and 8.2%, respectively, but do not have a significant impact on the future new deaths growth rate. The direct effect of the restrictions on gatherings and stay-at-home requirements policies on future health outcomes is not significant, as they may indirectly affect health outcomes through changes in human mobility behaviors. However, the direct effect of the close public transport policy on anti-epidemic outcomes was 5.4% and 3.8% higher in the growth rate of new cases and deaths, respectively.
Second, we attained the direct effect of human mobility behaviors on anti-epidemic outcomes. The coefficient of “workplaces” with a 14-day lag is significantly positive. It indicated that a 1% decrease in the percentage change in the number and length of stay of people going to workplaces compared to the base period led to a decrease in the growth rate of new cases after 14 days 0.47%. The coefficients of “workplaces” and “transit” with a lag of 21 days are significantly positive. It meant that the percentage change in the number of visits to workplaces and transit was 1% lower than that of the base period, and the growth rate of deaths decreases by 0.4% and 0.25% after 21 days, respectively. However, a 1% decrease in the percentage change in the number and length of stay of people going to grocery compared to the base period would result in a 0.41% and 0.32% increase in the rate of new cases and deaths, respectively, in the future.
Third, we studied the direct effect of information on anti-epidemic outcomes. The coefficients on the lagged growth rates of new cases and deaths are significantly positive, indicating that a 1% increase in the growth rate of new cases would result in a 0.048% increase in the growth rate of new cases 14 days later and a 1% increase in the growth rate of current new deaths would result in a 0.05% increase in the growth rate of deaths 21 days later. The coefficients of lagged “logdc” and “logdd” are both significantly negative, indicating that a 1% increase in new cases would result in a 0.028% decrease in the rate of growth of new cases 14 days later. If the number of new deaths increases by 1%, the growth rate of new deaths decreases by 0.021% after 21 days.
Fourth, the paper explained the direct effect of tests on new cases. The coefficient on the growth rate of testing is significantly positive, indicating that a 1% increase in the growth rate of testing rate is associated with a 0.019% increase in the growth rate of new cases.
4.3. The Total Effect of Policies and Information on Cases and Deaths Growth When Causal Pathways Are Not Considered
By estimating the Equation (5), we obtained the total effect of policies and information on cases and deaths growth when causality among variables was not considered (see Table 4).
Based on the empirical results, the paper draws the following conclusions. First, the paper stated the total effect of policies on health outcomes when causal pathways are not considered. As shown in Table 4, the policies of international travel controls, school closing, testing, vaccination, facial coverings, public events cancellation, and contact tracing reduced the growth rate of future new cases by 27.1%, 26.8%, 26.1%, 17.1%, 11.5%, 8.4%, and 7.8%, respectively. The policies of international travel controls, school closing, vaccination, and facial coverings decreased the rate of future new deaths by 36.2%, 21.7%, 15.5%, and 11.1%, respectively. It indicated the effectiveness of these prevention policies, whereas the close public transport policy increased the rate of future new cases by 3.8%, indicating that the policy was not effective in general.
Second, we explained the total effect of information on health outcomes when causal pathways are not considered. As seen in Table 4, the coefficients on the lagged growth rates of new cases and deaths are significantly positive, indicating that a 1% increase in the growth rate of new cases leads to a 0.057% increase in the growth rate of new cases 14 days later. A 1% increase in the growth rate of new deaths leads to a 0.052% increase in the growth rate of new deaths 21 days later. The coefficients on the lagged logarithm of both new cases and deaths were significantly negative, indicating that a 1% increase in new cases results in a 0.035% decrease in the growth rate of new cases 14 days later. A 1% increase in new deaths results in a 0.026% decrease in the growth rate of new deaths 21 days later.
Finally, we demonstrated the total effect of tests growth rate on the growth rate of new cases. The coefficient on the growth rate of tests was significantly positive, indicating that a 1% increase in the growth rate of testing would increase the growth rate of new cases by 0.019%.
4.4. The Direct, Indirect, and Total Effects of Government Epidemic Prevention Policies and Information on Anti-Epidemic Outcomes
Now, we explain the indirect and total effects of policies and information on cases and deaths growth. We also compared the average effect and differences among considering the causal paths and not.
The results are shown in Table 5. Column (1) is derived from Table 3 and represents the direct effect of policies on cases and deaths growth when behaviors are unchanged. Column (2) is the indirect effect of government vaccination policy on cases and deaths growth by changing behaviors. The coefficients of Column (2) can be calculated from Table 2 and Table 3. Column (3) is the total effect of policies on cases and deaths growth when considering the causal pathway. The coefficients of Column (3) are obtained by summing Columns (1) and (2). Column (4) is derived from Table 4 and refers to the total effect of policies on cases and deaths growth when causal pathways are not considered. The coefficient in Column (5) is the average of Columns (3) and (4). The total effect of policies on cases and deaths growth is responded from the average when causal paths are considered and not. The coefficient in Column (6) is the difference between Columns (3) and (4), reflecting the difference between the two estimated results.
The results for Columns (1) and (4) of Table 5 have been analyzed previously, and the results for the remaining columns are explained as follows. First, we studied the indirect effect of policies and information on health outcomes. By changing human mobility behavior, the policies of school closing, stay-at-home requirements, testing, restrictions on gatherings, and close public transport reduced the growth rate of new cases by 3.5%, 2.8%, 2.8%, 2.5%, and 1.8%, respectively. The policies of testing, school closing, restrictions on gatherings, stay-at-home requirements, international travel controls, and public transportation closing reduced the growth rate of new deaths by 3.7%, 3.6%, 2.9%, 2.9%, 2.9%, and 1.7%, respectively. A 1% increase in the growth rate of new cases increases the growth rate of future new cases by 0.01%. A 1% increase in new cases decreases the growth rate of new cases by 0.006% after 14 days. A 1% increase in new deaths decreases the growth rate of new deaths by 0.005% after 21 days.
Second, we depicted the total effect of policies and information on cases and deaths growth rate when considering the causal pathway. The policies of international travel controls, school closing, testing, vaccination, facial coverings, public events cancellation, and contact tracing reduce future growth rates of new cases by 27.4%, 26.8%, 26.3%, 16.3%, 10.2%, 8.9%, and 7.7%, respectively. The policies of international travel controls, school closing, vaccination, and facial coverings reduce the growth rate of future new deaths by 36.5%, 21%, 15%, and 9.5%, respectively. However, the closure of public transport policy increases the growth rate of future new cases by 3.6%. There was a significantly positive coefficient on the lagged growth rate of new cases and deaths, indicating that a 1% increase in the growth rate of new cases increases the growth rate of confirmed cases by 0.057% 14 days later. A 1% increase in the growth rate of new deaths would result in a 0.05% increase in the growth rate of deaths 21 days later. The coefficients of “logdc” and “logdd” are significantly negative. A 1% increase in new cases reduces the growth rate of new cases by 0.034% after 14 days. A 1% increase in current new deaths reduces the growth rate of new deaths by 0.026% after 21 days.
Then, we demonstrated the total effect of policies on cases and deaths growth in terms of means considering causal pathways and not (Column (5) of Table 5). The policies of international travel controls, school closing, testing, vaccination, facial coverings, public events cancellation, and contact tracing reduce future growth rates of new cases by 27.3%, 26.8%, 26.2%, 16.7%, 10.8%, 8.7%, and 7.7%, respectively. The policies of international travel controls, school closing, vaccination, and facial coverings reduce the growth rate of future new deaths by 36.3%, 21.4%, 15.3%, and 10.3%, respectively. A 1% increase in the growth rate of new cases would increase the growth rate of future new cases by 0.057%. A 1% increase in the growth rate of new deaths would increase the growth rate of future new deaths by 0.051%. If the number of new cases increases by 1%, the growth rate of new cases decreases by 0.034% after 14 days. A 1% increase in current new deaths is associated with a 0.026% decrease in the growth rate of new deaths after 21 days.
Finally, the reasonableness of the structural equation model setting can be judged based on the difference in Column (6) of Table 5. The results show that the differences between the coefficients of the governmental epidemic prevention policies are small, except for the difference between the two estimated results of facial coverings policy, which indicates that the causal paths we explored are reasonable.
5. Sensitivity Analysis
To ensure the robustness of the model estimation results, we performed sensitivity analysis. First, we excluded special samples. Second, we changed other variables considering the lack of appropriate substitution for the explanatory variables, behaviors, and policies. Finally, we replaced the time lag between infection and new cases or deaths.
5.1. Excluding Special Samples and Changing Variables
Based on the baseline model, we made the following estimations by excluding special samples and replacing variables that may affect the results, respectively.
- (1)
- Baseline model.
- (2)
- Exclude the United States from the sample because it was the developed country with the highest cumulative number of confirmed cases.
- (3)
- Exclude India from the sample because it was the developing country with the highest cumulative number of confirmed cases.
- (4)
- Add the democracy index to the regression variables.
- (5)
- Add the human freedom index to the regression variables.
- (6)
- Include all additional controls in (2)–(5).
- (7)
- Use the lagged terms of human behavioral variables as informative variables.
Figure 4 shows the estimated coefficients and 90% confidence intervals of policies for cases and deaths growth in the seven scenarios described above. As shown in Figure 4, the estimation results of policies are robust after excluding special samples and changing variables. This finding provides evidence for the correct setting of the baseline model.
5.2. Changing Time Lag
As an alternative to sensitivity analysis, we changed the time lag, assuming that the time lag between infection and new cases is 7 days. Assume that the time lag between infection and new deaths is 24 days. We re-estimated the above model with the new time lags. Figure 5 presents the estimated coefficients and 90% confidence intervals for each policy variable in the seven cases mentioned above.
The results show that the policies of public events cancellation, public transport closing, testing, and contact tracing are susceptible to time lags, suggesting that these policies have longer time lags in causing changes in the growth rate of new cases in the future. The effect of the public events cancellation policy on the growth rate of new deaths became significant after the time lag was changed, indicating that the policy has a slower effect on the growth rate of new deaths in the future.
6. Counterfactual Policy Analysis
Through the previous quantitative analysis, this paper validates the intricate relationships among policies, behaviors, information, and cases and deaths growth. However, we also want to know what the cases and deaths are when the government does not adopt certain policies. Based on the mean of the two estimates considering causal pathways and not (Column (5) of Table 5), this chapter conducts a counterfactual policy analysis.
6.1. Mandating Facial Coverings
Under other things held constant, we assumed that the governments of 121 countries implemented the mandating facial coverings policy from 7 March 2020 and simulated the impacts of the policy on cases and deaths (see Figure 6). When all other policies are held constant, the impact of mandating facial coverings policy is greater for new cases than for deaths. The point estimate suggests that the counterfactual policy would lead to about 18% and 14% reduction in cumulative confirmed cases and deaths, respectively, in 121 countries by early March 2021, with 90% confidence intervals of [9%, 28%] and [2%, 18%]. This corresponds to saving between 50,000 and 446,000 lives.
6.2. Mandating Vaccination Policy
We simulated the impact of this counterfactual policy on cases and deaths, assuming that all 121 governments implement a vaccination policy as of 7 March 2020, with all other things held constant. Figure 7 shows the counterfactual results of the vaccination policies on anti-epidemic outcomes. The results suggest that the counterfactual policy would lead to a 93% and 62% reduction in cumulative confirmed cases and deaths, respectively, in 121 countries by early March 2021, with 90% confidence intervals of [81%, 99%] and [22%, 82%]. This corresponds to saving between 550,000 and 2.03 million lives.
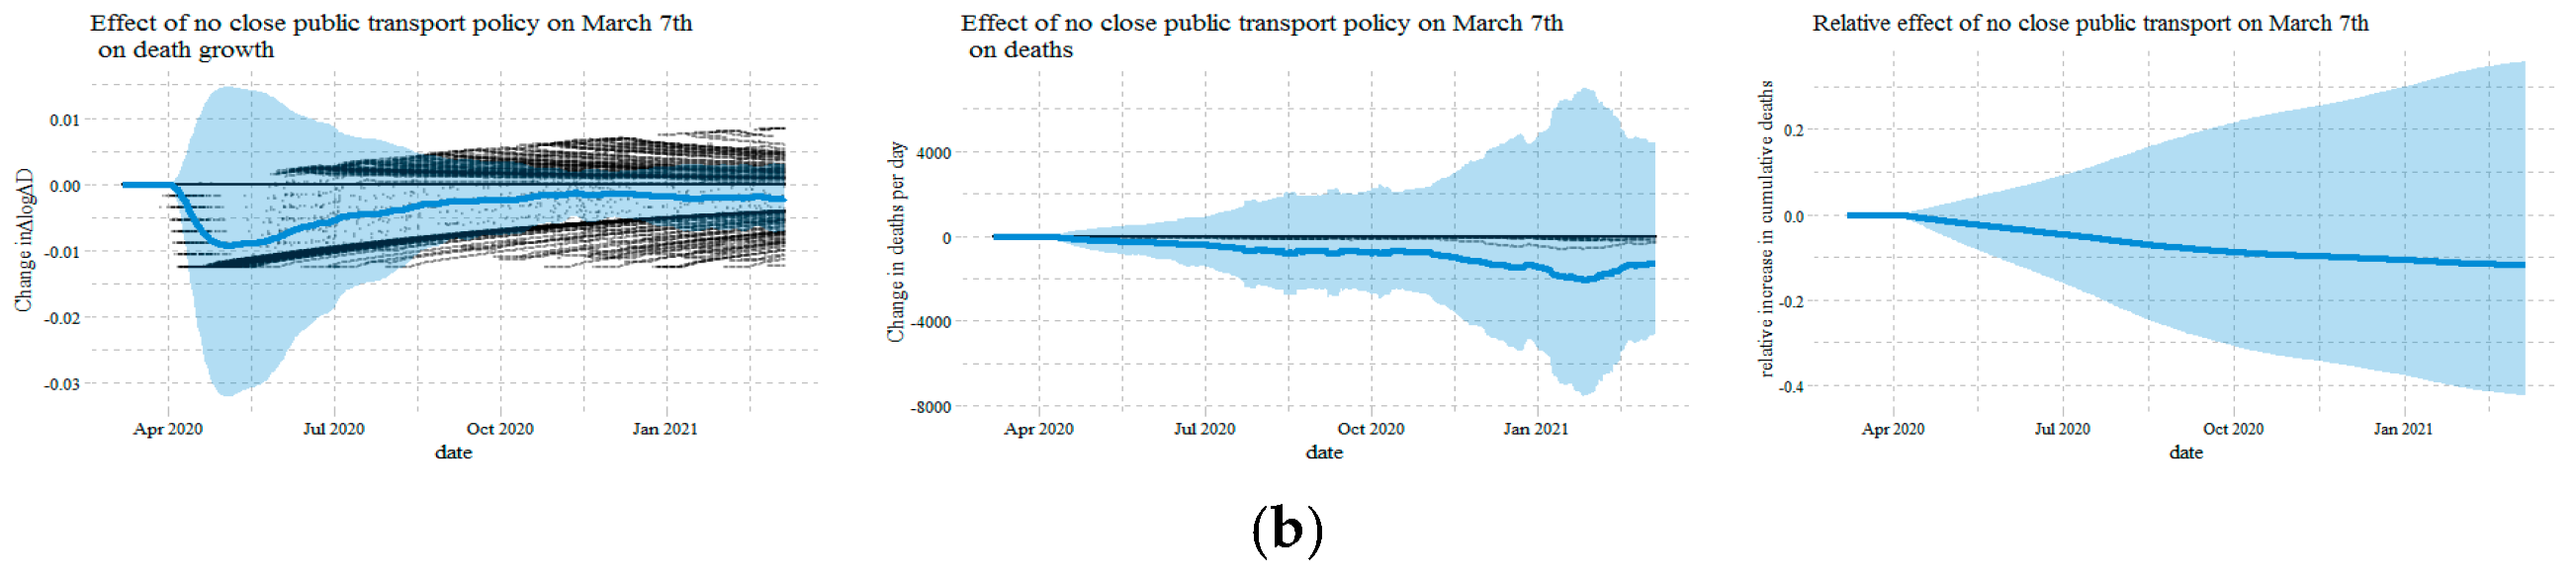
6.3. No Close Public Transport Policy
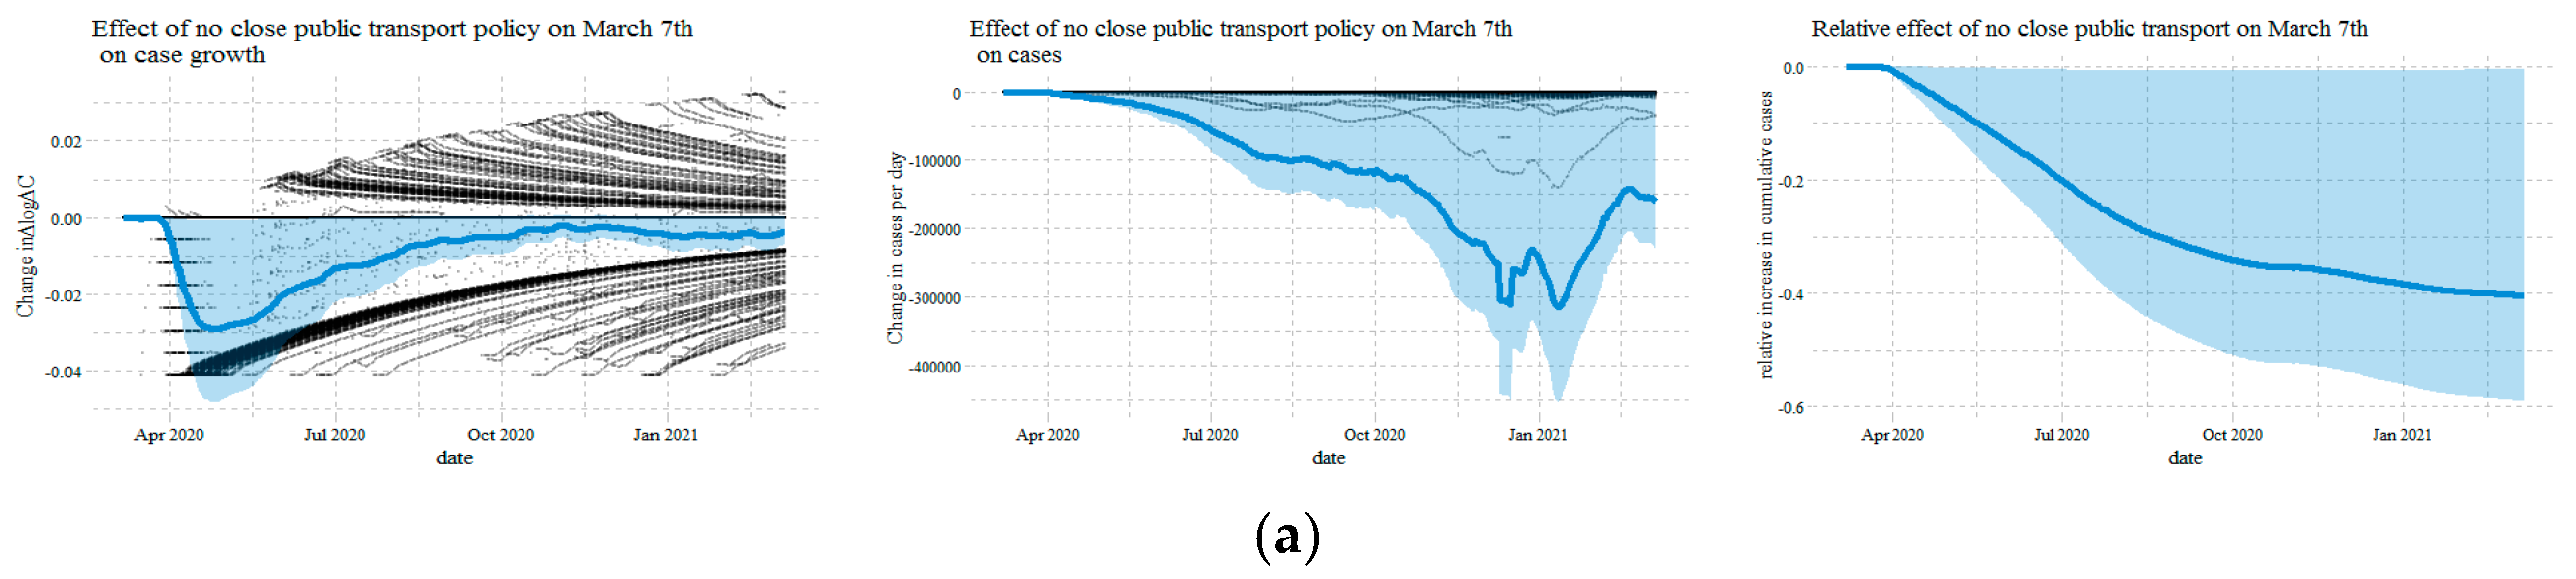
Figure 8 shows the dynamic impact of not implementing closing public transportation on cases and deaths from 7 March 2020. The results suggest that the counterfactual policy would lead to a 40% and 10% reduction in cumulative confirmed cases and deaths, respectively, in 121 countries by early March 2021.
7. Discussion
In this study, by constructing a theoretical framework and conducting empirical analysis, we conclude that government epidemic prevention policies not only directly affect health outcomes but also indirectly affect health outcomes by affecting human mobility behaviors. Compared with the existing literature, the government epidemic prevention policies considered in this paper is more comprehensive.
From the results of the empirical analysis, this paper finds that the facial coverings policy significantly increases people going to workplaces, retail stores, transit stations, and grocery stores. The results demonstrate that the facial coverings policy creates a false sense of security, increases mobility, and reduces social distance. Contrary to the findings of Seres et al. [42], who conducted a randomized field trial in Berlin, Germany, and found that wearing masks increase social distance.
When comparing our results to those of existing literature [10], it must be pointed out that we have a new conclusion. The coefficient of the growth rate of testing on the growth rate of new confirmed cases is significantly positive. This finding implies the possibility of underestimation of new cases in some countries where testing is small. Consistent with the previous studies [39,40], this paper confirms that vaccination policies reduce COVID-19 cases and deaths.
This paper has important guiding significance for the adjustment of government epidemic prevention policies in various countries. However, due to data limitations, we cannot quantify the economic impact of the government’s quarantine policies.
More broadly, our causal framework quantitatively analyzes the impact of factors such as government interventions, human mobility behaviors, and information on cases and deaths in the COVID-19. However, the impact of these factors on economic resilience, supply chains, and exports is unclear. This is also a direction for further research.
8. Conclusions and Policy Implications
8.1. Conclusions
Based on data from 121 countries, this paper combines dynamic panel structural equations, SIRDS epidemic models, machine learning, and econometric models to assess the effects of government epidemic prevention policies, human mobility behaviors, information variables, and confounding factors on anti-epidemic outcomes and to explore the causal pathways among these variables.
First, based on relevant literature, the paper proposed a causal pathway diagram of the effects between government epidemic prevention policies, human mobility behaviors, information, confounding factors, and anti-epidemic outcomes. Second, we obtained the SIRDS epidemic model by revising the SIRD epidemic model. Again, after combining the causal path diagram and the SIRDS model, we attained the model settings for different anti-epidemic outcomes. Then, based on the model settings, the paper attained the empirical results of the causal paths among these variables and conducted sensitivity analysis and counterfactual tests from different perspectives. Finally, we obtained the following conclusions.
First, there are differences in the impact of government epidemic prevention policies on human mobility behaviors. The policies of school closing, public transport closing, and stay-at-home requirements reduced human mobility in workplaces, retail, transit, and grocery. The international travel controls policy only reduced human mobility in transit. The policies of public events cancellation and vaccination have not affected human mobility in workplaces, retail, transit, and grocery. However, the facial coverings policy increased human mobility in workplaces, retail, transit, and grocery. It means wearing masks makes people feel a false sense of security.
Second, the information released by new cases and deaths affects human mobility behaviors. The increase in new cases and deaths reduced human mobility in workplaces and retail. These suggest that people received new information and voluntarily adjusted their behavior to reduce non-essential outings. In addition, information affected not only human mobility behavior but also had direct and indirect effects on anti-epidemic outcomes. The current growth rates of new cases and deaths are characterized by positive feedback in the future. On the contrary, new cases and deaths reduced future growth rates of new cases and deaths, respectively.
Third, human mobility behaviors had a direct effect on anti-epidemic outcomes. Lower human mobility in workplaces decreased the growth rate of new cases in the future. Lower human mobility in workplaces and transit also reduced the growth rate of future new deaths. However, reduced human mobility to grocery increased the growth rate of future new cases and deaths.
Forth, the direct effect of government epidemic prevention policies on anti-epidemic outcomes varies greatly. The policies of international travel controls, testing, school closing, vaccination, facial coverings, public events cancellation, and contact tracing reduced the growth rate of new cases in the future by 25.3% and 23.5%, 23.3%, 15.8%, 13.3%, 9.3%, and 8.2%, respectively. The policies of international travel controls, school closing, vaccination, facial coverings, and public events cancellation decreased the growth rate of new deaths in the future by 33.6%, 17.4%, 14.4%, 12.6%, and 7.9%, respectively. The testing and contact tracing policies have not directly affected the growth rate of new deaths in the future. The policies of restrictions on gatherings and stay-at-home requirements have not directly affected future anti-epidemic outcomes. However, the direct effect of the public transport closing policy on anti-epidemic outcomes increased the growth rate of new cases and deaths in the future by 5.4% and 3.8%, respectively.
Fifth, government epidemic prevention policies also indirectly affected anti-epidemic outcomes. By changing the human mobility behavior, the policies of school closing, stay at home requirements, testing, restrictions on gatherings, and public transport closing reduced the growth rate of new cases in the future by 3.5%, 2.8%, 2.8%, 2.5%, and 1.8%, respectively. The policies of testing, school closing, restrictions on gatherings, stay at home requirements, international travel controls, and public transport closing decreased the growth rate of new deaths in the future by 3.7%, 3.6%, 2.9%, 2.9%, 2.9%, and 1.7%, respectively. However, the facial coverings policy increased the growth rate of new cases and deaths by 3.2% and 3.1%, respectively. Echoing the previous conclusion, it further proved that wearing masks gave people a false sense of security and increased human mobility behaviors.
Sixth, we combined the two conditions of considering the causal path and not considering it and attained the total effect of government epidemic prevention policies on anti-epidemic outcomes. The policies of international travel controls, school closing, testing, vaccination, facial coverings, public events cancellation, and contact tracing have reduced the growth rate of new cases in the future by 27.3%, and 26.8%, 26.2%, 16.7%, 10.8%, 8.7%, and 7.7%, respectively. The policies of international travel controls, school closing, vaccination, and facial coverings have reduced the growth rate of new deaths in the future by 36.3%, 21.4%, 15.3%, and 10.3%, respectively. However, the public transport closing policy has generally increased the growth rate of new cases in the future by 3.7%.
Seventh, the increase in tests rate increased the growth rate of new cases. This shows that confirmed cases in countries with low test rates may be underestimated.
Eighth, in the counterfactual policy analysis, the implementation of mandatory masks and vaccination policies significantly reduced new cases and deaths. By the beginning of March 2021, the mandatory masks policy will save 50,000 and 446,000 lives, and the vaccination policy will save 550,000 and 2.03 million lives. Not implementing the closing public transportation policy would reduce the new cases.
8.2. Policy Implications
Based on the above conclusions, we have the following policy inspirations.
First, the government should continue to implement the international travel controls policy. Based on the empirical results, we found that this policy is the most effective in terms of anti-epidemic outcomes and significantly reduces the growth rate of new cases and deaths in the future. At present, the international situation of the COVID-19 is serious, and the liberalization of the international human movement is not conducive to controlling the epidemic.
Second, the government should conduct multiple comprehensive tests to avoid underestimation of new cases and isolation of the infected population as early as possible.
Third, the government should consider stopping the implementation of the close public transport policy. We found that although this policy reduces the growth rate of new cases and deaths by changing the movement of people, the policy directly increases the number of new cases. The growth rate of new cases and deaths have a direct impact greater than an indirect impact. Public transportation is one of the main ways for people to outing. For some outings that cannot be reduced, the close public transport policy increases the difficulty of moving people, making people have to find new ways of outing, which may cause greater infections.
Forth, the government should strengthen publicity on the role of masks in epidemic prevention. It is undeniable that the facial coverings policy has significantly reduced the growth rate of new cases and deaths, but this result is mainly due to a direct impact. The facial coverings policy makes people feel a false sense of security, improves human mobility in different situations, and makes the policy’s indirect impact on anti-epidemic outcomes positive. Therefore, the government should increase the publicity that wearing masks does not mean absolute safety.
Fifth, the government should cancel unnecessary public events or hold them online. At the moment, avoiding exposure to the virus is a better way to prevent the epidemic. Public events will gather people and increase the risk of people contracting the virus. The cancellation of public activities cut off the transmission route to a certain extent, which is conducive to the control of the epidemic.
Seventh, the government should use a combination of vaccination and non-drug interventions. According to the conclusion, not implementing the public transportation closing policy will help reduce the number of new cases in countries every day, and governments should consider reopening public transportation. Vaccines have greatly reduced the growth rate of new cases and deaths, and the anti-epidemic outcomes of international travel controls and testing are equally important. What is more, the governments should implement vaccination policies as much as possible.
Author Contributions
Conceptualization, X.G.; Data curation, X.G.; Formal analysis, X.G.; Investigation, X.G.; Methodology, X.G.; Software, X.G.; Writing—original draft, X.G.; Writing—review and editing, F.W. and D.H. All authors have read and agreed to the published version of the manuscript.
Funding
This research was funded by the Research Project of Humanities and Social Sciences of the Ministry of Education of People’s Republic of China in 2021 [grant number 21XJA790004] and the National Natural Science Foundation of China [grant number 71673217].
Institutional Review Board Statement
Not applicable.
Informed Consent Statement
Not applicable.
Data Availability Statement
Not applicable.
Conflicts of Interest
The authors declare no interest.
References
- Chen, H.; Shi, L.; Zhang, Y.; Wang, X.; Jiao, J.; Yang, M.; Sun, G. Response to the COVID-19 Pandemic: Comparison of Strategies in Six Countries. Front. Public Health 2021, 9, 708496. [Google Scholar] [CrossRef] [PubMed]
- Zhang, X.; Wang, Y. Comparison between two types of control strategies for the coronavirus disease 2019 pandemic. J. Infect. Dev. Ctries. 2020, 14, 696–698. [Google Scholar] [CrossRef] [PubMed]
- Qiu, Y.; Chen, X.; Shi, W. Impacts of social and economic factors on the transmission of coronavirus disease 2019 (COVID-19) in China. J. Popul. Econ. 2020, 33, 1127–1172. [Google Scholar] [CrossRef] [PubMed]
- Huang, Z.; Huang, J.; Gu, Q.; Du, P.; Liang, H.; Dong, Q. Optimal temperature zone for the dispersal of COVID-19. Sci. Total Environ. 2020, 736, 139487. [Google Scholar] [CrossRef]
- Chien, L.C.; Chen, L.W. Meteorological impacts on the incidence of COVID-19 in the US. Stoch. Environ. Res. Risk Assess. 2020, 34, 1675–1680. [Google Scholar] [CrossRef]
- Selcuk, M.; Gormus, S.; Guven, M. Impact of Weather Parameters and Population Density on the COVID-19 Transmission: Evidence from 81 Provinces of Turkey. Earth Syst. Environ. 2021, 5, 87–100. [Google Scholar] [CrossRef]
- Bolaño-Ortiz, T.R.; Camargo-Caicedo, Y.; Puliafito, S.E.; Ruggeri, M.F.; Bolaño-Diaz, S.; Pascual-Flores, R.; Saturno, J.; Ibarra-Espinosa, S.; Mayol-Bracero, O.L.; Torres-Delgado, E.; et al. Spread of SARS-CoV-2 through Latin America and the Caribbean region: A look from its economic conditions, climate and air pollution indicators. Environ. Res. 2020, 191, 109938. [Google Scholar] [CrossRef]
- Bretschger, L.; Grieg, E.; Welfens, P.J.J.; Xiong, T. COVID-19 infections and fatalities developments: Empirical evidence for OECD countries and newly industrialized economies. Int. Econ. Econ. Policy 2020, 17, 801–847. [Google Scholar] [CrossRef]
- Kozlovskyi, S.; Bilenko, D.; Dluhopolskyi, O.; Vitvitskyi, S.; Bondarenko, O.; Korniichuk, O. Determinants of COVID-19 Death Rate in Europe: Empirical Analysis. Probl. Ekorozw. 2021, 16, 17–28. [Google Scholar] [CrossRef]
- Chennakesavulu, K.; Reddy, G.R. The effect of latitude and PM2. 5 on spreading of SARS-CoV-2 in tropical and temperate zone countries. Environ. Pollut. 2020, 266, 115176. [Google Scholar] [CrossRef]
- Vera-Valdés, J.E. The political risk factors of COVID-19. Int. Rev. Appl. Econ. 2021, 35, 269–287. [Google Scholar] [CrossRef]
- Baniamin, H.M.; Rahman, M.; Hasan, M.T. The COVID-19 pandemic: Why are some countries coping more successfully than others? Asia Pac. J. Public Adm. 2020, 42, 153–169. [Google Scholar] [CrossRef]
- David, A.C.; Pienknagura, S. On the effectiveness of containment measures in controlling the COVID-19 pandemic: The role of labour market characteristics and governance. Appl. Econ. Lett. 2021, 28, 1641–1647. [Google Scholar] [CrossRef]
- Chernozhukov, V.; Kasahara, H.; Schrimpf, P. Causal impact of masks, policies, behavior on early COVID-19 pandemic in the U.S. J. Econ. 2021, 220, 23–62. [Google Scholar] [CrossRef]
- Perone, G. The determinants of COVID-19 case fatality rate (CFR) in the Italian regions and provinces: An analysis of environmental, demographic, and healthcare factors. Sci. Total Environ. 2021, 755, 142523. [Google Scholar] [CrossRef]
- Moosa, I.A.; Khatatbeh, I.N. Robust and fragile determinants of the infection and case fatality rates of Covid-19: International cross-sectional evidence. Appl. Econ. 2021, 53, 1225–1234. [Google Scholar] [CrossRef]
- Ecks, S. Multimorbidity, Polyiatrogenesis, and COVID-19. Med. Anthropol. Q. 2020, 34, 488–503. [Google Scholar] [CrossRef]
- Fang, H.; Wang, L.; Yang, Y. Human mobility restrictions and the spread of the novel coronavirus (2019-nCoV) in China. J. Popul. Econ. 2020, 191, 104272. [Google Scholar] [CrossRef]
- Coker, E.S.; Cavalli, L.; Fabrizi, E.; Guastella, G.; Lippo, E.; Parisi, M.L.; Pontarollo, N.; Rizzati, M.; Varacca, A.; Vergalli, S. The effects of air pollution on COVID-19 related mortality in northern Italy. Environ. Resour. Econ. 2020, 76, 611–634. [Google Scholar] [CrossRef]
- Ang, J.P.; Dong, F.; Patalinghug, J. COVID-19: Effectiveness of socioeconomic factors in containing the spread and mortality. Int. Rev. Appl. Econ. 2021, 35, 164–187. [Google Scholar] [CrossRef]
- Łuczak, A.; Kalinowski, S. Fuzzy Clustering Methods to Identify the Epidemiological Situation and Its Changes in European Countries during COVID-19. Entropy 2021, 24, 14. [Google Scholar] [CrossRef] [PubMed]
- Dudek, M.; Śpiewak, R. Effects of the COVID-19 Pandemic on Sustainable Food Systems: Lessons Learned for Public Policies? The Case of Poland. Agriculture 2022, 12, 61. [Google Scholar] [CrossRef]
- Kalinowski, S.; Łuczak, A.; Koziolek, A. The Social Dimension of Security: The Dichotomy of Respondents’ Perceptions during the COVID-19 Pandemic. Sustainability 2022, 14, 1363. [Google Scholar] [CrossRef]
- Churski, P.; Kroczak, H.; Łuczak, M.; Shelest-Szumilas, O.; Woźniak, M. Adaptation Strategies of Migrant Workers from Ukraine during the COVID-19 Pandemic. Sustainability 2021, 13, 8337. [Google Scholar] [CrossRef]
- Robinson, J.M.; Mzali, L.; Knudsen, D.; Farmer, J.; Spiewak, R.; Suttles, S.; Burris, M.; Shattuck, A.; Valliant, J.; Babb, A. Food after the COVID-19 Pandemic and the Case for Change Posed by Alternative Food: A Case Study of the American Midwest. Glob. Sustain. 2021, 4, e6. [Google Scholar] [CrossRef]
- Lai, S.; Ruktanonchai, N.W.; Zhou, L.; Prosper, O.; Luo, W.; Floyd, J.R.; Wesolowski, A.; Santillana, M.; Zhang, C.; Du, X.; et al. Effect of non-pharmaceutical interventions to contain COVID-19 in China. Nature 2020, 585, 410–413. [Google Scholar] [CrossRef]
- Awaidy, S.A.; Mahomed, O. Impact of non-pharmaceutical interventions on the COVID-19 epidemic: A modelling study. SAGE Open Med. 2020, 8, 2050312120979462. [Google Scholar] [CrossRef]
- Chen, X.; Qiu, Z. Scenario analysis of non-pharmaceutical interventions on global COVID-19 transmissions. arXiv 2004, arXiv:2004.04529. [Google Scholar] [CrossRef]
- Lemaitre, J.C.; Perez-Saez, J.; Azman, A.S.; Rinaldo, A.; Fellay, J. Assessing the impact of non-pharmaceutical interventions on SARS-CoV-2 transmission in Switzerland. Swiss Med. Wkly. 2020, 150, w20295. [Google Scholar] [CrossRef]
- Amuedo-Dorantes, C.; Borra, C.; Rivera-Garrido, N.; Sevilla, A. Early adoption of non-pharmaceutical interventions and COVID-19 mortality. Econ. Hum. Biol. 2021, 42. [Google Scholar] [CrossRef]
- Banholzer, N.; Van Weenen, E.; Lison, A.; Cenedese, A.; Seeliger, A.; Kratzwald, B.; Tschernutter, D.; Puig Salles, J.; Bottrighi, P.; Lehtinen, S.; et al. Estimating the effects of non-pharmaceutical interventions on the number of new infections with COVID-19 during the first epidemic wave. PLoS ONE 2021, 16, e0252827. [Google Scholar] [CrossRef] [PubMed]
- Jayaweera, M.; Dannangoda, C.; Dilshan, D.; Dissanayake, J.; Perera, H.; Manatunge, J.; Gunawardana, B. Grappling with COVID-19 by imposing and lifting non-pharmaceutical interventions in Sri Lanka: A modeling perspective. Infect. Dis. Model. 2021, 6, 820–831. [Google Scholar] [CrossRef] [PubMed]
- Amuedo-Dorantes, C.; Kaushal, N.; Muchow, A.N. Timing of social distancing policies and COVID-19 mortality: County-level evidence from the US. J. Popul. Econ. 2021, 34, 1445–1472. [Google Scholar] [CrossRef] [PubMed]
- Fritz, C.; Kauermann, G. On the interplay of regional mobility, social connectedness and the spread of COVID-19 in Germany. J. R. Stat. Soc. Ser. A Stat. Soc. 2021, 185, 400–424. [Google Scholar] [CrossRef]
- Zheng, Z.; Xie, Z.; Qin, Y.; Wang, K.; Yu, Y.; Fu, P. Exploring the influence of human mobility factors and spread prediction on early COVID-19 in the USA. BMC Public Health 2021, 21, 615. [Google Scholar] [CrossRef]
- Mamelund, S.E.; Dimka, J.; Bakkeli, N.Z. Social Disparities in Adopting Non-pharmaceutical Interventions During COVID-19 in Norway. J. Dev. Soc. 2021, 37, 302–328. [Google Scholar] [CrossRef]
- Turoń, K.; Kubik, A.; Chen, F. Electric Shared Mobility Services during the Pandemic: Modeling Aspects of Transportation. Energies 2021, 14, 2622. [Google Scholar] [CrossRef]
- Turoń, K.; Kubik, A. Business Innovations in the New Mobility Market during the COVID-19 with the Possibility of Open Business Model Innovation. J. Open Innov. Technol. Mark. Complex. 2021, 7, 195. [Google Scholar] [CrossRef]
- Marín-Hernández, D.; Nixon, D.F.; Hupert, N. Anticipated reduction in COVID-19 mortality due to population-wide BCG vaccination: Evidence from Germany. Hum. Vaccines Immunother. 2021, 17, 2451–2453. [Google Scholar] [CrossRef]
- Giordano, G.; Colaneri, M.; di Filippo, A.; Blanchini, F.; Bolzern, P.; de Nicolao, G.; Sacchi, P.; Colaneri, P.; Bruno, R. Modeling vaccination rollouts, SARS-CoV-2 variants and the requirement for non-pharmaceutical interventions in Italy. Nat. Med. 2021, 27, 993–998. [Google Scholar] [CrossRef]
- Linton, N.M.; Kobayashi, T.; Yang, Y.; Hayashi, K.; Akhmetzhanov, A.R.; Jung, S.; Yuan, B.; Kinoshita, R.; Nishiura, H. Incubation period and other epidemiological characteristics of 2019 novel coronavirus infections with right truncation: A statistical analysis of publicly available case data. J. Clin. Med. 2020, 9, 538. [Google Scholar] [CrossRef] [Green Version]
- Seres, G.; Balleyer, A.; Cerutti, N.; Friedrichsen, J.; Süer, M. Face Mask Use and Physical Distancing Before and After Mandatory Masking: Evidence from Public Waiting Lines; WZB Discussion Paper; Wissenschaftszentrum Berlin für Sozialforschung (WZB): Berlin, Germany, 2020; Available online: https://www.econstor.eu/handle/10419/222483 (accessed on 2 March 2022).
Figure 1.
Causal path diagram. Note: c refers to country, t refers to time, l indicates time lag.
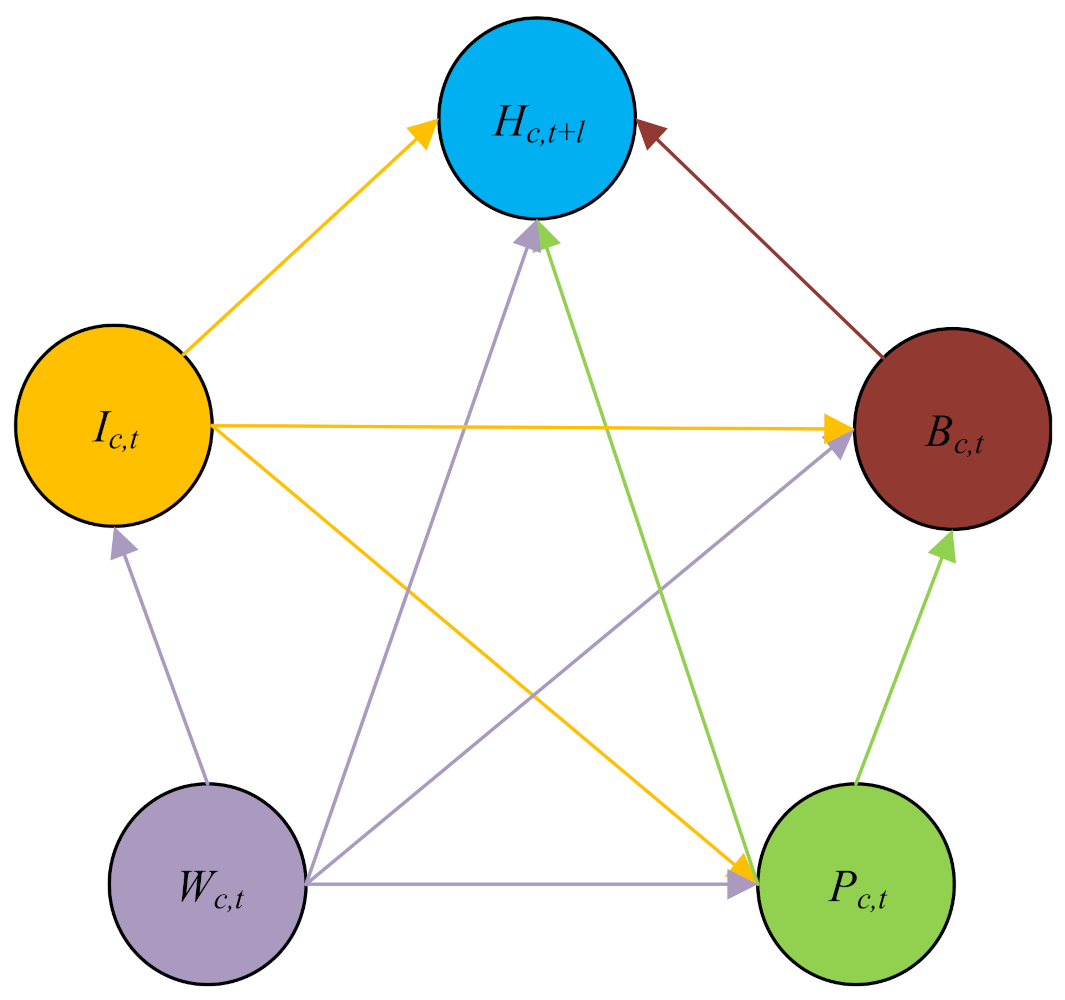
Figure 2.
SIRDS epidemic model.
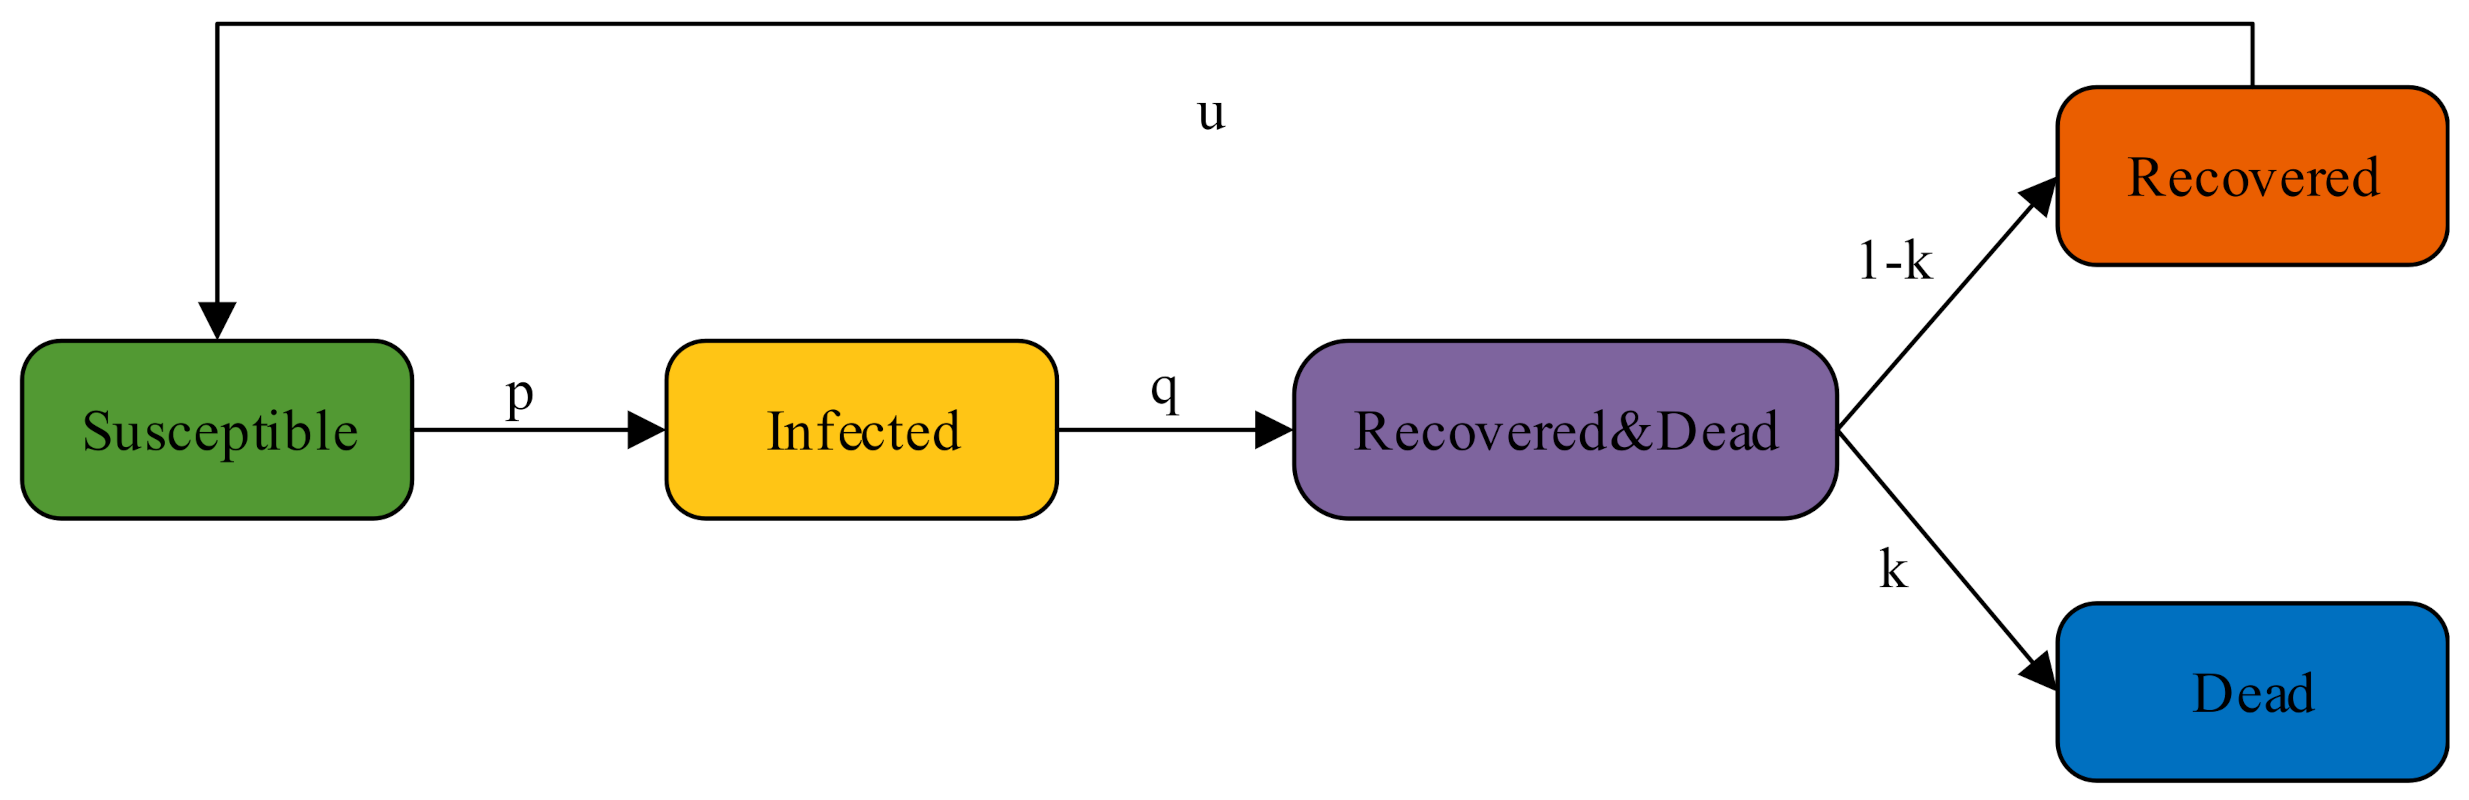
Figure 3.
Causal path diagram under the counterfactual policy.

Figure 4.
Estimated coefficients of policies under different model settings: (a) school closing; (b) cancel public events; (c) restrictions on gatherings; (d) close public transport; (e) stay at home requirement; (f) international travel controls; (g) testing; (h) contact tracing; (i) facial coverings; (j) vaccination. Note: “Red” and “blue” represent regression models in which the explanatory variables are the rate of growth of confirmed cases and the rate of growth of deaths, respectively. The “dots” represent the estimated coefficients and the “lines” represent the 90% confidence intervals. Same as in Figure 5.
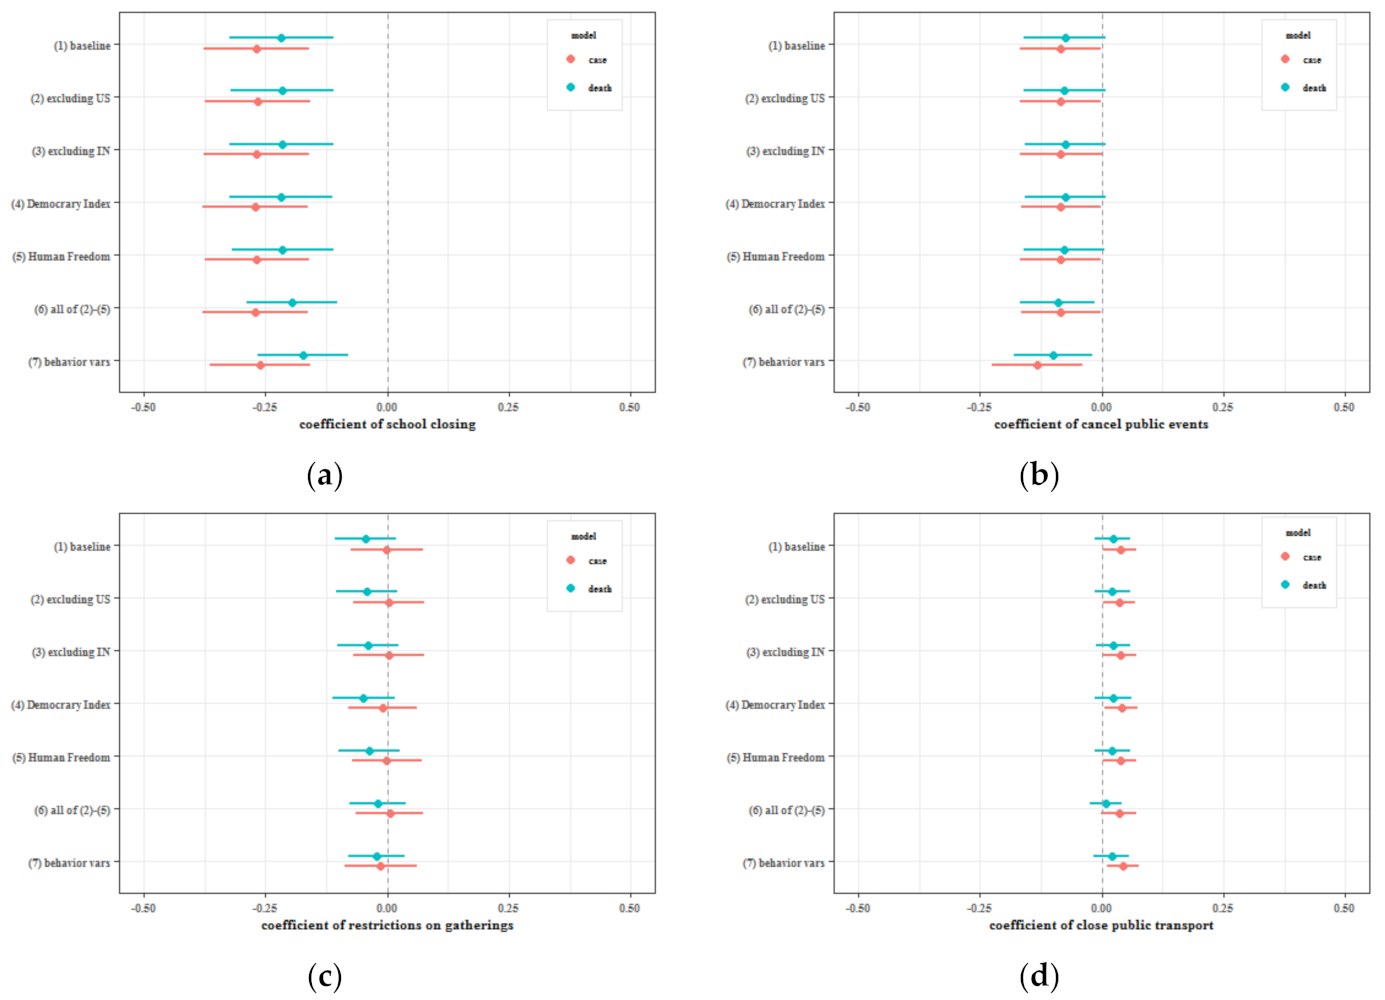
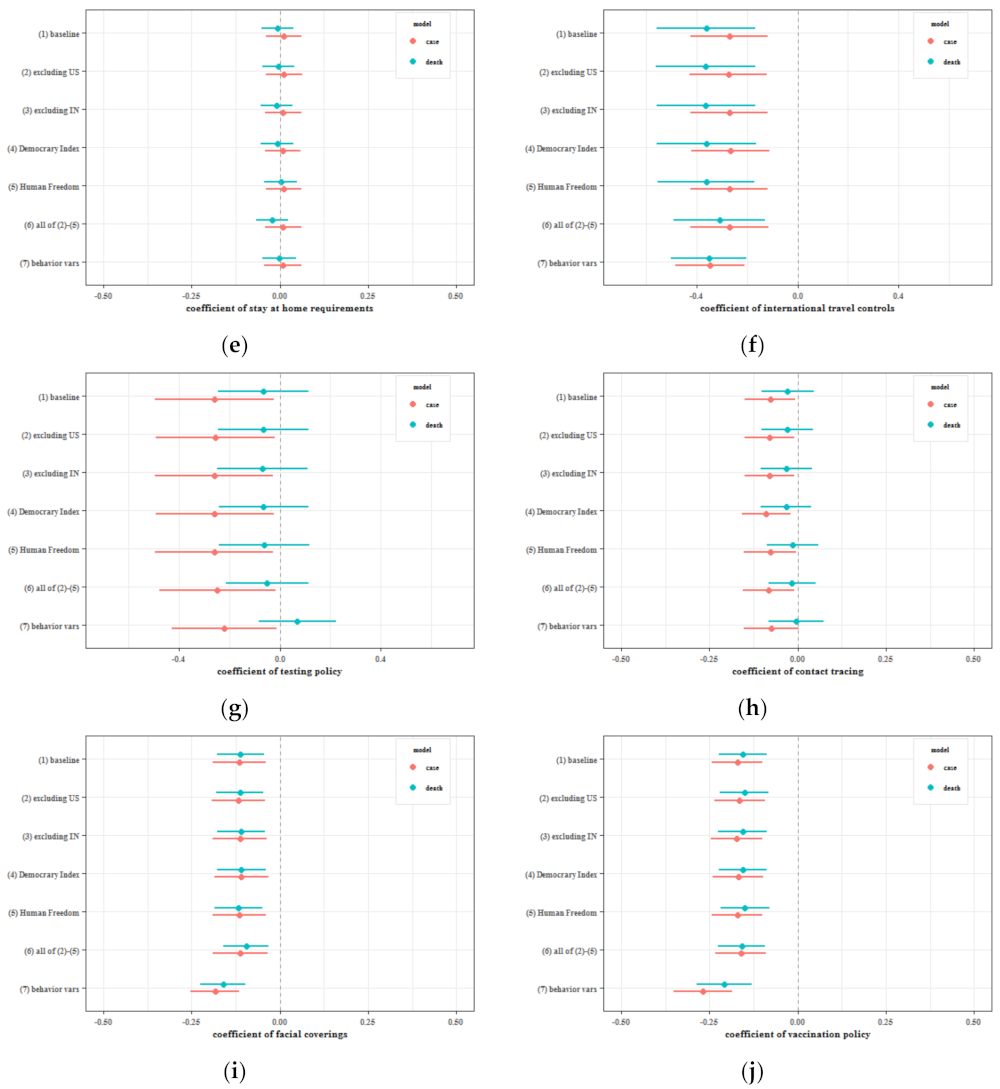
Figure 5.
Estimated coefficients of policy variables under different model settings after changing the time lag: (a) school closing; (b) cancel public events; (c) restrictions on gatherings; (d) close public transport; (e) stay at home requirement; (f) international travel controls; (g) testing; (h) contact tracing; (i) facial coverings; (j) vaccination.
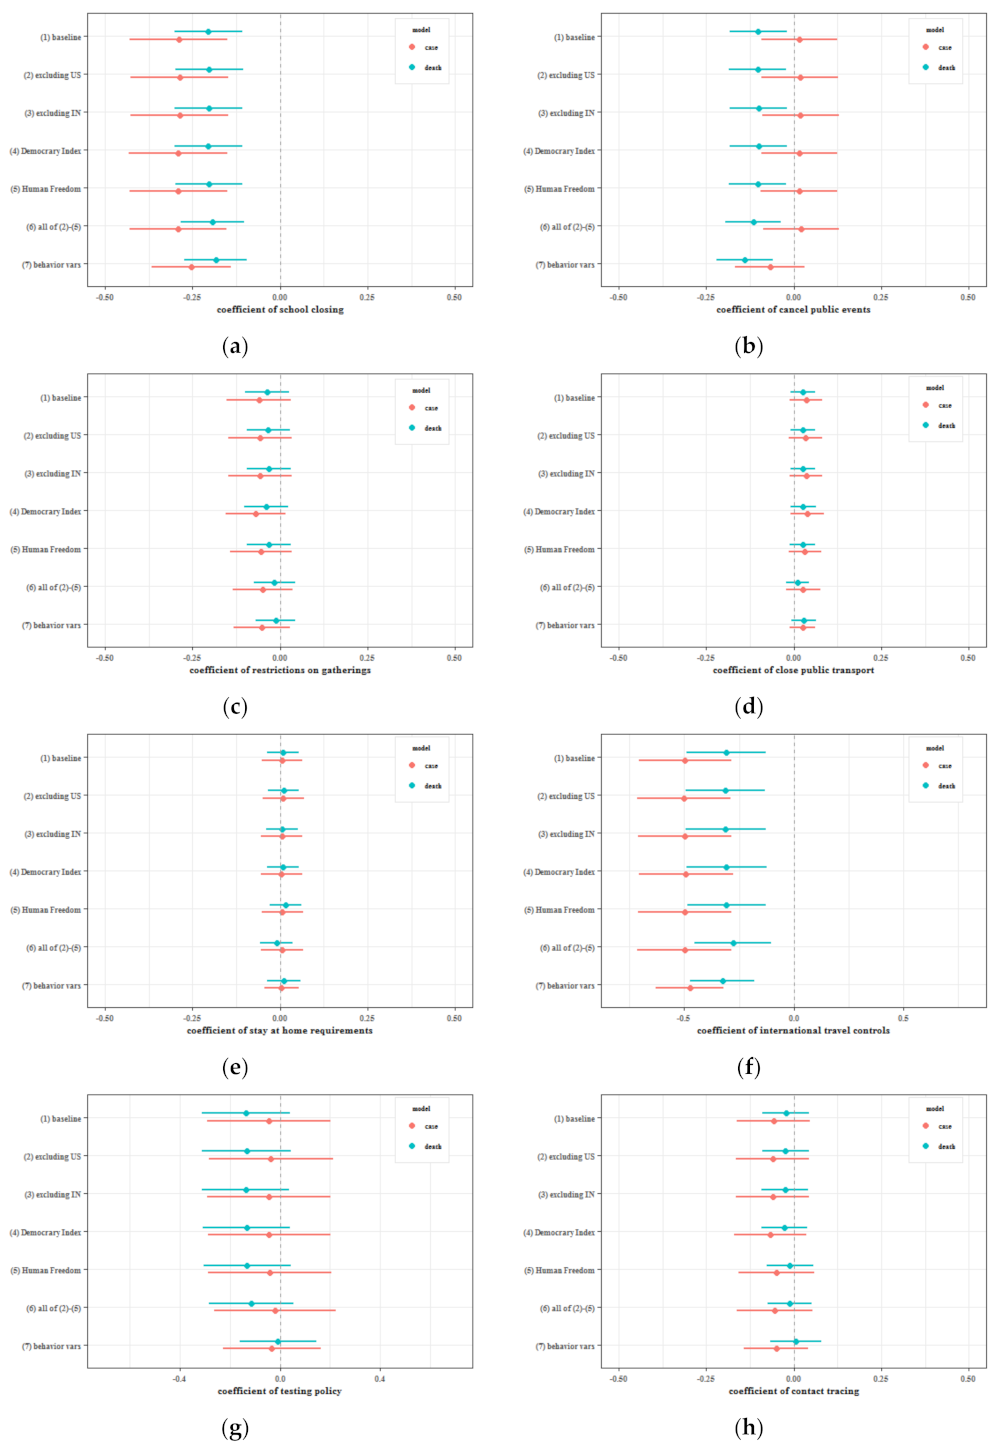
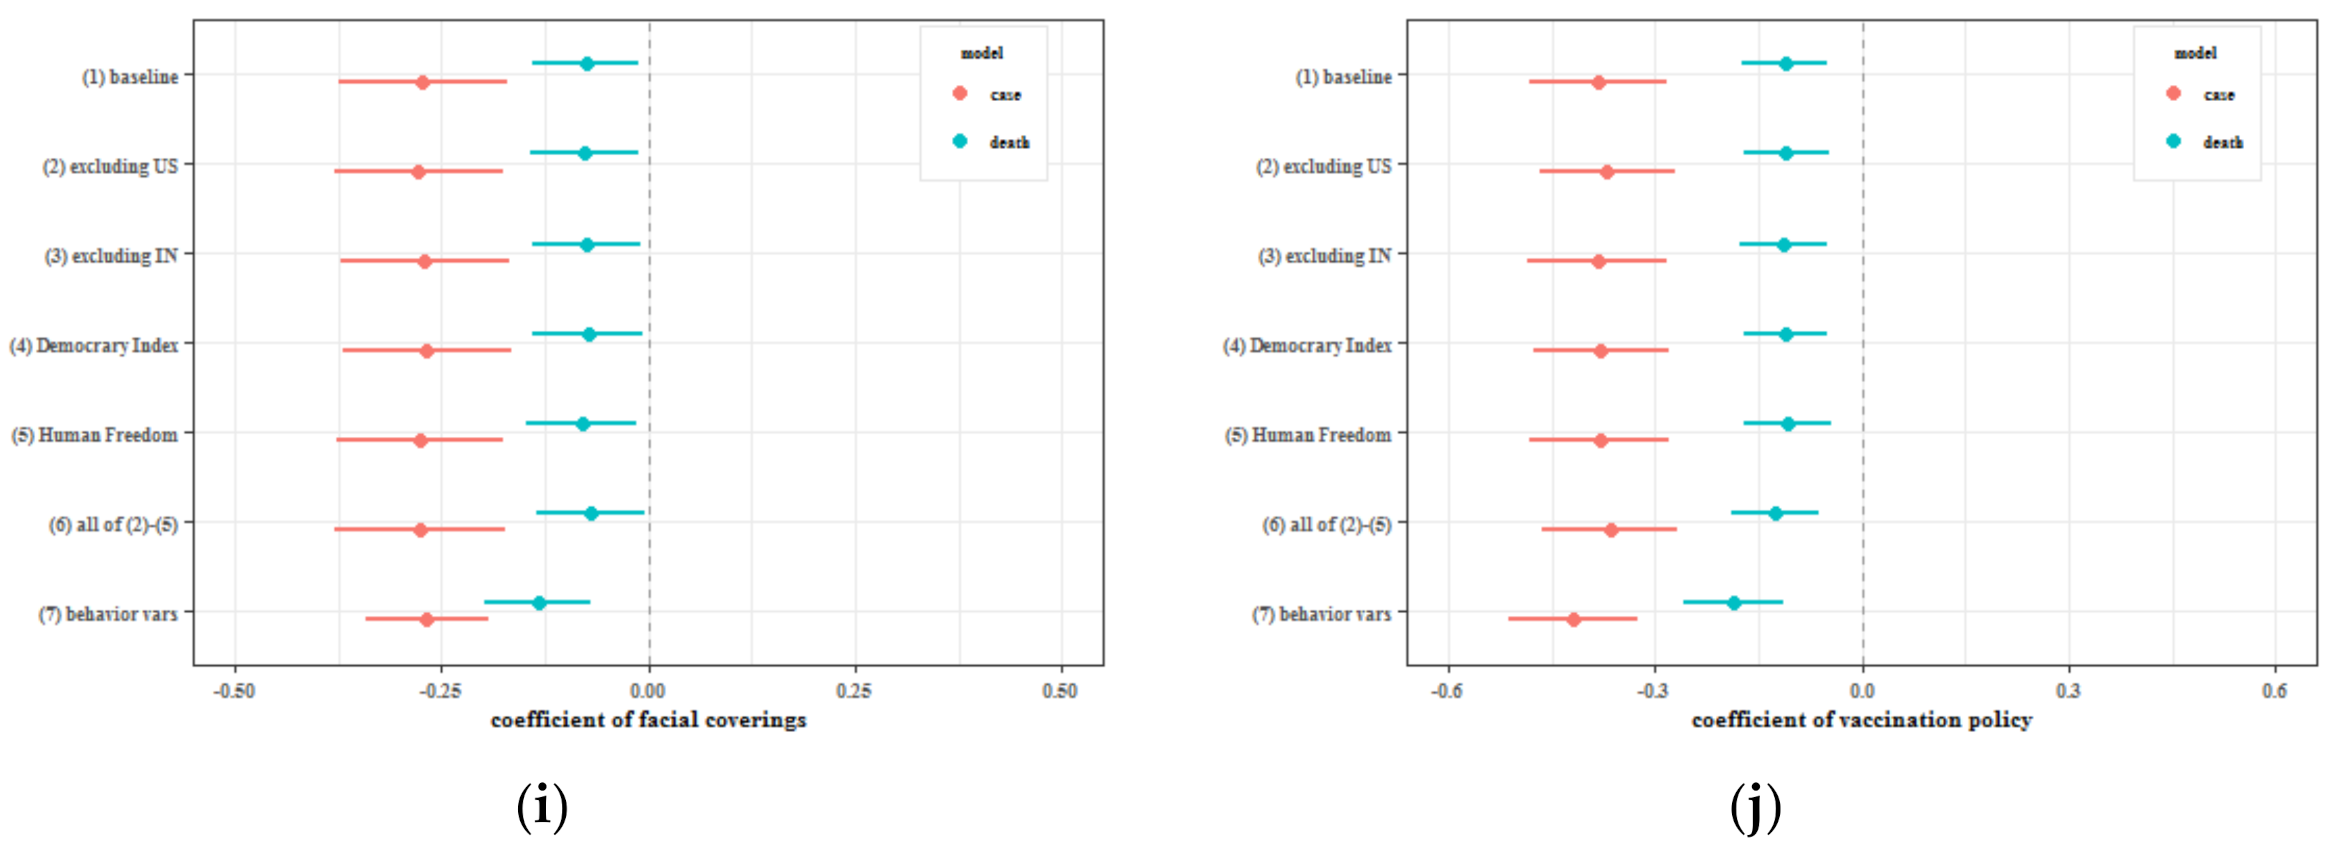
Figure 6.
Effect of mandating facial coverings on 7 March among 121 countries: (a) Cases; (b) Deaths. Note: The counterfactual estimates are smooth generalized functions of the potential parameter estimates, and we construct healthy outcomes and confidence intervals for the counterfactual policy by the bootstrap method. In the left column, the black dots represent the change in the growth rate of new cases (deaths) by country. The blue line refers to the average of the change in the growth rate of new cases (deaths) by country. In the middle column, the black dots represent the daily change in new cases (deaths) by country. The blue line refers to the total change in the number of new cases (deaths) per day for each country. In the right column, the blue line refers to the change in cumulative confirmed (dead) cases. The shaded areas are the 90% confidence intervals of the corresponding points of the blue line, respectively. Same as in Figure 7 and Figure 8.

Figure 7.
Effect of vaccination policies on 7 March among 121 countries: (a) Cases; (b) Deaths.
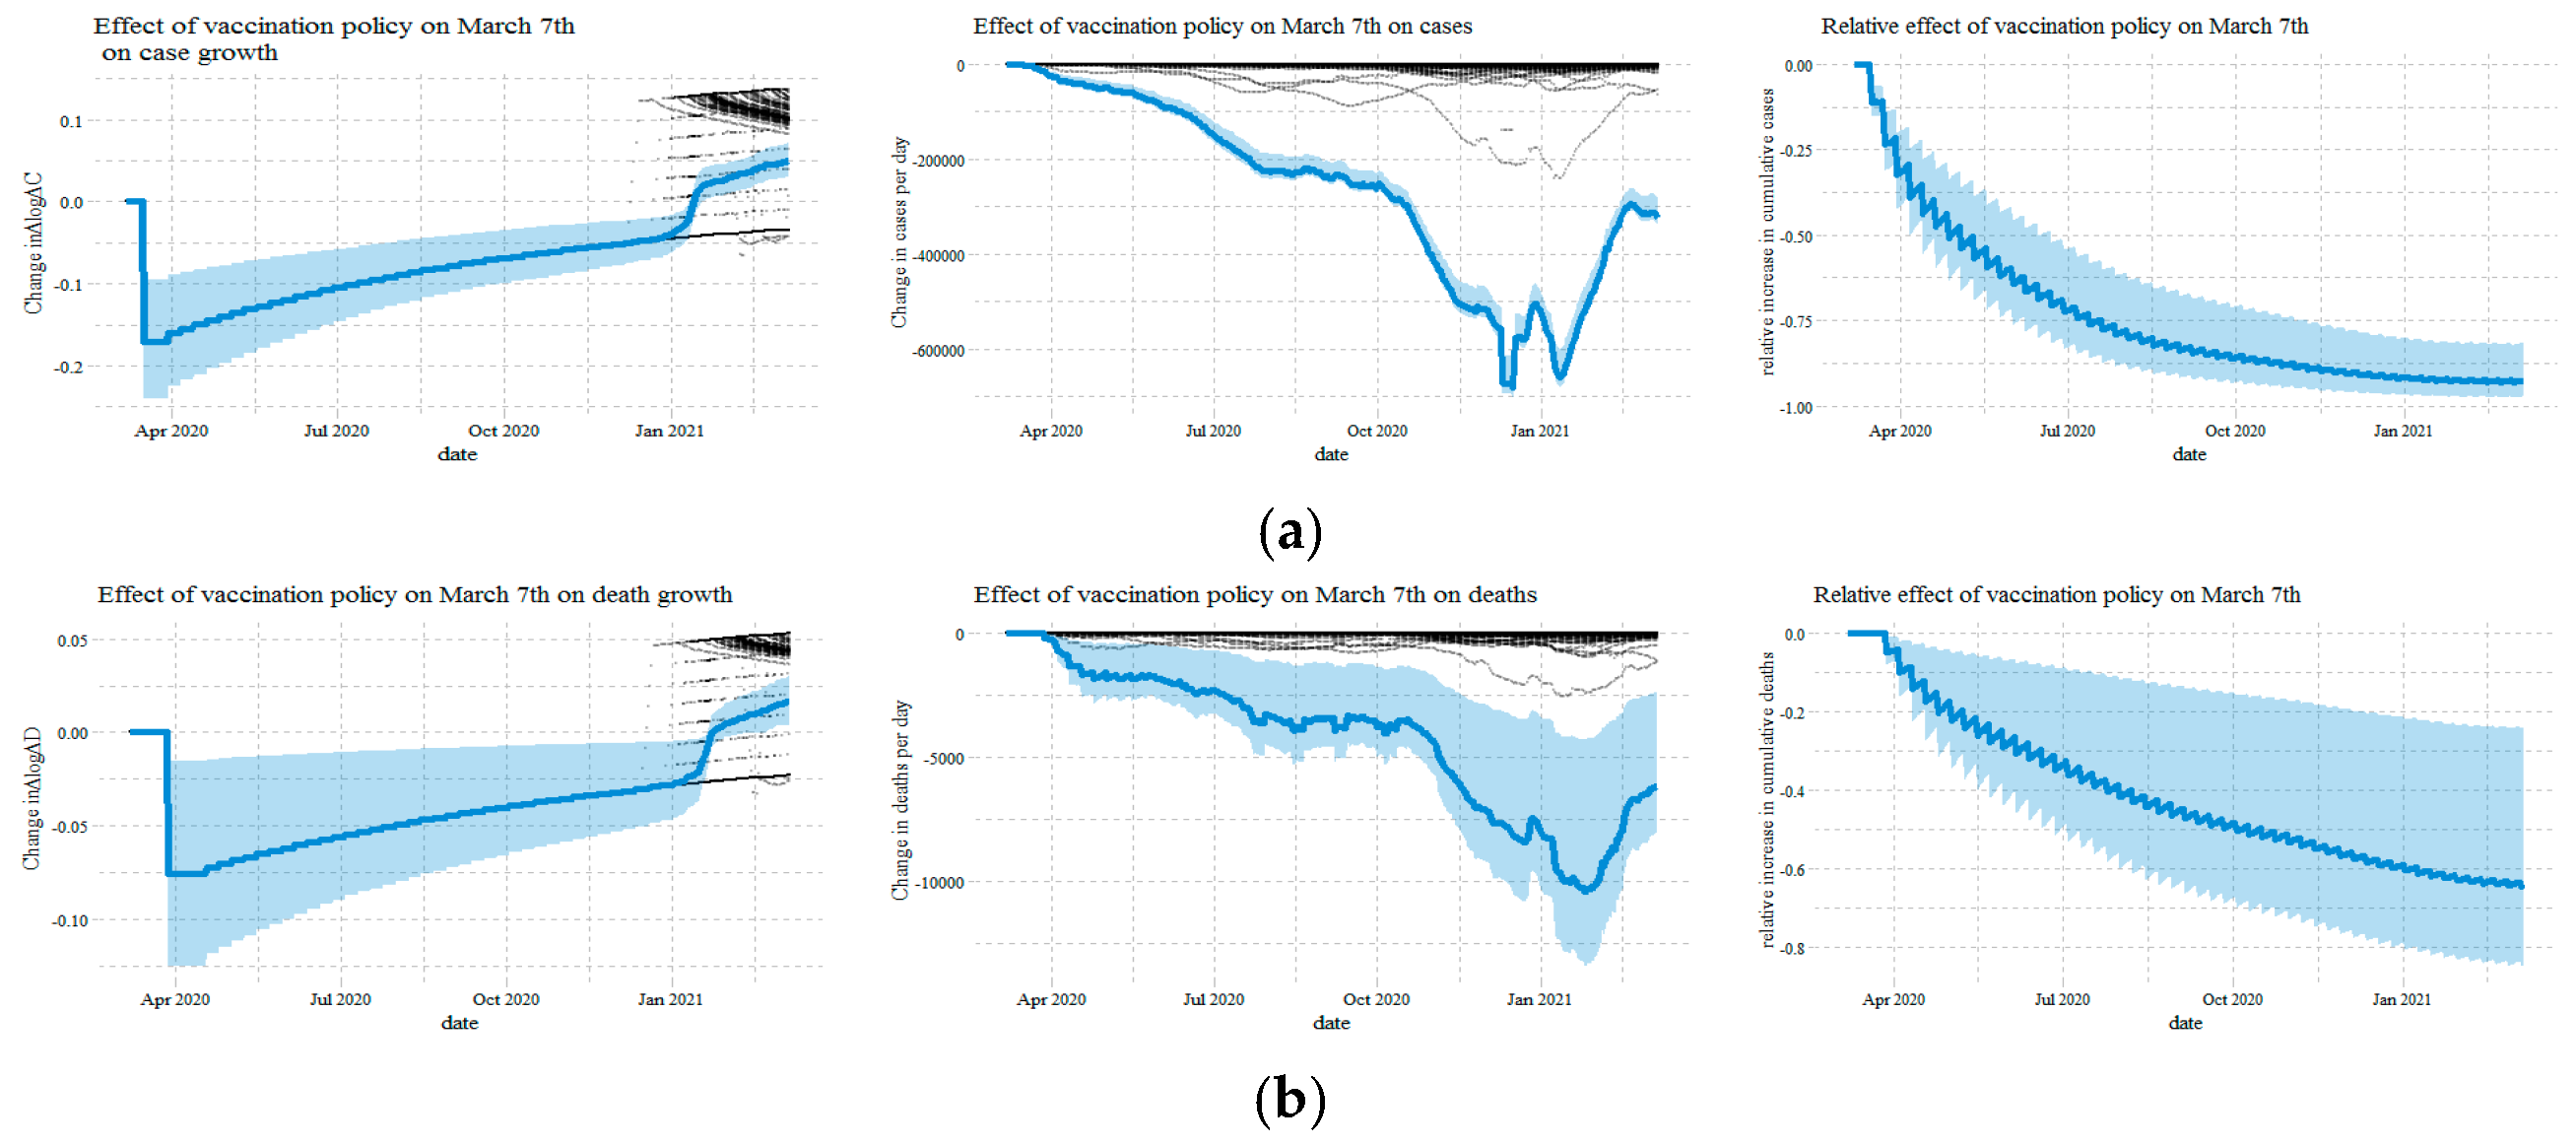
Figure 8.
Effect of no close public transport in the 121 countries: (a) Cases; (b) Deaths.

Table 1.
List of the 121 countries used in this paper.
| Country | Country | Country | Country |
|---|---|---|---|
| Angola | Fiji | Mali | Serbia |
| Argentina | Finland | Malta | Singapore |
| Australia | France | Mexico | Slovakia |
| Austria | Gabon | Moldova | Slovenia |
| Bahrain | Georgia | Mongolia | South Africa |
| Bangladesh | Germany | Morocco | South Korea |
| Barbados | Ghana | Mozambique | Spain |
| Belarus | Greece | Myanmar | Sri Lanka |
| Belgium | Guatemala | Namibia | Sweden |
| Belize | Haiti | Nepal | Switzerland |
| Benin | Honduras | Netherlands | Tajikistan |
| Bolivia | Hungary | New Zealand | Tanzania |
| Bosnia and Herzegovina | India | Nicaragua | Thailand |
| Botswana | Indonesia | Niger | The Bahamas |
| Brazil | Iraq | Nigeria | Togo |
| Bulgaria | Ireland | Norway | Trinidad and Tobago |
| Burkina Faso | Israel | Oman | Turkey |
| Cambodia | Italy | Pakistan | Uganda |
| Cameroon | Jamaica | Panama | Ukraine |
| Canada | Japan | Papua New Guinea | United Arab Emirates |
| Cape Verde | Jordan | Paraguay | United Kingdom |
| Chile | Kazakhstan | Peru | United States |
| Colombia | Kenya | Philippines | Uruguay |
| Costa Rica | Kuwait | Poland | Venezuela |
| Croatia | Kyrgyzstan | Portugal | Vietnam |
| Czechia | Laos | Qatar | Yemen |
| Denmark | Latvia | Romania | Zambia |
| Ecuador | Lebanon | Russia | Zimbabwe |
| Egypt | Lithuania | Rwanda | |
| El Salvador | Luxembourg | Saudi Arabia | |
| Estonia | Malaysia | Senegal | |
Table 2.
The effect of policies and information on behaviors.
| (a) Cases as Information | Workplaces | Retail | Transit | Grocery |
| school closing | −0.078 *** | −0.085 *** | −0.074 ** | −0.067 * |
| (0.022) | (0.028) | (0.029) | (0.036) | |
| cancel public events | 0.005 | −0.024 | −0.025 | −0.023 |
| (0.020) | (0.026) | (0.027) | (0.031) | |
| restrictions on gatherings | −0.056 *** | −0.045 | −0.051 | −0.040 |
| (0.021) | (0.032) | (0.035) | (0.035) | |
| close public transport | −0.033 *** | −0.068 *** | −0.053 *** | −0.042 *** |
| (0.013) | (0.016) | (0.020) | (0.015) | |
| stay at home requirements | −0.050 *** | −0.067 *** | −0.080 *** | −0.045 ** |
| (0.010) | (0.016) | (0.024) | (0.018) | |
| international travel controls | −0.023 | −0.017 | −0.052 ** | −0.0004 |
| (0.024) | (0.029) | (0.024) | (0.027) | |
| testing | −0.061 *** | −0.039 | −0.068 ** | −0.042 |
| (0.017) | (0.030) | (0.032) | (0.033) | |
| contact tracing | 0.031 * | 0.048 ** | −0.003 | 0.041 ** |
| (0.018) | (0.020) | (0.022) | (0.019) | |
| facial coverings | 0.077 *** | 0.100 *** | 0.095 *** | 0.088 *** |
| (0.015) | (0.024) | (0.021) | (0.019) | |
| vaccination | 0.011 | 0.002 | −0.016 | 0.020 |
| (0.017) | (0.023) | (0.029) | (0.021) | |
| dlogdc | 0.015 *** | 0.013 *** | 0.010 *** | 0.003 |
| (0.002) | (0.003) | (0.003) | (0.003) | |
| logdc | −0.009 *** | −0.014 *** | −0.003 | −0.002 |
| (0.003) | (0.003) | (0.004) | (0.003) | |
| country variables | YES | YES | YES | YES |
| quarter × country variables | YES | YES | YES | YES |
| observations | 44,891 | 44,891 | 44,891 | 44,891 |
| adjusted R2 | 0.4043 | 0.5179 | 0.4641 | 0.3676 |
| (b) Deaths as Information | Workplaces | Retail | Transit | Grocery |
| school closing | −0.082 *** | −0.090 *** | −0.074 ** | −0.067 * |
| (0.022) | (0.028) | (0.029) | (0.035) | |
| cancel public events | 0.003 | −0.025 | −0.021 | −0.022 |
| (0.021) | (0.026) | (0.027) | (0.030) | |
| restrictions on gatherings | −0.063 *** | −0.054 * | −0.053 | −0.041 |
| (0.021) | (0.032) | (0.035) | (0.035) | |
| close public transport | −0.033 ** | −0.065 *** | −0.050 ** | −0.042 *** |
| (0.013) | (0.016) | (0.020) | (0.015) | |
| stay at home requirements | −0.050 *** | −0.063 *** | −0.075 *** | −0.044 ** |
| (0.010) | (0.016) | (0.024) | (0.018) | |
| international travel controls | −0.033 | −0.028 | −0.058 ** | −0.003 |
| (0.025) | (0.030) | (0.025) | (0.027) | |
| testing | −0.075 *** | −0.061 ** | −0.071 ** | −0.045 |
| (0.017) | (0.028) | (0.031) | (0.032) | |
| contact tracing | 0.026 | 0.039 * | −0.005 | 0.039 ** |
| (0.018) | (0.020) | (0.021) | (0.019) | |
| facial coverings | 0.071 *** | 0.097 *** | 0.093 *** | 0.086 *** |
| (0.015) | (0.023) | (0.020) | (0.019) | |
| vaccination | 0.007 | 0.006 | −0.015 | 0.019 |
| (0.017) | (0.023) | (0.029) | (0.022) | |
| dlogdd | −0.0002 | −0.0005 | −0.003 | −0.003 * |
| (0.002) | (0.002) | (0.002) | (0.002) | |
| logdd | −0.009 *** | −0.015 *** | −0.006 | −0.003 |
| (0.002) | (0.003) | (0.004) | (0.003) | |
| country variables | YES | YES | YES | YES |
| quarter × country variables | YES | YES | YES | YES |
| observations | 44,891 | 44,891 | 44,891 | 44,891 |
| adjusted R2 | 0.4017 | 0.5247 | 0.4666 | 0.3689 |
Note: Standard errors clustered by country are in parentheses, which are computed by bootstrap random sampling 2000 times. * p < 0.1; ** p < 0.05; *** p < 0.01.
Table 3.
The direct effect of policies, behaviors, and information on cases and deaths growth.
| (a) Cases | dlogdc | (b) Deaths | dlogdd |
|---|---|---|---|
| lag(school closing, 14) | −0.233 *** | lag(school closing, 21) | −0.174 *** |
| (0.060) | (0.059) | ||
| lag(cancel public events, 14) | −0.093 * | lag(cancel public events, 21) | −0.079 * |
| (0.048) | (0.048) | ||
| lag(restrictions on gatherings, 14) | 0.023 | lag(restrictions on gatherings, 21) | −0.015 |
| (0.042) | (0.036) | ||
| lag(close public transport, 14) | 0.054 *** | lag(close public transport, 21) | 0.038 * |
| (0.019) | (0.021) | ||
| lag(stay at home requirements, 14) | 0.037 | lag(stay at home requirements, 21) | 0.023 |
| (0.032) | (0.029) | ||
| lag(international travel controls, 14) | −0.253 *** | lag(international travel controls, 21) | −0.336 *** |
| (0.087) | (0.113) | ||
| lag(testing, 14) | −0.235 * | lag(testing, 21) | −0.029 |
| (0.139) | (0.106) | ||
| lag(contact tracing, 14) | −0.082 * | lag(contact tracing, 21) | −0.027 |
| (0.044) | (0.043) | ||
| lag(facial coverings, 14) | −0.133 *** | lag(facial coverings, 21) | −0.126 *** |
| (0.044) | (0.039) | ||
| lag(vaccination, 14) | −0.158 *** | lag(vaccination, 21) | −0.144 *** |
| (0.045) | (0.041) | ||
| lag(workplaces, 14) | 0.474 *** | lag(workplaces, 21) | 0.399 *** |
| (0.140) | (0.125) | ||
| lag(retail, 14) | 0.168 | lag(retail, 21) | 0.079 |
| (0.152) | (0.123) | ||
| lag(transit, 14) | 0.148 | lag(transit, 21) | 0.246 ** |
| (0.106) | (0.102) | ||
| lag(grocery, 14) | −0.412 *** | lag(grocery, 21) | −0.323 *** |
| (0.116) | (0.103) | ||
| lag(dlogdc, 14) | 0.048 *** | lag(dlogdd, 21) | 0.050 *** |
| (0.017) | (0.012) | ||
| lag(logdc, 14) | −0.028 *** | lag(logdd, 21) | −0.021 *** |
| (0.006) | (0.004) | ||
| dlogtests | 0.019 ** | ||
| (0.009) | |||
| country variables | YES | country variables | YES |
| quarter × country variables | YES | quarter × country variables | YES |
| observations | 42,472 | observations | 42,350 |
| adjusted R2 | 0.1082 | adjusted R2 | 0.0455 |
Note: Standard errors clustered by country are in parentheses, which are computed by bootstrap random sampling 2000 times. * p < 0.1; ** p < 0.05; *** p < 0.01.
Table 4.
The total effect of policies and information on cases and deaths growth when causality among variables is not considered.
Table 4.
The total effect of policies and information on cases and deaths growth when causality among variables is not considered.
| (a) Cases | dlogdc | (b) Deaths | dlogdd |
|---|---|---|---|
| lag(school closing, 14) | −0.268 *** | lag(school closing, 21) | −0.217 *** |
| (0.066) | (0.065) | ||
| lag(cancel public events, 14) | −0.084 * | lag(cancel public events, 21) | −0.075 |
| (0.051) | (0.051) | ||
| lag(restrictions on gatherings, 14) | −0.0005 | lag(restrictions on gatherings, 21) | −0.044 |
| (0.045) | (0.039) | ||
| lag(close public transport, 14) | 0.038 * | lag(close public transport, 21) | 0.023 |
| (0.020) | (0.022) | ||
| lag(stay at home requirements, 14) | 0.010 | lag(stay at home requirements, 21) | −0.007 |
| (0.031) | (0.028) | ||
| lag(international travel controls, 14) | −0.271 *** | lag(international travel controls, 21) | −0.362 *** |
| (0.093) | (0.119) | ||
| lag(testing, 14) | −0.261 * | lag(testing, 21) | −0.066 |
| (0.143) | (0.109) | ||
| lag(contact tracing, 14) | −0.078 * | lag(contact tracing, 21) | −0.028 |
| (0.043) | (0.045) | ||
| lag(facial coverings, 14) | −0.115 ** | lag(facial coverings, 21) | −0.111 *** |
| (0.046) | (0.040) | ||
| lag(vaccination, 14) | −0.171 *** | lag(vaccination, 21) | −0.155 *** |
| (0.044) | (0.042) | ||
| lag(dlogdc, 14) | 0.057 *** | lag(dlogdd, 21) | 0.052 *** |
| (0.017) | (0.012) | ||
| lag(logdc, 14) | −0.035 *** | lag(logdd, 21) | −0.026 *** |
| (0.006) | (0.004) | ||
| dlogtests | 0.019 ** | ||
| (0.009) | |||
| country variables | YES | country variables | YES |
| quarter × country variables | YES | quarter × country variables | YES |
| observations | 42,472 | observations | 42,350 |
| adjusted R2 | 0.1025 | adjusted R2 | 0.0417 |
Note: Standard errors clustered by country are in parentheses, which are computed by bootstrap random sampling 2000 times. * p < 0.1; ** p < 0.05; *** p < 0.01.
Table 5.
The direct, indirect, and total effects of policies and information on cases and deaths growth.
Table 5.
The direct, indirect, and total effects of policies and information on cases and deaths growth.
| (a) Cases | Direct Effect | Indirect Effect | Total Effect | Average | Difference | |
| Considering Causal Pathways | Not Considering Causal Pathways | |||||
| school closing | −0.233 *** | −0.035 ** | −0.268 *** | −0.268 *** | −0.268 *** | 0.000 |
| (0.059) | (0.014) | (0.064) | (0.065) | (0.064) | (0.005) | |
| cancel public events | −0.093 * | 0.004 | −0.089 * | −0.084 * | −0.087 * | −0.005 |
| (0.048) | (0.012) | (0.051) | (0.051) | (0.051) | (0.005) | |
| restrictions on gatherings | 0.023 | −0.025 ** | −0.002 | −0.000 | −0.001 | −0.002 |
| (0.042) | (0.012) | (0.045) | (0.045) | (0.045) | (0.005) | |
| close public transport | 0.054 *** | −0.018 * | 0.036 * | 0.038 * | 0.037 * | −0.001 |
| (0.019) | (0.010) | (0.021) | (0.021) | (0.021) | (0.003) | |
| stay at home requirements | 0.037 | −0.028 *** | 0.009 | 0.010 | 0.009 | −0.002 |
| (0.032) | (0.009) | (0.030) | (0.030) | (0.030) | (0.003) | |
| international travel controls | −0.253 *** | −0.021 | −0.274 *** | −0.271 *** | −0.273 *** | −0.003 |
| (0.087) | (0.014) | (0.095) | (0.093) | (0.094) | (0.005) | |
| testing | −0.235 * | −0.028 ** | −0.263 * | −0.261 * | −0.262 * | −0.002 |
| (0.136) | (0.011) | (0.140) | (0.140) | (0.140) | (0.006) | |
| contact tracing | −0.082 * | 0.005 | −0.077 * | −0.078 * | −0.077 * | 0.001 |
| (0.043) | (0.011) | (0.043) | (0.042) | (0.042) | (0.004) | |
| facial coverings | −0.133 *** | 0.032 *** | −0.102 ** | −0.115 ** | −0.108 ** | 0.013 *** |
| (0.042) | (0.011) | (0.044) | (0.044) | (0.044) | (0.005) | |
| vaccination | −0.158 *** | −0.005 | −0.163 *** | −0.171 *** | −0.167 *** | 0.008 |
| (0.044) | (0.010) | (0.044) | (0.043) | (0.043) | (0.008) | |
| dlogdc | 0.048 *** | 0.010 *** | 0.057 *** | 0.057 *** | 0.057 *** | −0.000 |
| (0.016) | (0.002) | (0.017) | (0.017) | (0.017) | (0.001) | |
| logdc | −0.028 *** | −0.006 *** | −0.034 *** | −0.035 *** | −0.034 *** | 0.001 |
| (0.006) | (0.002) | (0.006) | (0.006) | (0.006) | (0.001) | |
| (b) Deaths | Direct Effect | Indirect Effect | Total Effect | Average | Difference | |
| Considering Causal Pathways | Not Considering Causal Pathways | |||||
| school closing | −0.174 *** | −0.036 *** | −0.210 *** | −0.217 *** | −0.214 *** | 0.007 |
| (0.059) | (0.013) | (0.063) | (0.064) | (0.064) | (0.006) | |
| cancel public events | −0.079 * | 0.001 | −0.078 | −0.075 | −0.077 | −0.003 |
| (0.045) | (0.012) | (0.048) | (0.049) | (0.048) | (0.005) | |
| restrictions on gatherings | −0.015 | −0.029 ** | −0.044 | −0.044 | −0.044 | 0.000 |
| (0.037) | (0.012) | (0.040) | (0.040) | (0.040) | (0.005) | |
| close public transport | 0.038 * | −0.017 * | 0.021 | 0.023 | 0.022 | −0.001 |
| (0.022) | (0.009) | (0.023) | (0.023) | (0.023) | (0.002) | |
| stay at home requirements | 0.023 | −0.029 *** | −0.007 | −0.007 | −0.007 | 0.000 |
| (0.029) | (0.009) | (0.028) | (0.028) | (0.028) | (0.003) | |
| international travel controls | −0.336 *** | −0.029 ** | −0.365 *** | −0.362 *** | −0.363 *** | −0.003 |
| (0.113) | (0.013) | (0.119) | (0.118) | (0.119) | (0.005) | |
| testing | −0.029 | −0.037 *** | −0.066 | −0.066 | −0.066 | −0.000 |
| (0.103) | (0.010) | (0.106) | (0.107) | (0.106) | (0.007) | |
| contact tracing | −0.027 | −0.001 | −0.028 | −0.028 | −0.028 | 0.001 |
| (0.042) | (0.009) | (0.043) | (0.043) | (0.043) | (0.004) | |
| facial coverings | −0.126 *** | 0.031 *** | −0.095 ** | −0.111 *** | −0.103 *** | 0.017 *** |
| (0.039) | (0.011) | (0.040) | (0.041) | (0.040) | (0.006) | |
| vaccination | −0.144 *** | −0.007 | −0.150 *** | −0.155 *** | −0.153 *** | 0.005 |
| (0.041) | (0.010) | (0.042) | (0.041) | (0.041) | (0.009) | |
| dlogdd | 0.050 *** | 0.0004 | 0.050 *** | 0.052 *** | 0.051 *** | −0.002 ** |
| (0.012) | (0.001) | (0.012) | (0.012) | (0.012) | (0.001) | |
| logdd | −0.021 *** | −0.005 *** | −0.026 *** | −0.026 *** | −0.026 *** | 0.001 |
| (0.004) | (0.002) | (0.004) | (0.004) | (0.004) | (0.001) | |
Note: The direct effect is given by π in the Equation (1). The indict effect is given by α from Equation (1) times β from Equation (2). The total effect of considering causal pathways is π + βα. The total effect, regardless of the causal path, is calculated by Equation (5). Standard errors clustered by country are in parentheses, which are computed by bootstrap random sampling 2000 times. * p < 0.1; ** p < 0.05; *** p < 0.01.
Publisher’s Note: MDPI stays neutral with regard to jurisdictional claims in published maps and institutional affiliations. |
© 2022 by the authors. Licensee MDPI, Basel, Switzerland. This article is an open access article distributed under the terms and conditions of the Creative Commons Attribution (CC BY) license (https://creativecommons.org/licenses/by/4.0/).
Share and Cite
MDPI and ACS Style
Wang, F.; Ge, X.; Huang, D. Government Intervention, Human Mobility, and COVID-19: A Causal Pathway Analysis from 121 Countries. Sustainability 2022, 14, 3694. https://doi.org/10.3390/su14063694
AMA Style
Wang F, Ge X, Huang D. Government Intervention, Human Mobility, and COVID-19: A Causal Pathway Analysis from 121 Countries. Sustainability. 2022; 14(6):3694. https://doi.org/10.3390/su14063694
Chicago/Turabian StyleWang, Feng, Xing Ge, and Danwen Huang. 2022. "Government Intervention, Human Mobility, and COVID-19: A Causal Pathway Analysis from 121 Countries" Sustainability 14, no. 6: 3694. https://doi.org/10.3390/su14063694
Note that from the first issue of 2016, this journal uses article numbers instead of page numbers. See further details here.