
Can Green Credit Policy Promote Firms’ Green Innovation? Evidence from China


1
School of Statistics and Mathematics, Zhejiang Gongshang University, Hangzhou 314423, China
2
School of Economics, Huazhong University of Science and Technology, Wuhan 430074, China
*
Author to whom correspondence should be addressed.
Sustainability 2022, 14(7), 3911; https://doi.org/10.3390/su14073911
Submission received: 16 February 2022
/
Revised: 17 March 2022
/
Accepted: 22 March 2022
/
Published: 25 March 2022
(This article belongs to the Special Issue Sustainable Development for Corporations: Challenges and Opportunities in Climate Change Background)
Abstract
:To achieve the twin goals of “stable growth” and “environmental protection”, it is necessary to promote green innovation in firms and green transformation of the economy. This paper regards China’s Green Credit Guidelines policy in 2012 as a quasi-natural experiment to explore the impact of the policy on the green innovation of heavy-polluting firms. This analysis uses Chinese A-share listed industrial enterprises from 2008–2019 as the research sample and difference-in-difference (DID) as the empirical method. The results show that implementing the green credit policy has significantly contributed to firms’ green technology innovation enhancement. Moreover, the mechanism suggests that the green credit policy can promote firms’ green innovation through channels, such as inhibiting the compression of heavy-polluting firms’ financing space, increasing their debt financing costs, and promoting firm transformation and upgrading. Further study finds that the green credit policy promotes green innovation significantly for state-owned and large firms but not for non-state-owned and small-scale firms. Based on our empirical results, we can conclude that the green credit policy is an efficient way to realize the goal of “environmental excellence” and guide firms to effectively carry out green innovation.
1. Introduction
China has implemented a series of policies to alleviate the problems of resource depletion and environmental pollution [1,2]. However, the relevant administrative, tax, and technical tools have not been so effective in achieving the goal of “environmental excellence”. There is still a large gap between the reality and the goal of environmental governance. Therefore, to substantially improve the ecological environment, environmental pollution must be eliminated at the source and not just rely on the “intensity reduction” of treatment as the endpoint. According to the concept of green technology proposed by [3], green technology follows eco-economic laws and emphasizes a preventive approach, making it more likely to address the root causes of ecological issues [4,5]. As the main body of emissions and the focus of policy implementation, firms should take the corresponding environmental responsibility, green innovation, and promote the green transformation of the economy. However, green innovation means a complete production transformation and technological innovation for some resource-intensive firms. This not only exposes firms to capital shortages and investment risks, but the long return cycle of the project is also contrary to their profit-maximizing business goals, resulting in low motivation to undertake green-friendly changes [6]. Therefore, it is essential to implement financial incentives to proactively improve firms’ environmental performance [7].
Among the current market-based regulations in China, green finance is considered an important tool to promote the green transformation of the economy because it can provide financial support to green firms [8]. As the beginning of the implementation of China’s green financial policy, the green credit policy has been developed for a long time. It plays an increasingly important role in promoting green innovation in firms and limiting the blind expansion of heavy-polluting industries [9,10]. The green credit policy aims to impose credit constraints on firms through financial institutions and promote firms to transform from a high pollution model to a new economic development one with low pollution and low energy consumption. Then, the policy aims to help firms reach a development model that does not sacrifice long-term sustainable interests for short-term gains. Finally, the ecological environment and economic development can be mutually benefited.
The existing literature about the measurement of firms’ green innovation has undergone a development process from R&D [11,12] to the patent data [13,14,15,16]. As part of the inputs to production activities, R&D can not directly explain innovation outcomes. On the contrary, the patent data can show firms’ output results in a more micro and direct way, as for the impact of environmental regulation on firms’ green innovation of enterprises. Some scholars argue that environmental regulations increase firms’ operating and R&D expenditures, especially in resource-based industries. They think that environmental regulations will fail to motivate firms to invest in green innovation and negatively affect on it [17,18,19]. However, at the same time, some scholars suggest that reasonable designs of environmental regulations can inspire firms to increase investment in their technology research and development [20,21,22,23]. It is obvious that improving production efficiency and changing production methods can significantly promote firms’ green innovation. By analyzing financial markets in G20 countries, D’Orazio [24] finds that implementing climate-related financial policies such as green finance can contribute to the sustainability of social development. As the first and most complete policy of green finance, the green credit policy has also been widely discussed in its role and impact mechanism.
In terms of relevant research, the existing literature mainly discusses the economic effects of the green credit policy from the perspectives of firm investment and financing efficiency, emission reduction efficiency and firm innovation enthusiasm, etc. [6,25,26,27]. In addition, based on the perspective of financial constraints, Hu et al. [28] find that the green credit policy can significantly stimulate green innovation in heavy-polluting firms by strong financial constraints, high expected sunk costs, and high violation costs. Su et al. [29] argue that the green credit policy can improve air quality in China by limiting pollutant emissions and increasing heavy-polluting firms’ burden. Liu et al. [30] argue that the green credit policy positively impacts environmental pollution by significantly reducing the debt financing capacity of heavy-polluting firms. Yao et al. [31] argue that the green credit policy reduces the performance of heavy-polluting firms by increasing firm financing constraints and reducing the level of investment. These studies mentioned above explore different perspectives on the economic effects of the green credit policy and the factors influencing the green technology of enterprises. However, little of the literature combines green credit and firms’ green innovation to discuss their effects and corresponding impact mechanisms.
Does the implementation of the green credit policy impact firms’ green innovation? What are the mechanisms of the impact of the green credit policy on firms’ green innovation? To better investigate these issues, our analysis is divided into the following stages: First, we use the DID approach to study the causal relationship between the green credit policy and firms’ green innovation. Specifically, this paper uses the data of Chinese A-share listed industrial firms from 2008 to 2019 and finds that the green credit policy can promote firms’ green innovation. At the same time, we find that the green credit policy promotes firms’ green technology upgrading by compressing heavy-polluting firms’ financing space and raising their debt-financing cost. In addition, we are then providing endogenous motivation for firms’ innovation and transformation as well as forcing heavy-polluting firms to transform and upgrade. Finally, a series of additional analyses, including robustness tests and heterogeneity analyses, are conducted to discuss the policy implications of our findings.
The possible contributions of this paper are summarized as follows. First, this paper explores the relationship between the green credit policy and firms’ green innovation. The existing literature mainly explores the impact of green credit implementation on firm investment efficiency, but quite a few studies analyze the firms’ green innovation from the green credit policy implementation perspective. We apply a DID and propensity score matching (PSM) estimation method to explore the effect of the green credit policy on firms’ green innovation, which could fill the gap of existing research in green finance. Therefore, our research enriches the impact of the green credit policy on firm development.
Second, through the study of the adjustment effect of the green credit policy, we explain the potential mechanism of the green credit policy on firms’ green innovation. Moreover, we find that the policy can promote firms’ green innovation through the channels of inhibiting the compression of heavy-polluting firms’ financing space, raising their debt financing costs, and promoting firm transformation and upgrading. This paper provides a new perspective to interpret the relationship between the green credit policy and firms’ green innovation.
Third, from the perspective of firm heterogeneity, this paper reveals the difficulties that non-state-owned firms and small-scale firms may encounter in the process of the green credit policy implementation and provides theoretical guidance to enhance the effectiveness of the policy implication.
The rest of the paper is structured as follows. Section 2 provides background and research hypothesis. Section 3 is methodology and data, and Section 4 presents the empirical results. Then, Section 5 is a robustness test based on the results, and Section 6 is the heterogeneity analysis. Finally, Section 7 concludes with a discussion on policy implications.
2. Background and Research Hypothesis
2.1. Background
To guide enterprises to carry out environmental improvement and resource-saving economic activities, it is necessary to implement policies supporting green finance. Green finance promotes green economic transformation by providing financial support to green firms [8]. As an important part of green finance, the green credit policy has two core elements. First, it can support industries and projects such as energy conservation and environmental protection, cleaner production, ecological environment, and green infrastructure upgrades. Second, to strictly prohibit lending to heavy-polluting firms, and even strictly control and withdraw loans for environmental violations and projects that do not meet the goals of green development [32]. Therefore, the green credit policy has the capital regulation function of ordinary credit, making the surplus side of capital match with the demand side of the capital. On the other hand, it can also serve as a tool of national macro-control, becoming a means for the state to guide the transformation and upgrading of industrial structure to low-energy and low-consumption industries.
Since the green credit policy has such implications, it can be predicted that it can activate firms to develop green technology that meet the needs of environmental development. In this way, it is more likely to achieve both environmental and economic benefits. With such consideration, in 2005, the State Council issued the Decision on Implementing the Scientific Outlook on Development and Strengthening Environmental Protection, which first proposed the green credit policy and marked the beginning of green finance. In 2007, the former State Environmental Protection Administration, the People’s Bank of China, and the China Banking Regulatory Commission jointly issued the “Opinions on Implementing Environmental Protection Policies and Regulations to Prevent Credit Risks”. For the first time, this “Opinion” regards the green credit policy as an important market method for environmental protection, energy conservation, and emission reduction [7]. Since then, business guidance regulations and development policies related to the green credit policy have been launched one after another, and the policy has experienced a period of steady development. However, the green credit policy has not been effectively implemented due to imperfect supporting measures, lack of supervision over policy implementation, and inadequate evaluation and restriction mechanisms [33,34]. In February 2012, the China Banking Regulatory Commission issued the Green Credit Guidelines. The Guidelines propose how financial institutions can effectively carry out the green credit policy, promote the green transformation of traditional industries, and support the establishment of a low-carbon and circular development industrial system from six aspects: organizational management, policy system, process management, internal control management, information disclosure, and supervision and inspection. The implementation of the Guidelines further clarifies the standards and principles of the green credit policy in the banking industry. Therefore, it is considered to be the first domestic regulatory document dedicated to green credit and the core of China’s green credit system [30]. The introduction and implementation of the green credit policy have broadened the scope of the capital investment driving the flourishing of green industries and the sustainable development of general industries, resulting in new growth points for economic development.
2.2. Research Hypothesis
Achieving “both the silver mountain and the green mountain” means that we must take into account the twin goals of “stable growth” and “environmental protection”. However, the related policies that China has adopted have not achieved the goal of an “excellent environment”. There is a huge gap between environmental governance practices and their goals because substantial ecological improvements will rely on stronger end-of-pipe governance measures and the use of financial instruments to change the incentives for resource allocation. Therefore, financial instruments are indispensable to fundamentally eliminate environmental pollution and achieve ecological and environmental management goals. As the earliest policy implemented by green finance, the green credit policy restrains banks from lending to non-green-firms and restricts the possibility of heavy-polluting firms obtaining credit through the regulations on commercial bank loans, thereby forcing firms to develop environmentally friendly industries. The 2012 Green Credit Guidelines are issued to limit the blind expansion of heavy-polluting firms, while making them withdraw from projects that may bring significant environmental problems through credit constraints and encouraging them to undertake green innovation activities [10]. Based on this, we make Hypothesis 1.
Hypothesis 1.
The green credit policy implication promotes green innovation in heavy-polluting firms.
In the past, some large and heavy-polluting firms in China had easier access to bank credit and preferential interest rates, since heavy-polluting firms are usually also capital-intensive firms with strong profitability in their crude production and business models in the context of rapid industrialization in the past [35,36]. However, with the development of the economy, such a mode at the expense of the environment is no longer in line with the requirements of the times. Therefore, heavy-polluting firms reverse the current losses by carrying out environmentally friendly technological reforms and changing the production and operation mode. To better guide the green innovation of heavy-polluting firms, the green credit policy focuses on restricting financial institutions from lending to projects that violate environmental laws and are not in line with green development goals, which has greatly compressed the financing space for heavy-polluting firms [25]. Even some ongoing environmental non-compliance projects have to be suspended due to the lack of follow-up funding support. The financing channel internalizes the environmental costs of firms, making them pay for their environmental pollution behavior in terms of loan financing costs as well as to compress firms’ financing space and raise their debt financing costs. However, debt financing is an important factor that influences the investment decision, R&D investment, and innovation efficiency of firms. If firms want to change the constraints of their financing availability and financing costs, they must turn to clean technology research and development, enabling them to make innovative transformations. Therefore, the introduction of the green credit policy has changed the incentive structure of cleaner production for firms, providing them with an intrinsic motivation to innovate and transform without eliminating polluting production technologies. Based on this, we propose Hypothesis 2.
Hypothesis 2.
Policy implementation of “Green Credit” provides the endogenous impetus for firms to innovate and transform in a green manner by compressing the financing space of heavy-polluting firms and raising their debt financing costs.
Before the implementation of the green credit policy, there was no difference in the loans of commercial banks to firms, and even heavy-polluting firms were more likely to obtain bank loans due to their strong mortgage capacity. However, with the implementation of the Green Credit Guidelines in 2012, commercial banks responded to the call of the green credit policy by launching green credit products, offering preferential credit rates and credit policies to energy-saving and environment-friendly industries with low pollution and consumption. The introduction of the “Green Credit Guidelines” makes it difficult for heavy-polluting firms to obtain bank loans while maintaining the current situation. In addition, firms that cannot obtain bank credit will be less productive [37]. Ordinary technological reforms have been unable to enable non-compliant heavy-polluting firms to obtain bank loans and may also be unable to produce due to a lack of funds. Therefore, to obtain more bank loans, heavy-polluting firms must break the rule, adjust the existing industrial structure, develop by looking for alternative energy sources, control the promotion of environmental pollution projects, and realize the optimization and upgrading of the industrial structure. Based on this, we propose Hypothesis 3.
Hypothesis 3.
The green credit policy implication can force the transformation and upgrading of heavy-polluting firms and promote the innovation of the green technology of firms.
3. Research Design
3.1. Methodology
In this paper, the implementation of the green credit policy is treated as a quasi-natural experiment. Following [38] and [31], whose analyses are similar to our research, we also use a DID model to address our empirical concern. The difference-in-difference model (DID) is widely used to evaluate policy effects for its effectiveness of causal identification. The empirical results may be biased due to the heterogeneity of business performance and industrial scale of different firms, thus failing to reflect the real policy effect. To address this issue, we employ the propensity score matching method (PSM) developed from [39] by [40], to remove sample selection bias. PSM can solve sample selection bias, but it cannot avoid the endogeneity problem due to the omission of variables. Meanwhile, the DID can solve the endogeneity problem well and derive policy treatment effects, but without the function of solving sample bias well. Therefore, the PSM-DID method, which combines propensity score matching and difference-in-difference (DID), is used in this paper to conduct the study. First, we use PSM to find the control group closest to the experimental group in terms of control variables such as firm financial data and then perform DID regression using the matched experimental groups and control groups. The basic regression model is constructed as follows:
In model (1), the subscript i denotes an A-share listed industrial firm, t denotes the year, and denotes the number of green patent applications of firm i in year t. is the DID term. Among them, if the firm is heavy-polluting, Treat takes 1, otherwise it takes 0; if the sample year is 2012 or later, Time is 1, if not it is 0. is the control variable in this paper. Referring to Amore and [41], to control other economic characteristic indicators of firms’ green innovation, we introduce five firm-level indicators such as firm size (Size), firm performance (ROA), asset-liability ratio (Debt), Tobin Q (Tobin Q), and the number of employees (Employee) as control variables. is a firm fixed effect, is a time fixed effect, and is a random disturbance term.
3.2. Sample Selection, Variable Descriptions, and Data Sources
This paper uses Chinese A-share listed industrial firms as the main research object to compare the differences in the level of firms’ green innovation before and after the implementation of the Green Credit Guidelines and selects a sample of firm green innovation levels research during 2008–2019. The green innovation data of firms in this paper are based on the patent database of the State Intellectual Property Office and the “Green List of International Patent Classification” issued by the World Intellectual Property Organization (WIPO), while other firm-level financial data are obtained from the CSMAR database. In this paper, based on the initial sample, the observations of listed firms are excluded with abnormal financial status, such as ST and ST* as well as the listed firms with certain indicators whose data are indeed serious. After the above screening and data processing, 22,607 firm-year observations are obtained in this paper. The main variables and measures in this paper are as follows.
The explained variable. The explained variable is the level of firms’ green innovation. Referring to [42] and [43], the number of green patent applications can better reflect the environmental technology level of firms and measure their innovation output. Therefore, we adopt the total number of green patent applications (GTI) to measure the green innovation capability of firms.
The explanatory variable. The heavy-polluting firms under the “Green Credit Guidelines” () are explanatory variables. Among them, the list of heavy-polluting firms is identified regarding [26], mainly based on the Guidelines on Industry Classification of Listed firms revised by the China Securities Regulatory Commission in 2012, the List of Listed firms for Environmental Verification Industry Classification, and Management established by the Ministry of Environmental Protection in 2008 (Huanban Letter [2008] No.373) and the Guidelines on Environmental Information Disclosure of Listed firms (Huanban No. [2010] 78), mainly including thermal power, iron and steel, cement, electrolytic aluminum, coal, metallurgy, chemical, petrochemical, building materials, paper, brewing, pharmaceutical, fermentation, textile, tannery, and mining, and another 16 types of industries. Industries belonging to these 16 categories are identified as heavy-polluting firms and are the experimental group, with Treat taking 1, and firms in other industries as the control group, with Treat taking 0. The time dummy variable is bounded by the implementation of the Green Credit Guidelines in 2012, and the sample time is taken as 1 in 2012 and later, and 0 if not.
Control variables. Referring to [44] and [32], we add control variables at the firm level, including firm size (Size), which is measured by the natural logarithm of the total assets of the listed firms in the sample; firm performance (ROE), referring to [45], means the return on net assets (ROE) of a firm can reflect the effectiveness of the comprehensive utilization of a firm’s assets and is an important indicator of the profitability of the firm’s assets. Therefore, firm performance is measured by ROE in this paper; debt ratio (Debt) is expressed as a ratio of total liabilities to total assets at the end of the period; Tobin Q (Tobin Q) is expressed as the ratio of the market value of owner’s equity and liabilities to the firm’s total book assets; and the number of employees (Employee) is the natural logarithm of the number of employees of the listed firms in the sample. The descriptive statistics of the data are shown in Table 1.
4. Empirical Analysis
4.1. Baseline Regression
Following [23], this paper uses DID and PSM-DID models to test the impact of the green credit policy implementation on firm green innovation. The baseline regression results are shown in Table 2. Specifically, columns (1) and (2) are the regression results of the DID model. Column (1) is the result without control variables, and column (2) is the result of firm control variables. To exclude the effect of heterogeneity on firm outcomes due to different firms’ business performance, industry size, etc., we match the sample with propensity scores before DID. Columns (3) and (4) are the regression results after PSM matching, where column (3) is the result column without control variables and (4) adds the firm control variables. The regression results from column (1) to column (4) reveal that the green credit policy significantly contributes to firms’ green innovation, either before or after matching or with or without the inclusion of firm control variables. The above results are similar to the results of [46]. The results of the basic regression in Table 2 verify Hypothesis 1: the implementation of the green credit policy promotes green innovation in heavy-polluting firms.
4.2. Parallel Trend Hypothesis and Dynamic Effects Test
Before using the DID method, it is necessary to test whether the parallel trend assumption is satisfied. The trends of the outcome variables in the experimental and control groups should remain consistent in the absence of policy interventions. Drawing on [47], this paper employs the event analysis method to test the assumption of parallel trends and further analyzes the dynamic effect of the green credit policy on the green innovation of heavy-polluting firms. Following [48], we construct the following model:
In model (2), denotes the impact from the first four periods before the policy intervention to the last five periods after the treatment. indicates the effect of the current treatment period, so the DID term takes the value of 1 when the year is the current treatment period and 0 otherwise. Other variables in model (2) are defined as above. We produce the regression results of Equation (2) as Figure 1.
Figure 1 shows the test results of the parallel trend and dynamic effect test. It can be seen from Figure 1 that in the four years before the policy intervention, the estimated value of the multiplication coefficient of each period and the dummy variable of the treatment group is not significant at the 5% confidence level. It indicates that before implementing the green credit policy, the target variables of the control and experimental groups do not differ significantly. Moreover, the trends over time are generally consistent, which satisfies the assumption of parallel trends. The estimated coefficient of the cross-product term becomes significant after the enforcement, indicating that the policy positively affects the improvement of firms’ green innovation. Therefore, the parallel trend hypothesis and dynamic effect test in this paper are supported, satisfying the premise of using the DID method. Moreover, Figure 1 also shows that the implementation of green credit can significantly promote green innovation in firms and the effect of the policy is sustainable.
4.3. Moderating Effects
As an environmental regulation tool, the green credit policy requires financial institutions to strictly restrict loans to heavy-polluting firms and projects that pollute the environment. Therefore, to meet the goal of stimulating the intrinsic motivation of green innovation in heavy-polluting firms and explore how green credit acts on firms’ green innovation, this paper examines the regulation mechanism of the green credit policy on firm green innovation from two aspects: firms’ financing constraints and firms’ industrial upgrading.
Financing constraints of firms. Firms’ green innovation requires long-term financial support, and long-term low-interest loans can encourage firms to invest in innovation activities [49]. However, the green credit policy requires heavy-polluting enterprises to meet the requirements of production technology before they can obtain low-interest loans from banks. Therefore, if heavy-polluting enterprises want to obtain long-term low-interest loans for their long-term development, they can only suspend projects that do not meet environmental requirements and carry out clean technology innovation according to the requirements of the green credit policy. This paper selects the proportion of long-term borrowings in total assets (LR) as the moderating effect variable from the perspective of inhibiting financing to illustrate the moderating effect of green credit on inhibiting firm financing.
The regression results are shown in columns (1) and (3) of Table 3. Column (1) is the result of the DID model, and column (3) is the result of running the PSM-DID model. As can be seen in Table 3, the results are all significantly negative, indicating that the implementation of the green credit policy has a significant inhibitory effect on the proportion of heavy-polluting firms obtaining long-term loans. This also shows that the introduction of the green credit policy inhibits the possibility of heavy-polluting firms obtaining preferential financing from banks, which verifies hypothesis 2, which is consistent with the result of [10] that the green credit policy reaches its goal by raising firms’ debt financing costs.
Industrial upgrading of firms. Environmental regulation policies can optimize and upgrade the industrial structure through the development of alternative energy sources and the advancement of environmentally polluting projects through the creation of green financial instruments [41]. The green credit policy restricts the issuance of loans to heavily polluting enterprises while pouring money into clean energy production. Therefore, while guiding high-polluting enterprises to enter low-energy consumption and low-emission industries, the goal of restricting the continued development of high-polluting enterprises in high-energy consumption and high-emission industries can be achieved, which speeds up the industrial upgrading of enterprises. Referring to [43], we select the amount of annual firm R&D investment (RD) as the moderating effect variable of industrial upgrading to show that there is a moderating effect of the green credit policy on promoting industrial upgrading.
The regression results are shown in columns (2) and (4) of Table 3. Column (2) is the result of running the base regression of model (1), and column (4) is the result of running the model after propensity score matching. The results are all significantly positive, indicating that under the restriction and guidance of the green credit policy. This means the R&D investment of heavy-polluting firms has increased significantly, which is consistent with hypothesis 3.
5. Robustness Tests
5.1. Placebo Test
To exclude the results of other important unobservable factors such as environment, economy, politics, etc., this paper conducts a placebo test by randomization. In our randomization, referring to [50], we randomly select the year of policy implementation and then randomly assign it to the experimental group for testing. To enhance the validity of the test, we repeat this random process 1000 times and obtained the corresponding samples. Among these pseudo-sample firms, we run the regression of Equation (1). The distribution of the estimated coefficients and the corresponding p-values obtained for the pseudo-sample firms are shown in Figure 2. In Figure 2, the horizontal axis indicates the magnitude of the estimated coefficients of the pseudo-sample firms, and the vertical axis indicates the magnitude of the density values and p-values. The curve is the kernel density distribution of the estimated coefficients, the red cross is the p-value corresponding to the estimated coefficients, and the vertical dashed line is the true estimate of the DID model. This value is the estimated value after PSM matching, which can be found in Table 1 to be 0.329. As can be seen in Figure 2, the estimated value of random allocation is concentrated around 0. Meanwhile, most of the results are smaller than the estimated value of 0.329, which is the green credit for firms’ green innovation after PSM matching. Moreover, most of the p-values of the estimates are greater than 0.1, indicating that most of the coefficients of the random sample are not significant at the 10% level. These results all suggest that our estimates were not obtained by chance and are unlikely to be influenced by other policy or random factors.
The results of the placebo test show that the conclusion that the implementation of the green credit policy that can significantly promote firms’ green innovation is not due to the influence of unobservable factors.
5.2. Replacement of the Explanatory Variable
Table 4 shows the results of the test after replacing the explanatory variables. Since the selection of indicators for the explanatory variables may also cause estimation bias, we replace green patent applications in the regression model with green invention patent applications (IGTI) and green utility model patent applications (UGTI), which in turn provide explanatory variables and use the regression of model (1), respectively. The results obtained are shown in Table 4. Among them, columns (1) and (2) are the regression results based on DID, and columns (3) and (4) are the regression results after propensity score matching. The results in columns (1)–(4) are all significantly positive, indicating that the selection of the explanatory variables does not cause estimation errors on the experimental results. Therefore, our conclusion that the implementation of the green credit policy can significantly promote firms’ green innovation is robust.
6. Heterogeneity Analysis
The previous analysis shows that the green credit policy has a significant impact on green innovation in heavy-polluting firms. However, the behavioral response to environmental regulations varies by firm attributes. Based on this, this paper distinguishes firms with different property rights and firms of different sizes to explore the impact of the green credit policy. The exploration of this issue will help us understand the micro-effects of the green credit policy under different scenarios.
There are certain differences between state-owned firms (SOEs) and non-state-owned firms (non-SOEs) in terms of resource endowment and political resources. First, compared to non-SOEs, SOEs are more likely to have access to additional political resources, such as easier access to credit financing, etc., which means a lower-cost green innovation transformation. Second, SOEs are more vulnerable to government intervention than non-SOEs, so they will formulate more stringent environmental regulation response strategies to undertake the economic goals and social responsibilities entrusted by the government [51]. Based on this, this paper divides two sub-samples into SOEs and non-SOEs, according to the nature of their property rights, and examines the impact of the green credit policy on green innovation in the two types of firms, respectively. Therefore, we conducted sub-sample regression for state-owned enterprises and non-state-owned enterprises, and the results are shown in columns (1) and (2) of Table 5. The results show that the regression coefficient of state-owned enterprises is 0.545, which is significantly positive, indicating that the green credit policy has a positive impact on green innovation of state-owned enterprises. However, the regression coefficient of non-state-owned enterprises is not significant. The likely economic explanation is that SOEs are subject to stricter government regulation and are, therefore, more responsive to policies to upgrade green technologies. However, non-state-owned enterprises are limited by capital availability, profit maximization, and other constraints, so they cannot invest a lot of money to upgrade green technology. The results are similar to [52].
Firms of different sizes are quite different in terms of internal control and financing capabilities, which may lead to different effects of the green credit policy between the two. Specifically, compared to small-scale firms, large-scale firms are more abundant in resources, better financed, and more capable of making green innovation changes. Second, large-scale firms may have greater performance growth benefits from technological upgrades and more incentive to pursue green innovation. Furthermore, large-scale firms have more robust internal control systems and can more accurately grasp policy guidance when dealing with issues such as environmental regulations [46]. Based on this, the study divides the sample into large-scale firms and small-scale firms based on the median total assets of the sample firms in 2012 and performs group regressions. The results obtained are shown in columns (3) and (4) of Table 5. The results show that the green credit policy has a significant promotion effect on green innovation in large-scale heavy-polluting firms, but not in small-scale firms. This may be because small-scale firms with limited resources will have to stop upgrading their green technologies due to a lack of funds in response to the green credit policy.
7. Conclusions
To better realize the goal of “environmental excellence” and guide firms to effectively carry out green innovation, this paper focuses on the green credit policy proposed in 2012 to discuss the contribution of this policy. Further, we want to find out whether and how the green credit policy promotes firms’ green innovation. Finally, based on our empirical results, we have had some revelations and can make some policy suggestions on how to implement the green credit policy better.
Using a dataset covering Chinese A-share listed industrial firms from 2008 to 2019, we study the effect of the green credit policy on firms’ green innovation with a DID model. The results show that (1) The implementation of the green credit policy promotes green innovation in heavy-polluting firms; (2) The green credit policy can provide an impetus for firm innovation and transformation, and promote firm green innovation by reducing the financing space of heavy-polluting firms; (3) The implementation of the green credit policy pushes heavy-polluting firms to transform and upgrade the green innovation capability; and (4) The heterogeneity analysis shows that the promotion effect of the green credit policy on firms’ green innovation is more significant for state-owned firms and large-scale firms, but not for non-state-owned firms and small-scale firms. According to the results concluded above, we can say that the green credit policy plays a positive role in promoting firms’ green innovation and helps with environmental improvement. The analysis of it means a lot, but it still has something that needs to be improved by the government.
Our results can provide important implications by summarizing the following policy suggestions. First, the government should continue to enforce the green credit policy as environmental regulation. According to our empirical results, the green credit policy has a positive contribution to firms’ green transformation development. However, since China’s current environmental regulatory policies are still command-and-control oriented, firms show more passive and stressful responses, while proactive and strategic responses appear to be insufficient. Moreover, the government should change the policy focus from guiding to specific implementation terms to improve the operability of the green credit policy. Further, the government should also clarify the objectives of the green innovation progress effect and pay more attention to the optimal effect of the policy. Moreover, the government should develop suitable policy implementations based on the local firms’ development.
Second, improve the financial constraints and incentives mechanism. In our analysis of the green credit policy’s mechanisms about firms’ green innovation, we find that financing constraints and firm investment positively contribute to firm green innovation transformation. The green credit policy can increase the cost of debt financing for firms, making fewer projects available for heavy-polluting firms to finance and lowering the level of investment. Heavy-polluting firms must accelerate their industrial transformation and upgrade and improve their credit financing capacity to obtain loans from banks. Therefore, in implementing the green credit policy, we should guide firms to improve their financial constraints and to accelerate their transformation and upgrading to achieve sustainable development.
Third, differentiated policies according to the heterogeneity of enterprises. According to our empirical study, the promotion effect of the green credit policy on non-state and small-scale firms is not significant yet. This is mainly because these firms lack policy resources and correct direction guidance compared with state-owned firms and large-scale firms. Therefore, in implementing the green credit policy, appropriate policy terms should be formulated according to the different characteristics of firms to achieve precise positioning. Meanwhile, the limitation of this paper is that the variables may have trend differences that make interference in the identification of the disposition effect. Therefore, we can use the Difference-in-Difference-in-Difference (DDD) model to control the interference of trend differences on the identification of the disposition effect by introducing a new control group to further explore the net effect of the green credit policy on firms’ green technology innovation.
Author Contributions
Conceptualization, D.G. and X.M.; methodology, Y.L.; software, K.D.; validation, D.G., X.M. and Y.L.; formal analysis, D.G.; investigation, X.M.; resources, D.G.; data curation, X.M.; writing—original draft preparation, D.G.; writing—review and editing, K.D.; visualization, X.M.; supervision, K.D.; project administration, Y.L.; funding acquisition, Y.L. All authors have read and agreed to the published version of the manuscript.
Funding
This research received no external funding.
Institutional Review Board Statement
This research is not involved in ethical and no need for ethical approval.
Informed Consent Statement
The study do not involve humans.
Data Availability Statement
The study did not report any data.
Conflicts of Interest
The authors declare no conflict of interest.
References
- Zhang, K.-M.; Wen, Z.-G. Review and challenges of policies of environmental protection and sustainable development in China. J. Environ. Manag. 2008, 88, 1249–1261. [Google Scholar] [CrossRef]
- Gao, D.; Li, G.; Li, Y.; Gao, K. Does FDI improve green total factor energy efficiency under heterogeneous environmental regulation? Evidence from China. Environ. Sci. Pollut. Res. 2021, 1–14. [Google Scholar] [CrossRef]
- Braun, E.; Wield, D. Regulation as a means for the social control of technology. Technol. Anal. Strateg. Manag. 1994, 6, 259–272. [Google Scholar] [CrossRef]
- Sukoharsono, E.G. Green accounting in Indonesia: Accountability and environmental issues. Int. J. Account. Bus. Soc. 2007, 15, 21–60. [Google Scholar]
- Fraj, E.; Martínez, E.; Matute, J. Green marketing strategy and the firm’s performance: The moderating role of environmental culture. J. Strateg. Mark. 2011, 19, 339–355. [Google Scholar] [CrossRef]
- Cecere, G.; Corrocher, N.; Mancusi, M.L. Financial constraints and public funding of eco-innovation: Empirical evidence from European SMEs. Small Bus. Econ. 2020, 54, 285–302. [Google Scholar] [CrossRef] [Green Version]
- Wen, H.; Lee, C.-C.; Zhou, F. Green credit policy, credit allocation efficiency and upgrade of energy-intensive enterprises. Energy Econ. 2021, 94, 105099. [Google Scholar] [CrossRef]
- Zhang, B.; Wang, Y. The Effect of Green Finance on Energy Sustainable Development: A Case Study in China. Emerg. Mark. Financ. Trade 2021, 57, 3435–3454. [Google Scholar] [CrossRef]
- Hao, Y.; Wu, H. The Role of internet development on energy intensity in china: Evidence from a spatial econometric analysis. Asian Econ. Lett. 2021, 1, 17194. [Google Scholar] [CrossRef]
- Xu, X.; Li, J. Asymmetric impacts of the policy and development of green credit on the debt financing cost and maturity of different types of enterprises in China. J. Clean. Prod. 2020, 264, 121574. [Google Scholar] [CrossRef]
- Jaffe, A.B.; Palmer, K. Environmental Regulation and Innovation: A Panel Data Study. Rev. Econ. Stat. 1997, 79, 610–619. [Google Scholar] [CrossRef]
- Hamamoto, M. Environmental regulation and the productivity of Japanese manufacturing industries. Resour. Energy Econ. 2006, 28, 299–312. [Google Scholar] [CrossRef]
- Popp, D. International innovation and diffusion of air pollution control technologies: The effects of NOX and SO2 regulation in the US, Japan, and Germany. J. Environ. Econ. Manag. 2006, 51, 46–71. [Google Scholar] [CrossRef] [Green Version]
- Calel, R.; Dechezleprêtre, A. Environmental Policy and Directed Technological Change: Evidence from the European Carbon Market. Rev. Econ. Stat. 2016, 98, 173–191. [Google Scholar] [CrossRef] [Green Version]
- Ley, M.; Stucki, T.; Woerter, M. The Impact of Energy Prices on Green Innovation. Energy J. 2016, 37. [Google Scholar] [CrossRef] [Green Version]
- Cui, J.; Zhang, J.; Zheng, Y. Carbon pricing induces innovation: Evidence from China’s regional carbon market pilots. AEA Pap. Proc. 2018, 108, 453–457. [Google Scholar] [CrossRef] [Green Version]
- Liu, J.-Y.; Xia, Y.; Fan, Y.; Lin, S.-M.; Wu, J. Assessment of a green credit policy aimed at energy-intensive industries in China based on a financial CGE model. J. Clean. Prod. 2017, 163, 293–302. [Google Scholar] [CrossRef]
- Milani, S. The Impact of Environmental Policy Stringency on Industrial R&D Conditional on Pollution Intensity and Relocation Costs. Environ. Resour. Econ. 2017, 68, 595–620. [Google Scholar] [CrossRef]
- De Haas, R.; Popov, A.A. Finance and Carbon Emissions; European Central Bank: Frankfurt, Germany, 2019. [Google Scholar]
- Blackman, A.; Li, Z.; Liu, A.A. Efficacy of Command-and-Control and Market-Based Environmental Regulation in Developing Countries. Annu. Rev. Resour. Econ. 2018, 10, 381–404. [Google Scholar] [CrossRef] [Green Version]
- Qi, S.Z.; Lin, S.; Cui, J.B. Can environmental equity trading market induce green innovation?--Evidence based on data of green patents of listed companies in China. Econ. Res. 2018, 53, 129–143. [Google Scholar]
- Wang, W.; Wang, D.; Ni, W.; Zhang, C. The impact of carbon emissions trading on the directed technical change in China. J. Clean. Prod. 2020, 272, 122891. [Google Scholar] [CrossRef]
- Hu, J.; Pan, X.; Huang, Q. Quantity or quality? The impacts of environmental regulation on firms’ innovation–Quasi-natural experiment based on China’s carbon emissions trading pilot. Technol. Forecast. Soc. Change 2020, 158, 120122. [Google Scholar] [CrossRef]
- D’Orazio, P. Mapping the emergence and diffusion of climate-related financial policies: Evidence from a cluster analysis on G20 countries. Int. Econ. 2022, 169, 135–147. [Google Scholar] [CrossRef]
- Li, Z.; Liao, G.; Wang, Z.; Huang, Z. Green loan and subsidy for promoting clean production innovation. J. Clean. Prod. 2018, 187, 421–431. [Google Scholar] [CrossRef]
- Wang, E.; Liu, X.; Wu, J.; Cai, D. Green Credit, Debt Maturity, and Corporate Investment—Evidence from China. Sustainability 2019, 11, 583. [Google Scholar] [CrossRef] [Green Version]
- Duan, K.; Ren, X.; Shi, Y.; Mishra, T.; Yan, C. The marginal impacts of energy prices on carbon price variations: Evidence from a quantile-on-quantile approach. Energy Econ. 2021, 95, 105131. [Google Scholar] [CrossRef]
- Hu, G.; Wang, X.; Wang, Y. Can the green credit policy stimulate green innovation in heavily polluting enterprises? Evidence from a quasi-natural experiment in China. Energy Econ. 2021, 98, 105134. [Google Scholar] [CrossRef]
- Su, C.W.; Li, W.; Umar, M.; Lobonţ, O.R. Can green credit reduce the emissions of pollutants? Econ. Anal. Policy 2022, 74, 205–219. [Google Scholar] [CrossRef]
- Liu, X.; Wang, E.; Cai, D. Green credit policy, property rights and debt financing: Quasi-natural experimental evidence from China. Financ. Res. Lett. 2019, 29, 129–135. [Google Scholar] [CrossRef]
- Yao, S.; Pan, Y.; Sensoy, A.; Uddin, G.S.; Cheng, F. Green credit policy and firm performance: What we learn from China. Energy Econ. 2021, 101, 105415. [Google Scholar] [CrossRef]
- Wang, F.; Yang, S.; Reisner, A.; Liu, N. Does Green Credit Policy Work in China? The Correlation between Green Credit and Corporate Environmental Information Disclosure Quality. Sustainability 2019, 11, 733. [Google Scholar] [CrossRef] [Green Version]
- Guo, P. Financial policy innovation for social change: A case study of China’s green credit policy. Int. Rev. Sociol. 2014, 24, 69–76. [Google Scholar] [CrossRef]
- Gao, D.; Li, Y.; Yang, Q. Can pollution charges reform promote industrial SO2 emissions reduction?—Evidence from 189 China’s cities. Energy Environ. 2021, 32, 96–112. [Google Scholar] [CrossRef]
- Cole, M.A.; Elliott, R. FDI and the Capital Intensity of “Dirty” Sectors: A Missing Piece of the Pollution Haven Puzzle. Rev. Dev. Econ. 2005, 9, 530–548. [Google Scholar] [CrossRef]
- Gao, D.; Li, G.; Yu, J. Does digitization improve green total factor energy efficiency? Evidence from Chinese 213 cities. Energy 2022, 247, 123395. [Google Scholar] [CrossRef]
- Männasoo, K.; Meriküll, J. Credit constraints and R&D over the boom and bust: Firm-level evidence from Central and Eastern Europe. Econ. Syst. 2020, 44, 100747. [Google Scholar]
- Yang, J.; Ying, L.; Gao, M. The influence of intelligent manufacturing on financial performance and innovation performance: The case of China. Enterp. Inf. Syst. 2020, 14, 812–832. [Google Scholar] [CrossRef]
- Heckman, J.J. The common structure of statistical models of truncation, sample selection and limited dependent variables and a simple estimator for such models. In Annals of Economic and Social Measurement; NBER: Cambridge, MA, USA, 1976; Volume 5, Number 4; pp. 475–492. [Google Scholar]
- Rosenbaum, P.R.; Rubin, D.B. The central role of the propensity score in observational studies for causal effects. Biometrika 1983, 70, 41–55. [Google Scholar] [CrossRef]
- Amore, M.D.; Bennedsen, M. Corporate governance and green innovation. J. Environ. Econ. Manag. 2016, 75, 54–72. [Google Scholar] [CrossRef]
- Cruz-Cázares, C.; Bayona-Sáez, C.; García-Marco, T. You can’t manage right what you can’t measure well: Technological innovation efficiency. Res. Policy 2013, 42, 1239–1250. [Google Scholar] [CrossRef]
- Tumelero, C.; Sbragia, R.; Evans, S. Cooperation in R & D and eco-innovations: The role in companies’ socioeconomic performance. J. Clean. Prod. 2019, 207, 1138–1149. [Google Scholar] [CrossRef]
- Colombo, M.G.; Croce, A.; Guerini, M. The effect of public subsidies on firms’ investment–cash flow sensitivity: Transient or persistent? Res. Policy 2013, 42, 1605–1623. [Google Scholar] [CrossRef]
- Kyere, M.; Ausloos, M. Corporate governance and firms financial performance in the United Kingdom. Int. J. Financ. Econ. 2021, 26, 1871–1885. [Google Scholar] [CrossRef]
- Cai, X.; Zhu, B.; Zhang, H.; Li, L.; Xie, M. Can direct environmental regulation promote green technology innovation in heavily polluting industries? Evidence from Chinese listed companies. Sci. Total Environ. 2020, 746, 140810. [Google Scholar] [CrossRef] [PubMed]
- Liu, Q.; Qiu, L.D. Intermediate input imports and innovations: Evidence from Chinese firms’ patent filings. J. Int. Econ. 2016, 103, 166–183. [Google Scholar] [CrossRef]
- Serfling, M. Firing Costs and Capital Structure Decisions. J. Financ. 2016, 71, 2239–2286. [Google Scholar] [CrossRef] [Green Version]
- Huergo, E.; Moreno, L. Subsidies or loans? Evaluating the impact of R&D support programmes. Res. Policy 2017, 46, 1198–1214. [Google Scholar] [CrossRef] [Green Version]
- Guo, Y.; Xia, X.; Zhang, S.; Zhang, D. Environmental Regulation, Government R&D Funding and Green Technology Innovation: Evidence from China Provincial Data. Sustainability 2018, 10, 940. [Google Scholar] [CrossRef] [Green Version]
- Su, Z.-Q.; Xiao, Z.; Yu, L. Do political connections enhance or impede corporate innovation? Int. Rev. Econ. Financ. 2019, 63, 94–110. [Google Scholar] [CrossRef]
- Su, D.W.; Lian, L.L. Does green credit affect the investment and financing behavior of heavily polluting enterprises? J. Financ. Res. 2018, 12, 123–137. [Google Scholar]
Figure 1.
Parallel trend hypothesis and dynamic effects test.
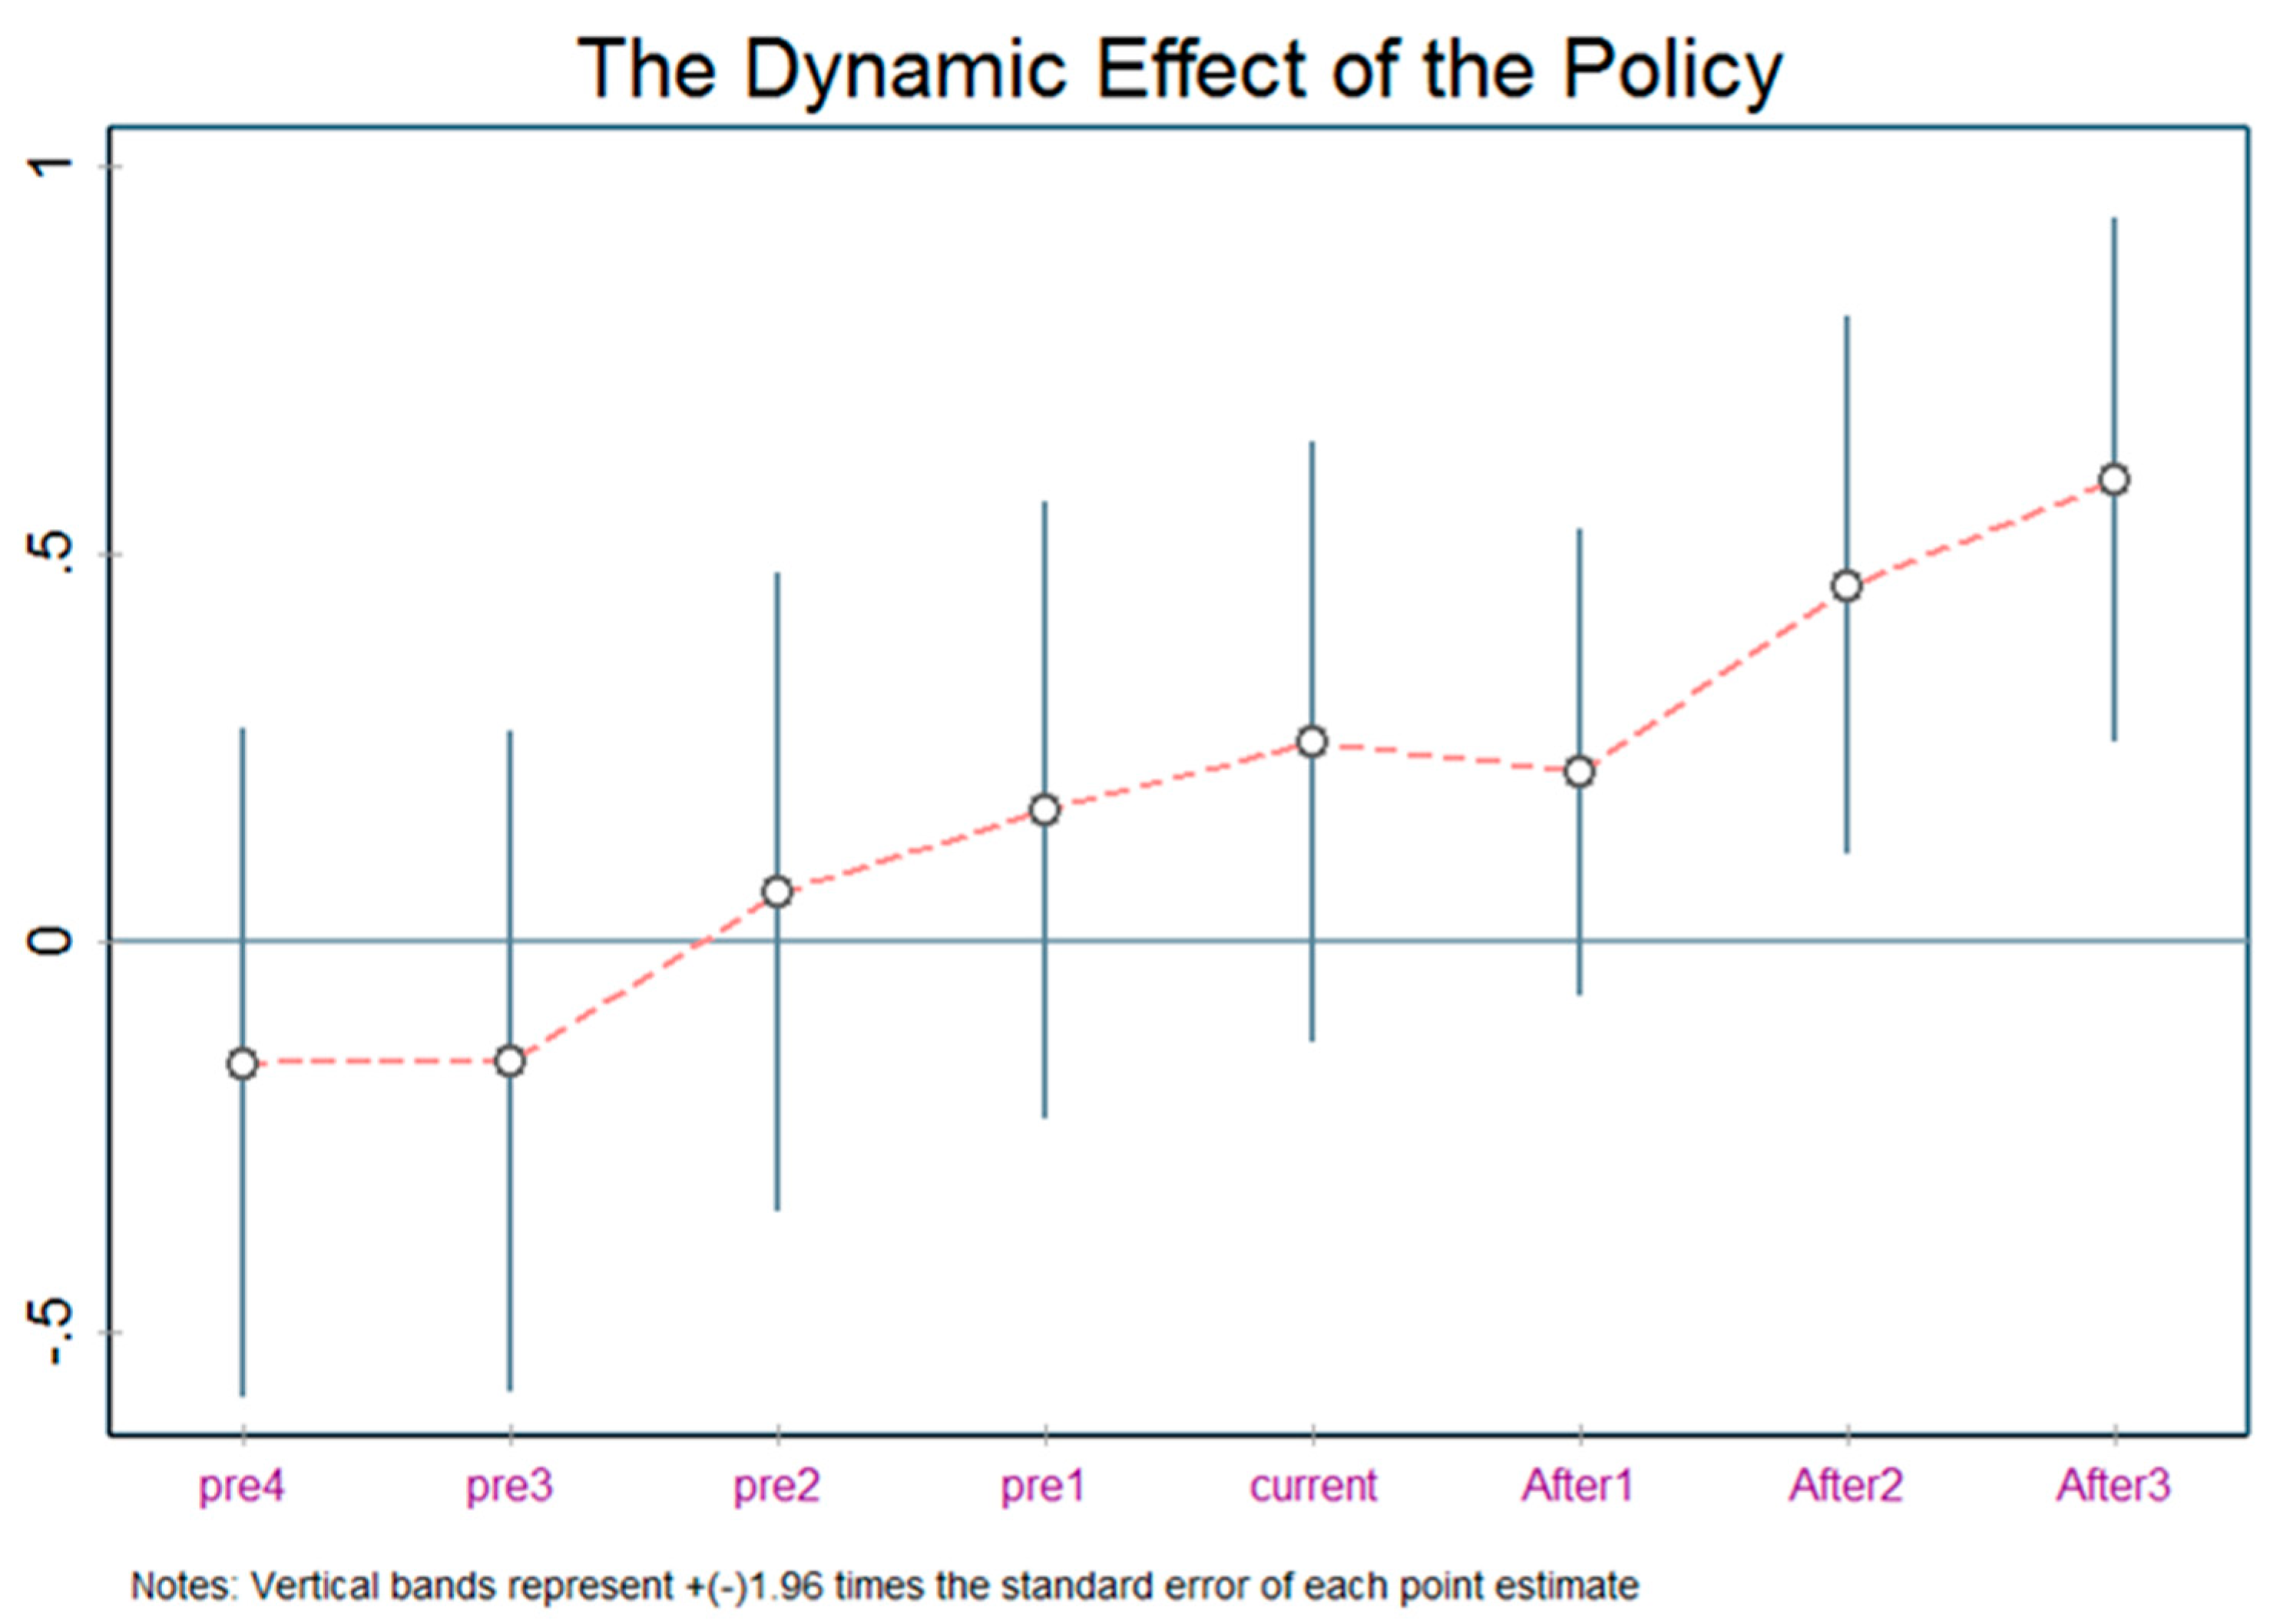
Figure 2.
Placebo test.


Table 1.
The description statistics.
| Variables | Variable Description | (1) | (2) | (3) | (4) | (5) |
|---|---|---|---|---|---|---|
| N | Mean | sd | Min | Max | ||
| GTI | green innovation | 22,607 | 1.741 | 17.58 | 0 | 966 |
| Size | firm size | 22,607 | 22.22 | 1.644 | 10.84 | 31.04 |
| Debt | debt ratio | 22,607 | 0.506 | 1.668 | −0.195 | 142.7 |
| TobinQ | ratio of market value and liabilities | 22,607 | 2.904 | 101.2 | 0.684 | 14,810 |
| ROE | the return on net assets | 22,607 | 0.0632 | 0.586 | −45.48 | 28.65 |
| Employee | number of employees | 22,607 | 7.624 | 1.490 | 1.099 | 13.22 |
Notes: data are from the sources mentioned in this paper.
Table 2.
Baseline regression results.
| Variables | DID | PSM-DID | ||
|---|---|---|---|---|
| (1) | (2) | (3) | (4) | |
| GTI | GTI | GTI | GTI | |
| 0.247 ** | 0.281 ** | 0.296 ** | 0.329 *** | |
| (2.22) | (2.36) | (2.53) | (2.63) | |
| Size | 0.055 * | 0.057 *** | ||
| (1.79) | (2.85) | |||
| Debt | −0.042 | −0.048 | ||
| (−0.18) | (−0.21) | |||
| TobinQ | 0.003 *** | 0.001 ** | ||
| (3.15) | (2.03) | |||
| ROE | 0.005 * | 0.005 ** | ||
| (1.71) | (2.18) | |||
| employee | 0.046 * | 0.045 * | ||
| (1.82) | (1.81) | |||
| Constant | 0.175 * | 1.302 | 0.177 * | 1.336 |
| (1.80) | (0.99) | (1.83) | (1.08) | |
| Firm FE | Yes | Yes | Yes | Yes |
| Year FE | Yes | Yes | Yes | Yes |
| Observations | 22,607 | 22,607 | 20,301 | 20,301 |
| R-squared | 0.110 | 0.123 | 0.121 | 0.230 |
Notes: ***, **, and * indicate the significance at 1%, 5%, and 10% levels, respectively; t statistics are denoted in parentheses; Yes represents the variables are controlled; Control represents the other controlled variables; Firm FE and Year FE are firm fixed effect and time fixed effect, respectively. PSM-DID: propensity score matching and difference-in-difference.
Table 3.
Moderating effects.
| Variables | (1) | (2) | (3) | (4) |
|---|---|---|---|---|
| LR | RD | PSM-LR | PSM-RD | |
| −0.008 *** | 0.398 ** | −0.011 *** | 0.425 *** | |
| (−3.40) | (2.03) | (−3.46) | (3.78) | |
| Constant | −0.293 *** | 2.561 *** | −0.281 *** | 2.610 *** |
| (−10.95) | (5.59) | (−10.31) | (4.73) | |
| Control | Yes | Yes | Yes | Yes |
| Firm FE | Yes | Yes | Yes | Yes |
| Year FE | Yes | Yes | Yes | Yes |
| Observations | 22,607 | 22,607 | 20,115 | 20,026 |
| R-squared | 0.125 | 0.280 | 0.201 | 0.338 |
Notes: *** and ** indicate the significance at 1% and 5% levels, respectively; t statistics are denoted in parentheses; Yes represents the variables are controlled; Control represents the other controlled variables; Firm FE and Year FE are firm fixed effect and time fixed effect, respectively. PSM-LR: the result of LR after running the PSM-DID model; PSM-RD: the result of RD after running the PSM-DID model.
Table 4.
Replacing the explanatory variable.
| Variables | DID | PSM-DID | ||
|---|---|---|---|---|
| (1) | (2) | (3) | (4) | |
| UGTI | IGTI | UGTI | IGTI | |
| 0.162 ** | 0.084 *** | 0.226 *** | 0.120 *** | |
| (2.47) | (3.31) | (3.71) | (2.87) | |
| Constant | 0.257 *** | 0.083** | 7.886 ** | 6.538 ** |
| (3.85) | (2.35) | (2.04) | (2.14) | |
| Control | Yes | Yes | Yes | Yes |
| Firm FE | Yes | Yes | Yes | Yes |
| Year FE | Yes | Yes | Yes | Yes |
| Observations | 22,607 | 22,607 | 19,583 | 20,221 |
| R-squared | 0.108 | 0.216 | 0.119 | 0.299 |
Notes: *** and ** indicate the significance at 1% and 5% levels, respectively; t statistics are denoted in parentheses; Yes represents the variables are controlled; Control represents the other controlled variables; Firm FE and Year FE are firm fixed effect and time fixed effect, respectively. DID: difference-in-difference; PSM-DID: propensity score matching and difference-in-difference.
Table 5.
Heterogeneity analysis.
| Variables | (1) | (2) | (1) | (2) |
|---|---|---|---|---|
| State-Owned | Non-State-Owned | L-Scale | S-Scale | |
| 0.545 *** | 0.103 | 0.436 ** | 0.332 | |
| (2.78) | (1.31) | (2.33) | (1.57) | |
| Constant | −2.812 *** | 1.910 | −2.812 ** | 1.910 *** |
| (−2.64) | (0.62) | (−2.04) | (3.26) | |
| Control | Yes | Yes | Yes | Yes |
| Firm FE | Yes | Yes | Yes | Yes |
| Year FE | Yes | Yes | Yes | Yes |
| Observations | 7495 | 15112 | 11297 | 11310 |
| R-squared | 0.226 | 0.314 | 0.326 | 0.314 |
Notes: *** and ** indicate the significance at 1% and 5% levels, respectively; t statistics are denoted in parentheses; Yes represents the variables are controlled; Control represents the other controlled variables; Firm FE and Year FE are firm fixed effect and time fixed effect, respectively. DID: difference-in-difference; PSM-DID: propensity score matching and difference-in-difference.
Publisher’s Note: MDPI stays neutral with regard to jurisdictional claims in published maps and institutional affiliations. |
© 2022 by the authors. Licensee MDPI, Basel, Switzerland. This article is an open access article distributed under the terms and conditions of the Creative Commons Attribution (CC BY) license (https://creativecommons.org/licenses/by/4.0/).
Share and Cite
MDPI and ACS Style
Gao, D.; Mo, X.; Duan, K.; Li, Y. Can Green Credit Policy Promote Firms’ Green Innovation? Evidence from China. Sustainability 2022, 14, 3911. https://doi.org/10.3390/su14073911
AMA Style
Gao D, Mo X, Duan K, Li Y. Can Green Credit Policy Promote Firms’ Green Innovation? Evidence from China. Sustainability. 2022; 14(7):3911. https://doi.org/10.3390/su14073911
Chicago/Turabian StyleGao, Da, Xinlin Mo, Kun Duan, and Yi Li. 2022. "Can Green Credit Policy Promote Firms’ Green Innovation? Evidence from China" Sustainability 14, no. 7: 3911. https://doi.org/10.3390/su14073911
Note that from the first issue of 2016, this journal uses article numbers instead of page numbers. See further details here.