Article

Current Density Limit of DC Grounding Facilities Considering Impact on Zebrafish (Brachydanio rerio)

1
School of Electrical Engineering and Automation, Wuhan University, Wuhan 430072, China
2
State Grid Liaoning Electrical Power Company Limited, Shenyang 110000, China
3
China Electric Power Research Institute, Wuhan 430072, China
*
Author to whom correspondence should be addressed.
Sustainability 2022, 14(7), 3942; https://doi.org/10.3390/su14073942
Submission received: 8 October 2021 / Revised: 4 November 2021 / Accepted: 21 March 2022 / Published: 26 March 2022
(This article belongs to the Topic Industrial Engineering and Management)

Abstract

:
Grounding facilities, including high-voltage DC grounding electrodes and auxiliary anodes in impressed current cathodic protection systems, inject current into the ground. This study developed an experimental platform to determine the safe limit of current density for such facilities through an analysis of fish behavior on the platform. Zebrafish (Brachydanio rerio) were selected for the experiment and placed in a tank; two rod electrodes were used to inject direct current into the water. A wireless camera was focused on the water tank to video record possible changes in fish behavior. The output voltage of the DC power source was varied, and the trajectories of the fish under various direct current fields were recorded. A tracking program was developed to analyze the trajectories and quantify the behavior of the fish. A new method combining the trajectories of fish samples with the results of current density calculations for analysis was proposed. Results demonstrated that the zebrafish could sense current in the water and turn when exposed to certain current densities. The intensity of the current at the turning points was statistically analyzed, and the threshold of current density at which the fish could no longer tolerate the current and turned was 0.4231 A/m2.

1. Introduction

Direct current grounding facilities have become increasingly common due to the rise in the construction of industrial projects. An essential aspect of these projects is the application of high-voltage direct current (HVDC) grounding electrodes. They work under either a bipolar symmetrical mode or a monopolar mode. When HVDC grounding electrodes operate under a monopolar mode, the transmission system uses the ground as a return path for the current, and an extremely high operating current is injected into the ground [1]. In addition to HVDC grounding electrodes, sources of underground direct current include impressed current cathodic protection systems [2] and traction power systems in urban rail transit [3,4].
Both grounding electrodes and auxiliary anodes are constructed directly in the ground, and the current they release into the earth may affect the surrounding fauna, especially fish in nearby rivers or ponds. Because water has higher conductivity than soil does, the current passing through may be larger and may thus affect the lives of fish. Several scholars have studied the effects of electromagnetic fields on fish. Some of them have focused on electric fishing because it has become widely practiced over the past century, and some [5,6,7] have focused on electric anesthesia. Others have focused on the electromagnetic effects of practical engineering projects on fish. Research [8,9,10] on the effects of electromagnetic fields generated by offshore wind farms on fish has demonstrated that the location of some fish within the geomagnetic field may be disturbed, and physiological effects may occur. Scholars [11,12] have studied response patterns and relative thresholds associated with fish behavior under weak, uniform electric fields, dipole electric fields, and magnetic fields. One study [13] explored the threshold index of the response of confined fish to electric fields; the study results indicated that with an increase in electric field intensity and rate, the threshold of the fish’s reaction decreased but the threshold of electric shock gradually increased.
A limit on current density in open waters has been outlined by some organizational standards. For example, according to the standards stipulated by the International Council on Large Electric Systems (CIGRE) [14], a global organization for sharing power system expertise, and the International Electrotechnical Commission (IEC), a global organization for establishing electrotechnology standards [15], the value of safe current density for grounding electrodes in open waters is 6–10 A/m2. This value can be relaxed to 40–50 A/m2 if protective measures have been implemented to restrict the movement of the living creatures in the area. However, these values were obtained through calculations based on the safe current threshold for humans, with no reference to aquatic organisms. According to the CIGRE standards, methods of video monitoring and seabed sediment tests were used to find out the effects of sea electrodes on marine fauna [16,17,18]. Several studies [19,20,21,22] on HVDC grounding electrodes have provided solutions to application problems and a reference for construction. However, these studies have mainly focused on the electrical parameters or temperature rise characteristics of HVDC electrodes [23,24,25]. Some studies [26,27] have focused on the effects of HVDC electrodes on nearby industrial facilities, such as buried pipelines and AC transformers [28,29,30], but have not discussed the ecological impact of those facilities. With the strengthening of the public’s environmental consciousness, conducting research on this aspect of grounding facilities has become imperative. The route of the SwePol Link Transmission Line, for example, was changed due to protests by local communities concerned about its ecological effects [10].
Studies on electromagnetic influences on fish have mainly involved direct observation of the fish’s behavior, which limits accuracy and can be affected by personal bias. Moreover, most of these studies have mainly focused on electric fishing and electric anesthesia, which can be lethal to fish. The few studies conducted on fish behavior influenced by electromagnetic fields have mainly discussed the influence of renewable energy sources on the ocean and magnetic prospection, which involves different circumstances than those associated with underground direct current fields in water. Accordingly, to determine the degree of influence and the influence threshold of underground direct current on the behavior of fish, the present study designed an object tracking program and an experimental platform that could create uneven current fields in water. Zebrafish were chosen as the fish for the experiment. The changes in trajectory of the fish under different applied voltage levels were recorded. The relationship between the current density and the fish behavior was analyzed, and a threshold for ecological protection was calculated. The results of this study may serve as a reference for the drafting and revision of related standards.

2. Materials and Methods

An experimental platform was designed to measure the influence of electric current on fish behavior. To precisely define and quantify the swimming behavior of the fish, a wireless camera was used to record the movement of the fish throughout the experiment. The recording was later processed by an object recognition and tracing program.

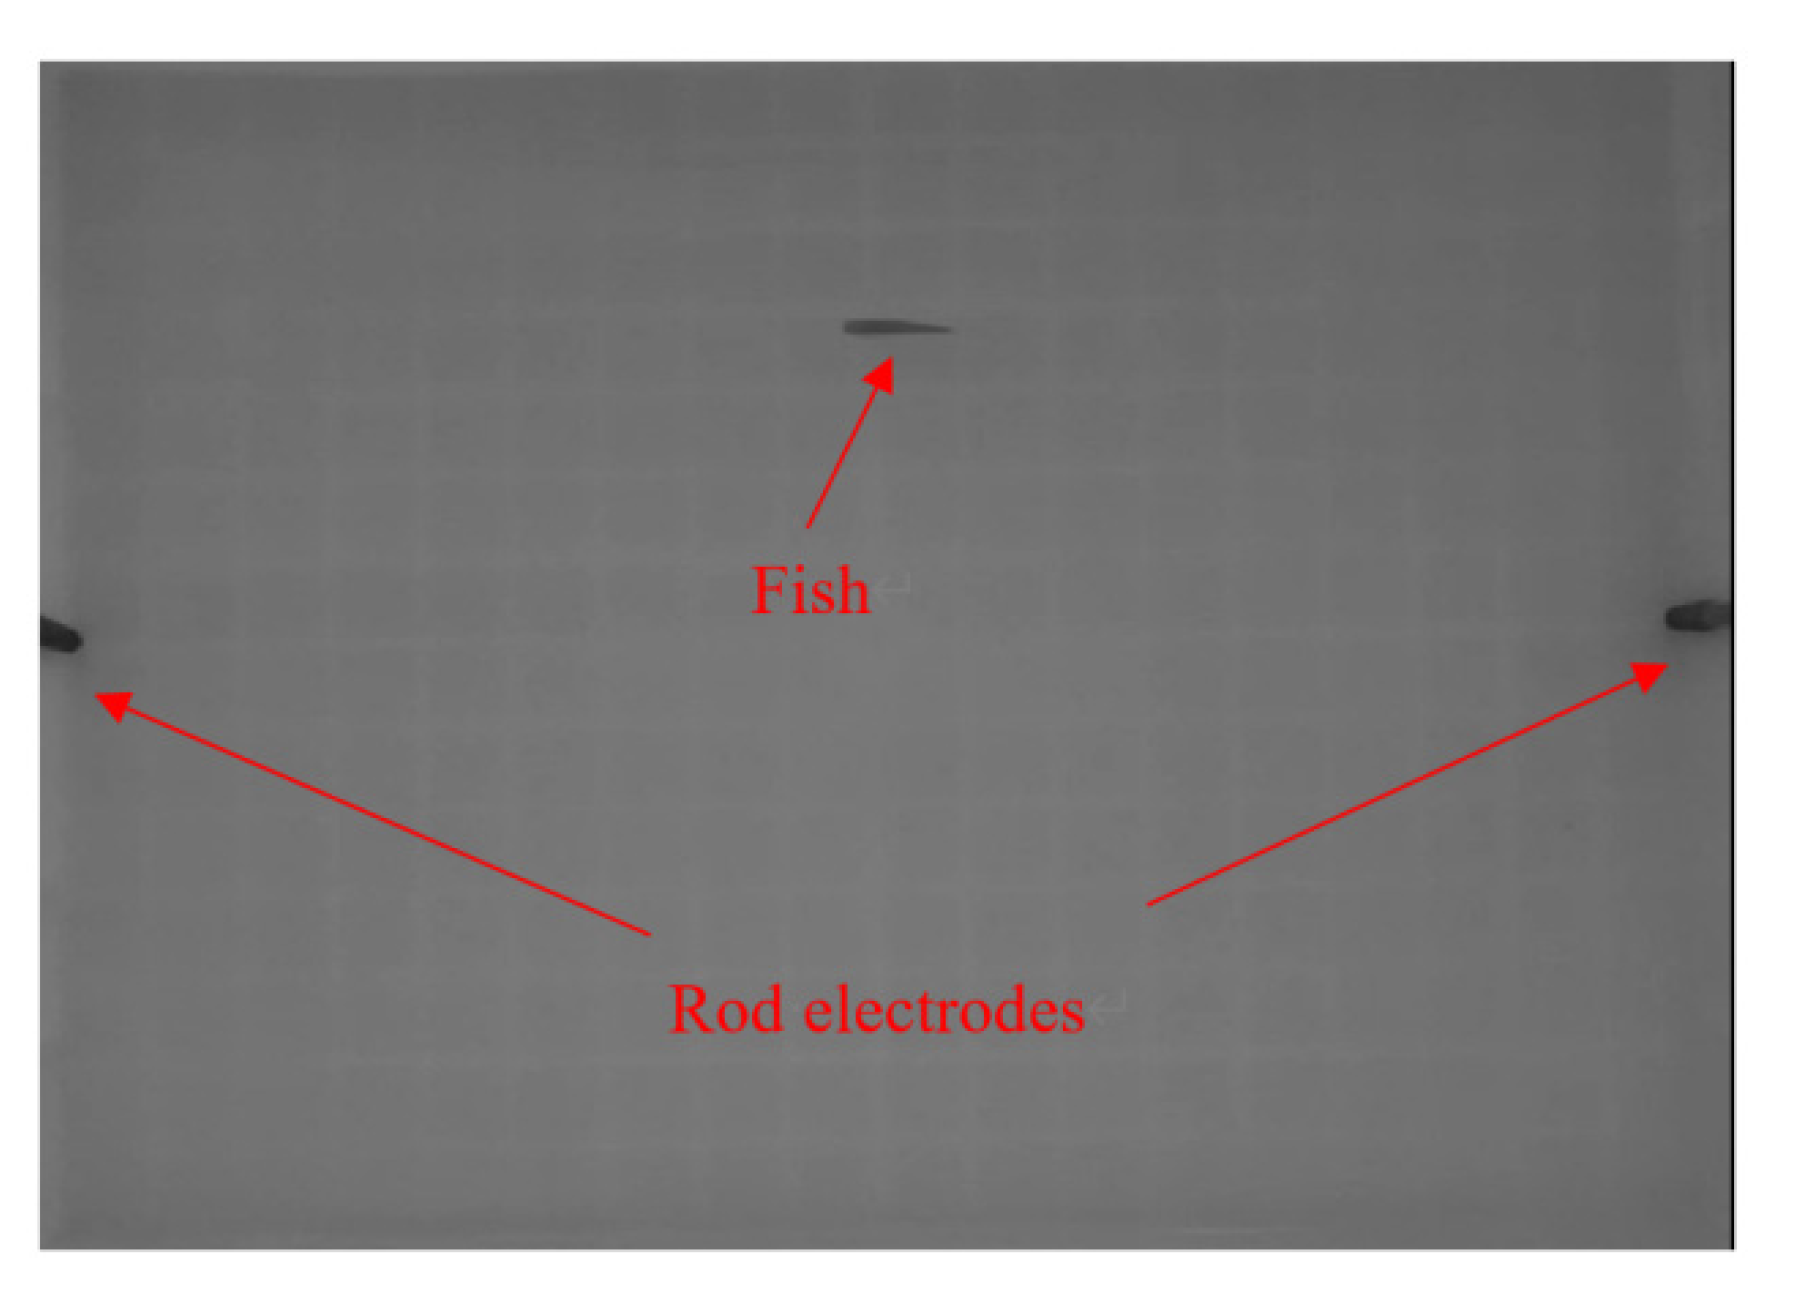
2.1. Design of Experiment

A water tank with a length of 44 cm and width of 30.5 cm was used as a swimming area for the fish in the experiment. Two stainless steel rod electrodes, each with a radius of 6 mm, were attached at the center of both sides of the water tank. These electrodes were connected to the positive and negative ports of a DC power source. The power source could sustain a stable output of 100 V voltage and 1 A current. The wireless camera was attached to a tripod to record an overhead view of the tank. The complete arrangement of the experimental platform is displayed in Figure 1.
Purchased from an aquaculture market, the zebrafish used in the experiment were 6 months old. Their body length was 3.2 ± 0.2 cm. The sex ratio was 1:1. They were domesticated in dechlorinated water for 15 days, with a water pump adding oxygen and circulating filtration. The photoperiod was 12 h. All zebrafish were fed once a day. Parameters of water quality were tested, and the results can be seen in Table 1. The whole raising process met the zebrafish raising requirements in standard GB/T 9649-2020 [31], including the water condition and environment condition.
Feeding was stopped for the zebrafish 24 h before the start of the experiment. The procedure of the experiment was as follows: A single zebrafish was released into the water tank first. The height of the water layer in the tank was maintained at 3.5 cm to ensure free swimming of the zebrafish and to avoid violent vertical movement. Time was provided for the zebrafish to become familiar with the new environment. When the zebrafish began to swim along the sides of the water tank uniformly, the experiment began. All researchers left the room to avoid creating external sound that may affect the behavior of the zebrafish. The wireless camera recorded the zebrafish swimming behavior for 10 min before the DC was applied to the electrodes as a control group. Subsequently, DC voltages of 5, 10, 15, 20, and 25 V were applied to the electrodes, and uneven current fields appeared in the water. The camera recorded the swimming behavior of the fish under uneven current fields for 10 min. A 3-min interval was set between the various voltage applications to allow the zebrafish time to recover from the effects of the electricity.

2.2. Choice of Fish

The choice of fish was essential to the design of the experiment. Several fish species are commonly used in biological experiments. Among these, zebrafish (Brachydanio rerio) are the most frequently used. Zebrafish are widely used in embryology, developmental biology, genetics, molecular biology, toxicology, environmental science, experimental oncology, pharmacology, physiology, endocrinology, and immunology research. The zebrafish, which is native to India, is a small tropical fish. The length of an adult is approximately 3–5 cm. The zebrafish matures in 3 months and can spawn hundreds of eggs every 2 weeks.
The ideal species of fish to use in the experiment had to meet the following requirements:
  • Short in length to ensure that the length of the water tank used in the experiment would not affect the fish behavior and that the fish would be able to swim freely;
  • Small in size, which is convenient for breeding, domestication, and experimental purposes;
  • Lacking sensitivity to water quality to ensure that survival behaviors would not be triggered by slight changes in water quality;
  • Present in abundance, meaning not rare or endangered, to ensure that the species could be easily obtained.
The zebrafish was chosen because it met these requirements and due to its current frequency of use in research, which provides reliable research experience to draw from. In addition, the genetic similarity between zebrafish and humans is as high as 87%, with zebrafish being very similar to humans in terms of development mechanisms and genomes. Zebrafish are recommended by the International Organization for Standardization, an organization devoted to developing standards across disciplines, to test fish toxicity.

2.3. Processing Program for Object Recognition and Tracking
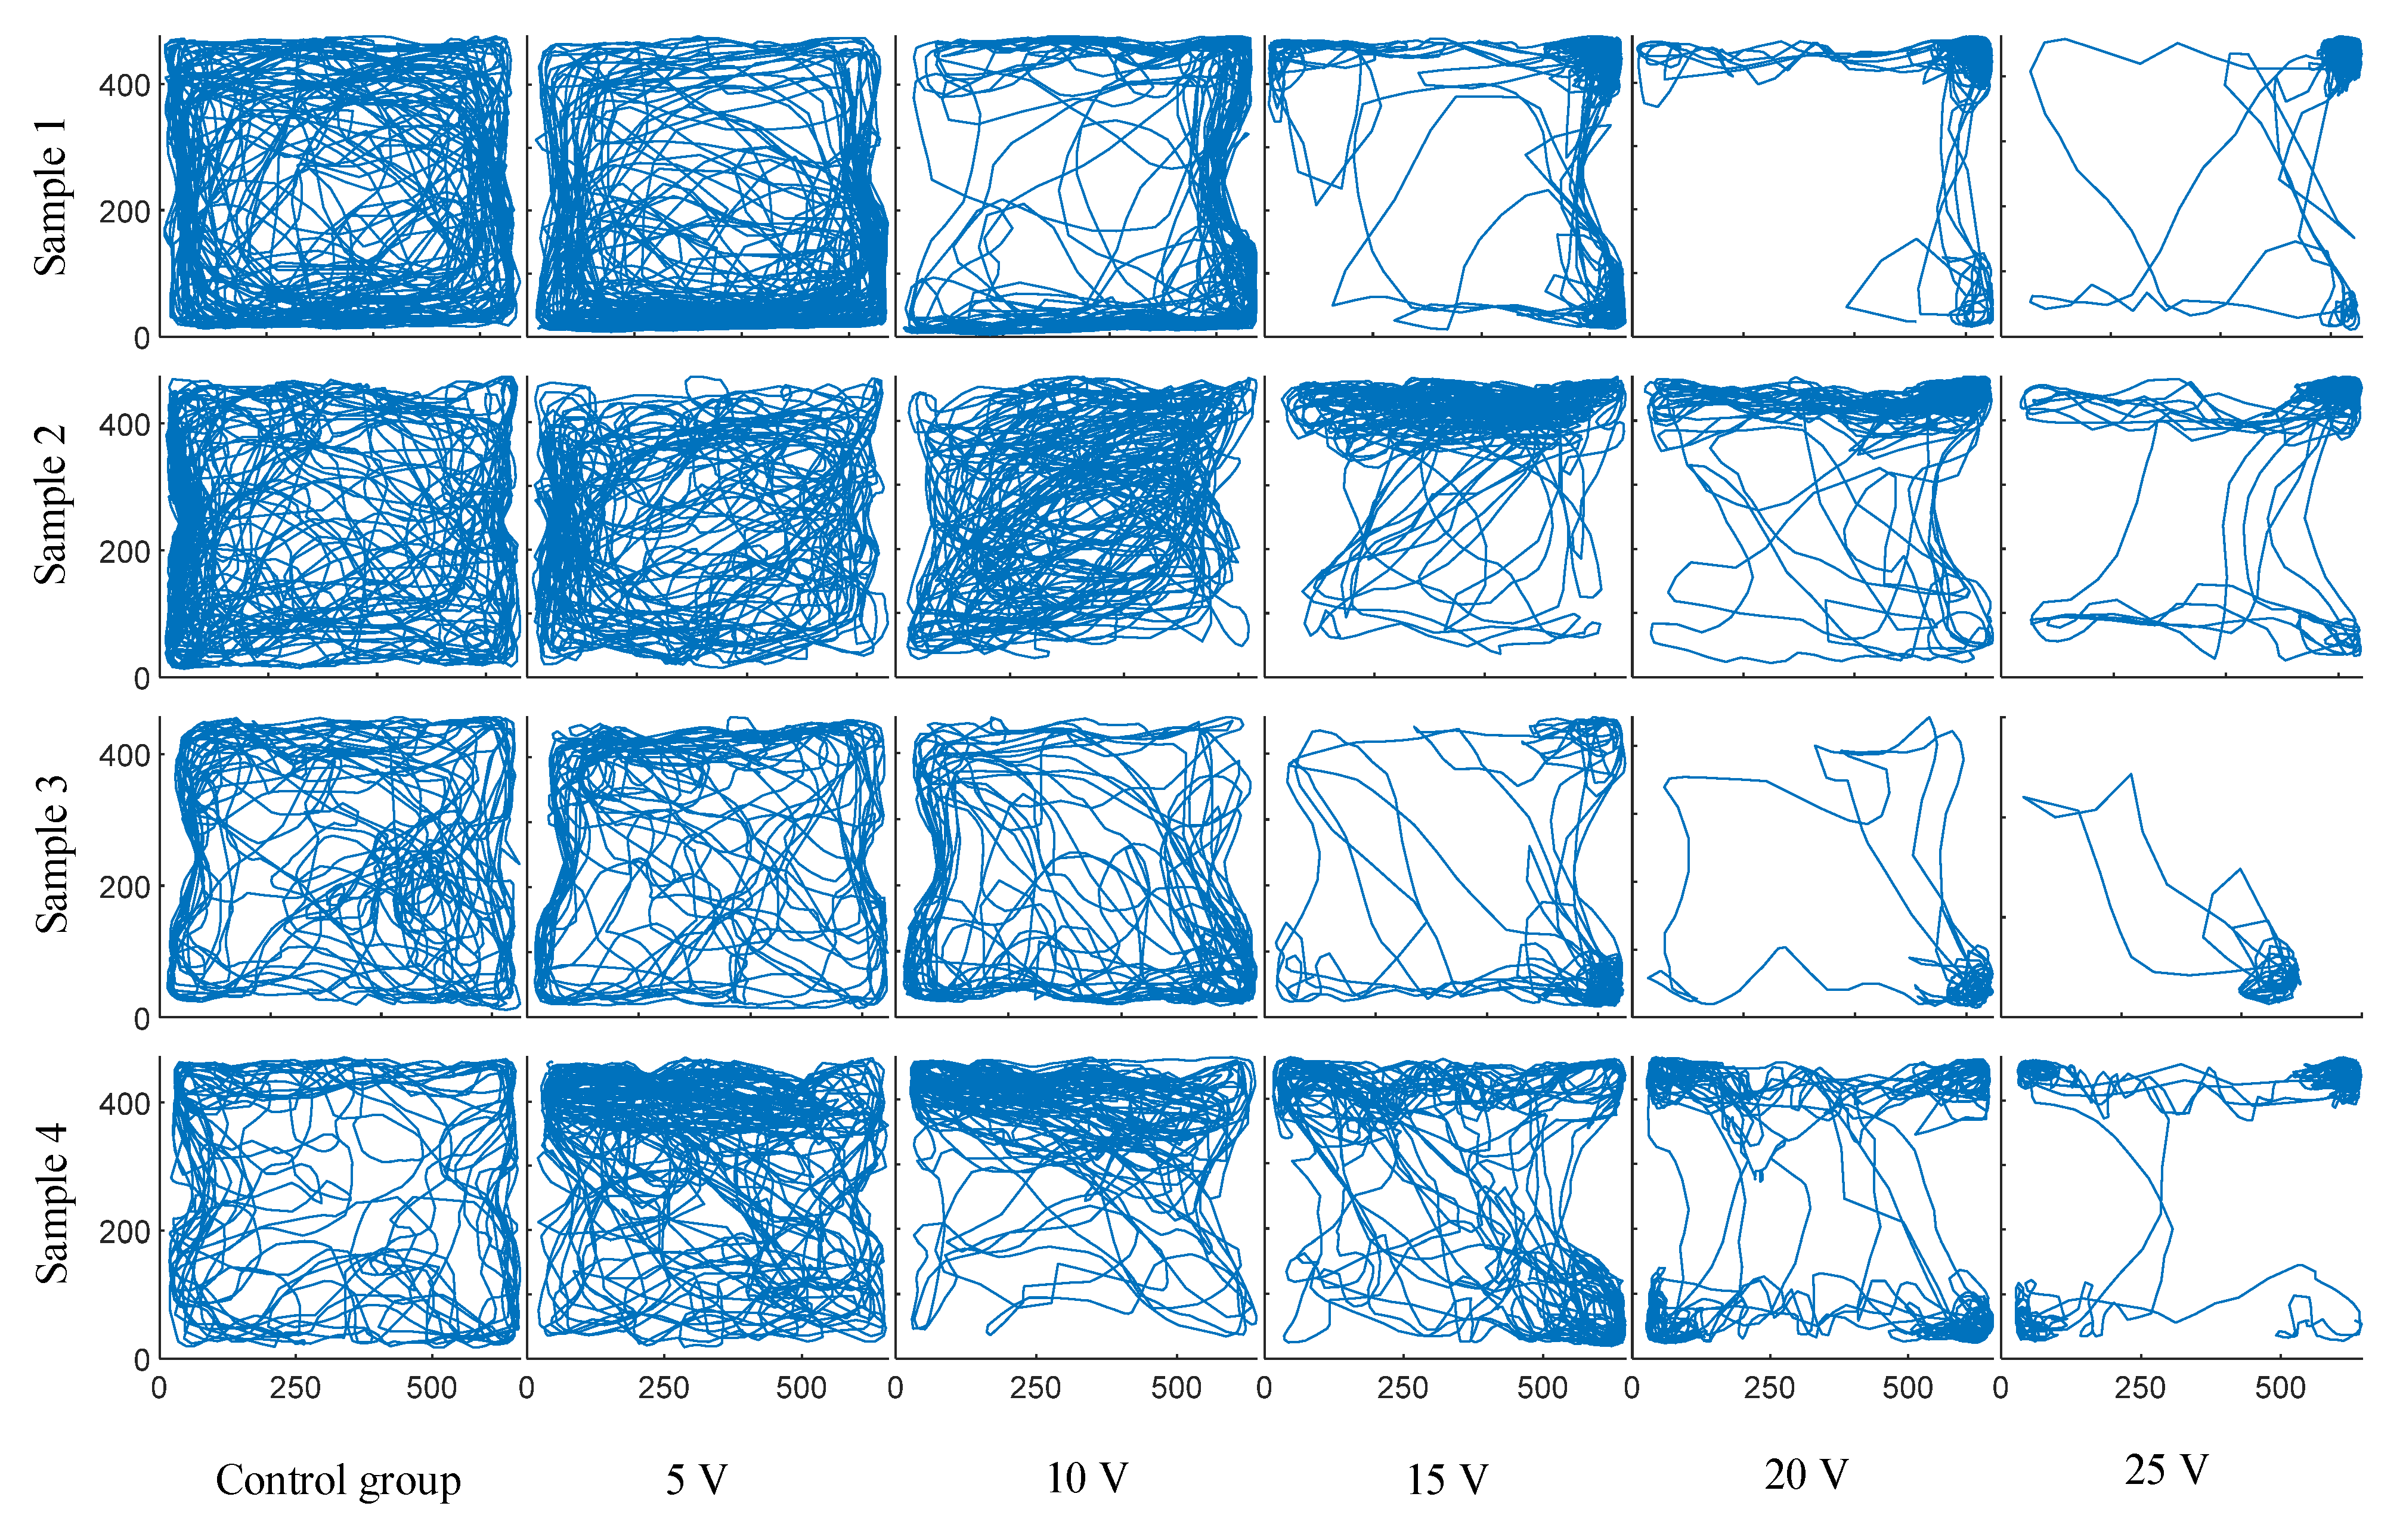
With the development of object recognition and path tracking systems, research on behavioral analysis has become easier and more accurate. Such systems have been used in research concerning online pollution monitoring, toxicology, and environmental sciences. A previous study [32] developed a computer image processing system for quantifying zebrafish behavior; a charge-coupled device camera and image I/O interface were used to recognize the moving image of the zebrafish. Another study [33] used high-throughput video tracking technology to detect the spontaneous movement, panic responses, and recovery ability of zebrafish embryos and juveniles under low-dose cadmium exposure.
The main methods used for object recognition are target recognition based on interframe differences, target recognition based on background differences, and target recognition based on an optical flow equation. On the basis of an evaluation of these three methods, this study determined that the water tank provided a static background and that the method based on background differences would provide better results under this static background. Accordingly, the method based on background differences was considered to be more consistent with the video analysis of the experiment and was thus selected.
The recorded color videos were converted to grayscale videos. A grayscale background was constructed using a statistical background model-based estimation method. The average gray value R and gray value variance C of every pixel for a given period was calculated. Pixels that met the condition outlined in Equation (1) were extracted. The average of the gray values of these extracted pixels was considered the gray value of the background.
| R ( x , y ) B ( x , y ) | < C ( x , y ) ,
where B(x, y) is the gray value of a background image pixel, R(x, y) is the average gray value of the pixel in a given period, and C(x, y) is the gray value variance of the pixel in a given period. Figure 2 presents a frame from the video recording.
Although a background may be static, slight variations caused by subtle changes in the illumination of the environment are inevitable. To obtain more accurate results, the background must be updated over time. Therefore, this study used a background updating method based on a median function. Only pixels whose change was smaller than the calculated variance C were updated. The update formula is expressed as follows:
B t ( x , y ) = M e d i a n ( I t ( x , y ) , I t 1 ( x , y ) , I t ( n 1 ) ( x , y ) , w b B t 1 ( x , y ) ) ,
where It(x, y) represents the pixels with a change in gray value smaller than the variance C, and wb represents the weight of the update with a range between 0.8 and 0.85 to ensure the results are more stable.
Once the background is formed, object recognition can be executed. The target is segmented by the difference between the current fame and the background frame:
D ( x , y ) = | N ( x , y ) B ( x , y ) | ,
where N(x, y) is the grayscale value of the current frame, B(x, y) is the grayscale value of the background frame, and D(x, y) is the differential image between the grayscale value of the current frame and the grayscale value of the background frame.
Pixels are classified into foreground and background using the grayscale of the differential image. The assessment formula is expressed as follows:
Y ( x , y ) = { 0 1 if   D ( x , y ) < T if   D ( x , y ) T ,
where Y(x, y) is the logical set of all pixels in a frame, D(x, y) is the differential image between the grayscale of the current frame and the grayscale of the background frame, and T is the segmental threshold of the grayscale value.
The threshold T is self-adaptive and defined through the Otsu algorithm. The main purpose of the Otsu algorithm is to determine the segmental threshold T within the gray value range (0–255) that ensures a maximum interclass variance between the two gray value sets segmented by the threshold. This threshold T is the best segmental threshold under self-adaptive segmentation. The probability (weight) of the grayscale distribution of the two pixel sets separated by the threshold T with the grayscale variable T is expressed as follows:
ω 1 ( t ) = i = 0 T p i , ω 2 ( t ) = i = T 255 p i ,
where ni is the number of pixels with a grayscale value of i, and N is the total number of pixels in a frame. The average grayscale value of the two sets of pixels is as follows:
u 1 ( t ) = i = 0 T i p i ω 1 ( t ) , u 2 ( t ) = i = T 255 i p i ω 2 ( t ) .
The interclass variance of the grayscale values of the two sets of pixels is expressed as follows:
σ 2 ( t ) = ω 1 ( t ) ( u 1 ( t ) u T ) 2 + ω 2 ( t ) ( u 2 ( t ) u T ) 2 ,
where u T = i = T 255 i p i in Equation (7). When the interclass variance is at its maximum, the threshold T is the best self-adaptive threshold:
T = arg max 0 t 255 { σ 2 ( t ) } .
When the threshold is obtained, pixels in a frame are divided into two sets; all object pixels (foreground pixels) are assigned a logical value of 1, and all background pixels are assigned a logical value of 0. Figure 3 presents the results of recognition after self-adaptive segmentation.
Because the object area was separated, the location of its centroid could be found. The recorded swimming path and speed for the entire video could then be calculated. To reduce the computational load and time, a search box whose center was the object centroid of the last frame was used. Only pixels inside the search box were processed. In Figure 3, the red rectangle indicates the search box, the red dot indicates the centroid representing the location of the moving object, and the blue rectangle indicates the bounding box of the object area.

3. Results

Four zebrafish specimens (numbered 1–4) were used in the experiment. Four samples were chosen to evaluate the feasibility of the new method and to ensure relative universality. After video recording the control group and five experimental groups under different applied voltage conditions, the swimming trajectories of the zebrafish were recorded. Figure 4 illustrates the results; the four rows represent the trajectories of the four zebrafish specimens under the different applied voltage conditions, and the six columns represent the trajectories under the different applied voltage conditions. In the control group, no voltage was applied to the electrodes. All sample data and the corresponding experiment data were used for analysis. No experiment units or data points were excluded.
As indicated in Figure 4, when no current was passed through the water, the trajectories of the zebrafish were evenly distributed along the edge of the tank. This is consistent with normal fish behavior. Fish swim along the edge of a limited container and turn when they are confronted with the four corners. When 5 and 10 V were applied to the electrodes, slight changes were observed in the trajectories of the fish. The path of movement was concentrated more on one side of the tank and appeared uneven. Greater changes in the behavior of the zebrafish occurred when 15 V was applied to the electrode. The zebrafish then preferred the four corners to the other areas of the tank due to the current density there being the lowest. This preference became more pronounced as the voltage increased. Most notably, when 25 V (the highest voltage) was applied to the electrodes, the trajectories mainly appeared at the four corners, and paths crossing into the central area and near the electrodes were rare.
These results indicate that electrical current in water may have a direct and clear effect on the behavior of fish. However, under conditions involving a low current density, the effects may be weak. Distinct behavioral changes occur when the current density reaches a certain level. To ascertain the specific degree of impact and the influencing threshold, this information must be further analyzed.

4. Discussion

The results obtainable through the video object recognition and tracking program provide only direct and apparent information for analysis. To further demonstrate the changes in the swimming behavior of the zebrafish due to electrical current fields, the trajectory data were analyzed statistically.

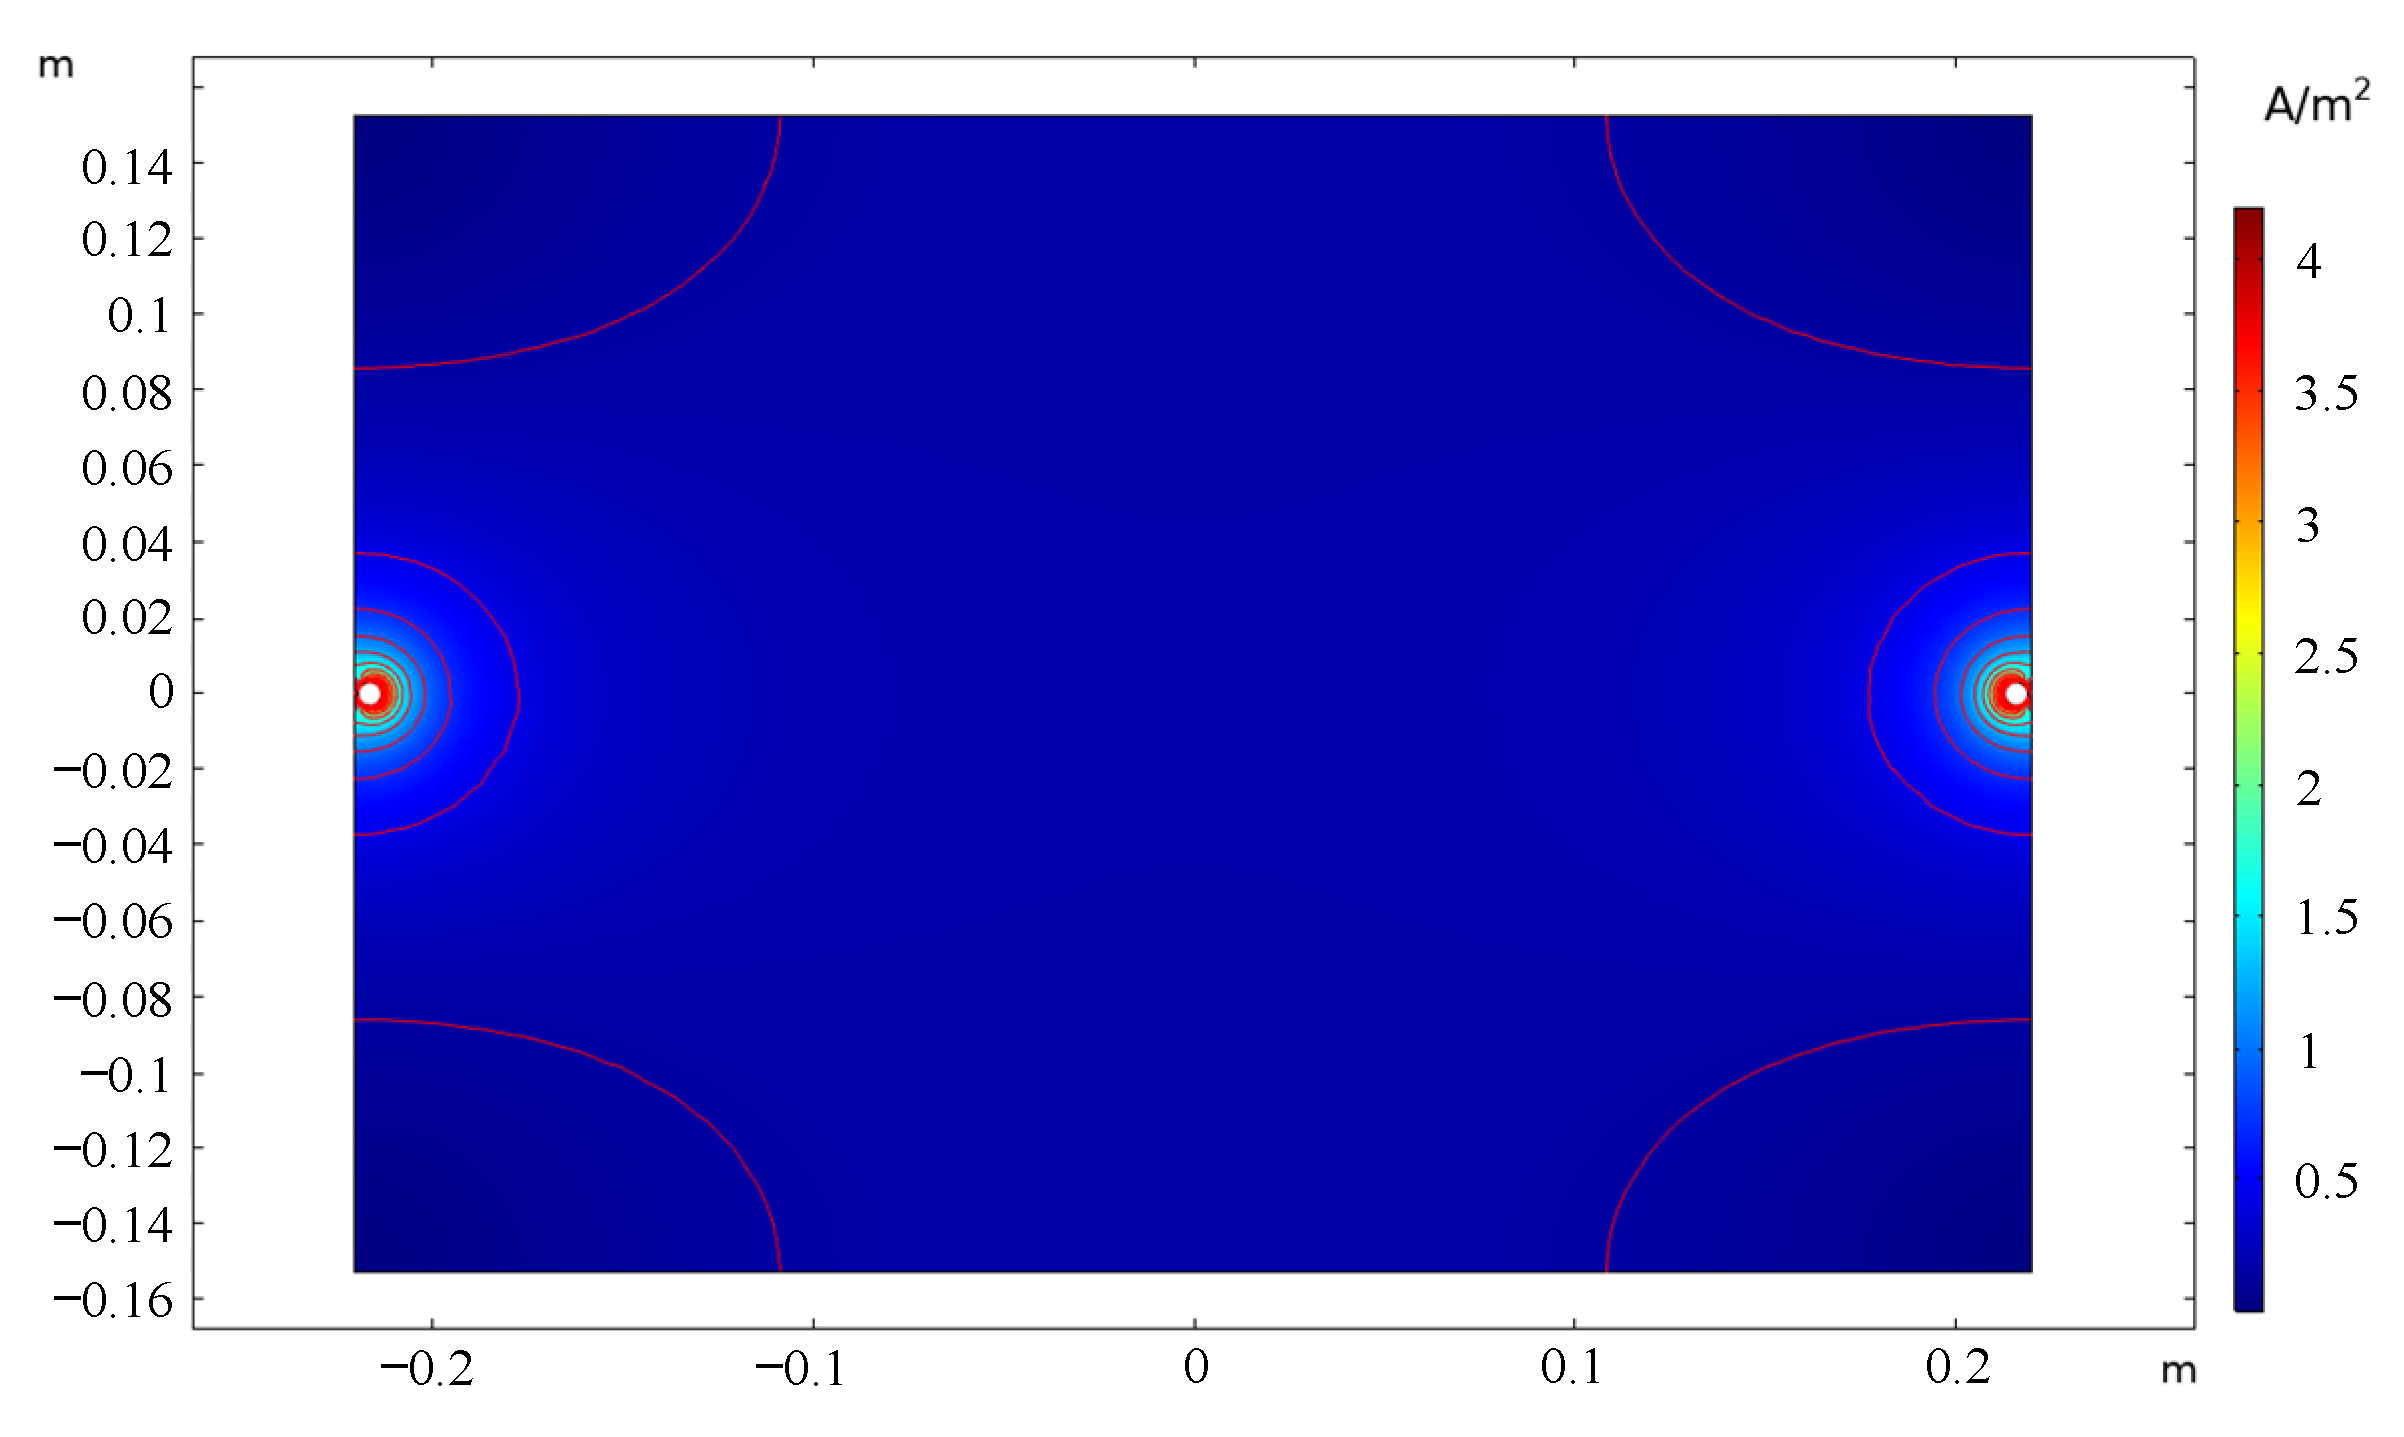
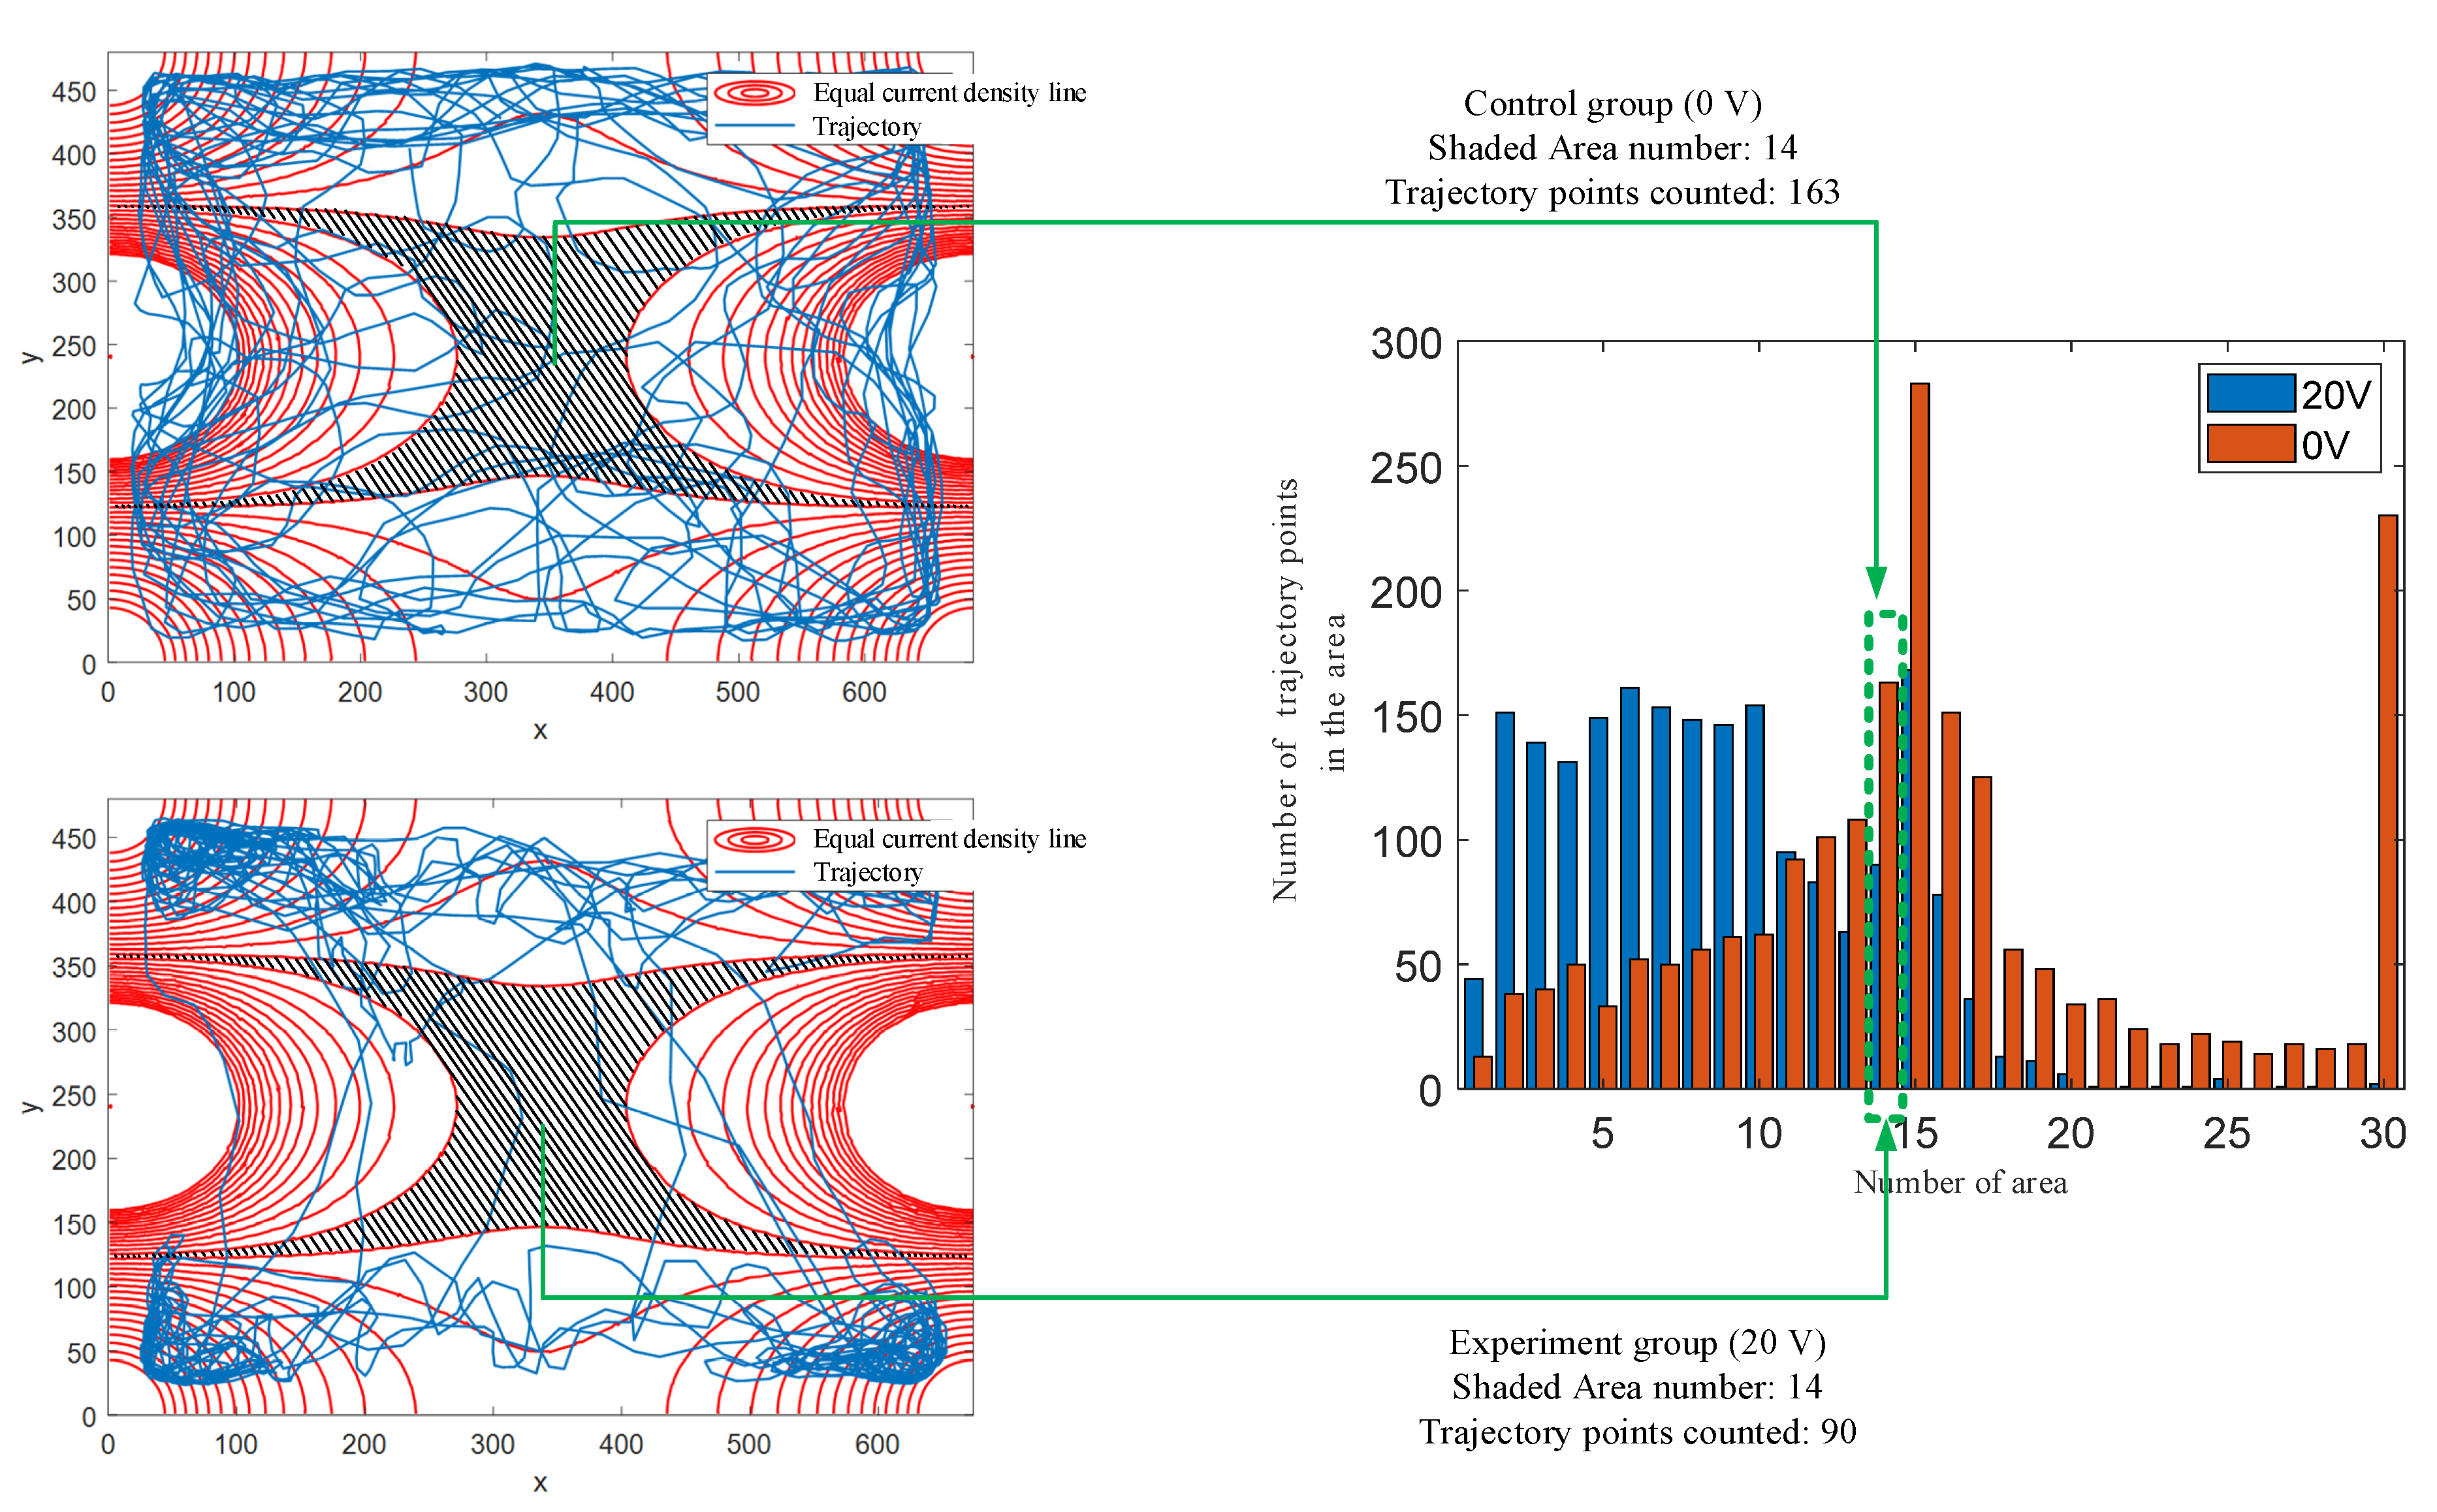
4.1. Statistical Analysis of Trajectory Changes through Current Density Calculation

First, the space distribution of the current density was calculated using the finite element method. The conductivity of the water was 0.03 S/m, and the relative permittivity was 80. The calculation was performed by a static current field solver. Figure 5 illustrates the distribution of the current density when 5 V was applied to the electrodes.
The results revealed that the current density was extremely high in the areas near the electrodes (Figure 5). However, the current density decreased greatly as the distance from the electrodes increased. The current density in the central area was nearly constant. Therefore, the current field in the central area was considered to act like a uniform field. The lowest current density occurred in the four corners of the water tank.
On the basis of the calculation results, the corresponding current densities (from the lowest to the highest value) across all trajectory points were divided evenly into 30 sections. The entire tank was then divided into 30 areas with equal lines of current density. The divided areas were numbered from 1 to 30, with a higher number indicating a lower current density in the relevant area. Subsequently, the trajectories of the control and experimental groups under the different voltages were mapped onto the divided space. The trajectory points in each area were then counted and summarized. Figure 6 illustrates how the area was divided, how the area was numbered, how the trajectories of the control and experimental groups were mapped onto the divided area, and how the trajectory points were counted.
Through the aforementioned statistical analysis method, the results obtained for all experimental groups under different applied voltage conditions were compared with those obtained for the control group. Because the current density distribution space was different under different voltages, the area divisions were also not the same. Consequently, the statistical results could not be compared between the experimental groups subjected to different voltages. The results obtained for the experimental groups could only be compared separately with those obtained for the control group. As indicated in Figure 6, the area divisions were uneven in different parts, and the trajectories were distributed unevenly throughout the tank because the swimming trajectories were mostly along the sides under natural conditions. Therefore, the statistical results were not even in all areas. Figure 7 presents the statistical results obtained for the four zebrafish specimens.
The statistical results obtained for the control group (Figure 6 and Figure 7, red bars) represent the distribution of the trajectory points under natural conditions, where no electrical current influenced the behavior of the fish. The distributions of the trajectory points in the experimental groups (Figure 6 and Figure 7, blue bars) differed from that in the control group, signifying that the normal swimming behavior of the zebrafish was affected by the electrical current applied in the water, with a greater difference in counting results indicating a greater influence from the current. When 5 V was applied, the distributions of the trajectories in the control group and in the experimental groups almost coincided, indicating that at this voltage level, the behavior of the zebrafish was not affected by the current field. As the voltage increased, the peak and number of trajectory points moved to the areas with fewer points, indicating that the zebrafish were forced out of their normal swimming patterns to remain in areas with a low current density. The number of points for the control group in Area 30 does not conform to the law of distribution. This is because this area had the highest current density corresponding to the trajectory points in the experimental groups. However, this area in the control group contained all trajectory points that exceeded that maximum value when they were mapped to the calculation results.

4.2. Explanation of Trajectory and Statistical Results

As the zebrafish swam in the water, they occasionally swam from an area with a lower current density to an area with a higher current density. During that process, the current passing through the fish’s body grew, and the effects of the current stimulating the nervous system intensified. When the fish experienced discomfort, they turned to avoid the paths leading to an area with a higher current density. Therefore, the swimming pattern of the fish changed, indicating that the current density at certain levels exceeded the tolerance threshold of the fish. In the experimental groups subjected to higher voltage levels, such as 20 and 25 V, the fish rarely left the corner areas. Although the zebrafish attempted to leave the corner and locate a more comfortable place, the fish turned immediately once they began to exit the corner and swam toward the central area.
The current density threshold at which fish were forced to turn may be the threshold at which the fish could sense the current and find it intolerable. Previous research has found the threshold at which fish may experience electric shock and at which fish will be anesthetized. However, these thresholds of electrical current density may be too harmful to be used as a basis for judging the effects of electric currents on fish. The method entailing the monitoring and analysis of fish behavior to derive a threshold of changes in fish swimming patterns can provide more reliable data and is more humane.

4.3. Threshold of Turning Behavior

In an attempt to determine the threshold at which zebrafish experience discomfort and turn, another statistical analysis was conducted. All trajectory points in the experimental groups were assigned a current density value according to the results of the numerical calculation of current density distribution. All trajectory points with a current density higher than that at the preceding trajectory point and that at the subsequent trajectory point were then selected. These points indicated that the zebrafish swam from an area of lower current density to an area of higher current density but that they were forced to turn and move back to the area of lower current density. The current densities at these points in one of the experimental groups were averaged. A point of possible concern is that turning points that occurred through the natural movements of the fish and were unrelated to the current density may have been wrongly selected. However, most natural turns were made at the four corners when the fish arrived at the edge of the water tank as they swam along the four sides of the container. In those cases, the fish swam from an area with a higher current density (a non-corner area) to an area with a lower current density (a corner area), which did not follow the aforementioned rules for selection; therefore, these turns were not selected. A schematic outlining the method for selection of points is presented in Figure 8, and the results of the calculations are displayed in Figure 9.
As indicated in Figure 9, the current density at which the fish turned back (i.e., threshold of turning behavior) initially increased with the applied voltage and then stabilized. This is because in the experimental groups subjected to lower applied voltages, the current densities were low in open areas, and most turns made in the current field coincided with natural turning behavior that was unrelated to the current density; these turns were not excluded from the calculation. As the applied voltage increased, the current density in the water increased, and the relationship between current density and the turning behavior became stronger. The results of the 5 V experiment groups were not appropriate for the threshold analysis. The average value of the current densities obtained for the four subsequent groups was 0.4231 A/m2. This value is the threshold at which zebrafish can sense electrical current and cannot tolerate it. Normal behavioral patterns may also change when the current density exceeds this value. (According to the water conductivity test results, the corresponding potential gradient limit is 9.4 V/m.)
The impact of underground current on aquatic organisms has not attracted much public attention before, and few research studies can be found about the effect of direct current on fish behavior or the current density limit considering this effect. Related research mainly focuses on electric fishing and electric anesthesia of fish. The thresholds found by previous studies are presented in Table 2 below.
The thresholds for different kinds of fish with different reactions are not the same. The sensing current threshold is decided by many factors including electroreceptor number, age, body length, and so on. Therefore, the threshold may not be the same among different types of fish, and not the same as in human beings. The proposed method offers a new way to obtain the current density limit with the behavior pattern in an objective way. The current density limit obtained is more appropriate for zebrafish.
Compared with research methods based on direct observation, combining video tracking and behavior analysis with FEM calculation results is more convincing and objective. Still, the method proposed above could be extended and improved. Firstly, the proposed method could be modified into a three-dimensional model, which may provide more behavior information for analysis. Secondly, the rod electrodes used in the platform could be replaced by plate electrodes, which may help to obtain the limit value under an even current field condition. Lastly, more indexes could be added when analyzing the tracking results, such as speed analysis, orientation analysis, and fractal dimension analysis.

5. Conclusions

To determine whether the current density of water would affect the behavior of fish, this study developed a method for quantifying the behavior of fish and developed a tracking program for recognizing and tracking the movements of the fish. An experimental platform was set up to provide uneven current fields in water and to record the behavior of the fish. Trajectory results reveal that the fish could sense currents in the water and directly avoid areas with high current densities.
To further explain the relationship between the quantified behavior and current density, a statistical analysis method was implemented to analyze the trajectories of fish movement using numerical calculation. The current density distribution in the water was calculated through interval partitioning. The statistical results reveal that the main distribution and peak of the trajectories became concentrated in areas with lower current densities as the applied voltage increased. This indicates that behavioral patterns of preference and avoidance are influenced by electric current fields. The results also indicate that normal fish behavioral patterns were only influenced when the applied voltage (current density) reached a certain level.
The points at which fish would avoid an area and turn back were defined and extracted to determine the specific threshold of current density at which fish would experience discomfort and then be forced to turn. The calculation results reveal the threshold to be 0.4231 A/m2, which can serve as a reference for determining the safe limit of current density for open waters through which underground currents may pass.

Author Contributions

Conceptualization, H.L. and J.C..; formal analysis, Y.T. and C.L.; investigation, Y.T. and C.L.; methodology, H.L. and J.C.; project administration, G.L. and K.X.; resources, G.L. and K.X.; supervision, L.L. and X.W.; validation, B.T. and X.T.; visualization, B.T. and X.T.; writing—original draft, J.C.; writing—review and editing, H.L., L.L. and X.W. All authors have read and agreed to the published version of the manuscript.

Funding

This research was funded by State Grid Corporation of China: “Research on Sea DC Grounding Electrode Technology”, grant number GY71-19-014.

Institutional Review Board Statement

The study was conducted according to the guidelines of the Declaration of Helsinki, and approved by the Institutional Animal Care and Use Committee of Wuhan University Center for Animal Experiment (protocol code: WP20220035 and date of approval: 12 March 2022).

Informed Consent Statement

Not applicable.

Data Availability Statement

Not applicable.

Conflicts of Interest

The authors declare no conflict of interest.

References

  1. Marzinotto, M.; Mazzanti, G.; Nervi, M. Ground/sea return with electrode systems for HVDC transmission. Int. J. Electr. Power Energy Syst. 2018, 100, 222–230. [Google Scholar] [CrossRef]
  2. Paul, D. DC Stray Current in Rail Transit Systems and Cathodic Protection [History]. IEEE Ind. Appl. Mag. 2015, 22, 8–13. [Google Scholar] [CrossRef]
  3. Lin, S.; Wang, A.; Liu, M.; Lin, X.; Zhou, Q.; Zhao, L. A Multiple Section Model of Stray Current of DC Metro Systems. IEEE Trans. Power Deliv. 2020, 36, 1582–1593. [Google Scholar] [CrossRef]
  4. Tzeng, Y.-S.; Lee, C.-H. Analysis of Rail Potential and Stray Currents in a Direct-Current Transit System. IEEE Trans. Power Deliv. 2010, 25, 1516–1525. [Google Scholar] [CrossRef]
  5. Henyey, E.; Kynard, B.; Zhuang, P. Use of electronarcosis to immobilize juvenile lake and shortnose sturgeons for handling and the effects on their behavior. J. Appl. Ichthyol. 2002, 18, 502–504. [Google Scholar] [CrossRef]
  6. Sterritt, D.A.; Elliott, S.T.; Schmidt, A.E. Electrical Anesthesia for Immobilizing Adult Coho Salmon in Freshwater. N. Am. J. Fish. Manag. 1994, 14, 453–456. [Google Scholar] [CrossRef]
  7. Inger, R.; Attrill, M.J.; Bearhop, S.; Broderick, A.; Grecian, J.; Hodgson, D.J.; Mills, C.; Sheehan, E.; Votier, S.; Witt, M.; et al. Marine renewable energy: Potential benefits to biodiversity? An urgent call for research. J. Appl. Ecol. 2009, 46, 1145–1153. [Google Scholar] [CrossRef]
  8. Öhman, M.C.; Sigray, P.; Westerberg, H. Offshore Windmills and the Effects of Electromagnetic Fields on Fish. AMBIO 2007, 36, 630–633. [Google Scholar] [CrossRef]
  9. Bergström, L.; Sundqvist, F.; Bergström, U. Effects of an offshore wind farm on temporal and spatial patterns in the demersal fish community. Mar. Ecol. Prog. Ser. 2013, 485, 199–210. [Google Scholar] [CrossRef] [Green Version]
  10. Andrulewicz, E.; Napierska, R.; Otremba, Z. The environmental effects of the installation and functioning of the submarine SwePol Link HVDC transmission line: A case study of the Polish Marine Area of the Baltic Sea. J. Sea Res. 2003, 49, 337–345. [Google Scholar] [CrossRef]
  11. Ying, L.M.; Zhang, G.; Huang, H.; Zhang, X.; Xing, B.; Qiao, Y.; Chen, S. Behavioral response of catfish in weak electric field. Mar. Fish. 2012, 2, 89–93. [Google Scholar]
  12. Yang, Q.W.; Zhang, X.; Guo, H.; Zhang, B.; Song, J. Avoidance behavior of Siberian Juvenile Sturgeon to dipole electric field. Acta Hydrobiol. Sin. 2016, 40, 201–206. [Google Scholar]
  13. Prel, E. Effect of voltage gradient in an electrical field on threshold indices of fish response. Acta Ichthyol. et Piscat. 1991, 21, 37–44. [Google Scholar] [CrossRef] [Green Version]
  14. TB675; General Guidelines for HVDC Electrode Design. CIGRE: Paris, France, 2017.
  15. IEC/TS 62344; Design of earth electrode stations for high-voltage direct current (HVDC) links-General guidelines. Commission I E: Geneva, Switzerland, 2014.
  16. Faugstad, K.; O’Brien, M.; Smith, M.; Zavahir, M. An Environmental Survey on the Operation and Impact of HVDC Electrode; CIGRE: Osaka, Japan, 2007. [Google Scholar]
  17. Poléo, A.B.A.; Johannessen, H.; Harboe, M. High Voltage Direct Current (HVDC) Sea Cable and Sea Electrodes. Effects on Marine Life; University of Oslo: Oslo, Norway, 2001. [Google Scholar]
  18. Marin Miljöanalys, A.B. Environmental Investigation Programme for Baltic Cable-Impact on Natural Habitat; Marin Miljöanalys AB: Göteborg, Sweden, 1999. [Google Scholar]
  19. Zhang, B.; He, J.; Zeng, R.; Wu, J. Effect of Coke Bed on the Electrical Performance of HVDC Ground Electrode. IEEE Trans. Ind. Appl. 2016, 52, 4594–4600. [Google Scholar] [CrossRef]
  20. Parise, G.; Martirano, L.; Parise, L.; Celozzi, S.; Araneo, R. Simplified conservative testing method of touch and step voltages by multiple auxiliary electrodes at reduced distance. IEEE Trans. Ind. Appl. 2015, 51, 1. [Google Scholar] [CrossRef]
  21. Akbari, M.; Sheshyekani, K.; Alemi, M.R. The Effect of Frequency Dependence of Soil Electrical Parameters on the Lightning Performance of Grounding Systems. IEEE Trans. Electromagn. Compat. 2012, 55, 739–746. [Google Scholar] [CrossRef]
  22. Georges, S.; Slaoui, F. Modelling and simulation of heat dissipation due to HVDC ground electrodes using the finite element method. In Proceedings of the 2014 IEEE Innovative Smart Grid Technologies—Asia (ISGT ASIA), Kuala Lumpur, Malaysia, 20–23 May 2014; pp. 476–480. [Google Scholar] [CrossRef]
  23. Wen, X.S.; Teng, Y.; Cai, H.S.; Hu, S.M.; Jing, M.H.; Zhang, Y.; Mei, H.; Lan, L.; Lu, H.L. Experimental Study on Gas Evolution Characteristics of DC Deep Well Grounding Electrodes. IEEE Access 2019, 7, 57450–57458. [Google Scholar] [CrossRef]
  24. Chen, F.; Zhang, B.; He, J. Influence of Coke Bed on HVDC Grounding Electrode Heat Dissipation. IEEE Trans. Magn. 2008, 44, 826–829. [Google Scholar] [CrossRef]
  25. Wang, Y.; Pan, Z.; Zha, Z.; Tan, B.; Wen, X.; Liu, Y.; Zhang, J.; Lan, L. Numerical Simulation and Field Test of the Transient Temperature Rise of HVdc Grounding Electrodes. IEEE Trans. Power Deliv. 2017, 33, 22–31. [Google Scholar] [CrossRef]
  26. Yu, Z.; Liu, L.; Wang, Z.; Li, M.; Wang, X. Evaluation of the Interference Effects of HVDC Grounding Current on a Buried Pipeline. IEEE Trans. Appl. Supercond. 2019, 29, 1–5. [Google Scholar] [CrossRef]
  27. Zhang, B.; Cao, F.; Zeng, R.; He, J.; Meng, X.; Liao, Y.; Li, R. DC Current Distribution in Both AC Power Grids and Pipelines Near HVDC Grounding Electrode Considering Their Interaction. IEEE Trans. Power Deliv. 2019, 34, 2240–2247. [Google Scholar] [CrossRef]
  28. Pan, Z.; Wang, X.; Tan, B.; Zhu, L.; Liu, Y.; Liu, Y.; Wen, X. Potential Compensation Method for Restraining the DC Bias of Transformers During HVDC Monopolar Operation. IEEE Trans. Power Deliv. 2015, 31, 103–111. [Google Scholar] [CrossRef]
  29. Zeng, R.; Yu, Z.; He, J.; Zhang, B.; Niu, B. Study on Restraining DC Neutral Current of Transformer During HVDC Monopolar Operation. IEEE Trans. Power Deliv. 2011, 26, 2785–2791. [Google Scholar] [CrossRef]
  30. He, J.; Yu, Z.; Zeng, R.; Zhang, B. Vibration and Audible Noise Characteristics of AC Transformer Caused by HVDC System Under Monopole Operation. IEEE Trans. Power Deliv. 2012, 27, 1835–1842. [Google Scholar] [CrossRef]
  31. GB/T 39649; Laboratory Animal-Quality Control of Laboratory Fish. Standardization Administration of China: Beijing, China, 2020.
  32. Kato, S.; Nakagawa, T.; Ohkawa, M.; Muramoto, K.; Oyama, O.; Watanabe, A.; Nakashima, H.; Nemoto, T.; Sugitani, K. A computer image processing system for quantification of zebrafish behavior. J. Neurosci. Methods 2004, 134, 1–7. [Google Scholar] [CrossRef] [PubMed]
  33. Shi, H.Q.; Zhang, L.J.; Yuan, X.Y.; Hui, P.; Zhao, J. Toxic effects of cadmium chloride exposure on neurobehavior of zebrafish larvae. Asian J. Environ. Sci. 2013, 8, 374–380. [Google Scholar]
  34. Zhong, Z.G. Fish Behavior in Electric Field. China Fish. 1960, 11, 32–33. [Google Scholar]
  35. Cai, H.C.; Lu, W.H.; Qian, X.R.; Chen, Z.Y. A preliminary study of crucian carp behavior under the strong DC field. Zhejiang Fish. Coll. 1994, 4, 282–286. [Google Scholar]
Figure 1. Arrangement of the experimental platform.
Sustainability 14 03942 g001
Figure 2. Frame from the video recording.
Sustainability 14 03942 g002
Figure 3. Results of recognition after self-adaptive segmentation.
Sustainability 14 03942 g003
Figure 4. Trajectories of the four zebrafish specimens under different applied voltage conditions.
Sustainability 14 03942 g004
Figure 5. Distribution of current density in the tank when 5 V was applied.
Sustainability 14 03942 g005
Figure 6. Schematic of the method used to count the number of trajectory points.
Sustainability 14 03942 g006
Figure 7. Statistical analysis results for the trajectory points.
Sustainability 14 03942 g007
Figure 8. Method for selecting turning points.
Sustainability 14 03942 g008
Figure 9. Average current density threshold associated with turning.
Sustainability 14 03942 g009
Table 1. Water quality parameters.
ParameterValue
Temperature (°C)28
Conductivity (S/m)0.045
pH7.25
Table 2. Thresholds obtained in related research.
SubjectsConditionReactionThresholdReference
CatfishDCPreference5.0 ± 0.1 mV/cm[11]
CatfishDCFear40 mV/cm[11]
Siberian sturgeonDipoleAvoidance10 ± 1.0 μV/cm[12]
fishDCSlight irritation0.02–0.05 mA/cm2[34]
Crucian, perch, and carpDCAnesthesia0.2–0.5 mA/cm2[34]
CrucianDCAnesthesia60 V/m[35]
CrucianDCStunned120 V/m[35]
Publisher’s Note: MDPI stays neutral with regard to jurisdictional claims in published maps and institutional affiliations.

