
Towards Energy-Positive Buildings through a Quality-Matched Energy Flow Strategy
by
 ,
,
Nick Novelli
1,*, 
Justin S. Shultz
2,
Mohamed Aly Etman
1,
Kenton Phillips
2,
Jason O. Vollen
3,
Michael Jensen
4 and
Anna Dyson
1,* 1
Center for Ecosystems in Architecture, Yale University, 180 York St., New Haven, CT 06511, USA
2
Center for Architecture, Science, and Ecology, Rensselaer Polytechnic Institute, 110 8th St., Troy, NY 12180, USA
3
AECOM, 125 Broad St., New York, NY 10003, USA
4
Department of Mechanical, Aerospace, and Nuclear Engineering, Rensselaer Polytechnic Institute, 110 8th St., Troy, NY 12180, USA
*
Authors to whom correspondence should be addressed.
Sustainability 2022, 14(7), 4275; https://doi.org/10.3390/su14074275
Submission received: 26 December 2021
/
Revised: 14 March 2022
/
Accepted: 15 March 2022
/
Published: 4 April 2022
(This article belongs to the Special Issue Sustainable Development of Energy, Water and Environment Systems (SDEWES 2021))
Abstract
:Current strategies for net-zero buildings favor envelopes with minimized aperture ratios and limiting of solar gains through reduced glazing transmittance and emissivity. This load-reduction approach precludes strategies that maximize on-site collection of solar energy, which could increase opportunities for net-zero electricity projects. To better leverage solar resources, a whole-building strategy is proposed, referred to as “Quality-Matched Energy Flows” (or Q-MEF): capturing, transforming, buffering, and transferring irradiance on a building’s envelope—and energy derived from it—into distributed end-uses. A mid-scale commercial building was modeled in three climates with a novel Building-Integrated, Transparent, Concentrating Photovoltaic and Thermal fenestration technology (BITCoPT), thermal storage and circulation at three temperature ranges, adsorption chillers, and auxiliary heat pumps. BITCoPT generated electricity and collected thermal energy at high efficiencies while transmitting diffuse light and mitigating excess gains and illuminance. The balance of systems satisfied cooling and heating demands. Relative to baselines with similar glazing ratios, net electricity use decreased 71% in a continental climate and 100% or more in hot-arid and subtropical-moderate climates. Total EUI decreased 35%, 83%, and 52%, and peak purchased electrical demands decreased up to 6%, 32%, and 20%, respectively (with no provisions for on-site electrical storage). Decreases in utility services costs were also noted. These results suggest that with further development of electrification the Q-MEF strategy could contribute to energy-positive behavior for projects with similar typology and climate profiles.

1. Introduction
Measures employed in the development of net-zero and net-generating building projects are determined through a design framework, whether implicit or explicit, and any such framework must address multiple criteria to develop traction and ultimately enjoy uptake. These criteria are occupant-related, physics-based, engineering and manufacturing, logistical, and economic in nature. One such framework, termed Quality-Matched Energy Flows (Q-MEF), is explored in this study, and focuses on maintaining and applying the inherent value of climatic energy resources as they pertain to the service demands of the built environment—namely, lighting, electricity supply, and heating and cooling. Specifically considering on-site solar resources, Q-MEF is explored through simulation with a specific generalized building type, in multiple climates. Measures proposed through the Q-MEF rubric comprise a novel Building-Integrated, Transparent, Concentrating Photovoltaic and Thermal fenestration system (BITCoPT) coupled to an interconnected network of thermal storage and heat pumps (both thermally and electrically powered) which are distributed throughout the building. BITCoPT (investigated in earlier works through modeling, simulation, and experimentation [1,2,3]) uniquely enables the Q-MEF strategy by providing daylighting (illumination and glare control) in addition to generating electricity and collecting thermal energy from solar energy incidents on the building envelope. As Q-MEF and BITCoPT are architecturally grounded, they draw on multiple realms of expertise, and the context of these realms—and the state of their technology—is explored.
1.1. Addressing Limits of Load-Reduction Strategies with Active Envelope and Thermal Distribution
Traditionally, net-zero energy building (NZEB) strategies follow a three-tier approach to energy efficiency: load reduction is foremost, followed by the application of passive systems such as shading, and lastly the use of active systems such as energy harvesting [4]. Although load reduction is important, in contemporary architecture this approach begets façade designs that supply good daylighting and natural ventilation, but do not attempt energy harvesting [5,6]. The proliferation of on-site NZEB has been stalled by these legacy design frameworks, which remain grounded in efficient use of grid-supplied electricity and fuel, and employ envelope designs that offload solar energy gains through insulating, limiting apertures, shading, and glazing emissivity control. Moreover, prevalent building-integrated energy harvesting systems (such as roof-top and façade-integrated PV) exhibit sub-optimal exergetic efficiency and limited installable area, limiting the addressable fraction of a building’s service demands, even though in many scenarios solar exergy available to a building is far greater than its own consumption.
Here, we propose an alternative approach, manipulating incident solar energy into daylighting (with minimal glare production) by intercepting that energy with an optically-concentrating photovoltaic fenestration system and hydronic mechanisms that capture and transfer “waste” heat. In this approach, solar gain is re-cast from a low-grade “load” to be remediated through energy intensive heating, ventilation, and air-conditioning (HVAC) systems into a high-grade (thermodynamically useful) energy source for cooling (and other) systems. This approach (Q-MEF) suggests re-distributing a building’s systems out across its envelope to more-efficiently interface with the distributed solar resource. This distribution represents a revision of the traditional system topology that has evolved around grid-sourced energy supplies, of centralized plants and trunk-and-branch systems (Figure 1).
If active control is thus shifted outward, the building envelope is empowered to redistribute the abundant light, heat, and power resources available, transferring solar energy towards the building’s particular demands and, when necessary, transforming incident solar energy into consumable forms. In Q-MEF, this shift is implemented through integrating distributed coolth storage, (thermally driven) adsorption chillers, and a transparent, optically concentrating photovoltaic and thermal collecting fenestration system (BITCoPT). BITCoPT transmits diffuse irradiance for daylighting and views, and strips out direct normal irradiance, either transforming insolation into electricity or collecting it as thermal energy. Rather than exacerbating cooling demands, insolation can therefore be used directly, as electricity, or as thermal energy that supplies small, localized chillers. Local, distributed use of heat is important for avoiding losses from piping that energy to a central plant. The exergetic value of collected thermal energy is sensitive to such temperature losses, and the surface area-mass ratio of the system (potential for losses through insulation) is inherently high compared to centralized distribution networks with larger pipes. Generated heating and cooling capacities are stored as warm and cold water and circulated through the building via thermally massive hydronic circuits, redistributing these resources towards demands for cooling as well as heating and other process energy, maintaining small but useful temperature differences rather than immediately dispersing generated potential into the built environment. In concept, this integrated system of the multifunctional envelope collector and activated thermal mass distribution can uniquely maintain the quality of the solar resource (through daylighting), and its exergetic content, by collecting a high fraction of direct irradiance either as electricity or as thermal energy at elevated temperatures.
1.2. Precedents: Active Facades
The Q-MEF strategy builds on precedent and contemporary building-scale integrated strategies and is dependent on multifunctional envelope technologies. As such, a review of precedent active integrated envelopes and facades (AIFs) is relevant. Building-integrated technologies have been reviewed in such focus areas as photovoltaics [7], thermal collection and life cycle analysis [8], concentrating technologies [9,10], and architectural integration [11]. To the authors’ knowledge, an investigation coupling a high-concentration/daylighting system such as BITCoPT to a full-building scale application and distribution strategy—designed specifically to leverage envelope-wide collection—has not yet been undertaken.
1.3. Benefits of Distributed Systems
Beyond deficits in energy harvesting capacity, the drawback of load-reduction NZEB strategies is in the utilization of harvested energy: Although high quality flows of electricity, light, and thermal energy can be developed with envelope-integrated systems, the building’s mechanical infrastructure must be designed to apply these flows effectively. Specifically, generated electricity and thermal resources must be managed. DC microgrids can be employed to efficiently transfer envelope-generated electrical power to equipment and lighting, which often requires DC power natively, using available DC-DC conversion [12]. Harvested thermal resources can be distributed with hydronic systems if the network topology is designed to maintain the useful temperatures (and therefore exergy) that can be developed by a concentrating-type envelope collection system.
Traditionally, building mechanical systems are centrally organized as a logical result of the availability of grid electricity and fuels. Current NZEB strategies therefore involve centralized systems as well (save for active shading/daylighting and natural ventilation). Even on-site harvesting of electricity and heat is typically routed through the same wiring and plumbing that are optimized for the centralized resource-generating systems. To take advantage of envelope-generated energy resources, the mechanical processes that use these resources can be scaled down, parallelized, and located at the envelope, distributed in the same fashion as energy resources are harvested. This is especially relevant for thermal energy collected at high temperatures (beyond roughly 25 °C above the comfort range), which endures larger transport losses than electricity. Recent research into distributed ventilation and humidity control [13] and DC microgrids [14] indicates the inherent efficiency and demand–response benefits of co-locating processes with both their sources of power and the demands they service within a building. Analysis of coupling these end uses to a polygenerating envelope such as BITCoPT has not yet been done.
Many technological elements of load-reduction NZEB strategies can be successfully reconfigured to the distributed Q-MEF strategy. Radiant and mixed-mode heating and cooling, for example, is efficient at managing sensible thermal loads when coupled with effective ventilation and latent-controlled mechanisms such as dedicated outdoor air systems (DOAS) [15,16]. In standard practice, the heat and coolth these systems distribute are generated by centralized chillers and boilers. However, they integrate just as well with distributed thermal control and are employed in the Q-MEF framework.
1.4. Thermal Energy Storage for Resource-Matching and Dispatchability
In contrast to grid-sourced energy, which is available on-demand, climatic energy resources must be collected when they are available. To make these resources useful, they must be made dispatchable. Therefore, storing energy in a recoverable way is useful. The benefits of energy storage additionally extend to load factor reduction, grid efficiency and stability, primary fuel costs and pollution reduction, equipment longevity, and resiliency [17]. A range of technologies and materials are actively investigated to these ends [18].
On-site fluidic thermal energy storage (TES) at temperatures suitable for heating (over 30 °C) and cooling (under 18 °C) is attractive because of the potential for good round-trip efficiency: Losses can be minimized through proper insulation, and fluid pumps can be used to dispatch thermal power with little power consumption [19]. Although broadly applicable [20], on-site thermal storage can be limited because of space requirements as well as the relative unfamiliarity of Architecture, Engineering, Construction, and Operation (AECO) sector industries. The current commercial solution to this spatial limitation is to deploy ice storage [21]. Research into alternative phase-changing materials and systems that melt at higher temperatures than water [22,23,24] could improve system efficiencies (by reducing required temperature lifts and maintaining optimal temperatures for process efficiencies) and design desirability (by reducing system footprint). For the sake of conceptual clarity, in the present study, water is chosen as the heat transfer fluid and storage media. The media is well-characterized, but the system geometric configuration—with thermal mass distributed throughout the building’s floorplate, along the fluid loop—is uniquely configured to distributed generation and, as such, adds a novel dimension to this investigation.
TES at three temperature ranges is important in the Q-MEF strategy, corresponding to the supply, re-cooling, and output circuits of thermally driven chillers. Because commercial buildings have significant cooling loads and electricity is typically used to create cooling, on-site coolth TES can reduce site energy use, as well as peak demands on the grid, by phase-shifting cooling [25].
In addition to the cool temperature range, TES at two higher ranges is important. In support of the envelope-integrated thermal collection, a buffering mechanism is required to match high-temperature collection to the operation of a thermally driven chiller. High-temperature storage has been deployed for utility-scale thermal power cycles such as solar electric plants [26], but the lower temperatures useful for driving adsorption chillers (above 60 °C) are easier to maintain in the building context.
A mid-range TES (at temperatures above the range of thermal comfort but below 50 °C) is also required and considered. This storage can act as both a sink for heat rejected from the chillers’ operation and a source for heating processes, either as pre-heating for service hot water (SHW) demands or as space heating. Additionally, it has been shown that by storing rejected heat until night-time, when the temperature of the atmospheric sink is lower, the rejection process (and overall energy use) can be more efficient [27].
1.5. Entropic Efficiency of Thermal Cascade
By defining multiple temperature (or quality) ranges for thermal storage, a cascade develops through which harvested thermal resources can be matched to a building’s service demands (Figure 2). Besides the demands discussed here, other uses such as humidity control through desiccant regeneration have been investigated. This cascading framework has been recognized in other research, such as the Building as Power Plant concept [28], and in studies and optimizations of latent thermal storage in the building context [23,29]. However, to the authors’ knowledge, including daylighting as a primary product and analysis through the mechanism of a multifunctional envelope has not been undertaken.
1.6. Valuing Different Forms of Energy
To evaluate Q-MEF as a strategy, a rubric is devised for the value of the different energy flows—lighting, electricity, heat, and coolth—that can be gleaned from solar energy by BITCoPT. The relative values of these different flows must be grounded in reasonable goals for a given context [30].
Because well-distributed lighting with good color rendering is difficult to reproduce in the built environment, effective daylighting is a priority in a high-performance building. Diffuse sunlight is multi-directional, exhibits good color rendering, and has good luminous efficacy (relative to common tube fluorescents, although LED lamps are targeted to surpass [31,32]). Diffuse sunlight is easier to apply as daylighting than direct sunlight, which is typically strong and narrowly directional, causing overheating and glare through high contrasts and distracting reflections.
Of the resources into which direct irradiance can be transformed, electricity is more valuable than thermal energy, as it is easy to transduce into other forms of work, and its exergy content is not directly subject to the Carnot efficiency. DC electricity is objectively more efficient to use than AC power in many commercial building contexts, as most modern electrical equipment is DC-native, and DC-DC conversion efficiency has reached parity with AC-DC rectification. Although DC distribution is not yet common, standards are mature and gaining acceptance for integration of multiple sources, storage mechanisms, and use devices into sub-building scale microgrids [12].
Thermal energy stored as a heat transfer fluid (HTF) at high temperatures (here defined as over 60 °C, in the context of building systems) can be applied to drive processes such as adsorption chilling, so it can both do work and be applied as heat, in sequence. The higher the temperature developed in the working fluid (relative to an available thermal sink such as the atmosphere or earth), the greater the exergy content, if losses incurred in storage and transportation are managed.
In this study, cooling power is more valuable than heating power for two reasons: More cooling is typically required in medium-sized office buildings, and the coefficient of performance (COP) of a reversible heat pump acting as a chiller is lower than that of the same pump in heating mode.
1.7. Exergy-Efficient Solar Collection Aligned with Façade Criteria
Successful on-site energy strategies will internalize a large fraction of the solar exergy available to a building by integrating with the multiple objectives of a successful envelope—objectives such as thermal regulation, daylighting, privacy, and design identity. The method proposed here for gleaning maximum utility from solar energy is represented by the thermal/energy cascade (Figure 2), and, to functionalize it within the Q-MEF framework, a model is incorporated of BITCoPT, which has previously undergone development [33], simulation [34], and prototype characterization [2,3] (Figure 3).
1.8. Comparison to Alternative Building Energy Schema
Existing schema cross over in purpose and methods with Q-MEF. Although whole-building polygeneration is typically considered component by component, as evidenced by review work on net-zero strategies [35], the impact of intersectional modeling is recognized [36]. Notably, high-performing built works achieve performance through combined strategies such as occupant-driven energy savings and multi-functional envelope structures. The Bullitt Center’s canopy exemplifies this, reducing gains on the vertical envelope while increasing functional area for traditional photovoltaics [37]. Buildings such as Power Plants, mentioned earlier, emphasize the efficiency gains and building demand-matched resources from on-site cogeneration [28]. Exergy analysis provides a rubric for identifying appropriate quality matches between resources and demands [38] and for valuing both warming and cooling storage mechanisms according to temperature differences against an ambient state [39]. The Low Exergy (or LowEx) design emphasizes the application of thermal resources to the small-potential thermal demands of the built environment (heating, cooling, humidity control), the efficiency of heat pumps at maintaining small, useful temperature differences, and sequencing heat pumps to obtain larger temperature lifts [40,41]. LowEx has been extended to district scales [42]. Thermally Active Building Systems (TABS) emphasize the utility of hydronic thermal redistribution, activating thermal mass within the occupied regions of a building, and the efficiency benefits of transferring heat across the large surface areas that comprise indoor built spaces [43,44]. A Passive House is specific regarding the reduction of thermal loads, which can limit solar harvesting opportunities, although work is ongoing to integrate the strategy with on-site generation [45]. These frameworks can be employed to design systems that maximize wise use of available energy resources, but they do not explicitly tackle the provision of desirable lighting conditions in the built environment.
More holistically, Integrated Design emphasizes the consideration of an architectural design as a dynamic totality that shifts between states in a knowable fashion. Attention is paid to the thermal properties (particularly diffusivity) of a building design at the material, construction, and space scales [46,47]. Bioenergetic modeling emphasizes the pathways of potential, flow, and transformation for a broad category of resources, distributed sensing and response, and dynamic systems at the boundary between built and natural environments [48]. Furthermore, thermo-economic analysis is ongoing to ascertain the value of exergetic efficiency and on-site coupled generation and energy storage [49,50,51,52,53], and novel interpretive tools are developed towards these ends [54]. An intention of developing the Q-MEF framework is to leverage the insights of these other strategies to provide for a wide reach of building service demands, including quality lighting.
1.9. Research Objective: Modeling Q-MEF Building Energy Behavior
Overlapping with these complementary schemas, Q-MEF incorporates similar concepts. Q-MEF’s combination of daylighting-primary operation, distributed high temperature buffering and active chilling, and distributed active thermal mass is potentially novel. Hence, this present work investigates Q-MEF’s capacity to more fully leverage building-incident solar energy—and contribute to net-zero and energy-positive design—through integrating BITCoPT with thermal management at multiple temperature ranges and controlled redistribution.
As a platform for this investigation, a representative medium-scale office building with Q-MEF-aligned systems was modeled and tested in diverse climates, by first generating a pair of baseline (BL) building energy models with both moderate and high window-wall ratios (representing a desirable condition in commercial architecture), and then revising the high-ratio configuration to represent a full Q-MEF implementation with experimentally validated transparent active solar façade energy collectors, distributed thermally driven chillers, sequential thermal redistribution, and thermal storage at three temperature ranges. A fourth building energy model was also generated and tested, wherein the geometry of the building was modified to harvest additional solar energy. The Energy Use Intensity (EUI), peak demands, thermal load profiles, and economic benefits (based on energy consumption) that resulted from this matrix of full-building-scale simulations were compared, and salient behaviors were highlighted.
2. Methods
To evaluate the effects of Q-MEF on a building’s energy flows and consumption, a model was constructed by combining (through post-processing) precursor building energy models of a medium-scale commercial office building (generated in the EnergyPlus environment) with an analytical model of an active façade system (BITCoPT). In addition to these two primary precursors, the Q-MEF model includes separate functions representing: hydronic thermal storage and redistribution, thermally driven chillers, electrically driven auxiliary heat pumps, a deep-mullion curtain wall cavity, fan-powered air volume exchanges in that cavity, and reactive (not predictive) controls. The models and functions were integrated through post-processing in a time-step fashion. The block diagram of the Q-MEF model is presented in Figure 4, and is referred to subsequently.
The model was configured in four ways, with two baseline options (low and high glazing ratios) and two options including Q-MEF components, which were both highly glazed, but with either normal (vertical) or outward-tilted fenestration. Three climates were analyzed, for twelve total model configurations (Figure 5).
2.1. Systems for Thermal Energy Collection, Redistribution and Use
In the Q-MEF rubric, solar energy on a building’s glazed envelope areas is either transmitted as daylight, or concentrated and converted to electricity, or collected as thermal energy, where it is then passed through subsystems, applied to do work (such as chilling), and released as space or water heating, or directly out to climatic sinks. The modeled HVAC strategy (shared between all four configurations) is based on a four-pipe distribution that services all the building’s conditioned zones and envelope collection areas (Figure 6). A chilled distribution loop is maintained at sub-ambient temperatures. A rejection-stage (heating) loop was maintained (through system control algorithms) at super-ambient or near-ambient temperatures, depending on the average demands for heating or cooling which varied seasonally.
Two parallel heat pump systems operate between the loops. In the Q-MEF configurations, small-capacity (<10 kW) adsorption chillers are distributed in the region of the building’s envelope and driven by collected solar thermal energy, which is stored adjacently in small buffer tanks. Additionally, in all four configurations, electric water–water heat pumps act in parallel between the two loops.
In both the baseline and Q-MEF configurations, heating and cooling in a zone was modeled as transferring energy through baseboard units or chilled beams, from the rejection-range loop or to the chilled loop, respectively.
In the Q-MEF model configurations, thermal energy collected by BITCoPT was both used to drive adsorption chilling, and as heat. The glazed areas of the precursor BEMs were defined as BITCoPT collectors [34]. In post-processing, each collector fed a thermal buffer tank, which in turn was plumbed to a chiller (“Buffer/Chiller Operation” block in Figure 4). When a buffer’s temperature (Tbuffer) rose high enough to drive the connected chiller at a reasonable COP (over 0.5, requiring Tbuffer ≥ 60 °C, depending on rejection loop temperature), the chiller engaged, pumping heat from the chilled loop to the rejection loop. If the chilled loop became too warm, or the rejection loop cooled off too much, auxiliary heat pumps engaged, pumping heat in parallel to the thermally driven chillers.
Pre-heating for service hot water demands and the DOAS air intake were modeled to occur through water–water heat exchangers, subtracting energy from the rejection-range loop balance according to the difference between the supply temperature reported in the BEM and the loop temperature, less a 2.0 °C approach (Figure 6). The quantity of pre-heating was subtracted from boiler usage of the precursor BEM on a time step basis.
By modeling envelope-integrated solar thermal collection with distributed thermal systems and circulating thermal mass, it was possible to represent the application of thermal energy both as a driving force (for adsorption chillers, at high temperatures) and as useful heat (for zone demands and pre-heating), taking advantage of both the exergy and energy value of the collected energy.
2.2. Inputs to Q-MEF Model
Inputs to the overall Q-MEF analysis are described in this section, including precursor models (building energy model baselines, the BITCoPT model, and daylighting method) and boundary conditions (climates).
2.2.1. Climates Considered
The Q-MEF model was analyzed in three climates, exploring a range of system response patterns (Table 1, where Tdb,outd is outdoor dry bulb temperature). New York City (NYC, LaGuardia Airport TMY3 data) is a fluctuating climate: continental and seasonally humid, with varying weather and strong seasonal swings. Although the city is characteristically dense, and sites are typically shaded by adjacent structures, because this study parametrized climate context, not site, no external shading was defined in NYC or elsewhere. Phoenix (PHX) is an arid subtropical desert with a strong solar resource, high mean temperatures, and large diurnal swings. Mountain View (MTV) is in a semi-arid Mediterranean climate with mild temperatures and a significant solar resource.
2.2.2. Building Energy Models as Baselines
Four building energy models were developed (using the Open Studio [55] interface for EnergyPlus [56]), and used in two ways: directly, as two baseline configurations; and as precursors for two Q-MEF configurations. Each energy model, whether it was used directly as a baseline or as a precursor to the Q-MEF model, was configured for three distinct climates (Table 1) according to ASHRAE 90.1 (2013) building standards, resulting in a set of twelve analyzed configurations. Configurations are summarized in Table 2.
The first baseline configuration (BL40) was a building energy model with no post-processing, based on the United States Department of Energy’s (DOE) Medium Office Commercial Reference, with ASHRAE 90.1 (2013) specifications [57]. Default operation and occupancy schedules were used, including 5-day work weeks throughout the year, with reduced occupancy and thermostat setbacks outside working hours. The window-wall ratio was 40%. BL40′s HVAC systems were assigned per ASHRAE 189.1: hydronic thermal distribution, with zoned chilled beams, baseboard heating, and DOAS. These updates slightly reduced energy use, relative to the DOE reference.
Representing architectural trends towards highly glazed facades, the second baseline configuration (BL95) had a 95% window–wall ratio. The glazing specifications and systems behaviors were held constant, though systems were re-sized (through the auto-sizing algorithms in EnergyPlus). BL95 was the precursor to the Q-MEF configuration.
For the precursor BEM to the Q-MEF + Tilt configuration, the morphology of the Q-MEF BEM was revised to increase the solar gain on the building. At each floor, facades were swung upward at 20° (see Figure 5). The chosen angle maximized acquirable irradiance by maximizing solar flux through the exterior glazing on a per-area basis, while limiting the shading of a floor by the floor above.
2.2.3. BITCoPT Envelope Cavity Model
A model of the BITCoPT façade collector [34] was integrated into the Q-MEF model, contributing electrical generation, thermal collection, and direct solar gain reduction based on inputs of climate data and envelope orientation. A constant efficiency (ηconv,Egen = 0.96) was applied to the model’s electrical output to represent the transformation of the collector’s variable-voltage DC output to a useful form (constant-voltage DC for tying into to zone-level microgrids, or AC for tying into building distribution).
The thermal collection output was likewise modified to represent the heat transfer fluid inlet and envelope cavity temperatures in the Q-MEF model, which were distinct from those values in the BITCoPT simulation. Because the cavity temperatures (Tcav) in the Q-MEF model were held lower (Toutd,db < Tcav < 38 °C, less than 45 °C in the precursor model, to be realistic for mechanical control components), the Q-MEF-modeled array lost more heat, and thermal collection efficiency was lower than in the precursor model.
2.2.4. Daylighting Modeling Method
All baseline and precursor BEMs employed daylighting controls. Daylighting algorithms in EnergyPlus modified interior lighting schedules according to illuminance measured by virtual sensors. In a prior study [58], a threshold was noted in the room depth for which sufficient work-plane illuminance could be achieved when BITCoPT was introduced, but the perimeter zone depth here (4.57 m) was shallower than that threshold.
Precursor BEMs employed in this study did not include skylights, in keeping with the referenced DOE models. Daylighting from skylights would reduce the baseline lighting electrical loads in the core of the third floor (which comprises 20% of the building’s floor area) but would likely contribute to net cooling loads due to solar gains. Although it is surmised that the zones’ daylighting and thermal circumstances would improve with glazed roof expanses and installed BITCoPT, in this study the roof collection was treated as stand-alone equipment which did not interact (through lighting, or thermally) with the adjacent zones (in contrast to the vertical glazing expanses, for which light and thermal interactions were modeled).
2.3. Q-MEF Model Components and Functions
To represent the impacts of the Q-MEF strategy, components were incorporated with the collection of inputs through additional modeled functions.
2.3.1. Thermal Energy Storage Elements Model
Two types of thermal energy storage elements (TES) were modeled: high-range buffer tanks, and distribution loops. One buffer was defined for each solar collector. One cooling loop and one rejection-range loop were defined to service the building. Both TES types were defined to be well-mixed, rectangular water tanks with a fixed height and width. (Although higher-capacity thermal storage media such as PCMs might increase the overall performance of the Q-MEF system, water was modeled in this study for the sake of conceptual clarity.) As indicated in Figure 4 (“Buffer/Chiller…” and “Distribution Loops” modules) the TES exchanged heat with the building’s systems (controlled) and with the interior environment (uncontrolled, due to losses through their insulated surface areas). Losses were modeled as the heat transferred across the TES boundary (tank walls) assuming insulation of 100 mm of polyisocyanurate foam, and negligible film coefficients on both interior and exterior surfaces, for an effective thermal resistance of RTES,wall = 0.4 W/m2-K. The heat lost from the buffers transferred to the curtain wall cavity in which BITCoPT was installed. The heat lost from the distribution loops transferred to the occupied zones. Pumping power required to equalize the temperature between the storage elements in each loop was defined as equivalent to the power used by the equivalent circulation pumps in the contributing building energy model. Buffer TESs were each sized (through iterative testing) to maximize the yearly output of their paired chillers. The distribution loop capacities were sized to minimize whole-building electrical use (Table 3).
It can be noted that in an earlier (unreported) configuration of the Q-MEF model, a high-temperature-range distribution loop was considered as well, to simplify the work extraction from that source. However, the energy losses through the system insulation to indoor ambient temperatures were too high to justify, so a distributed configuration and 4-pipe distribution (reported here) were adopted, with paired buffers and adsorption chillers.
2.3.2. Deep-Mullion Cavity Energy Balance
The building envelopes for the baseline and precursor models were modeled natively in EnergyPlus. For the Q-MEF configurations, the deep-mullion curtain wall cavity (into which BITCoPT integrated) was represented by an energy balance in post-processing. Energy transfers across the glazing determined in the precursor BEMs were replaced by equivalent transfers as determined by this energy balance. The function did not account for variations of temperature or fluid movement within (or external to) the cavity control volume, or non-homogeneous masses. Overall conductivity values between the cavity and adjacent environments were constant, whereas these relationships were variable in the precursor BEM. More accurate heat transfers would be expected from a cavity model that included convection, surface emissivity, material diffusivity, and thermal bridging effects, but one-dimensional, steady state assumptions were deemed sufficient to contrast behavior between baseline and Q-MEF model configurations.
The energy balance comprised: the transmittance of direct and diffuse solar energy into and out from the cavity; the thermal and electrical energy generated by BITCoPT; the heat transferred (via conduction and convection) across glazing surfaces with the two adjoining environments; the heat extracted from the cavity by a flushing function; and the heat lost from high-range buffers (Figure 4: “Cavity balance” block). The balance was
where mcavcp refers to the cavity’s thermal mass (in kJ/K); G to transmitted solar power (in W); Q to thermal flow (in W); Egen to electrical generation (in W); DN to direct irradiance; Diff to diffuse irradiance; ind and outd to the indoor and outdoor environments; cond to non-irradiation thermal transfer; cav to the cavity; and flush to the cavity flushing function (see Section 2.3.4).
2.3.3. BITCoPT Area-Based Gap Transmittance
The direct irradiance transmitted through the cavity to a building zone was modeled by multiplying the transmitted irradiance reported by the BEM by Tgap, a function that represents the collector’s area-based transmittance of direct irradiance (the “Gap function” block in Figure 4). When the solar vector is near to normal with the surface of an envelope region that incorporates a collector, insolation passes through the gaps between BITCoPT modules. As the solar vector moves away from envelope-normal and the collector modules track around pitch and yaw axes, the gaps decrease, falling to zero width at an excursion angle determined by the collector’s geometry. Tgap was defined as
where cvert and chz are vertical and horizontal components of the fractions of envelope area filled by BITCoPT lens modules; ϕ and λ are the rotations of the BITCoPT modules around their pitch and yaw axes (in radians); and ϕfull and λfull (radians) are the respective threshold angles where the gaps between lenses decreased to nil when observed parallel to the solar vector. The floor for Tgap was 0, when modules are rotated beyond the pitch and yaw thresholds, and no direct irradiance was transmitted. Tgap was applied to only direct insolation since, as modeled, BITCoPT does not intercept diffuse insolation.
2.3.4. Cavity Flushing Function
A cavity flushing function was implemented to simulate the removal of heat from the BITCoPT cavity, adjusting cavity temperature to complement the heating or cooling demands of the adjacent zone. The function simulated a fan moving air between the cavity and the environment (Figure 7). Flushing with outdoor air only was modeled, and the function remained decoupled from the building DOAS.
Flushing was implemented both in the precursor BEM (as a window:Airflow property in EnergyPlus, with a constant volumetric rate of 0.6 m3/s-m and assumption of no fan power) and in post-processing. In post-processing, the maximum allowable cavity temperature was Tcav,lim,high = 40 °C, but if zone cooling demand was significant, the target temperature was set to the outdoor (dry bulb) temperature). The post-processing flushing function was modeled as:
where Qcav,flush was the resulting thermal flow (in W); Kflush was the (non-dimensional) proportional gain tuned for each zone; Ccav was the cavity thermal mass (in kJ/K); Tcav was the cavity temperature; Tcav,target was set to either Toutd,db[n−1] or Tind depending on heating demand; and Tcav,offset = 2 °C was used to establish a dead band, preventing the system from operating if heat removal would be inconsequential. Kflush,IDN was a separate gain used to modify the flush rate according to zone’s direct insolation at the current-time step. Fan power required to flush the cavity was determined assuming a constant pressure head (and therefore a constant power draw) multiplied by an hourly duty cycle. 100% of fan (electrical) power was designated to be taken up by the airflow (as increased temperature).
These flushing controls maintained the cavity temperature close to the chosen target, minimizing unwanted non-insolation thermal transfer from the envelope cavity to the building’s interior, and contributing energy to under-heated zone conditions. Gains were tuned to optimize net generation at the building meter.
2.3.5. Thermally Driven Chillers Model
Adsorption chillers were modeled by fitting a solution surface to a manufacturer’s COP data [59] relative to temperatures of buffers, chilled loop (Tchilled), and rejection loop (Trej). Upper and lower limits on COPchiller were implemented to keep it between 0 and 0.56. The chillers were controlled to activate when the temperature of their paired buffer exceeded a threshold (Tbuffer > 60 °C). Chillers drew energy according to the excess in the buffer over the threshold, with no capacity limit and no dependence of COP on the fractional capacity, representing multiple chillers ganged in parallel.
2.3.6. Auxiliary Heat Pumps and Heat Rejection Model
Water–water heat pumps were incorporated in the thermal control strategy to maintain the temperatures of the chilled and rejection-range distribution loops (see Figure 4, “Distribution Loops” block). If the chilled loop became too warm, energy was pumped from it to the rejection-range loop. Pumps are modeled steady state, at a COP varying with temperature lift, with functions sourced from the literature [41], capped at 16.0, with an 0.5 exergetic efficiency.
To prevent the rejection-range loop from getting too warm, heat removal from the loop to the outdoor environment was simulated by modeling a dry cooler, or fan-assisted water-to-air heat exchanger. The heat removal function, Qrej,env (in W) was:
where Krej was the (non-dimensional) proportional gain; Cloop,rej was the thermal mass of the rejection loop (in kJ/K); Trej is the rejection distribution loop temperature; and Trej,target was the temperature set point. Like with the cavity flush fans, the fan power required to remove heat was determined with a constant power draw and an hourly duty cycle.
2.3.7. Loop Temperature Controls
The temperature of the chilled loop (Tchilled) was maintained by the activity of the adsorption chillers and auxiliary heat pump (when necessary), removing the energy gained from space cooling. If Tchilled was ever driven too low (Tchilled > 11.4 °C), both the chillers and heat pumps were deactivated in the next time step. If the chilled loop temperature rose too high (Tchilled > 17.0 °C, representing over-loaded adsorption capacity) the auxiliary heat pump activated in the next time step.
The rejection-range loop temperature (Trej) was controlled by the activity of the auxiliary boiler, the auxiliary heat pump, and the heat rejection system. A target temperature Trej,target was set, either to Tout,db (if heating demands were expected to be low) or to Trej = 27 °C. If Trej dropped below Trej,target, the auxiliary heat pump activated at the next time step. If the heat pump was unavailable (due to a low chilled loop temperature), the boiler activated. If Trej was too high, the heat rejection system was called, proportional to the difference between Trej and Trej,target. An additional check of the current heat rejection COP (COPrej > 3.0) prevented operation when the temperature difference was small, to favor night flushing of excess energy in the rejection loop. These controls together maintained loop temperatures within useful bounds, providing cooling and heating to the zones, and heat rejection capacity for the adsorption chillers.
2.3.8. Utility Cost Metrics
Costs for electrical use, capacity, and demand and gas use charges were initially computed within the BEM. Simulation outputs for the baseline configurations were used and scaled on an hourly basis for the Q-MEF configurations. Electricity costs were determined with monthly peak demand charges (USD 17.00/kW for the winter and USD 38.15/kW for the summer) and hourly energy charges (USD 0.125/kWh on-peak and USD 0.105/kWh off-peak), with surplus electricity generation net-metered at 100% of the current rate. The cost for natural gas was USD 1.30 per therm.
3. Results
Simulating a medium-scale commercial office building according to the Q-MEF framework demonstrated implications for lighting demands, cooling and heating loads, peak demands, net energy use, operational costs, and design considerations.
3.1. Daylighting Impact on Lighting Energy Use
Modeled lighting energy use in the high-glazing configurations improved between 13% and 17% over BL40 (Table 4). Daylighting controls were active in all configurations.
Because daylighting controls were modeled in the precursor BEMs, the controls did not respond to the reduction of direct irradiance due to BITCoPT. Prior daylighting and glare analyses of BITCoPT [58] determined sufficient illuminance through the same depth as the perimeter zones modeled in this study (4.57 m), and as other equipment (such as blinds) was not modeled to control for over-lit moments, it was determined that the daylighting behavior would translate from the precursor BEMs to the Q-MEF configurations.
Daylighting potentially has a great effect on the energy use profile of a building, but because it is highly contingent on occupant behavior [60] representation in the simulation method employed here is difficult. It is possible that the daylighting energy benefits of BITCoPT are over-predicted, as cloudy moments would cause under-lighting. However, experimentation has suggested that lighting through the system increases with partial clouds, as there is more diffuse light to transmit [3]. It is also possible that benefits are under-predicted due to glare, as, during brighter moments in the baseline buildings, occupants who experience excessive brightness or glare might deploy blinds and electric lighting. More differentiation between the configurations might be noted if active technologies (blinds, BITCoPT) and occupant behavior were modeled dynamically with the sensors and dimmers.
3.2. Heating and Cooling Loads
The incorporation of Q-MEF systems resulted in various responses in heating and cooling loads across the climate types, demonstrating complex interdependencies between envelope loads and building demands (Table 5). Heating loads comprise the sum of modeled baseboard heating and DOAS preheating, while the cooling loads consist only of the modeled chilled beam responses.
Due to the preponderance of cooling demands in the moderate MTV climate, the heating increases were low (though not negligible) relative to total demands. The NYC climate showed sensitivity to glazing area and type, as the BL95 and QMEF cases showed marked changes in the total loads. Installation of BITCoPT (the Q-MEF case vs. the BL95 case) resulted in reductions in cooling loads in all climates, although the Q-MEF + Tilt case did not decrease loads further.
The difference in loads occurred mainly in the south, east, and west perimeter zones, where decreased heat gain during direct solar conditions due to BITCoPT caused more frequent net-heating loads. In effect, the Q-MEF configurations resulted in more “skin-dominated” behavior of the building, where heating and cooling demands correlate to the difference between indoor and outdoor temperatures, as opposed to “core-dominated” behavior, where internal energy gains cause persistent cooling demands throughout the year (shown in the evolving Heating–Cooling ratio, in Table 5).
3.3. On-Site Thermal Collection and Application
In addition to driving chilling processes, thermal energy collected by BITCoPT was applied to building demands for zone heating and SHW preheating (Table 6). The final column in Table 6 is a sum of the zone heating loads, SHW preheating, collected thermal energy (negative sign), and DOAS heating (not described in a separate column).
Via the rejection loop, collected thermal energy was applied to zone heating loads and SHW preheating (although with low demand in office-dominated buildings, the latter factor was small). Boiler (and fuel) usage was observed to increase in response to heating demands, despite net thermal collection in some cases exceeding net heating demands. This disparity indicates non-optimal behaviors in the thermal storage mechanisms, including mismatches between the times of collection and demand. This mismatch occurred largely over the annual cycle (Figure 8), indicating the usefulness of ground-source thermal storage, a function which was not implemented in the current Q-MEF model.
3.4. Solar Cooling with Adsorption Chilling
Solar thermal energy, collected by BITCoPT, was applied to drive adsorption chillers (Table 7). This cooling was additive to any passive reductions in direct solar gains from the system, with the added benefit of dispatchability since the capacity was stored in the thermally massive, chilled distribution loop.
Cooling loads in the Q-MEF configurations were lower than in the BL95 configuration. The work done by adsorption chillers further reduced the cooling required from the auxiliary heat pump. The magnitude of collected thermal energy (Table 6) relative to loads suggests that more systems (such as night-flush controls and ground-source heat exchange) would be useful to perform more controlled storage and release of heat over both diurnal and annual cycles.
Cooling power produced from solar energy was not sufficient to provide 100% of modeled demands. Chilling processes capable of higher COPs might close that gap. This requires higher operating temperatures, and therefore higher solar concentration ratios, to boost exergy collection and offset losses from the thermal collection stage. A higher rejection temperature would also then be allowable, reducing the gap between that target and the target for zone heating (the two services being provided by the common loop). This tradeoff was not explored here, but it is noted that the required insulation of the hydronic system is complex, and at higher cell operating temperatures (roughly 100 °C and above) radiation from the cell becomes a significant thermal loss factor.
3.5. Energy Use Profile Comparison
Broadly, Q-MEF simulations improved over the baselines for all observed metrics—net electrical demand, net energy demand, and peak electrical demand (defined as the maximum observed electrical demands between noon and 5 pm during the summer season). There were conditional exceptions: BL40 demonstrated the lowest peak demand of the NYC models, and the demand reductions of QMEF over BL40 were trivial. In both these cases, reductions in electrical EUI were still significant. Results are summarized in Table 8.
The Q-MEF + Tilt configuration demonstrated the highest generation and lowest total site EUI across climates. It is notable that electricity EUI reaches net zero in the Phoenix and Mountain View climates, although there remains significant consumption of gas for heating—higher than that of the baselines.
Maximum on-peak electrical draw (during summer-season afternoons) decreased from the BL95 to Q-MEF configurations by 3% (NYC), 32% (PHX), and 19% (MTV), while in the Phoenix climate, there was a decrease of 17% relative to BL40 as well. Peak demand reductions for the Q-MEF + Tilt configuration relative to BL95 were 6% (NYC), 28% (PHX), and 20% (MTV) (Table 9).
Although it is significant that Q-MEF + Tilt demonstrated net zero electrical use, benefits were incremental (or negative) over the straight Q-MEF configuration, suggesting further analysis comparing the marginal utility of the energy benefits with the marginal costs of increasing the complexity of the building’s design. It’s notable that in the Phoenix condition, the Q-MEF + Tilt configuration showed higher peak demand than the straight Q-MEF configuration, differing from the other two climates. This is due to an attenuation of the cavity flush function from the combination of elevated outdoor temperatures and the increased available insolation.
3.6. Utility Cost Analysis
Annual energy costs were calculated for all configurations according to rates for electricity demand (kW), supply (kWh) and natural gas supply (therms or kWh) (Figure 9, Figure 10, Table 10). Q-MEF configurations reduced total use costs, while demand costs were generally lower than costs in BL95, and similar to costs in BL40.
Observed in Table 8, Q-MEF configurations showed increased natural gas consumption, but due to lower electricity use, the total EUI was reduced in all Q-MEF cases, relative to BL40 and BL95. The analysis of costs demonstrates that (due to the low cost of natural gas compared to electricity) Q-MEF configurations showed annual reductions (Table 10).
Relative to the highly glazed baseline (BL95), peak electrical draw was reduced for each Q-MEF configuration, resulting in lower demand charges. Compared to BL40, the demand charge for Phoenix was reduced, but New York City and Mountain View had similar demand charges. On-site electrical storage was not included in this study, though if employed, it would be expected to further reduce peak demand in some months.
It is a natural goal of techno-economic analysis to reveal the cost/benefit impacts of the proposition. To determine the financial costs and benefits of Q-MEF, which is intended to address a broad range of architectural criteria, the savings in utility costs would be weighed along with the expected changes in lease rates due to changes in the thermal comfort and desirability of occupied spaces, and the installation and maintenance costs for Q-MEF systems. These costs would be considered relative to the costs of the baseline configuration’s mechanical systems, or other common systems such as Variable Air Volume HVAC, which incurs additional effects on a building project’s value, such as reduced inhabitable room height due to the depth of duct work. The overall cost analysis of Q-MEF is highly contextual, due to the interaction of these factors and additional localized factors, such as capitalization rates expected on monies obtained to finance a project, which is an in-part function of a perceived risk. A detailed cost analysis is therefore usefully done at the scale of individual projects, or for broader applicability, by parameterizing these factors and undertaking the resulting matrix of sensitivity analyses. That breadth of analysis is outside the bounds of this study, which, for the sake of its own broader applicability, considered generalized circumstances. The present results, however, are a precursor to such a technoeconomic analysis, which merits further investigation.
4. Discussion
The modeled application of the specific systems described in this study according to the Q-MEF strategy resulted, in simulation, in significant reductions in energy use in the three modeled climates. On-site net-zero electricity was demonstrated in two of the climates—a significant result for buildings in the modeled size class. The results further suggest that additional modifications might show additional energy-use benefits: the baseline configurations were designed according to current minimum efficiency codes but did not incorporate the full gamut of currently available high-performance building strategies, such as DOAS enthalpy recovery (important in high-humidity climates such as New York) or ground-source heat exchange (particularly useful in climates with steady cycles such as Phoenix). Pursuing the current industrial interest in full electrification might also reveal further reductions, but as the modeling process dictates systems similarity between proposed and baseline models (which employ gas heating), these impacts were not represented. The application of these and other strategies would decrease the baselines’ EUI, and therefore the EUI of the Q-MEF implementations as well.
Not all high-performance design strategies are synergistic with Q-MEF. External shading devices, for example, are a passive-design strategy to reduce fenestration gains. Q-MEF attempts to internalize these gains, which increases cooling loads, particularly over the BL40 baseline, but overall reduces both site energy use (all climates) and peak demands (in Phoenix, Table 8). Although counter-intuitive from the passive design perspective, these results suggest the benefits of engaging the solar resource.
A primary benefit to coolth storage systems is peak demand reduction, which commercial systems bank on for their value proposition [16]. The demand reductions demonstrated in this study, though significant, may not fully realize the benefits of this storage. The gap may be due to the simplified controls in the Q-MEF model, which were chosen in part for compatibility with the post-processing modeling method. Optimizing controls has been shown to benefit thermal storage applications [61] and might improve the utilization of the modeled storage.
A general shift from cooling loads to heating loads was observed with Q-MEF vs. baseline configurations (Table 5), which is in keeping with the Q-MEF concept of utilizing available solar resources, rather than mitigating and compensating for them. In the Mountain View climate, the cooling-dominated baselines were flipped to more heating operation. This flexibility around the balanced point suggests that introducing ground-source heat exchange, which benefits from that neutrality, might complement the Q-MEF strategy. Ground-sourcing would be worth investigating in the New York climate as well, which shifted from balanced to heating-dominated, as such heat pump-enabled strategies are intrinsically more effective at heating than cooling. Ground-source systems likely could not “keep up” with the required quantity of heat rejection in the more extreme Phoenix climate, suggesting other strategies might be useful, such as radiative night-sky sinking, which has recently advanced through material investigations [62].
In this study, the thermal collection efficiency of BITCoPT averaged lower than in precedent studies. This stems from conflicting demands on the envelope cavity: sensitivity analysis performed through multiple simulation runs showed that allowing elevated cavity temperatures reduced transport losses in BITCoPT, but increased perimeter zone cooling demands and overall net energy use. This trade-off reinforces how a building with Q-MEF is a coupled system of components that experience unique forcing functions. Optimizing overall objectives in such a system requires subordinating the peak performance of specific sub-systems.
5. Conclusions
To test the integration of technologies through an architectural, whole-system approach to design, the production of benefits from on-site solar resources was explored through simulations with a parametric group of building energy models. The models were assembled from precursors: a set of building energy models, a model of an active envelope technology, and representations of adsorption chillers, hydronic thermal distribution and storage elements, water-to-water heat pumps, and ancillary systems. The overall strategy was described as a quality-matched energy flow (Q-MEF) network. Simulations of a 5000 m2, three-floor office building demonstrated reductions in electrical use over 70% from the baseline in a humid-continental climate (New York City), and on-site net zero electricity in arid subtropical (Phoenix) and semi-arid Mediterranean (Mountain View) climates. Peak purchased electrical demands decreased up to 6%, 32%, and 20% respectively. The magnitude of these results suggests the usefulness of deeply integrating the multifunctional envelope technology with the balance of a building’s systems that process and distribute collected thermal energy. Demand for (purchased) electricity remained significant, indicating the potential for future investigation of on-site electrical storage, in addition to the modeled thermal storage. Cost outcomes were reported, with reductions (in summed energy and demand charges) of 35% in New York City, 64% in Phoenix, and 66% in Mountain View, relative to the highly glazed baseline model configurations. A shift was noted, from demand for cooling in the baseline configurations to demand for heating in the Q-MEF configurations. This shift indicates potential benefits from additional thermal storage technologies beyond those modeled in this study (such as ground-source heat exchange), and, overall, the possibility of energy-positive performance for this common class of buildings, in a range of climates.
Author Contributions
Conceptualization, N.N., J.O.V., M.J. and A.D.; Data curation, N.N., J.S.S., M.A.E. and K.P.; Formal analysis, N.N., J.S.S. and M.J.; Funding acquisition, N.N., J.O.V., M.J. and A.D.; Investigation, N.N., J.S.S., M.A.E. and K.P.; Methodology, N.N., K.P., J.O.V., M.J. and A.D.; Project administration, A.D.; Resources, N.N. and A.D.; Software, N.N., J.S.S., M.A.E. and K.P.; Supervision, A.D.; Validation, N.N., J.S.S., M.A.E. and K.P.; Visualization, N.N., M.A.E. and A.D.; Writing—original draft, N.N., M.A.E. and A.D.; Writing—review and editing, N.N., J.O.V., M.J. and A.D. All authors have read and agreed to the published version of the manuscript.
Funding
This research was funded by the U.S. Department of Energy, grant numbers DE-FG36-06GO86070 and 09EE0002285, the New York State Energy Research and Development Authority (NYSERDA), grant numbers A50417 and J50367, and the New York State Office of Science, Technology and Academic Research.
Institutional Review Board Statement
Not applicable.
Informed Consent Statement
Not applicable.
Data Availability Statement
Data avaialable upon request.
Acknowledgments
These findings are an expansion of work presented at the 16th Conference on Sustainable Development of Energy, Water, and Environment Systems (SDEWES) held (on-site and virtually) in Dubrovnik, Croatia, 10–15 October 2021. Material support was provided by SOM, LLC.
Conflicts of Interest
The authors declare no conflict of interest. The funders had no role in the design of the study; in the collection, analyses, or interpretation of data; in the writing of the manuscript, or in the decision to publish the results.
Nomenclature
| Variables | |
| cp | specific heat (kJ/kg-K) |
| C | heat capacity (kWh/K) |
| E | electricity (kW) |
| G | solar power (kW) |
| i | instance of zone or cavity balance |
| I | solar irradiance (W/m2) |
| K | proportional gain constant |
| n | time step (hour) |
| Q | heat collected or transferred (kW) |
| R | thermal resistance (W/m2-K) |
| T | temperature (°C) or transmittance (n.d.) |
| Greek letters | |
| λ | tracker pitch angle (radians) |
| ϕ | tracker yaw angle (radians) |
| Subscripts and Abbreviations | |
| AEC | architecture, engineering, and construction sector |
| AIF | active integrated facade |
| ASHRAE | American Society of Heating, Refrigeration, and Air-Conditioning Engineers |
| BEM | building energy model |
| BITCoPT | building envelope-integrated, transparent concentrating photovoltaic and thermal collector |
| BL | baseline (energy model) |
| BL40 | baseline energy model with 40% window-wall ratio |
| BL95 | baseline energy model with 95% window-wall ratio |
| buffer | high-range buffer |
| cav | envelope cassette cavity |
| chilled | chilled distribution loop |
| cond | conduction and convection (non-radiative) |
| conv | energy conversion |
| CDD | cooling degree days |
| COP | coefficient of performance |
| db | dry-bulb (temperature) |
| Diff | diffuse (insolation component) |
| DN | direct normal (insolation component) |
| DOAS | dedicated outdoor air system |
| DOE | United States Department of Energy |
| Egen | electrical generation |
| env | environment |
| EPB | energy-positive building |
| EUI | energy use intensity |
| flush | cavity flushing |
| full | threshold for BITCoPT module gap function |
| gap | spacing between BITCoPT modules |
| gen | generated (by envelope-integrated collector) |
| HDD | heating degree days |
| HVAC | heating, ventilation, and air conditioning system |
| hz | horizontal |
| IGU | insulated glazing unit |
| ind | indoor |
| lim | limit |
| kWh-E | Electricity energy unit |
| kWh-Q | Thermal energy unit |
| loop | pertaining to chilled or rejection-stage hydronic loops |
| loss | energy lost to ambient |
| MTV | Mountain View, California, USA (climate) |
| NZEB | net-zero energy building |
| NYC | New York City, New York, USA (climate) |
| offset | temperature offset |
| outd | outdoor |
| PHX | Phoenix, Arizona, USA (climate) |
| Q-MEF | quality-matched energy flow network; also a model configuration |
| Q-MEF + Tilt | model configuration adding solar-optimized façade geometry |
| rej | rejection-range (heating) loop |
| SHW | service hot water |
| target | target temperature |
| TES | thermal energy storage component |
| vert | vertical |
| vis | visible (transmittance) |
| wall | insulated wall of TES component |
References
- Dyson, A. Interdisciplinary Co-Development of Intelligent Building Envelopes with On-Site Power Generation. In Proceedings of the 91st ACSA International Conference Proceedings, Helsinki, Finland, 27–30 July 2003; Available online: https://www.acsa-arch.org/chapter/interdisciplinary-co-development-of-intelligent-building-envelopes-with-on-site-power-generation/ (accessed on 18 November 2020).
- Novelli, N.; Phillips, K.; Shultz, J.; Derby, M.M.; Stark, P.R.H.; Craft, J.; Salvas, R.; Derby, S.; Jensen, M.K.; Dyson, A. Experimental Investigation of a Building Envelope-Integrated, Transparent Concentrating Photovoltaic and Thermal Collector. Renew. Energy 2021, 176, 617–634. [Google Scholar] [CrossRef]
- Novelli, N.; Gordon, R.; Varfolomeev, I. Separating direct from diffuse: Observations of visible transmittance through a tracking photovoltaic envelope. In Proceedings of the Facade Tectonics Institute 2018 World Congress Proceedings, Los Angeles, CA, USA, 12–13 March 2018; Volume 2, pp. 355–364. Available online: https://www.facadetectonics.org/publications/collection/publications (accessed on 27 March 2018).
- Lechner, N. Heating, Cooling, Lighting: Sustainable Design Methods for Architects, 3rd ed.; Wiley: Hoboken, NJ, USA, 2008. [Google Scholar]
- Wong, I.L. A review of daylighting design and implementation in buildings. Renew. Sustain. Energy Rev. 2017, 74, 959–968. [Google Scholar] [CrossRef] [Green Version]
- Salcido, J.C.; Raheem, A.A.; Issa, R.R. From simulation to monitoring: Evaluating the potential of mixed-mode ventilation (MMV) systems for integrating natural ventilation in office buildings through a comprehensive literature review. Energy Build. 2016, 127, 1008–1018. [Google Scholar] [CrossRef]
- Kuhn, T.E.; Erban, C.; Heinrich, M.; Eisenlohr, J.; Ensslen, F.; Neuhaus, D.H. Review of technological design options for building integrated photovoltaics (BIPV). Energy Build. 2021, 231, 110381. [Google Scholar] [CrossRef]
- Lamnatou, C.; Chemisana, D.; Mateus, R.; Almeida, M.; da Silva, S.M. Review and perspectives on Life Cycle Analysis of solar technologies with emphasis on building-integrated solar thermal systems. Renew. Energy 2015, 75, 833–846. [Google Scholar] [CrossRef]
- Sharaf, O.Z.; Orhan, M.F. Concentrated photovoltaic thermal (CPVT) solar collector systems: Part II—Implemented systems, performance assessment, and future directions. Renew. Sustain. Energy Rev. 2015, 50, 1566–1633. [Google Scholar] [CrossRef]
- Li, G.; Xuan, Q.; Akram, M.W.; Akhlaghi, Y.G.; Liu, H.; Shittu, S. Building integrated solar concentrating systems: A review. Appl. Energy 2020, 260, 114288. [Google Scholar] [CrossRef]
- Probst, M.M.; Roecker, C. Towards an improved architectural quality of building integrated solar thermal systems (BIST). Sol. Energy 2007, 81, 1104–1116. [Google Scholar] [CrossRef]
- Elsayed, A.T.; Mohamed, A.A.; Mohammed, O.A. DC microgrids and distribution systems: An overview. Electr. Power Syst. Res. 2015, 119, 407–417. [Google Scholar] [CrossRef]
- Kim, M.K.; Leibundgut, H.; Choi, J.-H. Energy and exergy analyses of advanced decentralized ventilation system compared with centralized cooling and air ventilation systems in the hot and humid climate. Energy Build. 2014, 79, 212–222. [Google Scholar] [CrossRef]
- Pang, H.; Lo, E.; Pong, B. DC Electrical Distribution Systems in Buildings. In Proceedings of the 2nd International Conference on Power Electronics Systems and Applications, Hong Kong, China, 2–14 November 2006; pp. 115–119. [Google Scholar] [CrossRef]
- Mumma, S.A. Designing dedicated outdoor air systems. ASHRAE J. 2001, 43, 28. [Google Scholar]
- Roth, K.; Dieckmann, J.; Zogg, R.; Brodrick, J. Chilled Beam Cooling. ASHRAE J. 2007, 49, 84–86. [Google Scholar]
- Kintner-Meyer, M.C.; Subbarao, K.; Kumar, N.P.; Bandyopadhyay, G.K.; Finley, C.; Koritarov, V.S.; Molburg, J.C.; Wang, J.; Zhao, F.; Brackney, L.; et al. The Role of Energy Storage in Commercial Building A Preliminary Report. In Pacific Northwest National Laboratory; Pacific Northwest National Laboratory: Benton County, WA, USA, 2010. [Google Scholar] [CrossRef] [Green Version]
- Pintaldi, S.; Perfumo, C.; Sethuvenkatraman, S.; White, S.; Rosengarten, G. A review of thermal energy storage technologies and control approaches for solar cooling. Renew. Sustain. Energy Rev. 2015, 41, 975–995. [Google Scholar] [CrossRef]
- MacCracken, M.M. Thermal Energy Storage Myths. ASHRAE J. 2003, 45, 36–43. [Google Scholar] [CrossRef]
- Dincer, I. On thermal energy storage systems and applications in buildings. Energy Build. 2002, 34, 377–388. [Google Scholar] [CrossRef]
- Nassif, N.; Tesiero, R.C.; Singh, H. Impact of Ice Thermal Storage on Cooling Energy Cost for Commercial HVAC Systems. ASHRAE Trans. 2013, 119, 1–7. [Google Scholar]
- Lizana, J.; Chacartegui, R.; Padura, A.B.; Valverde, J.M. Advances in thermal energy storage materials and their applications towards zero energy buildings: A critical review. Appl. Energy 2017, 203, 219–239. [Google Scholar] [CrossRef]
- Christopher, S.; Parham, K.; Mosaffa, A.; Farid, M.; Ma, Z.; Thakur, A.K.; Xu, H.; Saidur, R. A critical review on phase change material energy storage systems with cascaded configurations. J. Clean. Prod. 2021, 283, 124653. [Google Scholar] [CrossRef]
- Zhang, Z.; Ci, Z.; Zhang, T. Heat-Storage Performance Optimization for Packed Bed Using Cascaded PCMs Capsules. Int. J. Thermophys. 2021, 42, 1–2. [Google Scholar] [CrossRef]
- Lizana, J.; Chacartegui, R.; Barrios-Padura, A.; Ortiz, C. Advanced low-carbon energy measures based on thermal energy storage in buildings: A review. Renew. Sustain. Energy Rev. 2018, 82, 3705–3749. [Google Scholar] [CrossRef]
- Herrmann, U.; Kearney, D.W. Survey of Thermal Energy Storage for Parabolic Trough Power Plants. J. Sol. Energy Eng. 2002, 124, 145–152. [Google Scholar] [CrossRef] [Green Version]
- Schweigler, C.; Hiebler, S.; Keil, C.; Köbel, H.; Kren, C.; Mehling, H. Low-Temperature Heat Storage for Solar Heating and Cooling Applications. ASHRAE Trans. 2007, 113, 89–96. [Google Scholar]
- Hartkopf, V.; Archer, D.H.; Loftness, V. Building As Power Plant–BAPP/Invention Works Project at Carnegie Mellon University, Pittsburgh PA, USA. In Proceedings of the Fourth International Conference for Enhanced Building Operations, Paris, France, 18–19 October 2004; Available online: http://hdl.handle.net/1969.1/5033 (accessed on 2 May 2012).
- Ferrara, M.; Coleman, J.; Meggers, F. Exploring potentialities of energy-connected buildings: Performance assessment of an innovative low-exergy design concept for a building heating supply system. Energy Procedia 2017, 122, 1075–1080. [Google Scholar] [CrossRef]
- Coventry, J.; Lovegrove, K. Development of an approach to compare the ‘value’ of electrical and thermal output from a domestic PV/thermal system. Sol. Energy 2003, 75, 63–72. [Google Scholar] [CrossRef]
- Littlefair, P.J. The luminous efficacy of daylight: A review. Light. Res. Technol. 1985, 17, 162–182. [Google Scholar] [CrossRef]
- Pattison, P.M.; Hansen, M.; Tsao, J.Y. LED lighting efficacy: Status and directions. Comptes Rendus. Phys. 2018, 19, 134–145. [Google Scholar] [CrossRef]
- Dyson, A.; Stark, P.R.H.; Jensen, M.K. Integrated Concentrating (IC) Solar Facade System. Department of Energy Peer Review. 2007. Available online: https://www1.eere.energy.gov/solar/review_meeting/pdfs/sys_9_dyson_rensselaer.pdf (accessed on 1 April 2020).
- Novelli, N.; Shultz, J.; Dyson, A. Development of a modeling strategy for adaptive multifunctional solar energy building envelope systems. In Proceedings of the Symposium on Simulation for Architecture & Urban Design, Washington, DC, USA, 12–15 April 2015; pp. 35–42. [Google Scholar]
- Cabeza, L.F.; Chàfer, M. Technological options and strategies towards zero energy buildings contributing to climate change mitigation: A systematic review. Energy Build. 2020, 219, 110009. [Google Scholar] [CrossRef]
- Tronchin, L.; Manfren, M.; Nastasi, B. Energy efficiency, demand side management and energy storage technologies—A critical analysis of possible paths of integration in the built environment. Renew. Sustain. Energy Rev. 2018, 95, 341–353. [Google Scholar] [CrossRef]
- Gilbride, M.; Loveland, J.; Burpee, H.; Kriegh, J.; Meek, C. Occupant-Behavior-Driven Energy Savings at the Bullitt Center in Seattle, Washington. ACEEE Summer Study Energy Effic. Build. 2016, 15, 8-1–8-15. [Google Scholar]
- Torío, H.; Angelotti, A.; Schmidt, D. Exergy analysis of renewable energy-based climatisation systems for buildings: A critical view. Energy Build. 2009, 41, 248–271. [Google Scholar] [CrossRef]
- Nishikawa, R.; Shukuya, M. Numerical analysis on the production of cool exergy by making use of heat capacity of building envelopes. In Proceedings of the Sixth International IBPSA Conference, Kyoto, Japan, 13–15 September 1999; Available online: http://www.inive.org/members_area/medias/pdf/Inive/IBPSA/UFSC691.pdf (accessed on 27 January 2016).
- Hepbasli, A. Low exergy (LowEx) heating and cooling systems for sustainable buildings and societies. Renew. Sustain. Energy Rev. 2012, 16, 73–104. [Google Scholar] [CrossRef]
- Meggers, F.; Ritter, V.; Goffin, P.; Baetschmann, M.; Leibundgut, H. Low exergy building systems implementation. Energy 2012, 41, 48–55. [Google Scholar] [CrossRef]
- Dunkelberg, E.; Schneller, A.; Bachmann, M.; Kriegel, M. LowExTra-Feasibility of a Multi-Conductor District Heating System. Energy Procedia 2018, 149, 427–434. [Google Scholar] [CrossRef]
- Lehmann, B.; Dorer, V.; Koschenz, M. Application range of thermally activated building systems tabs. Energy Build. 2007, 39, 593–598. [Google Scholar] [CrossRef]
- Lydon, G.; Hofer, J.; Svetozarevic, B.; Nagy, Z.; Schlueter, A. Coupling energy systems with lightweight structures for a net plus energy building. Appl. Energy 2017, 189, 310–326. [Google Scholar] [CrossRef]
- Azami, A.; Sevinç, H. The energy performance of building integrated photovoltaics (BIPV) by determination of optimal building envelope. Build. Environ. 2021, 199, 107856. [Google Scholar] [CrossRef]
- Moe, K. Integrated Design in Contemporary Architecture; Princeton Architectural Press: New York, NY, USA, 2008. [Google Scholar]
- Moe, K. Convergence: An Architectural Agenda for Energy; Routledge: Oxfordshire, UK, 2013. [Google Scholar]
- Dyson, A.; Ngai, T.; Vollen, J. Characterizing the Problem: Bioenergetic Information Modeling. In BIM in Academia; Yale School of Architecture: New Haven, CT, USA, 2011. [Google Scholar]
- Sayadi, S.; Tsatsaronis, G.; Morosuk, T. Dynamic exergetic assessment of heating and cooling systems in a complex building. Energy Convers. Manag. 2019, 183, 561–576. [Google Scholar] [CrossRef]
- Buonomano, A.; Calise, F.; Palombo, A.; Vicidomini, M. Transient analysis, exergy and thermo-economic modelling of façade integrated photovoltaic/thermal solar collectors. Renew. Energy 2019, 137, 109–126. [Google Scholar] [CrossRef]
- Baeten, B.; Rogiers, F.; Helsen, L. Reduction of heat pump induced peak electricity use and required generation capacity through thermal energy storage and demand response. Appl. Energy 2017, 195, 184–195. [Google Scholar] [CrossRef]
- Gagnon, P.J.; Govindarajan, A.; Bird, L.A.; Barbose, G.; Darghouth, N.; Mills, A. Solar + Storage Synergies for Managing Commercial-Customer Demand Charges; NREL: Golden, CO, USA, 2017. [Google Scholar] [CrossRef] [Green Version]
- Deo, A.; Mishra, G.; Tiwari, G. A thermal periodic theory and experimental validation of building integrated semi-transparent photovoltaic thermal (BiSPVT) system. Sol. Energy 2017, 155, 1021–1032. [Google Scholar] [CrossRef]
- Abdelalim, A.; O’Brien, W.; Shi, Z. Data visualization and analysis of energy flow on a multi-zone building scale. Autom. Constr. 2017, 84, 258–273. [Google Scholar] [CrossRef]
- NREL and US DOE. Open Studio 2.7. 2018. Available online: https://www.openstudio.net/ (accessed on 30 November 2018).
- Crawley, D.B.; Lawrie, L.K.; Winkelmann, F.C.; Buhl, W.; Huang, Y.; Pedersen, C.O.; Strand, R.K.; Liesen, R.J.; Fisher, D.E.; Witte, M.J.; et al. EnergyPlus: Creating a new-generation building energy simulation program. Energy Build. 2001, 33, 319–331. [Google Scholar] [CrossRef]
- US Energy Information Administration. Commercial Buildings Energy Consumption Survey (CBECS) Data. 2015. Available online: http://www.eia.gov/consumption/commercial/data/2012/#b6 (accessed on 18 July 2015).
- Etman, M.A.; Novelli, N.; Shultz, J.; Phillips, K.; Andow, B.; Dyson, A. Daylighting effect of separating direct and diffuse insolation with facade-integrated, transparent solar collector. In Proceedings of the 31st International PLEA Conference, Bologna, Italy, 9–11 September 2015. [Google Scholar]
- Daßler, I.; Mittelbach, W. Solar Cooling with Adsorption Chillers. Energy Procedia 2012, 30, 921–929. [Google Scholar] [CrossRef] [Green Version]
- Reinhart, C.F. Lightswitch-2002: A model for manual and automated control of electric lighting and blinds. Sol. Energy 2004, 77, 15–28. [Google Scholar] [CrossRef] [Green Version]
- Hajiah, A.; Krarti, M. Optimal controls of building storage systems using both ice storage and thermal mass—Part II: Parametric analysis. Energy Convers. Manag. 2012, 64, 509–515. [Google Scholar] [CrossRef]
- Chen, J.; Lu, L. Development of radiative cooling and its integration with buildings: A comprehensive review. Sol. Energy 2020, 212, 125–151. [Google Scholar] [CrossRef]
Figure 1.
Transitioning from centralized (grid-source optimized) systems to distributed, integrated systems (climate-sourced optimized), matching resource (sunlight) to service demands (daylighting, power, cooling, heating).
Figure 1.
Transitioning from centralized (grid-source optimized) systems to distributed, integrated systems (climate-sourced optimized), matching resource (sunlight) to service demands (daylighting, power, cooling, heating).

Figure 2.
Cascade of thermal potentials for servicing built environment demands. Optimal exergy application performed by cascading heat through and into processes that require different grades (temperatures) of energy. In the current Q-MEF investigation, thermal storage in three discrete ranges (driving, rejection/heating, chilled) governs energy flow between processes.

Figure 3.
Multifunctional envelope-integrated solar collector: BITCoPT. Model of BITCoPT incorporated into Q-MEF modeling to represent spatially simultaneous daylighting and cogeneration from glazed envelope areas.
Figure 3.
Multifunctional envelope-integrated solar collector: BITCoPT. Model of BITCoPT incorporated into Q-MEF modeling to represent spatially simultaneous daylighting and cogeneration from glazed envelope areas.

Figure 4.
Q-MEF model block diagram, showing interfaces between precursor models and additional functions.
Figure 4.
Q-MEF model block diagram, showing interfaces between precursor models and additional functions.

Figure 5.
Building configurations and components from modeling environments.
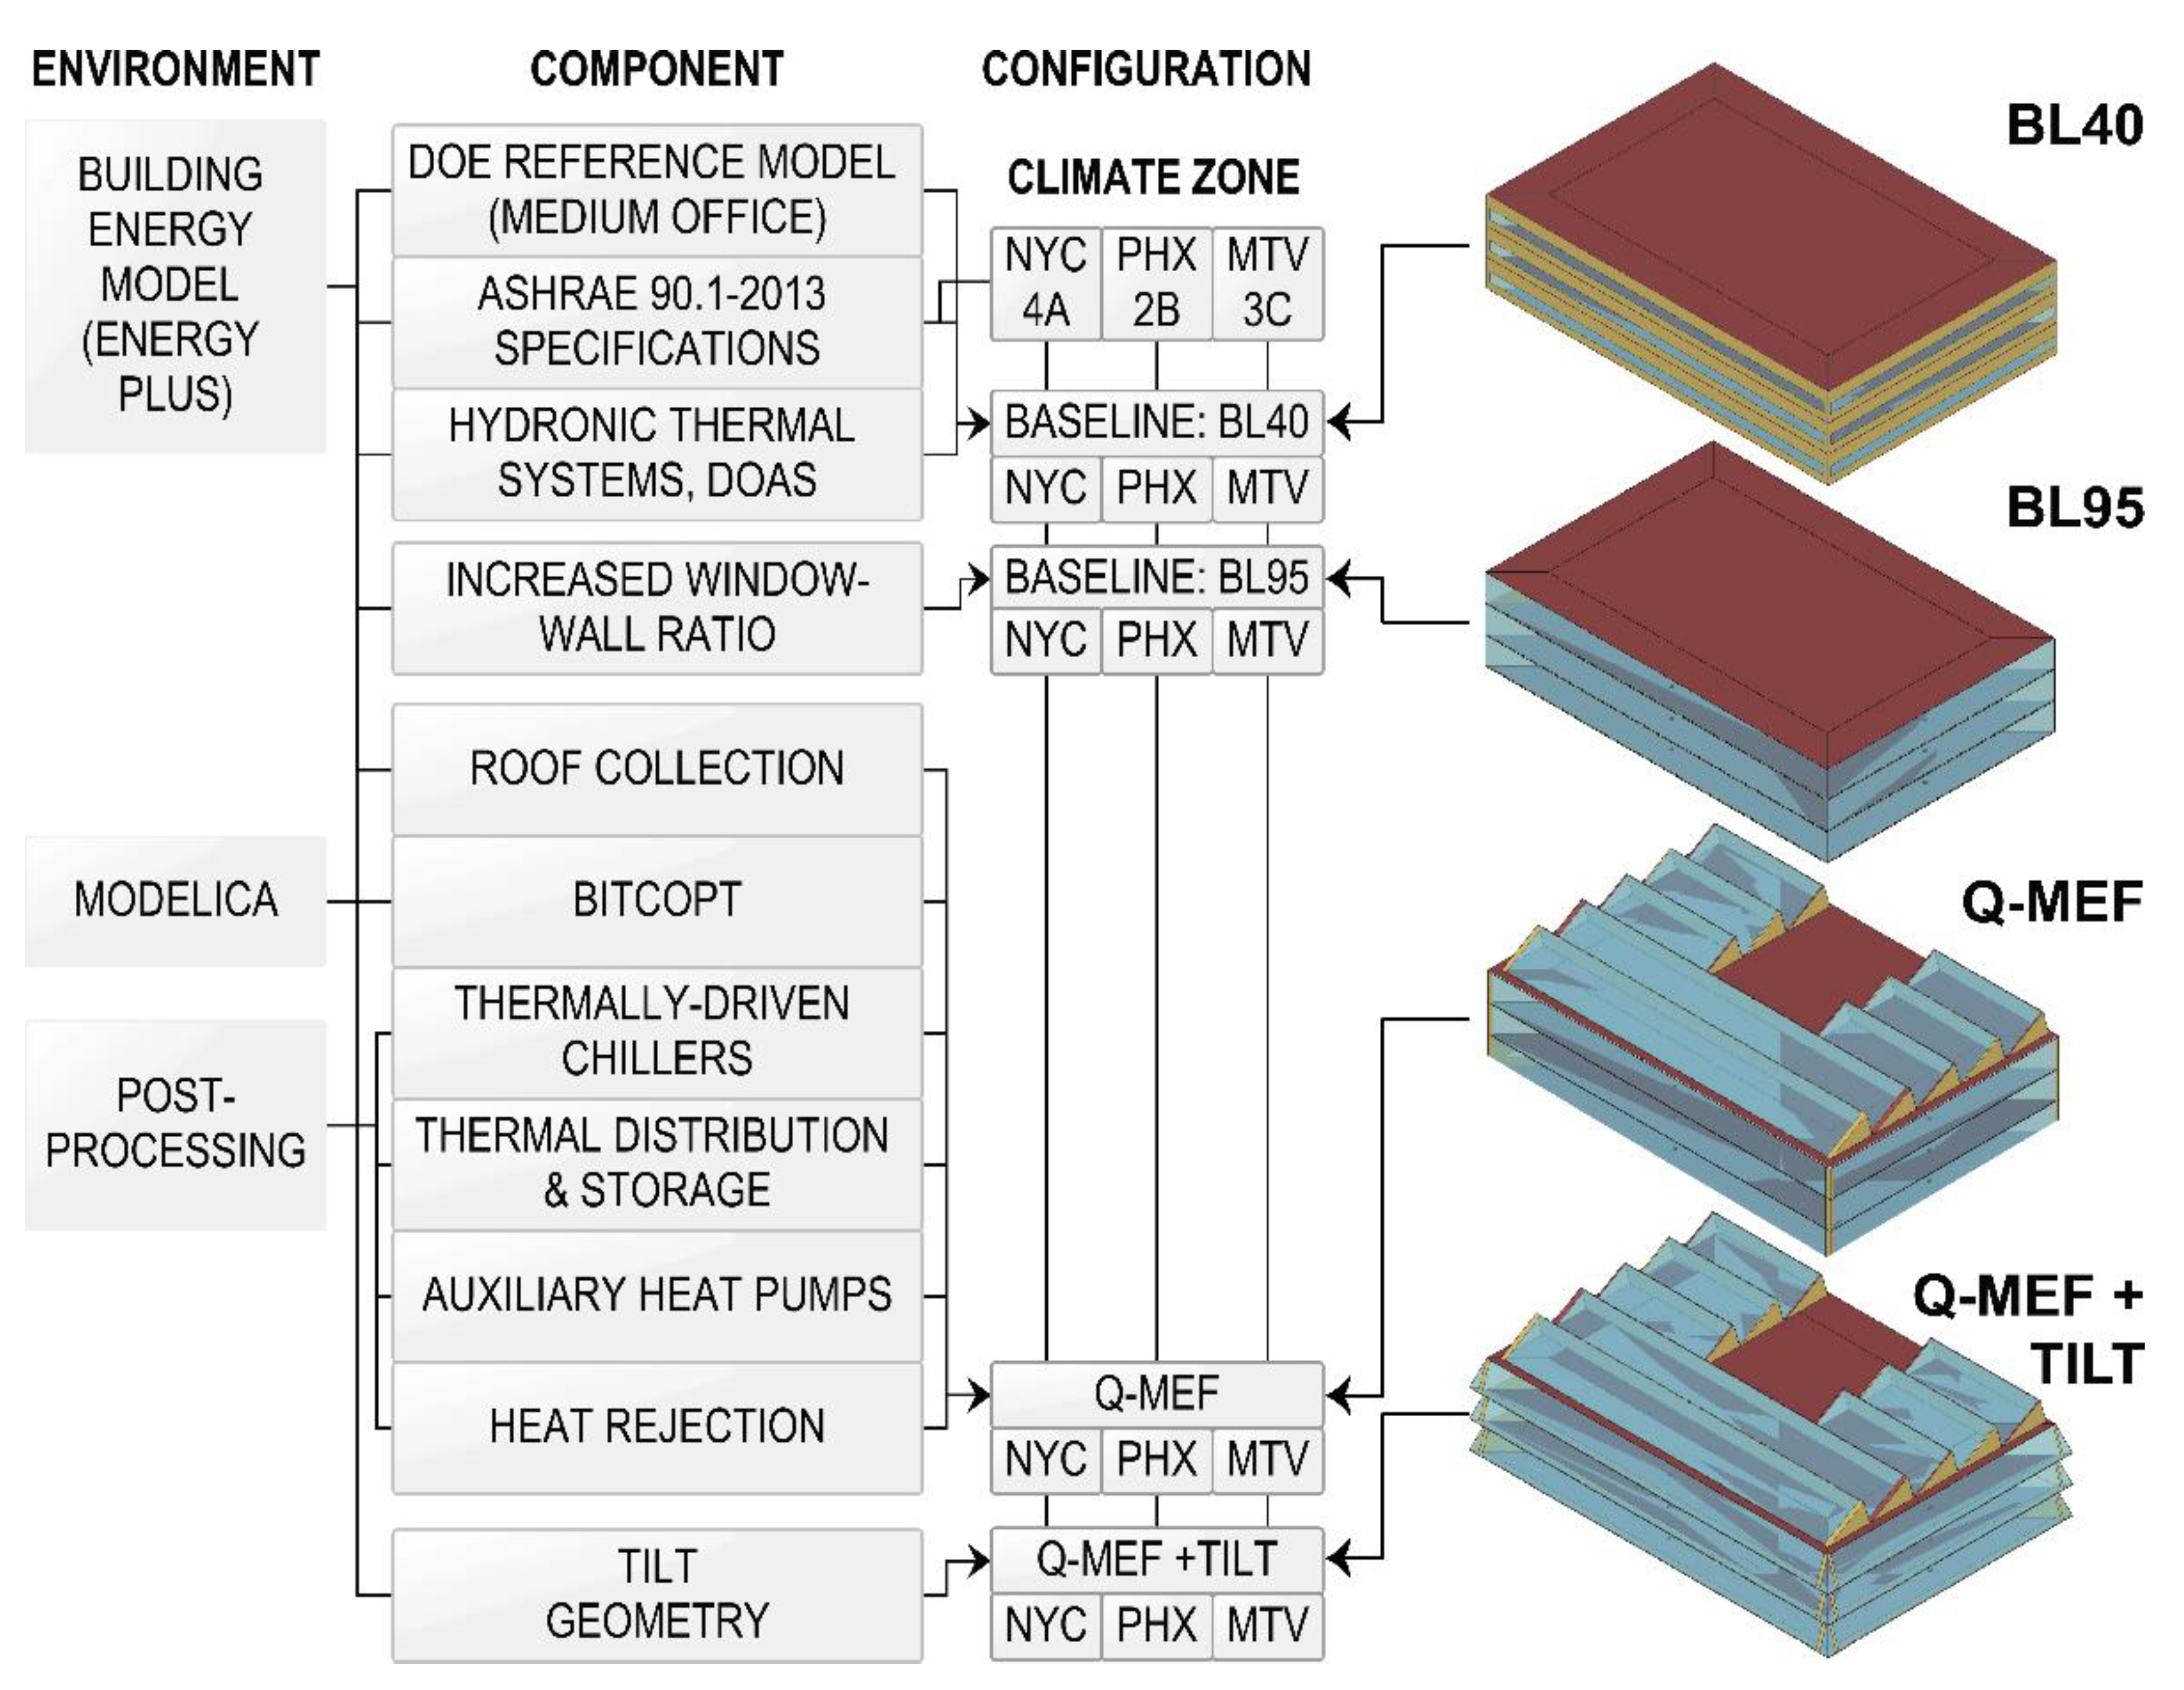
Figure 6.
Plumbing schematic showing chilled and rejection-range distribution. Storage or distribution applied at three temperature ranges. Distributed adsorption chillers and auxiliary chiller operate in parallel between heating/rejection loop and chilled loop to maintain operating temperatures.
Figure 6.
Plumbing schematic showing chilled and rejection-range distribution. Storage or distribution applied at three temperature ranges. Distributed adsorption chillers and auxiliary chiller operate in parallel between heating/rejection loop and chilled loop to maintain operating temperatures.
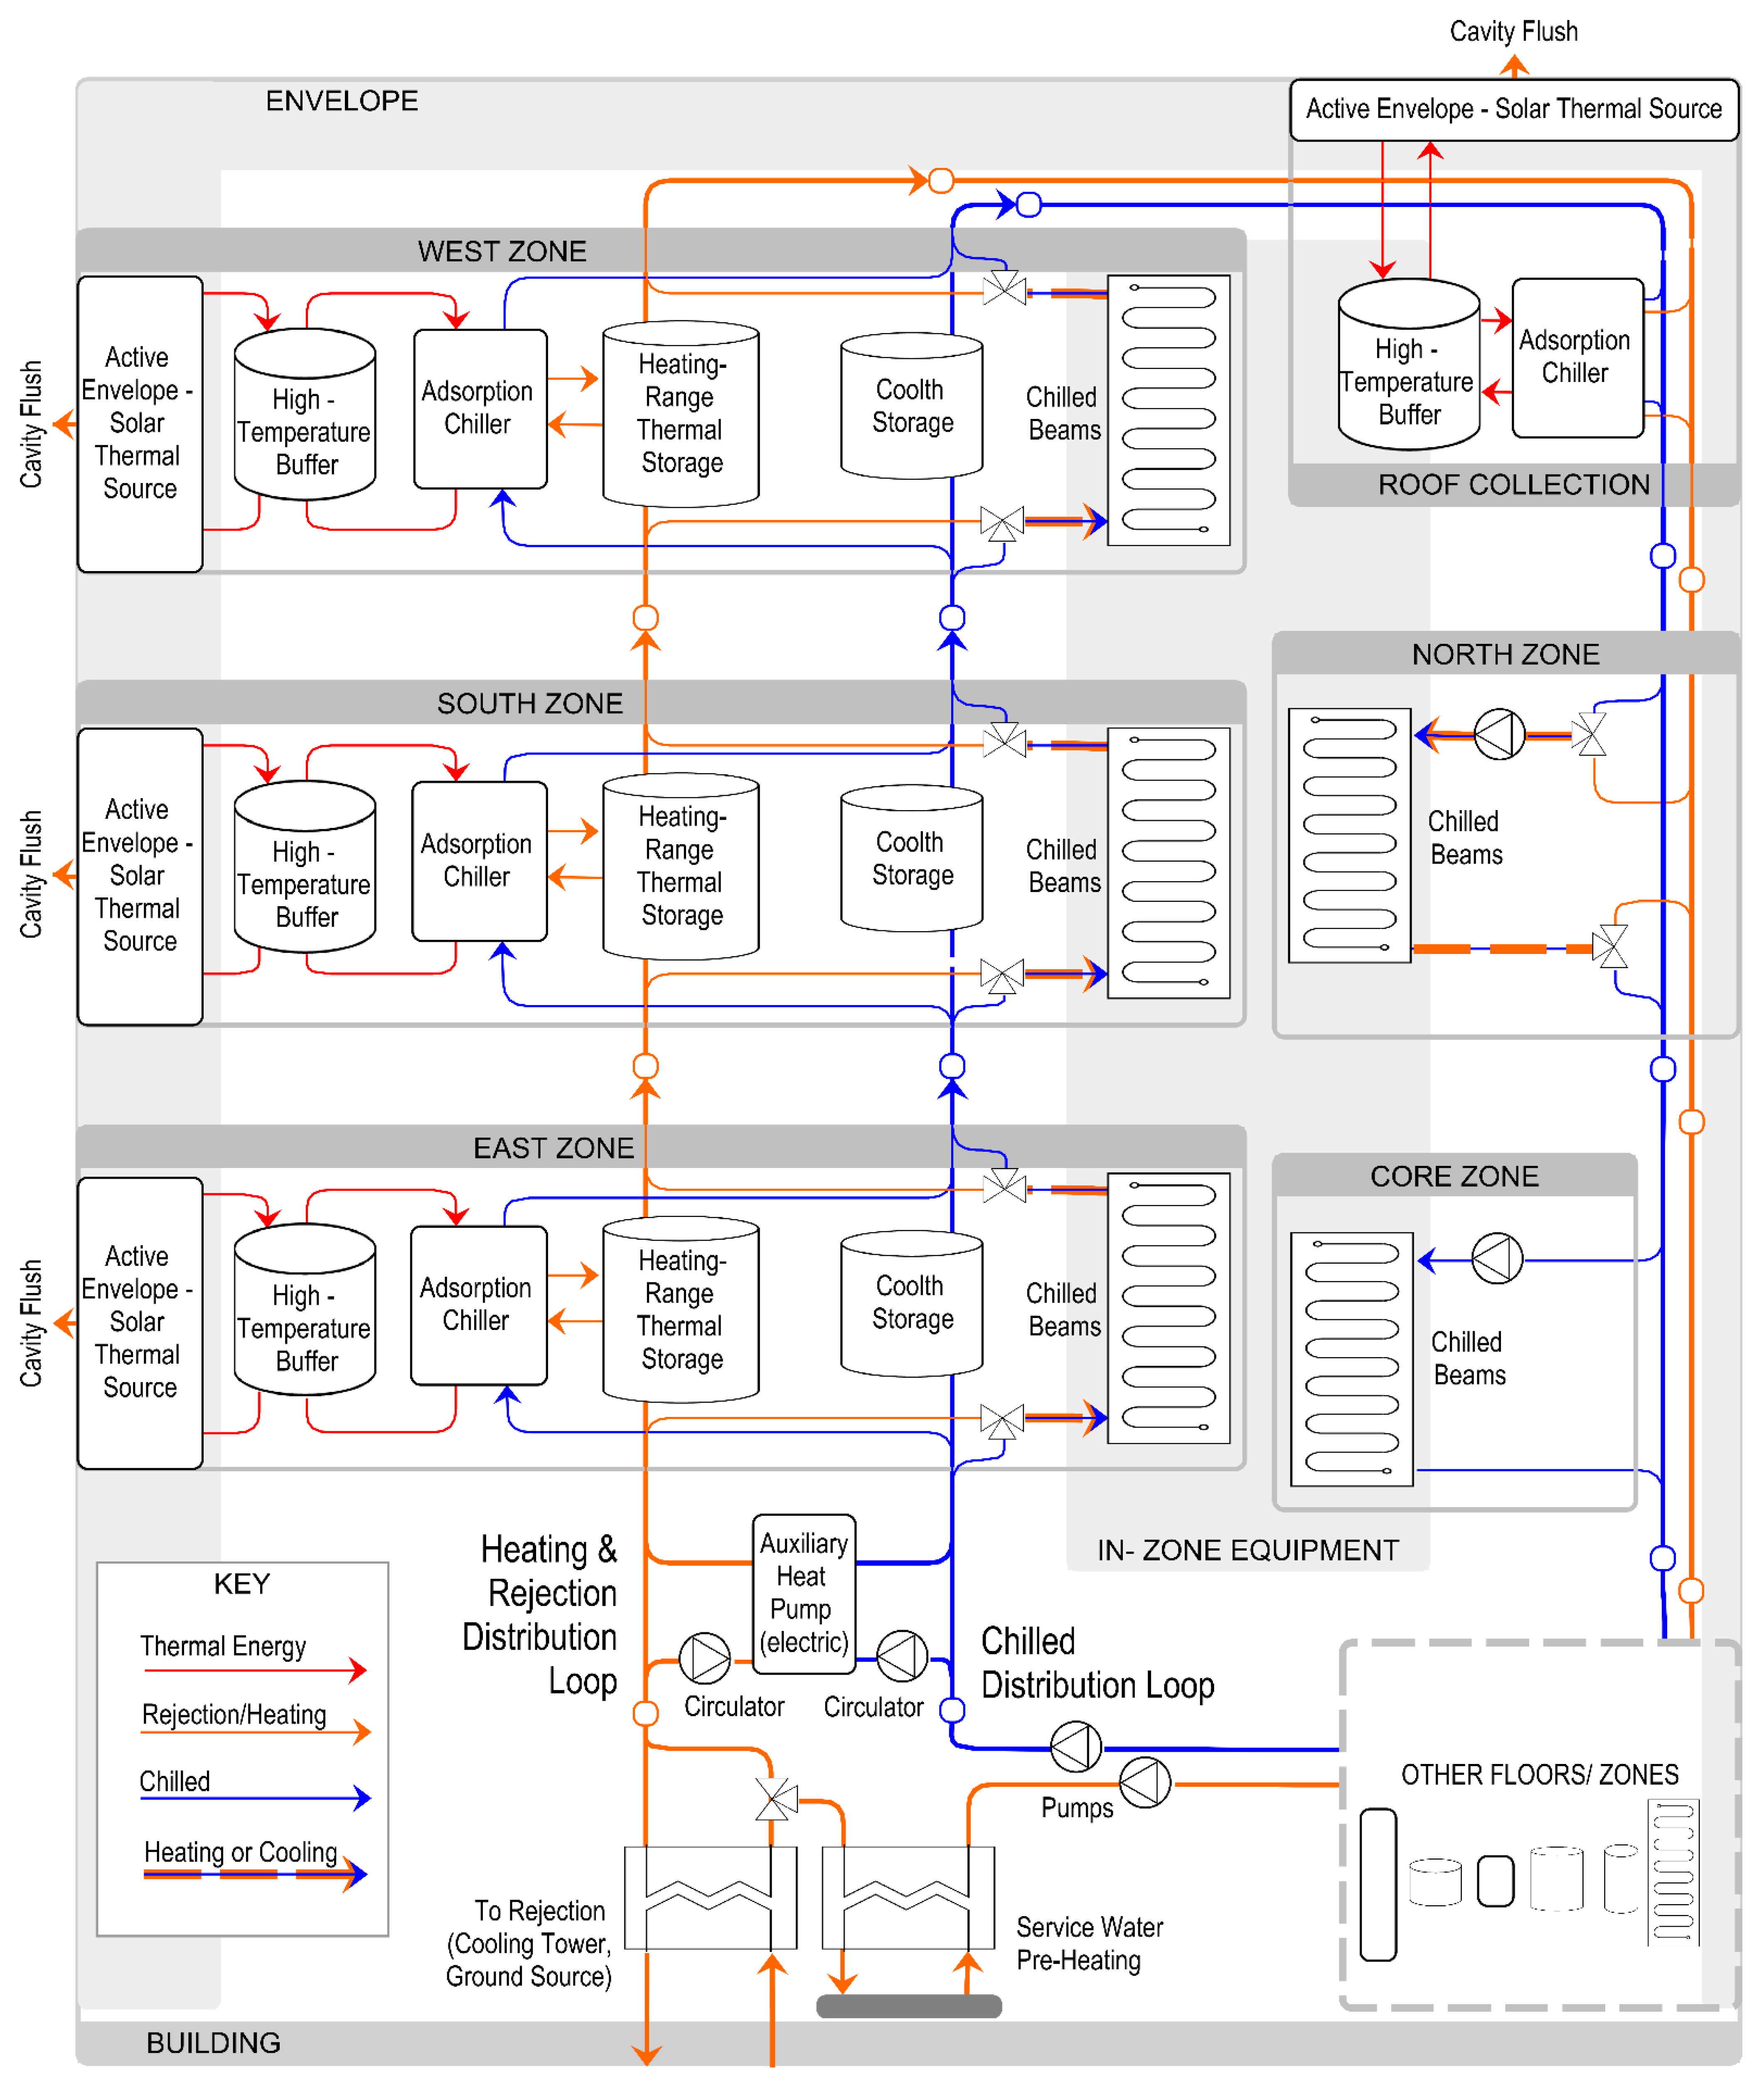
Figure 7.
Modeled method of flushing excess heat from the cavity.

Figure 8.
Thermal energy transfers, year-long cumulative summary.

Figure 9.
Monthly utility costs, summed (electrical energy, electrical demand, gas).

Figure 10.
Monthly utility costs breakdown (Mountain View shown) showing net-meter benefits in the summer for Q-MEF + Tilt configuration.
Figure 10.
Monthly utility costs breakdown (Mountain View shown) showing net-meter benefits in the summer for Q-MEF + Tilt configuration.
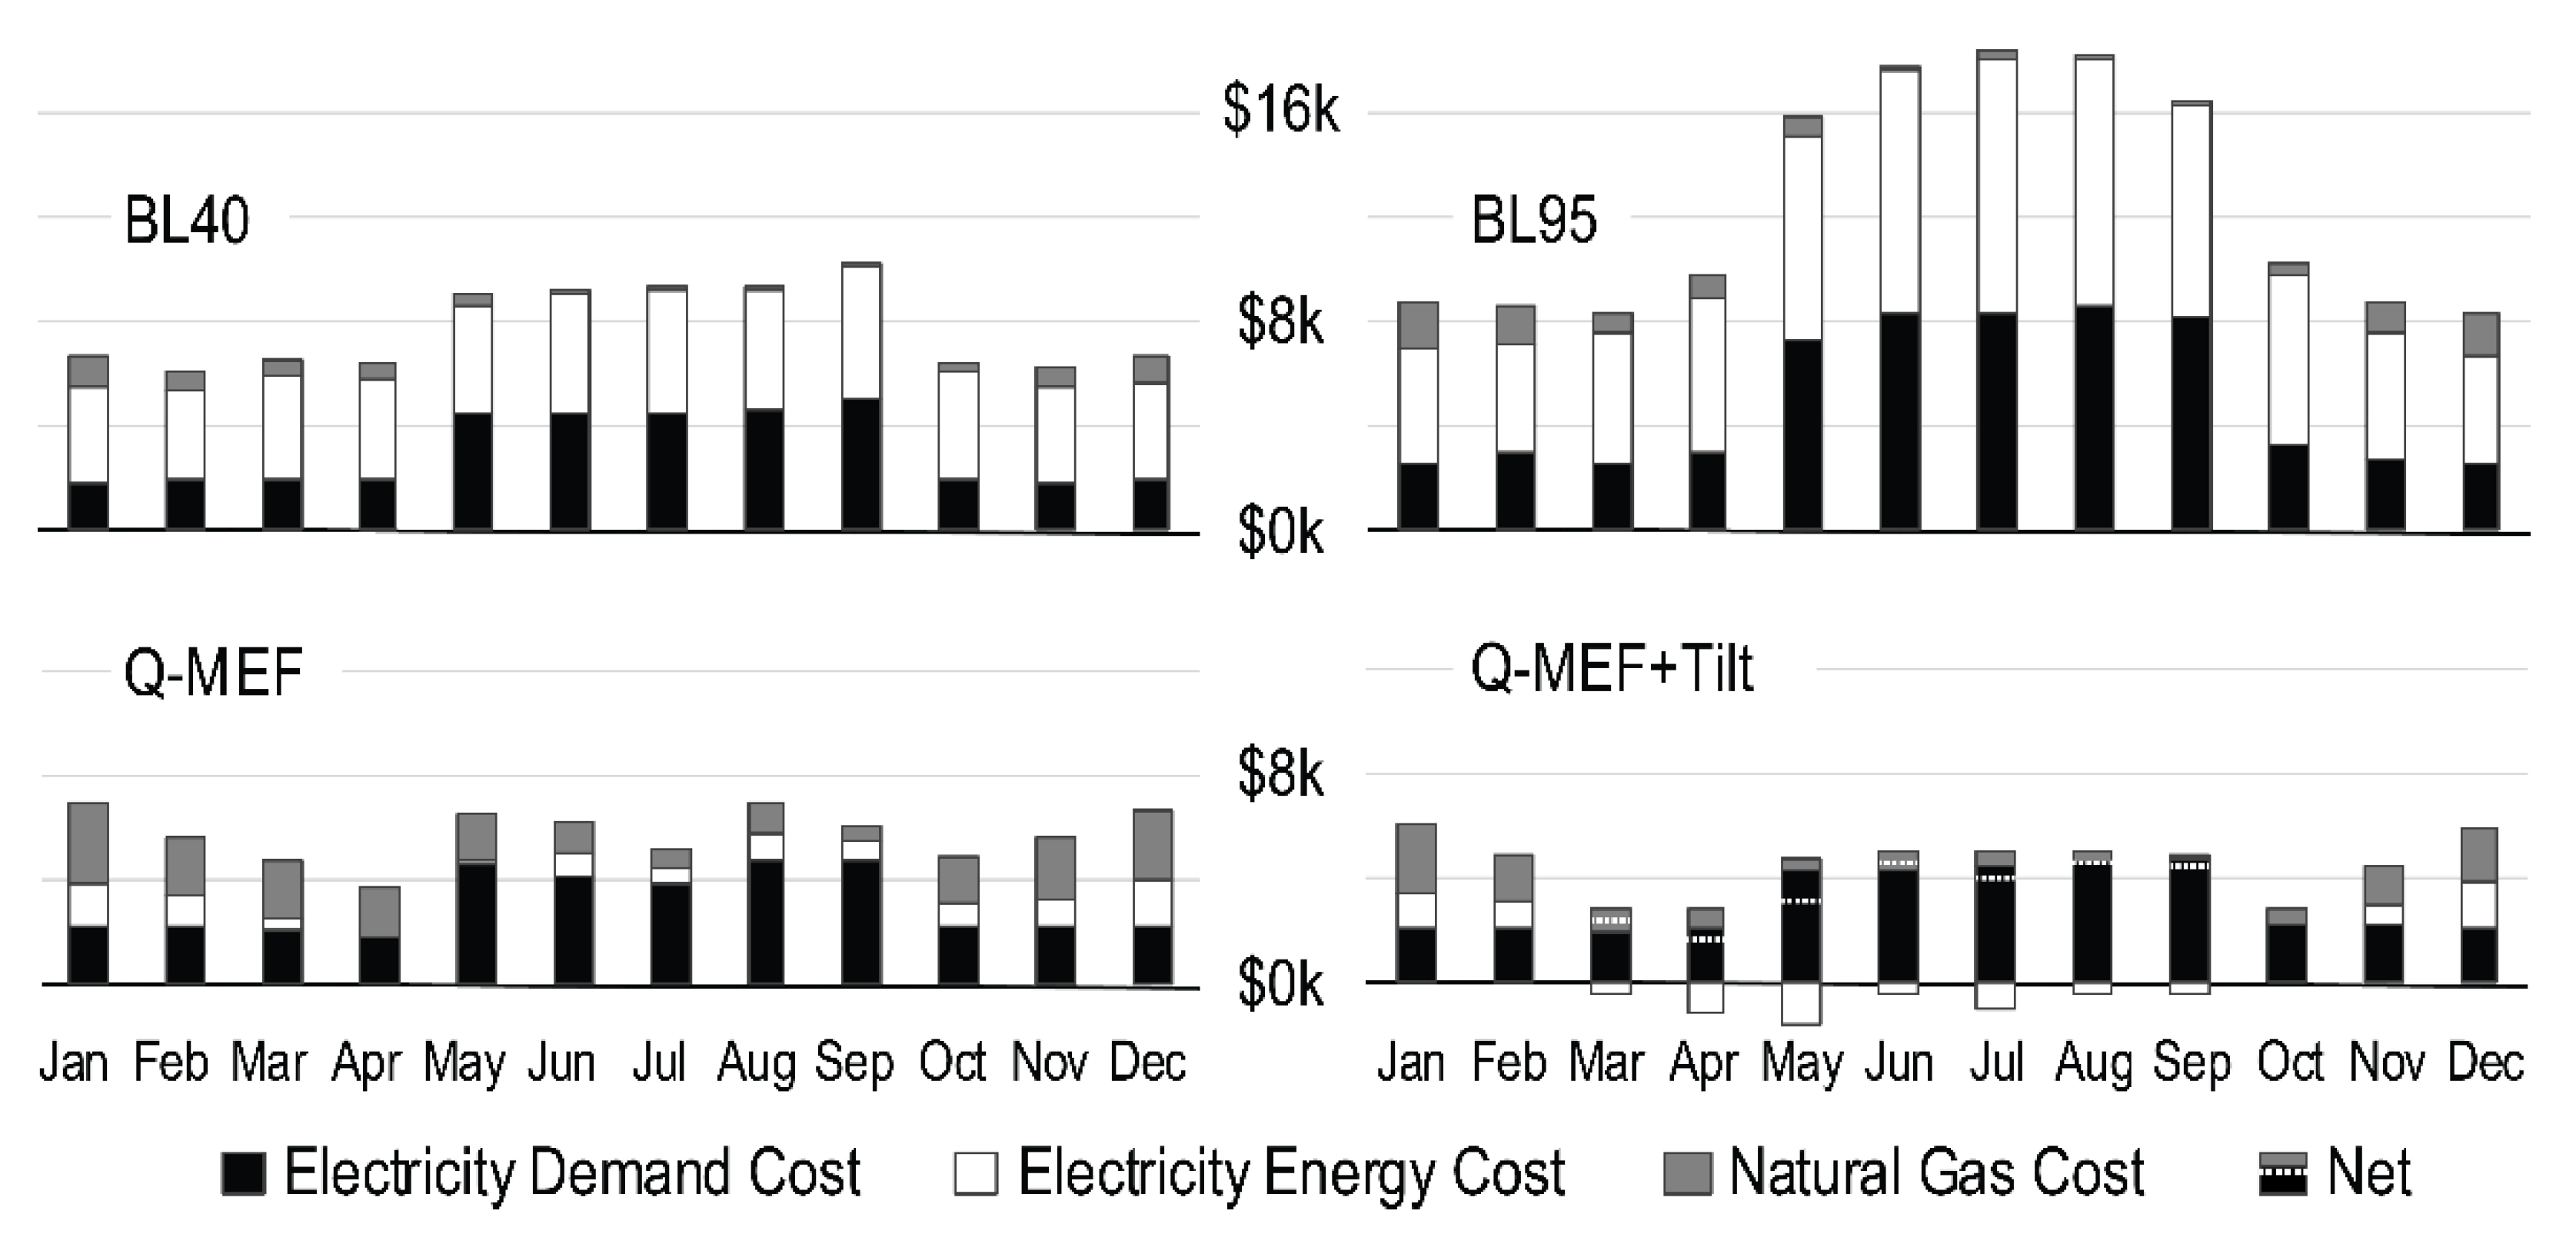

Table 1.
Climates used for analysis.
| Location | Climate Description (ASHRAE Zone) | Degree Days | Tdb,outd(99%) Tdb,outd(1%) | ||
|---|---|---|---|---|---|
| Base 10 °C | Base 18.3 °C | ||||
| New York City (NYC) | Humid Subtropical/ Continental (4A) | HDD: CDD: | 2118 962 | 672 2557 | 31.8 °C −8.2 °C |
| Phoenix (PHX) | Subtropical Desert (2B) | HDD: CDD: | 5067 17 | 2532 523 | 42.3 °C 5.2 °C |
| Mountain View (MTV) | Warm—summer Mediterranean (3C) | HDD: CDD: | 2177 64 | 267 1196 | 28.7 °C 3.7 °C |
Table 2.
Model configuration parameters.
| Model Configuration | 40% Glazed BL40 | 95% Glazed BL95 | Q-MEF | Q-MEF + Tilt |
|---|---|---|---|---|
| Climates Modeled | New York City, NY/Phoenix, AZ/Mountain View, CA | |||
| Geometry | DOE Prototype: medium office | DOE Prototype: medium office | DOE Prototype: medium office + inclined clerestories | DOE Prototype: medium office + inclined clerestories tilted facades |
| Length (east–west) | 49.9 m | |||
| Width (north–south) | 33.3 m | |||
| Floors | 3 | |||
| Floor to floor height | 3.96 m | |||
| Perimeter zones depth | 4.57 m | |||
| Total floor area | 4980 m2 | |||
| Envelope Specifications | ||||
| Wall U value (W/m2-K) | 0.204/0.251/0.223 | 0.204/0.251/0.223 | 0.429 | 0.429 |
| Roof U value (W/m2-K) | 0.223 | 0.223 | 0.223 | 0.223 |
| Façade glazing ratio | 40% | 95% | 95% | 95% |
| BITCOPT integrated | NO | NO | YES | YES |
| Glazing System | to ASHRAE 90.1-2013 | to ASHRAE 90.1-2013 | deep-mullion with internal IGU | deep-mullion with internal IGU |
| Tvis | 0.13/0.13/0.13 | 0.13/0.13/0.13 | 0.812 | 0.812 |
| SHGC | 0.40/0.25/0.25 | 0.40/0.25/0.25 | 0.764 | 0.764 |
| U-factor (W/m2-K) | 4.6/5.2/4.8 | 4.6/5.2/4.8 | 2.72 | 2.72 |
| Mechanical Systems | to ASHRAE 90.1-2013 with hydronic thermal distribution | to ASHRAE 90.1-2013 with hydronic thermal distribution | Q-MEF specified distributed systems | Q-MEF specified distributed systems |
| Plant(s) | Heating boiler, SHW boiler, electric chiller | Heating boiler, SHW boiler, electric chiller | Envelope solar collection, adsorption chillers, auxiliary heat pumps + boiler | Envelope solar collection, adsorption chillers, auxiliary heat pumps + boiler |
| System topology | central plants, zone unit loops in parallel | central plants, zone unit loops in parallel | Primary heating and cooling distribution/storage loops; secondary loops for plants, zones | Primary heating and cooling distribution/storage loops; secondary loops for plants, zones |
| Zone transfer units | Chilled beams, hydronic baseboard heating | |||
| Heat rejection | air-side rejection from chiller | air-side rejection from chiller | air-side rejection from primary heating loop | air-side rejection from primary heating loop |
| Ventilation | Dedicated Outdoor Air System (DOAS) | |||
| Lighting, Equipment | up to 8 W/m2, up to 10 W/m2, scheduled | |||
| Daylighting controls | Stepped dimming with centered zone sensor | |||
Table 3.
Thermal capacities of modeled thermal energy storage (example: NYC climate).
| TES Elements | High-Temperature Buffers | Distribution Loops | ||||
|---|---|---|---|---|---|---|
| East or West (3X) | South (3X) | Clerestory (First Row) | Clerestory (Balance) | Chilled | Rejection-Stage | |
| Thermal capacity (kWh/K) | 0.9 | 1.4 | 4.9 | 2.1 | 450 | 583 |
| Allowable Temperatures | Below 95 °C | 10 to 18 °C | Toutd,db to 35 °C | |||
Table 4.
Lighting loads under daylighting controls.
| Lighting Loads | ||
|---|---|---|
| (kWh-E/m2-yr) | ||
| NYC | BL40 | 23 |
| BL95 | 20 | |
| Q-MEF | 20 | |
| Q-MEF + Tilt | 20 | |
| PHX | BL40 | 23 |
| BL95 | 19 | |
| Q-MEF | 19 | |
| Q-MEF + Tilt | 20 | |
| MTV | BL40 | 23 |
| BL95 | 19 | |
| Q-MEF | 19 | |
| Q-MEF + Tilt | 20 | |
Table 5.
Yearly facility heating and cooling loads of twelve configurations (loads to be addressed by building thermal control systems).
Table 5.
Yearly facility heating and cooling loads of twelve configurations (loads to be addressed by building thermal control systems).
| Heating Loads | Cooling Loads | Heating/Cooling Ratio | ||
|---|---|---|---|---|
| (MWh-Q/yr) | ||||
| NYC | BL40 | 266 | 263 | 1:1 |
| BL95 | 364 | 346 | 1.1:1 | |
| Q-MEF | 388 | 274 | 1.4:1 | |
| Q-MEF + Tilt | 514 | 310 | 1.7:1 | |
| PHX | BL40 | 44 | 634 | 1:14.4 |
| BL95 | 78 | 959 | 1:12.3 | |
| Q-MEF | 167 | 729 | 1:4.4 | |
| Q-MEF + Tilt | 209 | 784 | 1:3.8 | |
| MTV | BL40 | 109 | 277 | 1:2.5 |
| BL95 | 174 | 357 | 1:2.1 | |
| Q-MEF | 316 | 261 | 1.2:1 | |
| Q-MEF + Tilt | 398 | 294 | 1.4:1 | |
Table 6.
Summary of thermal collection and heating applications.
| Thermal Energy Collected | Zone Heating Loads | SHW Preheat | Heating Required (SHW, DOAS, Zone) | ||
|---|---|---|---|---|---|
| (MWh-Q/yr) | |||||
| NYC | BL40 | - | 266 | - | 330 |
| BL95 | - | 364 | - | 449 | |
| Q-MEF | 149 | 388 | 9 | 430 | |
| Q-MEF + Tilt | 151 | 514 | 9 | 488 | |
| PHX | BL40 | - | 44 | - | 64 |
| BL95 | - | 78 | - | 95 | |
| Q-MEF | 308 | 167 | 8 | 241 | |
| Q-MEF + Tilt | 348 | 209 | 8 | 141 | |
| MTV | BL40 | - | 109 | - | 136 |
| BL95 | - | 174 | - | 219 | |
| Q-MEF | 234 | 316 | 9 | 431 | |
| Q-MEF + Tilt | 244 | 398 | 9 | 345 | |
Table 7.
Solar cooling systems summary, showing reduced cooling loads in Q-MEF configurations with adsorption chillers offsetting fraction of remainder.
Table 7.
Solar cooling systems summary, showing reduced cooling loads in Q-MEF configurations with adsorption chillers offsetting fraction of remainder.
| Net Cooling Loads | Adsorption Chillers Work | ||
|---|---|---|---|
| (MWh-Q/yr) | (MWh-Q/yr, % of net) | ||
| NYC | BL40 | 263 | - |
| BL95 | 346 | - | |
| Q-MEF | 274 | 40 (15%) | |
| Q-MEF + Tilt | 310 | 52 (17%) | |
| PHX | BL40 | 634 | - |
| BL95 | 959 | - | |
| Q-MEF | 729 | 103 (14%) | |
| Q-MEF + Tilt | 784 | 135 (17%) | |
| MTV | BL40 | 277 | - |
| BL95 | 357 | - | |
| Q-MEF | 261 | 53 (20%) | |
| Q-MEF + Tilt | 294 | 53 (18%) | |
Table 8.
Summary: net energy use intensities, by demand type (kWh-Q/m2-yr, kWh-E/m2-yr and kWh/m2-yr), and peak electrical demand from grid (kW-E).
Table 8.
Summary: net energy use intensities, by demand type (kWh-Q/m2-yr, kWh-E/m2-yr and kWh/m2-yr), and peak electrical demand from grid (kW-E).
| Heating | Heating & Cooling | Ventilation | Lights | Equipment | Power Generated | Net EUI, Electrical | Net EUI, Total Site | Peak Electrical Demand | ||
|---|---|---|---|---|---|---|---|---|---|---|
| kWh-Q/ m2-yr | kWh-E/m2-yr | kWh/ m2-yr | kW-E | |||||||
| NYC | BL40 | 68 | 17 | 4 | 23 | 47 | - | 92 | 160 | 139 |
| BL95 | 92 | 29 | 3 | 20 | 47 | - | 99 | 191 | 156 | |
| Q-MEF | 86 | 26 | 3 | 20 | 47 | −61 | 36 | 121 | 151 | |
| Q-MEF + T | 98 | 26 | 4 | 20 | 47 | −71 | 27 | 124 | 147 | |
| PHX | BL40 | 13 | 47 | 9 | 23 | 47 | - | 127 | 139 | 189 |
| BL95 | 21 | 72 | 12 | 19 | 47 | - | 150 | 171 | 231 | |
| Q-MEF | 48 | 55 | 4 | 19 | 47 | −106 | 20 | 68 | 157 | |
| Q-MEF + T | 28 | 54 | 5 | 20 | 47 | −125 | 0 | 29 | 166 | |
| MTV | BL40 | 29 | 17 | 3 | 23 | 47 | - | 91 | 120 | 133 |
| BL95 | 46 | 26 | 4 | 19 | 47 | - | 96 | 142 | 164 | |
| Q-MEF | 86 | 31 | 4 | 19 | 47 | −84 | 18 | 104 | 133 | |
| Q-MEF + T | 69 | 26 | 5 | 20 | 47 | −99 | −1 | 68 | 131 | |
Table 9.
Percent changes from baseline to Q-MEF configurations in electricity EUI, total EUI (electricity + gas), and peak electricity demand.
Table 9.
Percent changes from baseline to Q-MEF configurations in electricity EUI, total EUI (electricity + gas), and peak electricity demand.
| Electricity EUI | Total EUI | Peak Electricity Demand | |||||
|---|---|---|---|---|---|---|---|
| vs. BL40 | vs. BL95 | vs. BL40 | vs. BL95 | vs. BL40 | vs. BL95 | ||
| NYC | Q-MEF | −61% | −64% | −24% | −37% | 9% | −3% |
| Q-MEF + Tilt | −71% | −73% | −23% | −35% | 6% | −6% | |
| PHX | Q-MEF | −84% | −87% | −51% | −60% | −17% | −32% |
| Q-MEF + Tilt | −100% | −100% | −79% | −83% | −12% | −28% | |
| MTV | Q-MEF | −80% | −81% | −13% | −27% | 0% | −19% |
| Q-MEF + Tilt | −101% | −101% | −43% | −52% | −2% | −20% | |
Table 10.
Utility annual cost summary.
| Demand Charges (USD) | Energy Charges (USD) | Natural Gas Charge (USD) | Total Utility Cost (USD) | Savings over BL40 (USD) | Savings over BL95 (USD) | ||
|---|---|---|---|---|---|---|---|
| NYC | BL40 | 37,000 | 50,000 | 15,000 | 102,000 | ||
| BL95 | 43,000 | 55,000 | 20,000 | 119,000 | |||
| Q-MEF | 39,000 | 20,000 | 22,000 | 81,000 | 21,000 (21%) | 38,000 (32%) | |
| Q-MEF + Tilt | 40,000 | 15,000 | 22,000 | 77,000 | 25,000 (25%) | 42,000 (35%) | |
| PHX | BL40 | 49,000 | 66,000 | 2000 | 117,000 | ||
| BL95 | 60,000 | 79,000 | 4000 | 143,000 | |||
| Q-MEF | 43,000 | 12,000 | 11,000 | 66,000 | 51,000 (44%) | 77,000 (54%) | |
| Q-MEF + Tilt | 44,000 | 2000 | 5000 | 51,000 | 66,000 (56%) | 92,000 (64%) | |
| MTV | BL40 | 37,000 | 49,000 | 6000 | 92,000 | ||
| BL95 | 60,000 | 79,000 | 10,000 | 149,000 | |||
| Q-MEF | 37,000 | 11,000 | 22,000 | 69,000 | 23,000 (25%) | 80,000 (42%) | |
| Q-MEF + Tilt | 37,000 | 0 | 13,000 | 50,000 | 42,000 (46%) | 99,000 (66%) |
Publisher’s Note: MDPI stays neutral with regard to jurisdictional claims in published maps and institutional affiliations. |
© 2022 by the authors. Licensee MDPI, Basel, Switzerland. This article is an open access article distributed under the terms and conditions of the Creative Commons Attribution (CC BY) license (https://creativecommons.org/licenses/by/4.0/).
Share and Cite
MDPI and ACS Style
Novelli, N.; Shultz, J.S.; Aly Etman, M.; Phillips, K.; Vollen, J.O.; Jensen, M.; Dyson, A. Towards Energy-Positive Buildings through a Quality-Matched Energy Flow Strategy. Sustainability 2022, 14, 4275. https://doi.org/10.3390/su14074275
AMA Style
Novelli N, Shultz JS, Aly Etman M, Phillips K, Vollen JO, Jensen M, Dyson A. Towards Energy-Positive Buildings through a Quality-Matched Energy Flow Strategy. Sustainability. 2022; 14(7):4275. https://doi.org/10.3390/su14074275
Chicago/Turabian StyleNovelli, Nick, Justin S. Shultz, Mohamed Aly Etman, Kenton Phillips, Jason O. Vollen, Michael Jensen, and Anna Dyson. 2022. "Towards Energy-Positive Buildings through a Quality-Matched Energy Flow Strategy" Sustainability 14, no. 7: 4275. https://doi.org/10.3390/su14074275
Note that from the first issue of 2016, this journal uses article numbers instead of page numbers. See further details here.