
Development and Experimental Study of Smart Solar Assisted Yogurt Processing Unit for Decentralized Dairy Value Chain


1
Department of Agricultural and Biosystems Engineering, University of Kassel, 37213 Witzenhausen, Germany
2
Department of Energy Systems Engineering, University of Agriculture, Faisalabad 38000, Pakistan
*
Author to whom correspondence should be addressed.
Sustainability 2022, 14(7), 4285; https://doi.org/10.3390/su14074285
Submission received: 15 March 2022
/
Revised: 2 April 2022
/
Accepted: 2 April 2022
/
Published: 4 April 2022
(This article belongs to the Special Issue Sustainable Agricultural Engineering Technologies and Applications)
Abstract
:Yogurt production at the farm level is important for adding value to milk. In this study, a solar-assisted yogurt processing unit capable of performing the three processes of heating, fermentation, and cooling in a single unit was developed. It consisted of a circular chamber surrounded by a coil for heating by a solar vacuum tube collector and a pillow plate for cooling by a solar PV-powered chiller unit. Experiments were performed using 50, 40 and 30 L of raw milk under a constant water circulation rate of 50 L per minute for heating followed by a cooling process under 36, 18 and 6 rpm of stirrer speeds. The heat absorption rates of the milk were 5.48–0.31, 4.75–0.16 and 4.14–0.24 kW, and the heat removal rates from water ranged from 6.28–0.49, 5.58–0.49 and 4.88–0.69 kW for 50, 40 and 30 L of milk volume, respectively. The overall heat transfer efficiency was above 80% during the heating process. A stirring speed of 18 rpm was found to be optimal in terms of cooling speed and consistency of the yogurt. The total energy consumed was calculated to be 6.732, 5.559 and 4.207 kWh for a 50, 40 and 30 L batch capacity, respectively. The study offers a sustainable energy solution for the decentralized processing of raw milk, particularly in remote areas of the developing countries where access to electricity is limited.
1. Introduction
Milk and its products are considered to be a good medium for the infectious growth of bacteria and other pathogens which grow faster at ambient temperature. Raw milk and yogurt are spoiled due to an increase in temperature, and these losses are significant in developing countries due to the non-availability of processing facilities at the farm level. Therefore, producers have to sell their products at low prices. Pakistan is ranked as the fourth largest milk-producing country in the world after the USA, China and India [1] by producing about 42 billion liters of milk annually [2], while the majority of producers are small-scale farmers (>80%). Unfortunately, only 5% of this milk is processed while the remainder is handled by milkmen which are mostly unhygienic and pose high health risks. About 15–19% of the total milk produced in the country is wasted due to a lack of processing facilities while the rest is handled improperly [3]. Yogurt is one of the popular dairy products in the Indo-Pak subcontinent. In Pakistan, the yogurt share is about 70% of total fermented dairy products [4], but diminutive attention is given to the fermentation of milk to increase its shelf life, aroma and nutritional value.
About 70% of dairy farms have limited access to the market, forcing milk producers to sell raw milk at a low price to middlemen and depriving them of a reasonable profit. Moreover, lack of handling and processing facilities at the farm level, poor financial support to farmers, and importantly, frequent interruption of the power used for farm processing are major hindrances to processing raw milk. There is a need not only to handle the raw milk (pasteurization), but also to convert it into a highly demandable and value-increased byproduct, i.e., yogurt and milk powder [5]. Although few commercial brands of yogurt are available in Pakistan, their prices are almost double those at the local market. Due to an increase in inflation, the majority of consumers are price conscious and buy yogurt from local shops which are exposed to dust and flies and possess no refrigeration facility, thus compromising on shelf life and the quality of the yogurt.
The yogurt-making process (heating and cooling) from raw milk is an energy-intensive process, which is why dairy is considered the fifth most energy-consuming industry [6]. Major energy demand in the dairy processing sector is still being met using fossil fuels [7] which not only increases operational cost, but also leads to environmental pollution [8]. Therefore, on-farm yogurt processing using renewable energy (solar energy with a potential average value of 5.3 kWh/m2/d) can help to overcome such issues [9]. For solar thermal heating at low–medium temperature range, Michael et al. (2016) [10] highlighted the significance of using flat plate and evacuated tube collectors and reported their contribution as about 30%, while parabolic troughs, dishes and Fresnel collectors contribute 22% of industrial segments. Amjad et al. (2021) [11] reported the use of solar evacuated tube collectors for the decentralized processing (drying) of agricultural produce. A thirty-tube evacuated-tube solar collector was attached with a water–air heat exchanger to warm up the drying medium. It was reported that proper integration of the evacuated tube collector performs well in terms of meeting low temperature demand (up to 100 °C). Ismail et al. (2021) [12] also reported the potential of solar thermal applications in the food industry to meet low temperature demand (up to 100 °C). In this study, the use of flat plate collectors in the food industry has been estimated to be 38% for pre-heating, pasteurization and cleaning processes. Similarly, in the dairy sector, providing decentralized, energy-efficient and low-cost milk handling and yogurt processing units can play a vital role in uplifting the rural economy through value addition and income generation.
Various studies reported the use of solar energy in the dairy industry. Khawer et al. (2020) [13] developed a solar-based milk chilling system comprising a one-ton vapor compression refrigeration unit and a 2 kWp PV system to process 200 L of milk using less than 1 kW power. Desai et al. (2013) [14] conducted a study to highlight the need for solar energy to assist vapor absorption cooling systems in maintaining cold storage conditions for milk handling in India and concluded its high scope in the dairy industry. Mekhilef et al. (2011) [15] comprehensively reviewed the use of solar thermal and PV systems for industrial applications. It is concluded that the greatest efficiency can be achieved through proper systems integration and suitable selection of solar collectors for water heating, solar refrigeration and steam generation. Anderson and Duke (2007) [16] reported the potential of solar thermal applications employing flat plate and evacuated tubes collectors for heating and cooling in the dairy industry. Zahira et al., 2009 [17] investigated the potential of solar energy to pasteurize raw milk at a temperature range of 65 °C to 75 °C while ambient air temperature was 40 °C. It was found that a pasteurizer unit fabricated from shipping cardboard easily attained the required temperature. Atia, 2011 [18] reported the working of a milk pasteurizer connected with a solar flat plate collector. It was found that 73.9 L of raw milk was successfully pasteurized at 63 °C, but fluctuation in solar radiation showed direct impact on the performance of the flat plate collector. Similarly, Wayua et al., 2013 [19] developed a milk pasteurizer made of a stainless steel cylindrical vessel having a jacket for the circulation of water being heated with a flat plate collector. Although the capacity of the container was 80 L, it was found that 40 L milk can be pasteurized optimally. In all these reported studies, it can be assessed that use of a flat plate collector cannot provide consistent energy and possess low energy efficiency. For this to get better energy efficiency, Yaseen et al. 2019 [20] reported the use of a vacuum tube collector to pasteurize 200 L milk using steam. Milk was pasteurized at 63 °C followed by cooling up to 30 °C with tap water which further cooled down to 4 °C in a PV-powered rotary compressor chiller. This study reported the use of a vacuum tube collector only for milk pasteurization. A single-glazed flat plate solar collector and water in a glass evacuated tube solar water heater were primarily used [21]. However, the use of solar collectors, especially evacuated tube collectors (ETC), is limited to water heating only [22,23] and none of the studies reported its use for yogurt fermentation. Moreover, at the industrial scale, for cooling and heating processes involved in yogurt production, the raw milk is transferred in separate containers requiring more infrastructure and clean-in-place (CIP) cost, which could be viable at large scale, but would not be good practice for handling a small quantity of milk (less than 100 L). There is no study about a system capable of performing all the processes required for yogurt making in a single unit/system using solar energy.
Keeping in view the aforementioned facts, in this study a sustainable energy solution for the decentralized handling and processing of raw milk, especially in remote areas of the developing countries where access to electricity is reduced, has been presented. A solar-assisted three-in-one (heating, fermentation and cooling) yogurt processing unit for the value addition of raw milk has been developed. Integration of solar evacuated tube collectors (for heating) and a solar PV system (for cooling) with the yogurt processing unit was evaluated not only to pasteurize raw milk but also to make yogurt in a single unit. The salient feature of the system is the design of a single container capable of performing both heating and cooling processes which not only reduce capital cost but also make it user friendly.
2. Material and Methods
The complete unit for yogurt processing was developed and fabricated in the Department of Energy Systems Engineering Workshop, Faculty of Agricultural Engineering and Technology at the University of Agriculture Faisalabad (UAF) Pakistan in collaboration with the International Center for Development and Decent Work (ICDD, University of Kassel, Germany and Dairy Industries, Okara-Pakistan).
2.1. System Description
The design and selection of the yogurt processing unit was largely based on some basic parameters such as energy efficiency and maintenance, and especially on the product life cycle and environmental sustainability. Figure 1 shows a solar-assisted yogurt processing unit designed to process raw milk and its fermentation into yogurt in a timely manner at the production site. It consists of a cylindrically shape fermentation chamber (560 mm diameter and 230 mm depth) made of stainless steel (food grade SS 304) having a capacity of 50 L which is surrounded by a heating coil (3.5 m long, 40 mm wide and 12.5 mm high). The walls and bottom of the fermentation chamber were insulated by 100 mm thick PU (Polyurethane) material, so that heat loss through conduction and convection can be reduced. A variable frequency drive (VFD) electric motor was installed on the top of the chamber to rotate a stirrer for maintaining uniform temperature in the processed product. For cooling purposes, the bottom surface of the chamber was fabricated by a pillow plate which itself acts as an evaporator. The use of a pillow plate heat exchanger not only reduces the size and cost of the unit but also provides a higher heat transfer coefficient in comparison to the conventional coil heat exchanger. For cooling of yogurt, one ton of rotary compressor compatible with R-410A (environmentally friendly) gas was installed employing an inverter kit to reduce torque load to run on 2 kWp PV modules.
For the heating of raw milk, the yogurt processing unit was connected with a hot water storage tank (100 L capacity) which receives heat from a solar evacuated tube collector (2.46 m2) having a connection through polyvinyl chloride (PVC) pipe fittings as shown in Figure 2. The outer and inner diameters of the ETC tubes were Ø58 mm ± 0.7 mm and Ø47 mm ± 0.7 mm, respectively. The glass tube length was 1800 mm ± 5 mm and the vacuum was P < 5 × 10⁻³ Pa. The thermal energy absorbed by the collector is transferred to 100 L of water in the storage tank to raise the water temperature to 90 °C. A centrifugal pump (Wilo-SP106) was installed between the hot water storage tank and the evacuated tube collector for the circulation of propylene glycol solution (50% by volume). The pump can be operated at three variable speeds (600 L/h, 900 L/h and 1100 L/h), and it required 80 W power at maximum speed. The current research was conducted at a flow rate of 600 L/h. Heated glycol solution entered the storage tank and transferred its heat to water while passing through the helix-type heat exchanger present in the storage tank. In order to transfer heat from the storage tank to the yogurt processing unit, another water circulation pump (stainless steel centrifugal, WB50/025D, 50 L/min) was installed between the outlet of the hot water storage tank and the inlet of the yogurt processing unit to circulate the hot water through the square spiral coil heat exchanger to increase the temperature of milk up to 80 °C.
Being a closed cycle, an expansion vessel (12 Liter) was also provided to avoid high-pressure build-up in the system. The controller turns on the circulation pump (Wilo-SP106) when the temperature differential between the glycol solution leaving the collector and the water in the lower portion of the storage tank exceeds 5 °C and turns the pump off when the differential is below 5 °C or when the water temperature of the storage tank exceeds to 90 °C.
2.2. Sizing of Fermentation Chamber
The size of the fermentation chamber depends on the quantity of the product to be processed. Considering a milk capacity of 50 L, the chamber was designed by keeping the diameter to depth ratio in such a way that it could not only get enough exposure to the pillow plate fabricated at the bottom of the chamber but also to increase the surface area of surrounding heating coils. Moreover, the calculation was made for 56.6 L to provide space for the stirrer, stirrer shaft and spacing required during the shaking phenomenon. Normally, semi-circle type chambers are used which are suitable only for the cooling of milk. To perform both heating and cooling in the same chamber, a cylindrical-type chamber was designed having the provision of installing a heating coil around the chamber.
where V is the volume of the chamber (m3), and d is the diameter of the fermentation chamber (m).
The height and diameter of the chamber were calculated to be 230 mm and 560 mm, respectively. A 13.2% provision was given in the total volume of the chamber for air and stirrer.
2.3. Sizing of Refrigeration System
The size of a refrigeration system depends on the cooling load of the fermentation chamber, which further depends on the mass of milk or yogurt and the time required to reach the chilling temperature (4 to 8 °C).
Heat transfer through the walls and bottom can be calculated using the following equation [24]:
where Qt stands for the total heat transfer through the walls and bottom (kWh/d), U is the overall heat transfer coefficient (W/m2 °C), A is the heat transfer area (m2), Th is the hot face temperature of the fermentation chamber (°C) and Tc is the cold face temperature of fermentation chamber (°C).
Similarly, using the same equation, heat transfer through the walls (Qt1) and heat transfer through the top of the chamber (Qt2) were also calculated to be 0.162 kWh/d and 0.2179 kWh/d using U values of 0.28 and 0.95, respectively.
The cooling load of the product can be calculated by using Equation (3)
where QR stands for the cooling load of the product (2.10 kWh/d), m is the mass of the product (kg) and Cp is the specific heat of the milk (3.89 kJ/kg K). Adding the outcomes from Equations 2 and 3, the total heat load was calculated to be 2.4799 kWh/d.
The required refrigeration capacity was calculated by dividing the total heat load by the specified time of cooling (2 h in this case), and it was found to be 0.709 TR. Considering the 20% factor of safety, the required refrigeration capacity was calculated to be 0.851 TR. Keeping in view other losses and the availability of standard size, one ton of refrigeration system was used for yogurt processing.
2.4. Photovoltaic System Design
The size of the solar system was selected as per the load requirements of the developed yogurt processing unit, and it can be estimated for any size of the yogurt processing unit. The size of the photovoltaic (PV) system based on the peak power (Pp) in kWp required to operate the compressor, stirrer motor and water pumps can be estimated by using the following equation [25].
where Pp is the peak power of the solar system (kWp); Le is the electric load (kWh/d) which is the product of the power required to run appliances and the time of operation (hours per day); Ib is the solar irradiance (kW/m2) and 1 is taken as its peak value for calculation; Havg is the average global horizontal irradiance (kWh/(m2 d)) and its value lies between 5 and 6 kWh/(m2 d) for Faisalabad, Pakistan; and minimum value taken for calculation, ηinv is the efficiency of the inverter (95–98%); ηbat is the efficiency of battery (85–95%); and TCF is the temperature correction factor obtained by subtracting the product of the loss factor (0.4% per °C) and the change in the PV temperature from unity, and for the current study it was 0.92. This means that the power will reduce by 0.4% per degree rise in temperature from its optimum value, i.e., 25 °C at standard testing conditions. Solving Equation (4), the peak power was calculated to be almost 2 kWp. So, eight PV panels (polycrystalline, each 250 Wp) were installed with a 3 kW inverter. Here the surge factor has been taken as 1 due to the presence of inverter technology which stats the compressor with zero torque load.
In order to maintain the required load for the cooling system, a battery bank was used to charge and discharge with the varying solar intensity throughout the day. The size of the battery bank was calculated by the following equation [25]
where CBat is the capacity of the battery bank (Ah), Nccd is the autonomy and taken as the number of continuous cloudy days, Dd is the depth of discharge in fraction, and Vbat is the nominal voltage of the battery. All of the specifications of the solar system used in the current study have been tabulated in Table 1.
2.5. Sizing of Evacuated Tube Collector (ETC)
For the thermal application of the yogurt processing unit, an evacuated tube collector (ETC) was used. The ETC area was calculated by using the following formula [26]
where Ac is the area of the receiver tube exposed to radiation (m2); m is the mass of water (kg); is the specific heat capacity of the receiver tube (kJkg−1 K−1); ∆T is the change in temperature (K); Ib is the solar irradiance (W/m2); τ is the transmission coefficient; α is the absorption coefficient and t is the time in seconds.
The amount of heat energy required to increase the temperature of milk (m = 50 kg, specific heat: 3.89 kJkg−1 K−1) up to 50 °C (30 °C to 80 °C) in two hours’ time (t = 7200 s) using a vacuum tube collector (transmission coefficient = 0.95, absorption coefficient α = 0.95) was calculated for a tropical region like Faisalabad (31.4303° N, 73.0672° E) lying in the solar belt having an average global horizontal irradiance (P) of 0.8 kWm−2. Substituting these values into Equation (6), the area required is calculated to be 1.87 m2. The absorber area of one tube is calculated by multiplying the circumference of the absorber plate and calculated to be 0.164 m2, while the number of tubes is calculated by dividing the total absorber area by the absorber area of one tube and was calculated to be 11.4 ≈ 12 tubes. Therefore, an evacuated tube collector of 15 tubes was selected considering thermal losses in the system as shown in Figure 3.
2.6. Experiments
Trials were conducted to assess the heating and cooling performances using three different volumes of raw cow’s milk (50, 40 and 30 L). Before conducting an experiment, the heating component of the system was turned on in order to raise the water temperature of the storage tank up to 90 °C, which normally took 2–3 h depending upon solar radiation. After that, raw milk is poured into the fermentation tank and the circulation of hot water from the storage tank to the fermentation chamber is turned on. The heating of raw milk up to 80 °C took about 140 min, and it continuously stirred at a speed of 36 rpm. To bring down the temperature of heated milk to 43 °C, which is recommended for fermentation of milk, tap water passed through the heating coil in an open loop controlled by manually operated valves. The inoculation of starter culture was carried out (2–3%) at this temperature, and it was maintained by a solenoid valve controlling the water circulation for a period of 5–6 h until the required pH (4.85–4.5) was attained. After that process, the cooling process of yogurt was started by turning on the refrigeration unit to bring down the temperature of yogurt below 8 °C to reduce the bacterial activities which normally took 48–103 min depending upon the quantity of the processed milk and stirrer speed. For this, three different speeds (36, 18 and 6 rpm) of the stirrer were selected using a variable speed motor. Each experiment was replicated thrice, and values were averaged for each volume of milk. For data acquisition, a controller with resistance temperature detector (RTD)-based temperature sensors was used to measure temperature at the inlet and outlet of the ETC, the top and bottom of the hot water storage tank, and inside the fermentation chamber. A portable pH meter (ML1010) was used to measure the pH of milk during the fermentation process. To access the performance of the installed PV system, a clamp meter (Fluke 345PQ), and pyranometer (METEON) were used.
Thermodynamic Analysis for Efficient Refrigeration System
While selecting a cooing machine, the coefficient of performance (COP) is the key factor to be considered for maximum cooling output with the lowest possible input energy requirement. Therefore, a comprehensive thermodynamic analysis is mandatory for evaluation and cooling system optimization for the best application. For this purpose, the system was connected with temperature sensors (thermocouples: K type, error: <0.1%) to record the temperature differentials of the circulating refrigerant in order to monitor the phase changes during the complete refrigeration cycle. The design and selection of the compressor was carried out with the aim that it must be capable of superheating the refrigerant to provide a reasonable degree of superheat to provide a high enthalpy drop during the expansion process (process (irreversible adiabatic process) with the help of a capillary tube for maximum cooling efficiency during the evaporation process to chill the milk/yogurt. Therefore, the rotary compressor was used to decrease the torque load and increase the pressure to achieve the required degree of superheat from the refrigerant.
R410a refrigerant was used in the compressor and the flow rate of the refrigerant was maintained as 1.42 L/min, having a specific volume of 0.0009 m3 kg−1 (m′ = 1.58 kg/min). The temperature after compression was recorded to be 347 K, while the temperature before compressing was noted as 261 K, and this line is represented on the T-S diagram by a vertical line showing an isentropic process owing to the high speed of the compressor. It has been noted that the temperature after the compression process is 347 K, and this temperature is well above the saturation temperature of the refrigerant (318 K at 2758 kPa), thus providing a degree of superheat as 29 K. The heat is removed at constant pressure in the condenser: the process first removes sensible heat from superheated vapor (347 K) to saturated vapor (318 K), i.e., a process from 2 to 2′, then in the form of latent heat from dry saturated vapor to the saturated liquid line (process from 2′ to 3′) and then sensible heat from the saturated liquid line to 312 K as a sub-cooling process (3′ to 3). This high heat dissipation rate was due to the high heat transfer coefficient of copper coiling used and the efficient design of the condenser as well as the addition of two fans to dissipate heat at a faster rate. Therefore, the condensation process takes place partially in the superheated region and predominantly inside the saturation region to change the phase of the refrigerant from gas to liquid and then follows a sub-cooling line to decrease the refrigerant temperature. The expansion takes place through the capillary tube and undergoes an irreversible adiabatic (constant enthalpy) process as shown in process 3–4 in Figure 4. Process 4-1 is accomplished at constant pressure which evaporates the refrigerant once again at saturation temperature to complete the vapor compression refrigeration cycle using R410a refrigerant.
The COP of the refrigerant is calculated using Equation (7)
where h1, h2 and hf3 are the enthalpies of the refrigerant used at the compressor inlet, compressor outlets and liquid enthalpy after the condenser outlet.
The values of dry saturated vapor before the compressor and after the compressor were found to be 418.8 and 425 kJ/kg at temperatures of 261 and 318 K, respectively (at 535 and 2758 kPa), while the value of the dry liquid line was found to be 277 kJ/kg at a temperature of 312 K and 2758 kPa pressure. The total enthalpy of actual refrigeration points after compression ‘h2’ was calculated by using Equation (8):
where h2 is the actual enthalpy of the refrigerant after the compression process, h2′ is the enthalpy of the refrigerant at the dry saturated steam line after the compression process and is taken from the enthalpy table, Cpg is the specific heat capacity of the refrigerant at constant pressure in gaseous state (0.84 kJ kg−1 K−1), and T2 and T2′ are the actual temperatures recorded of the refrigerant and saturation temperature at the compressor outlet, respectively.
The enthalpy of actual the refrigeration points after the condensation process ‘h3’ was calculated by using Equation (9):
where h3 is the enthalpy of the refrigerant after the condensation process and is noted physically, h3′ is the enthalpy of the refrigerant at the water line after condensation and is taken from the enthalpy table, Cpl is the specific heat capacity of the refrigerant at constant pressure in the liquid state (1.8 kJ kg−1 K −1), T3 is the actual value of the temperature of the refrigerant after condenser and T3′ is the saturation temperature at the liquid line after the condensation process, respectively.
By using Equations (8) and (9), the values of enthalpies h2 and h3 are calculated to be 454 kJ/kg and 266.2 kJ/kg, respectively. It is worth mentioning here that the value h3 is the total enthalpy at point 3, and as there is no latent heat consideration as the refrigerant is in a liquid state after condensation in the condenser, this enthalpy h3 is equal to hf3 (liquid enthalpy), as the refrigerant at the inlet of the compressor is in a dry saturation condition and enthalpy at point 1 is equal to 418.8 kJ/kg.
Using these values in Equation (7), the COP of the system was found to be 4.33. In fact, this is the thermodynamic value for the COP. However, the actual value of the refrigeration system for the cooling application is a little lower, as these values include the thermal losses and heat transfer losses through the pillow plate of the chiller unit where processing is carried out.
The capacity of refrigeration (TR), i.e., the heat extraction rate, is calculated using the following equation
where m’r is the mass flow rate of the refrigerant (1.58 kg/min), h1 is the enthalpy of the refrigerant used at the compressor inlet (kJ), and hf3 is the liquid enthalpy after the condenser outlet (kJ).
The capacity of refrigeration (TR) is calculated to be 1.15.
The power required to run the system is calculated by using Equation (11)
where P is the power, m’r is the mass flow rate of the refrigerant (1.58 kg/min), h2 is the enthalpy of the refrigerant at the compressor outlet (kJ), and h1 is the enthalpy of the refrigerant used at the compressor inlet (kJ)
The power required is calculated to be 0.93 kW; however, a 1 kW compressor motor was used considering electro-mechanical losses. The research depicts that through proper design and optimization of the refrigeration system, less than 1 kW of power is required to achieve one ton of cooling effect (3.5 kW/210 KJ/min or 12,000 BTU/h), which is in accordance with the findings investigated by [13,20,27,28] for high-performance cooling machines. The actual COP results were also conducted under field conditions using milk/yogurt by direct method, and the details of these trials are given in Section 3.4.
3. Results and Discussion
3.1. Heating of Raw Milk
Temperatures changes of hot water and milk during the heating process for three different product volumes (50, 40, 30 L) are shown in Figure 5. It can be observed that the initial temperatures of the milk and water storage tanks were 30 °C and 90 °C, respectively. During the first thirty minutes of the heating process, the temperature of the hot water dropped to 72 °C due to the high heat transfer rate, resulting in milk temperature increases of 62 °C, 66 °C and 70 °C for 50, 40 and 30 L of milk capacities, respectively. Thereafter, it was observed that the rate of temperature change was slower for all processed capacities. However, based on the quantity of the product to be processed, the time required to achieve the desired temperature (80 °C) was found to be 140, 110 and 80 min for 50, 40 and 30 L of milk capacities, respectively. In the case of a hot water storage tank, after thirty minutes, the temperature started to increase due to the continuous addition of thermal energy from ETC and a significantly lower rate of heat transfer to milk. This shows that the system can achieve the temperature (80 °C) required to denature and unfold most of the milk protein “lactoglobulin”. This allows lactoglobulin to bind with some of the other proteins in milk, called caseins, thus forming a thick and well-structured yogurt. In addition to this, it can also be noted that the system can easily be used for the low-temperature pasteurization (63 °C) of up to 50 L of milk in approximately thirty minutes, which makes the system state of the art in terms of yogurt making and pasteurization.
The heating rates of milk in response to the heating rate of circulation water during the entire heating process under different product capacities have been shown in Figure 6. The solar irradiance and the total solar power available at ETC were also recorded and calculated during the experiments conducted on 2 July 2020, 3 July 2020, and 14 July 2020 for 50, 40 and 30 L of batch capacities, respectively by using a pyranometer (METEON, Accuracy ± 0.1%). These values were found in the ranges of 850–896 W/m2, 840–891 W/m2, 840–881 W/m2 and 2.16–2.23 kW, 2.10–2.22 kW, 2.10–2.2 kW for 50, 40 and 30 L of milk capacities, respectively. At the early stages of the heating process, the rate of heat extraction from hot water was higher than that of heat addition, and it reduced as soon as milk temperature increased. It can be observed that the heating rate of milk is higher than the thermal energy provided by ETC due to the energy provided by the hot water of the storage tank at the beginning of the heating process. The heating rate of milk and the heat extraction rate from hot water was calculated at 10 min intervals throughout the heating process, and their values were found in ranges of 5.48–0.31 kW, 4.75–0.16 kW, 4.14–0,24 kW and 6.28–0.49 kW, 5.58–0.49 kW, 4.88–0.69 kW for 50, 40 and 30 L of milk capacities, respectively.
Figure 7 shows the cumulative heat energy released by hot circulating water, the heat energy absorbed by milk and the corresponding heat transfer efficiency. It was found that during the first 40 min of the heating process, hot water released 66%, 69%, and 74% of its total energy for 50, 40 and 30 L of milk capacities. The rest of the energy was transferred to milk in the next 100, 70 and 40 min for 50, 40 and 30 L of milk. Contrarily, the milk absorbed 69%, 81% and 84% of the total required energy to reach the desired temperature of 80 °C. Therefore, the quantity of milk plays an important role in energy consumption. The heat transfer efficiency was found to be above 80% during the whole heating process because milk received energy from the storage tank where any fluctuation was compensated continuously by ETC.
3.2. Cooling Process of Milk
The cooling rates of heated milk in response to the circulation of tap water through the coils under different product capacities have been shown in Figure 8. Tap water was passed through the coils of the fermentation chamber in the opposite direction of the stirrer in order to reduce the temperature rapidly. The temperature and flow rate of tap water was 29.8 °C and 32.25 L per minute, respectively. The time required to drop the temperature from 80 °C to 43 °C was found to be 19, 16 and 14 min for 50, 40 and 30 L of volume, respectively. Similar trend lines of heat extraction for all the milk volumes were observed with a slight difference in time taken to complete the process.
3.3. Fermentation Process
For the fermentation process, 2% of starter culture was added to milk to make yogurt and the stirrer was kept off during that period. It took five hours to complete the fermentation process. The pH value of milk was found to be 6.45, which changed to 4.35 after being made into yogurt. At this stage, the temperature was maintained between 43 °C to 44 °C, being controlled using a thermostatic valve and water circulation pump. The thermostatic valve opened automatically, letting the hot water flow through the coils when the temperature of the milk falls below than 43 °C and closing once it rises above 44 °C.
3.4. Cooling Process of Yogurt
A one-ton refrigeration system (using R410a refrigerant) energized by a solar hybrid photovoltaic system was used for the cooling of yogurt below 8 °C in order to store it without quality deterioration. In the current study, the temperature of yogurt was lowered to 4 °C by considering the effect of stirrer speed on the cooling rate and consistency (thickness) of yogurt. For this, three different stirrer speeds (36, 18 and 6 rpm) were selected using a variable-speed motor to cool down the product of three different capacities (50, 40 and 30 L), and the outcomes are shown in Figure 9. It can be observed that the time required to cool 50 L of yogurt from 43 °C to 4 °C was 64, 73 and 103 min with the stirrer speeds of 36, 18 and 6 rpm, respectively. Similarly, for 40 and 30 L, the time required for cooling was observed to be 59, 64, 97 min and 48, 54 and 65 min, respectively, at 36, 18 and 6 rpm stirrer speeds. It can be noted that the higher speed of the stirrer resulted in a higher cooling rate. Importantly, greater and lesser stirrer speeds caused rupturing of yogurt texture and non-uniform cooling, respectively. It was observed that at 36 and 18 rpm stirrer speeds, the cooling uniformity was satisfactory, but at 6 rpm, a non-uniform cooling behavior was observed for all volumes of product. Although stirring at 36 rpm gave a good cooling rate, the consistency of the yogurt was found to be on the higher side compared to stirring at 18 rpm.
To evaluate the cooling efficiency of the system, the coefficient of performance (COP) of the cooling unit was calculated after every 10 min throughout the process for 50, 40 and 30 L of yogurt. In this context, the output is the amount of heat removed from the yogurt. Under all operating conditions, it was found that the COP was higher at the beginning of the cooling process and lowered as the process proceeded to the end, which is in accordance with the second law of thermodynamics [29]. As discussed earlier, variation in stirrer speed affects the rate of cooling, so COP was also calculated using three different stirrer speeds (36, 18, 6 rpm) as shown in Figure 10. Although the fluctuation of the COP followed an almost similar trend throughout the process under 36 and 18 rpm, the maximum value of COP (3.36) was achieved at 18 rpm for 50 L yogurt (Figure 10a). In the cases of 40 and 30 L, the maximum COP was calculated to be 2.41 (Figure 10b) and 2.75 (Figure 10c) under 36 and 18 rpm, respectively. Taking into account the cooling rate and consistency of yogurt, a stirrer speed of 18 rpm was found to be optimum.
All the calculated data (temperature change in storage tank water, milk, heating rates of circulating water and milk, net heating rate effect, cumulative heat energy released by water and absorbed by milk and cooling rate of milk) with respect to process time were modeled using sigma plot-12, and it was found that polynomial cubic model fitted best to all the data obtained under the prevailing operating conditions. It helps to interpolate new, invisible data points. All the values of respective model constants for the parameters calculated are tabulated in Table 2.
3.5. Thermal Profile of the Entire System
The complete yogurt-making process consists of heating, cooling the milk, fermentation and cooling the yogurt, exchanging thermal energy. In order to verify that either system is capable of harvesting enough solar energy for all the processes to be completed effectively and economically, complete thermal profiles were developed for three different milk volumes with an optimized stirrer speed (18 rpm) as shown in Figure 11. It can be observed that the heating of 50 L of milk took 140 min to reach 80 °C, and after that its temperature fell down to 43 °C in 14 min using tap water (Figure 11a). This showed that the system was able to maintain the temperature of inoculated milk governed through a thermostat valve at 43 °C for five hours followed by the rapid cooling of yogurt in 73 min when the stirrer rpm was 18. Milk was converted to yogurt by lowering its pH value to 4.45 during those five hours. In order to estimate the amount of heat extracted and absorbed from the product during the entire process, heating and cooling rate trends were also developed. It was also noted that the product heating rate started from 5.09 kW and it reduced to 0.29 kW at the end of the heating process. After that, the cooling process of milk started which resulted in a maximum decline in heating rate of −8.68 kW followed by the fermentation process with an average heating rate of 0.129 kW. Negative values of the heating rate during the fermentation process were due to the heat loss when the thermostat valve was closed and hot water circulation was shut down. So, no transfer of heat energy would take place under this condition. Finally, the process of yogurt cooling occurred with a maximum heat extraction rate of −3.047 which reduced −0.1945 kW at the end of the cooling process of yogurt. The total process time was calculated to be 540 min (9 h).
Similar trends were found for the cases of 40 L and 30 L. However, due to having less volume than 50 L, it took 110 and 80 min to complete the heating process for 40 and 30 L, respectively. The heating rate was about 4.40 kW, 3.85 kW at the start and 0.15 kW, 0.23 kW at the end of the heating process for 40 and 30 L, respectively. During the milk cooling process, the heating rate was reduced to −6.48 kW and −4.94 kW, and at the end of the fermentation process, it was 0.104 kW and 0.077 kW for 40 and 30 L, respectively. The total process time was estimated to be 5.7% and 13.2% less than that of 50 L in the case of 40 and 30 L, respectively.
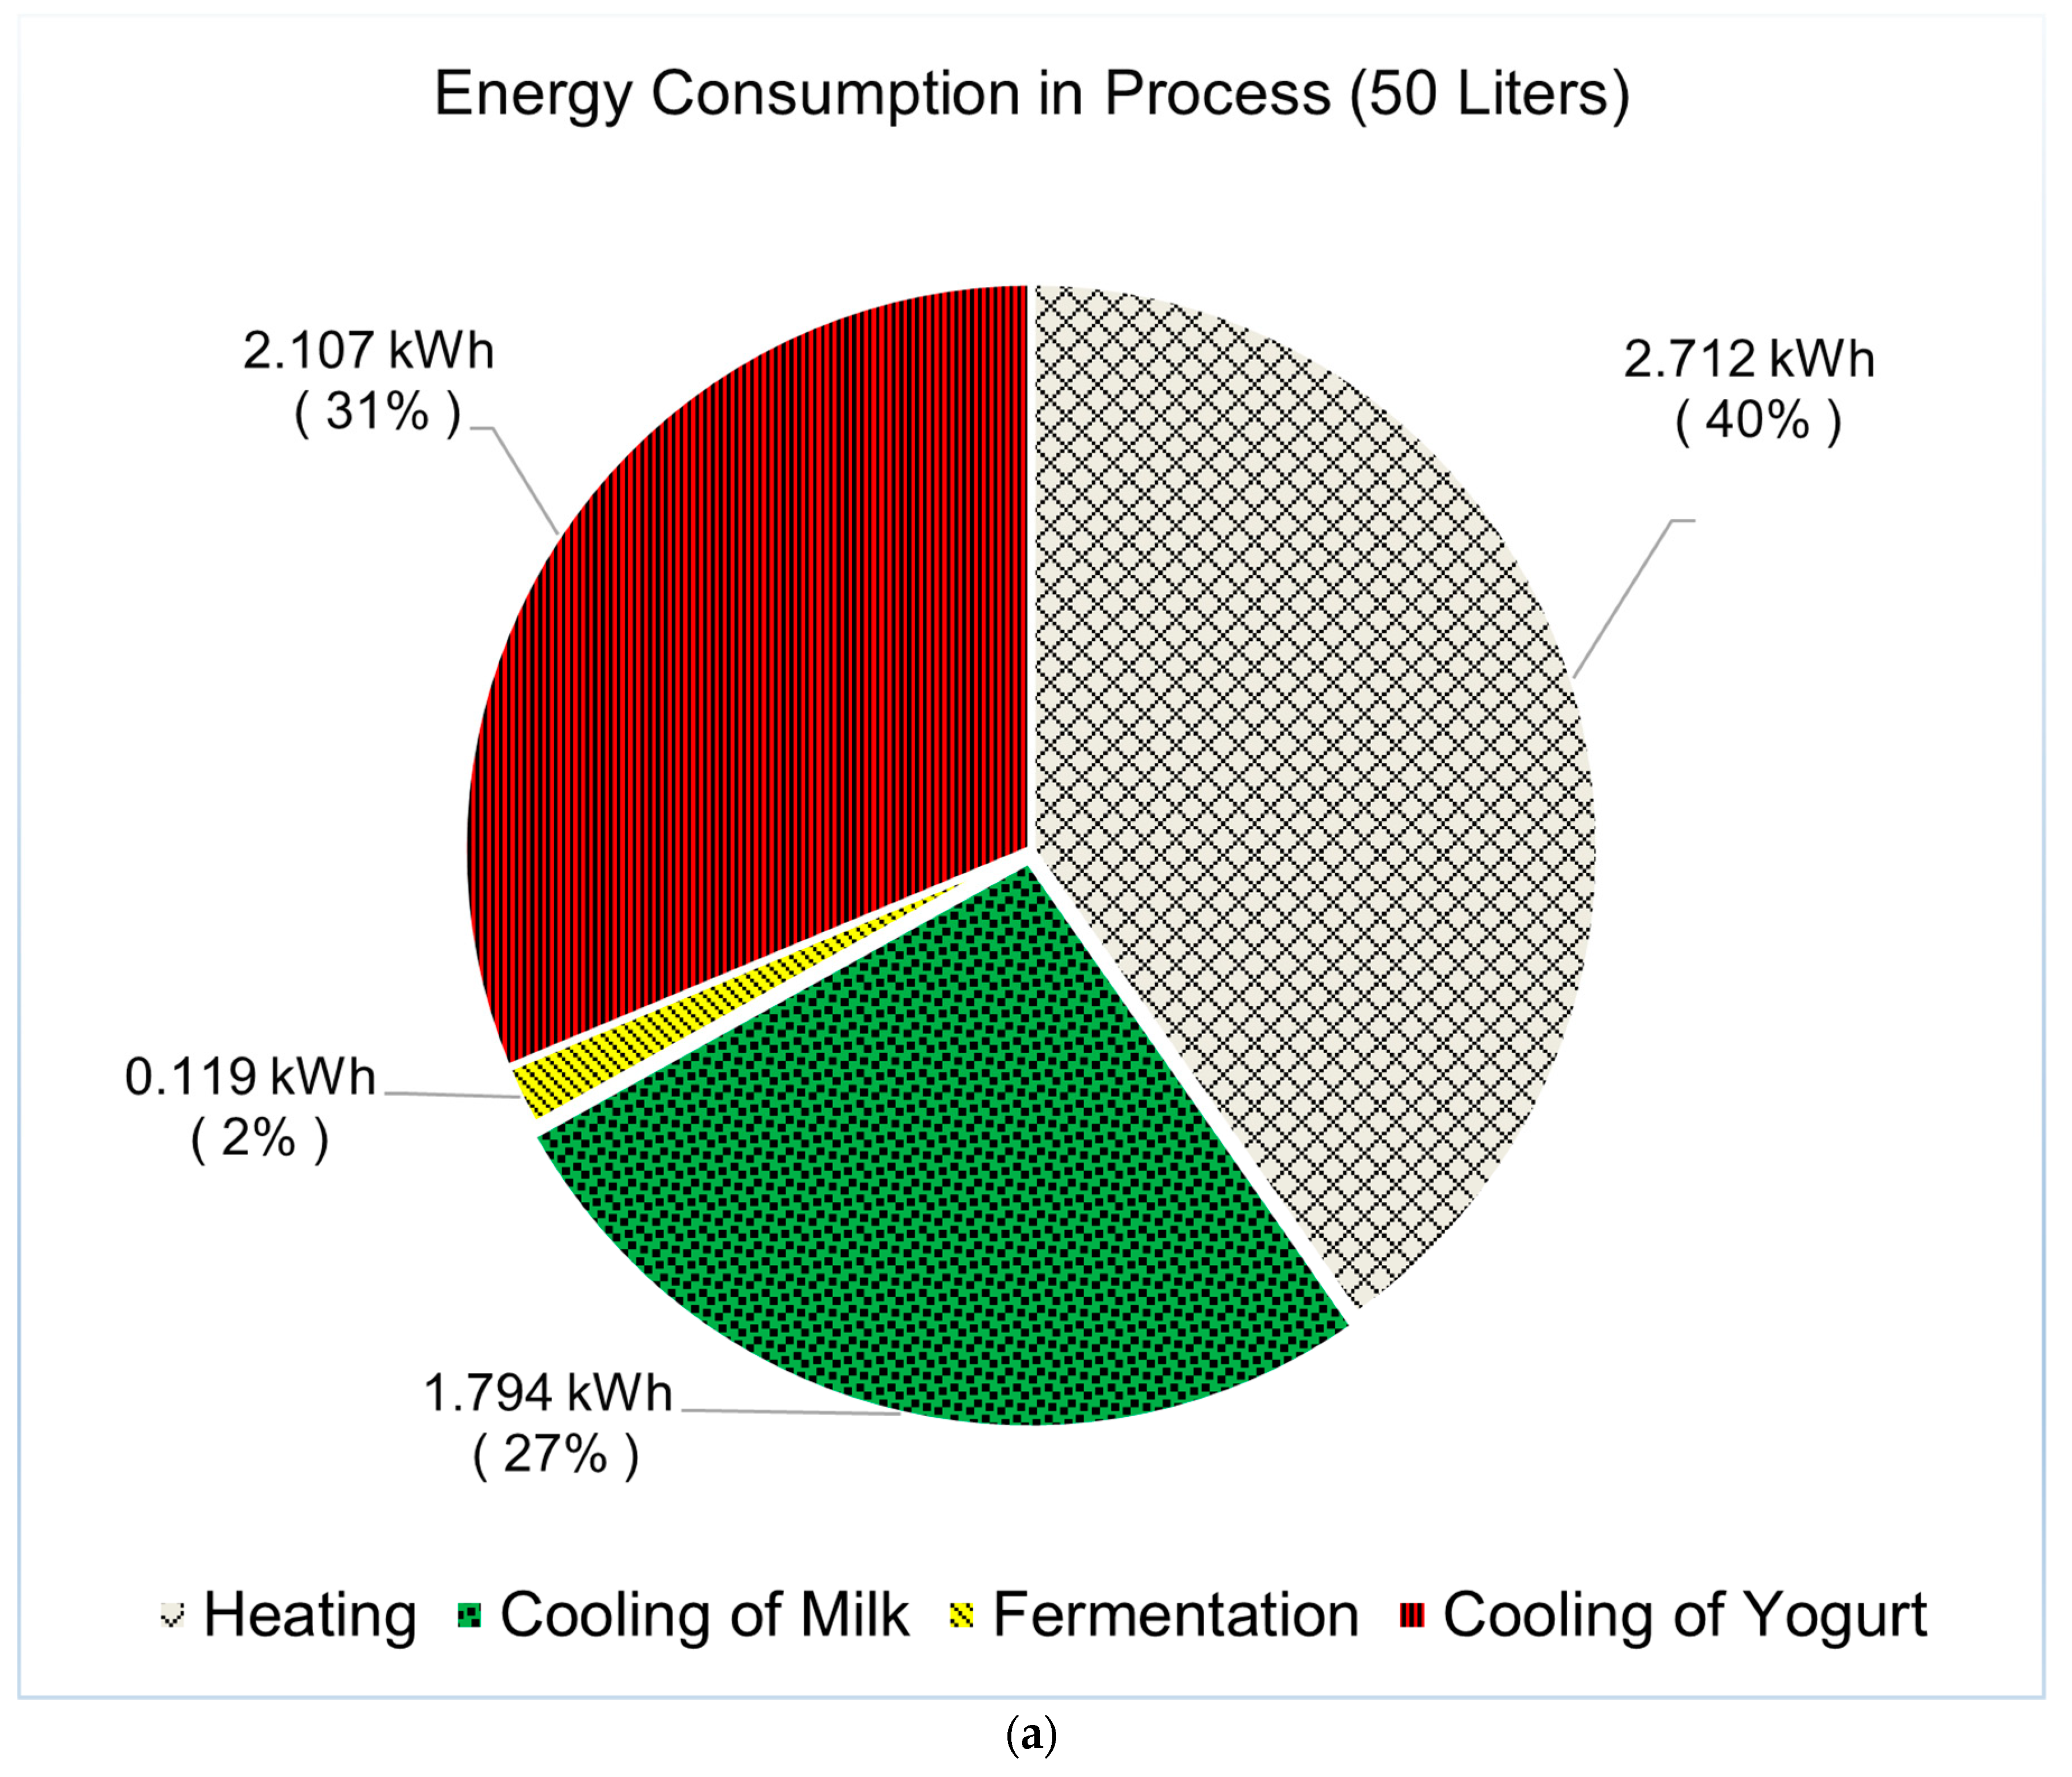
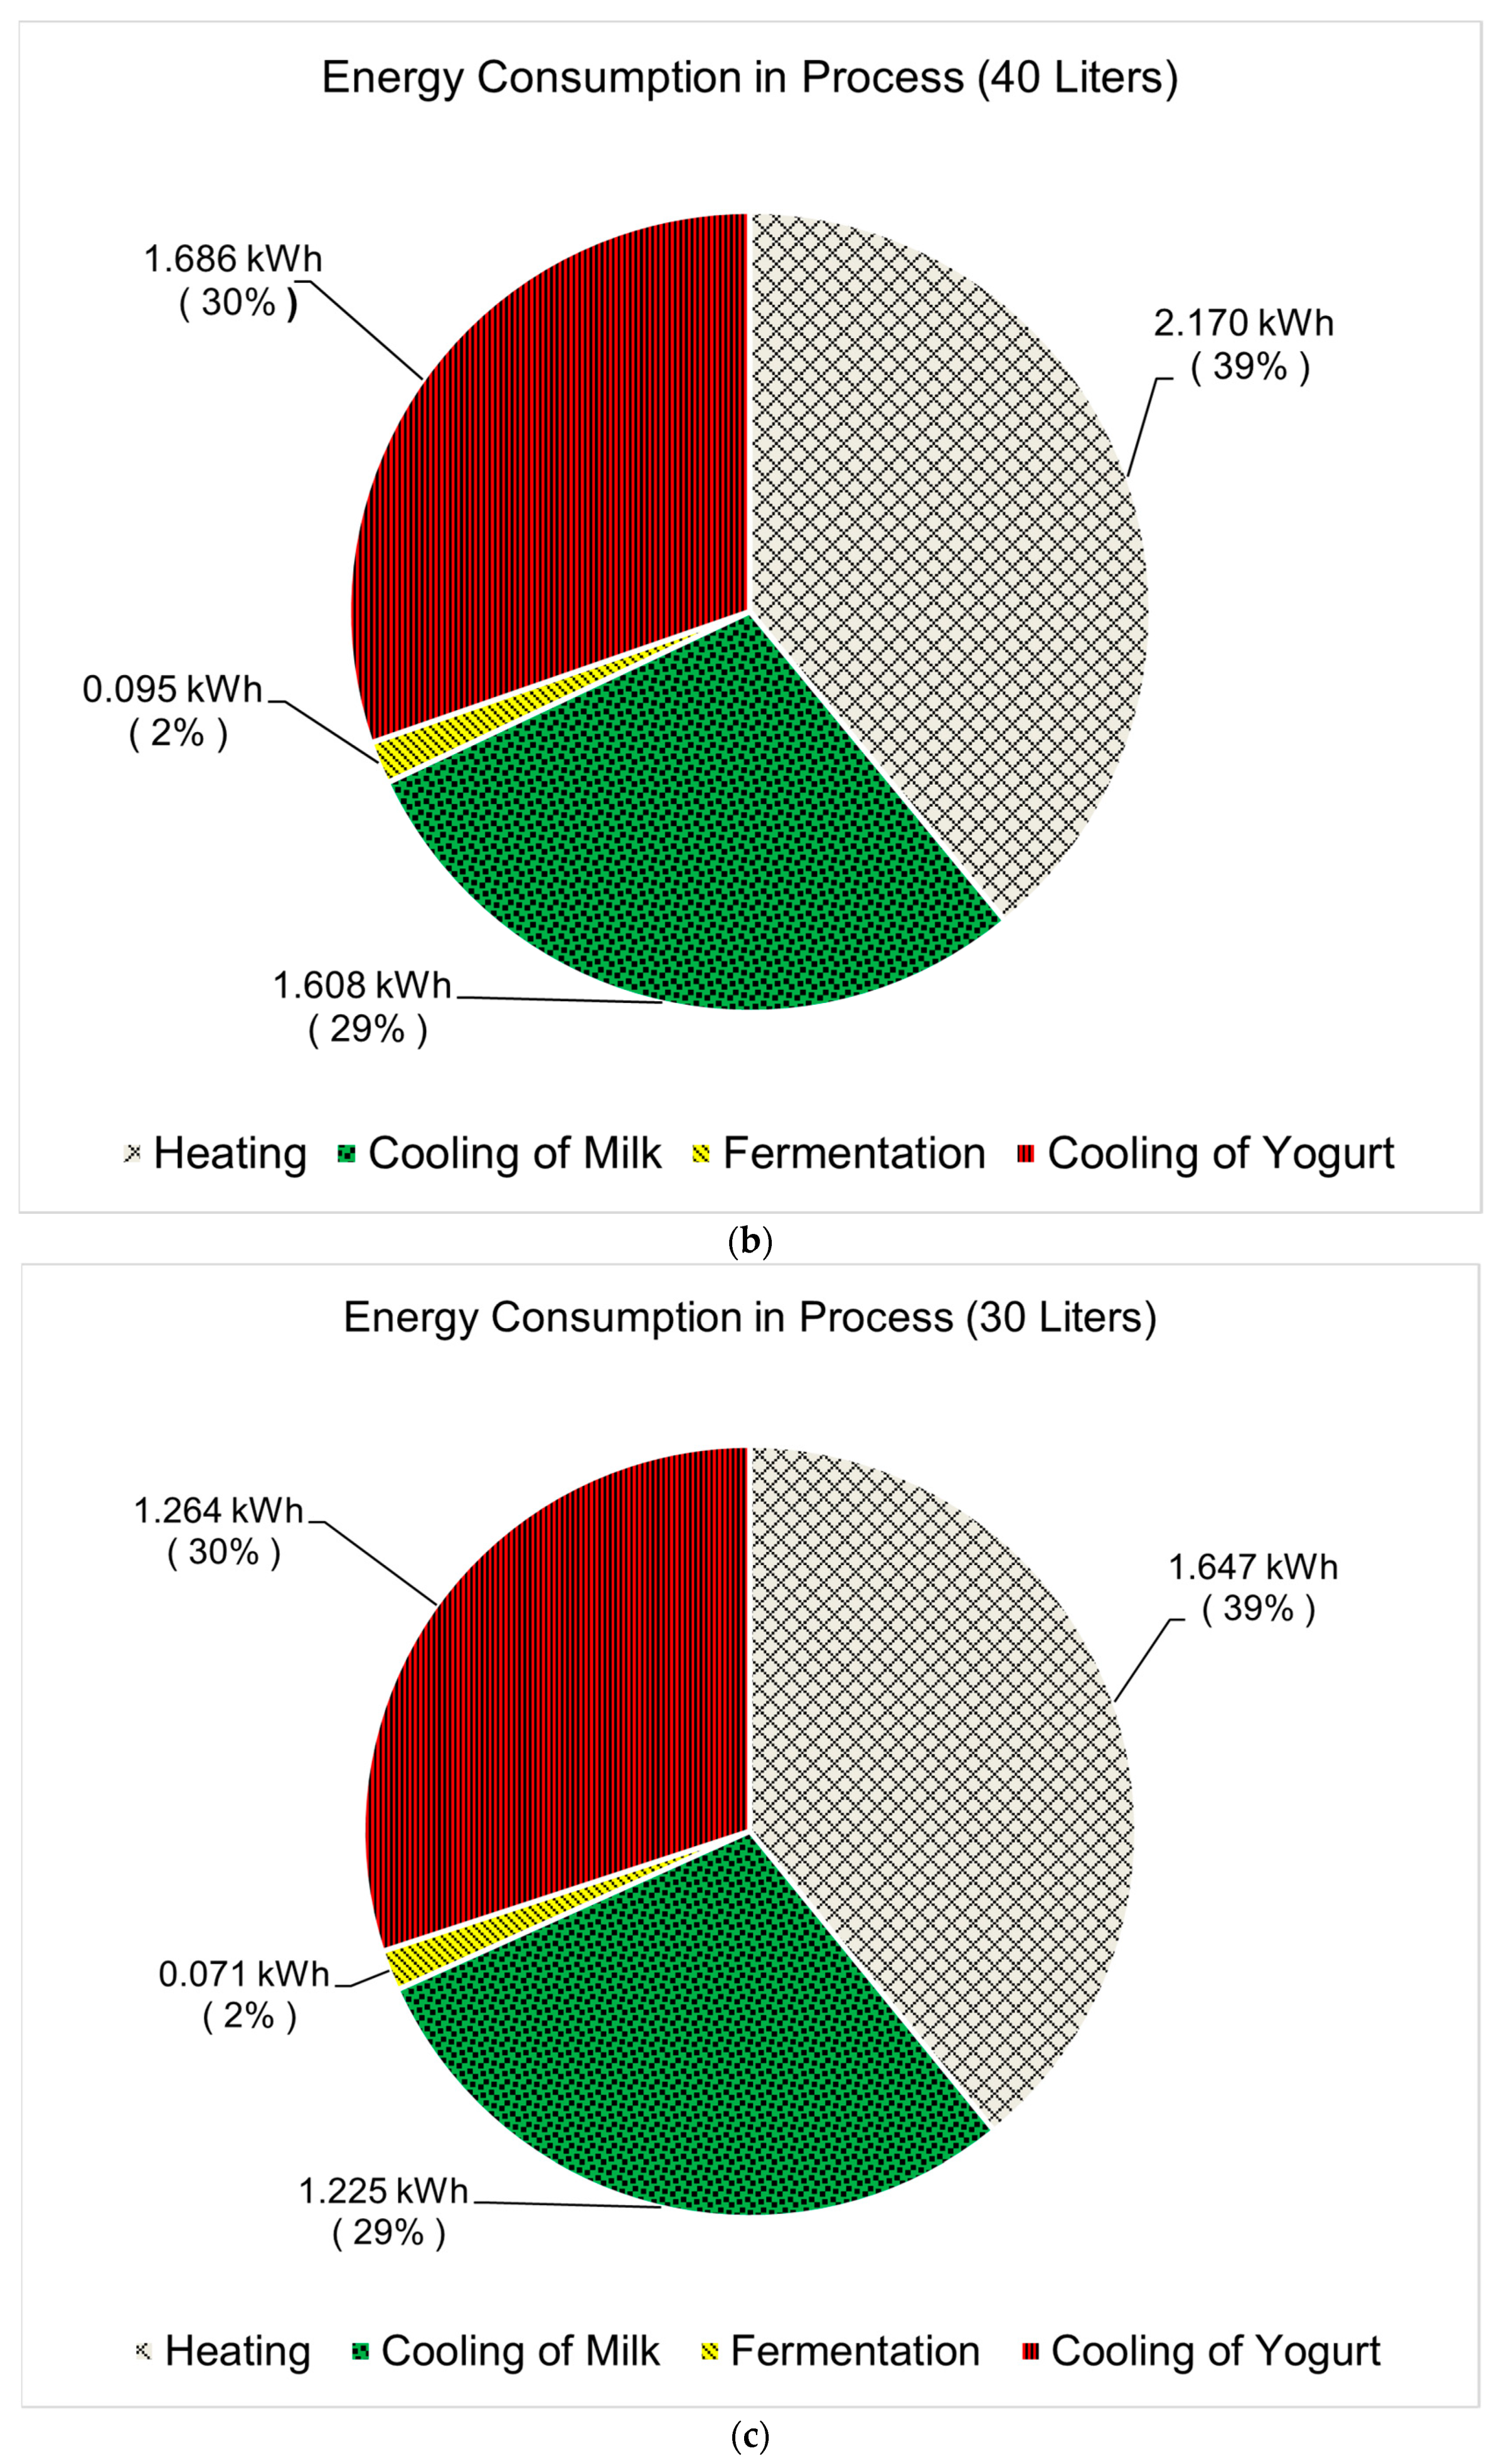
The energy consumption pattern for the heating, fermentation and cooling processes is shown in Figure 12. The energy required to complete the yogurt-making process was provided by solar thermal and solar photovoltaic systems. The total energy consumed was calculated to be 6.732 kWh, 5.559 kWh and 4.207 kWh for 50, 40 and 30 L batches, respectively. It can be observed that, in all cases, a large part of the total energy was consumed during the heating process of the milk, followed by the cooling process of yogurt. The heating process was found to account for 40% of the total energy consumed during the 50 L process (Figure 12a), which was 39% of the respective total energies for the 40 L (Figure 12b) and 30 L cases. Similarly, the cooling of the yogurt process consumed 2.107 kWh (31% of total), 1.686 kWh (30% of the total) and 1.264 kWh (30% of the total) for the cases of 50, 40 and 30 L, respectively. Although a significant part of the energy is consumed during the cooling process of the milk, it is also important to note that this energy was neither provided by the solar photovoltaic nor by the solar thermal system or utility but through the thermal energy gained by circulating tap water. In addition, the specific product energy (SPE) was calculated to be 485 kJ/kg, 500 kJ/kg and 505 kJ/kg for 50, 40 and 30 L batches, respectively. In the case of 40 and 30 L milk processing, the contact area of the heating coil was not fully exposed to the product, resulting in higher heat loss, which is why the value of SPE is high. Although the process design, product quantity to be processed and operating conditions vary and effect the rates of energy usage, the process can be compared with other somehow similar work. It can be observed that the solar yogurt processing unit gave quite good results in terms of thermal analysis when compared with results reported by Yaseen et al. (2019) [20] who worked on milk pasteurization (100 L milk was heated up to 63 °C) and cooling (4 °C in the chiller within 90 min). In the current study, milk was pasteurized at 80 °C and it can also be noted that the system can easily be used for low-temperature pasteurization (63 °C) as well for 50 L of milk, making it feasible in terms of yogurt making and pasteurization. For cooling of the yogurt from 43 °C to 4 °C, the energy-utilization pattern showed similar rates as reported by Yaseen et al. (2019) [20] and Khan et al. (2020) [13] for milk cooling using rotary compressor.
4. Conclusions
In the current study, a solar-assisted decentralized solution for yogurt processing was presented, capable of performing all required processes (heating, fermentation and cooling) in a single chamber. The systems consisted of a cylindrically shape chamber surrounded by a squared helix coil heat exchanger for heating and a pillow plate at its bottom for cooling. Experiments were performed using raw milk from cows at different volumes and stirrer speeds. The total energy consumed was calculated to be 6.732 kWh, 5.559 kWh and 4.207 kWh for the cases of 50, 40 and 30 L, respectively. This shows that approximately 2020, 1668, and 1262 electrical units (kWh) can be saved annually to process 50, 40 and 30 L, respectively, by considering three hundred sunny days (one batch per day) throughout the year in Faisalabad, Pakistan. During milk heating and cooling, the optimized stirrer speed was found to be 36 rpm, while for the cooling of yogurt it was 18 rpm. It was found that a majority of the total energy was consumed by the heating processes followed by the cooling process. This supports the integration of solar evacuated tube collectors for heating purposes instead of converting electrical energy into thermal energy which can increase the operating and capital costs of the system. The use of solar thermal energy (for heating) and PV modules (for cooling) not only played a significant role in reducing the operational energy cost, but also facilitated its decentralized applications. The study provides a basis for design optimization to process any milk volume. Being a batch system, the integrated solar system (both PV and thermal) can be used for farm electrification and heating purposes in the event of non-operational periods.
5. Directions for Further Research
Once processing a large quantity of raw milk, the effect of the flow rates of the circulating hot water need to be investigated. Similarly, impact of heat transfer fluids, i.e., silicon fluids and paraffin oil, on the heating efficiency of the evacuated tube collector can also be considered for further research. Thirdly, use of the Scheffler fixed focus concentrator as a heat source can also be compared.
Author Contributions
Conceptualization, S.N.H. and O.H.; methodology, S.N.H. and W.A.; software, S.N.H. and W.A.; validation, S.N.H., W.A. and O.H.; formal analysis, S.N.H. and W.A.; investigation, S.N.H., W.A., A.M.; resources, O.H. and A.M.; data curation, S.N.H. and W.A.; writing—original draft preparation, S.N.H.; writing—review and editing, S.N.H., W.A., A.M. and O.H.; visualization, S.N.H. and W.A.; supervision, O.H. and A.M.; project administration, A.M. and O.H.; funding acquisition, A.M. and O.H. All authors have read and agreed to the published version of the manuscript.
Funding
The development cost of the system was provided by the International Center for Development and Decent Work (ICDD) Germany.
Institutional Review Board Statement
Not applicable.
Informed Consent Statement
Not applicable.
Data Availability Statement
Not applicable.
Acknowledgments
The author thanks the Higher Education Commission (HEC) of Pakistan and the German Academic Exchange Service (DAAD) for providing subsistence/research costs for the current study. The Author would also like to thank the University of Kassel, Germany for providing funds for publishing the work.
Conflicts of Interest
The authors declare no conflict of interest.
Nomenclature
| Symbol | |
| Ac | Surface area of evacuated tube collector (m2) |
| A | Heat transfer area area (m2) |
| CBat | Capacity of the battery bank (Ah) |
| Cp | Specific heat (kJ kg−1 k−1) |
| Cpg | Specific heat capacity of the refrigerant at constant pressure in gaseous state (kJ kg−1 k−1) |
| Cpl | Specific heat capacity of the refrigerant at constant pressure in the liquid state (kJ kg−1 k−1) |
| CIP | Clean-in-place |
| COP | Coefficient of performance |
| ETC | Evacuated tube collectors |
| d | Diameter (m) |
| Dd | Depth of discharge in fraction |
| GHI | Global Horizontal Irradiation) (W/m2) |
| Havg | Average global horizontal irradiance (kWh/(m2 d)) |
| h1 | Enthalpy of the refrigerant at the compressor inlet (kJ kg−1) |
| h2 | Enthalpy of the refrigerant at the compressor inlet (kJ kg−1) |
| h3 | Enthalpy of the refrigerant after the condensation process outlets (kJ kg−1) |
| hf3 | Liquid enthalpy after condenser outlet (kJ kg−1) |
| h2′ | Enthalpy of the refrigerant at the dry saturated steam line after compression process |
| h3′ | Enthalpy of the refrigerant at the water line after condensation (kJ kg−1) |
| I | Current (A) |
| Ib | Solar irradiance (W/m2) |
| Le | Electric load (kWh/d) |
| m | Mass (kg) |
| m′ | Mass flow rate (kgs−1) |
| Nccd | Autonomy and taken as the number of continuous cloudy days |
| Pp | Peak power of the solar system (kWp) |
| P | Power required to run the refrigeration system (kW) |
| PU | Polyurethane |
| PV | Photovoltaic |
| PVC | Polyvinyl chloride |
| Qt | Total heat transfer through walls and bottom (kWh/d) |
| QR | Cooling load of the product (kWh/d) |
| RTD | Resistance Temperature Detector |
| SS | Stainless steel |
| SPE | Specific production energy (kJ/kg) |
| STC | Standard test conditions |
| Tc | Cold face temperature of fermentation chamber (°C). |
| Th | Hot face temperature of the fermentation chamber (°C) |
| TCF | Temperature correction factor (0.4% per °C) |
| T2 | Actual temperatures of the refrigerant at the compressor outlet (K) |
| T2′ | Saturation temperature at the compressor outlet (K) |
| T3 | Actual temperature of the refrigerant after condenser (K) |
| T3′ | Saturation temperature at the liquid line after condensation process (K) |
| TR | Capacity of refrigeration |
| ∆T | Change in temperature (K) |
| t | Time (sec) |
| U | Overall heat transfer coefficient (W/m2 °C) |
| VFD | Variable frequency drive |
| V | Voltage |
| V | Volume (m3) |
| Subscripts | |
| bat | Battery |
| inv | Inverter |
| r | Refrigerant |
| oc | Open circuit |
| mpp | Maximum power |
| Greek Symbols | |
| τ | Transmission coefficient, |
| α | Absorption coefficient |
| η | Efficiency (%) |
References
- Wang, L.; Bandyopadhyay, S.; Cosgrove-Davies, M.; Samad, H. Quantifying Carbon and Distributional Benefits of Solar Home System Programs in Bangladesh; Policy Research Working Paper 5545; The World Bank Environment Department: Washington, DC, USA, 2011. [Google Scholar] [CrossRef]
- Shahid, H.; Shafique, O.; Shokat, A. Dairy Industry of Pakistan. Eur. J. Bus. Manag. 2012, 4, 1–4. [Google Scholar]
- Charad, J.; Lanctuit, H. Nestlé Dairy Factories in Pakistan: Losses Across the Value Chain—A Case Study; The Food Loss & Waste Protocol: Washington, DC, USA, 2017. [Google Scholar]
- Tamang, J.P. Ethnic Fermented Foods and Alcoholic Beverages of Asia; Chapter 5 Ethnic Fermented Foods in Pakistan; Springer: Delhi, India, 2016. [Google Scholar] [CrossRef]
- Singh, G.; Chopra, K.; Tyagi, V.; Pandey, A.; Ma, Z.; Ren, H. A comprehensive energy, exergy and enviroeconomic (3-E) analysis with carbon mitigation for multistage evaporation assisted milk powder production unit. Sustain. Energy Technol. Assess. 2020, 43, 100925. [Google Scholar] [CrossRef]
- Munir, M.T.; Yu, W.; Young, B.R. Can Exergy Be a Useful Tool for the Dairy Industry? Computer Aided Chemical Engineering; Elsevier: Amsterdam, The Netherlands, 2014; Volume 33. [Google Scholar] [CrossRef]
- Brush, A.; Eric, M.; Ernst, W. Energy Efficiency Improvement and Cost Saving Opportunities, An ENERGY STAR® Guide for Energy and Plant Managers. In Energy Analysis Department Environmental Energy Technologies Division Lawrence Berkeley National Laboratory; Lawrence Berkeley National Laboratory: Berkeley, CA, USA, 2011. [Google Scholar]
- Von Keyserlingk, M.A.G.; Martin, N.P.; Kebreab, E.; Knowlton, K.F.; Grant, R.J.; Stephenson, M.; Sniffen, C.J.; Harner, J.R., III; Wright, A.D.; Smith, S.I. Invited review: Sustainability of the US dairy industry. J. Dairy Sci. 2013, 96, 5405–5425. [Google Scholar] [CrossRef] [PubMed] [Green Version]
- Tahir, Z.; Asim, M. Surface measured solar radiation data and solar energy resource assessment of Pakistan: A review. Renew. Sustain. Energy Rev. 2018, 81, 2839–2861. [Google Scholar] [CrossRef]
- Michael, M.B.; Akinlabi, E.T.; Jen, T.C. A Review of Solar Thermal Systems Utilization for Industrial Process Heat Applications. Lect. Notes Eng. Comput. Sci. 2016, 2226, 859–863. [Google Scholar]
- Amjad, W.; Waseem, M.; Munir, A.; Ghafoor, A.; Asghar, F.; Gilani, G.A. Solar Assisted Dehydrator for Decentralized Controlled and Homogeneous Multi-Product Drying. J. Sol. Energy Eng. Trans. ASME 2021, 143, 11011. [Google Scholar] [CrossRef]
- Ismail, M.I.; Yunus, N.A.; Hashim, H. Integration of Solar Heating Systems for Low-Temperature Heat Demand in Food Processing Industry—A Review. Renew. Sustain. Energy Rev. 2021, 147, 111192. [Google Scholar] [CrossRef]
- Khan, K.S.; Amjad, W.; Munir, A.; Hensel, O. Improved Solar Milk Chilling System Using Variable Refrigerant Flow Technology (VRF). Sol. Energy 2020, 197, 317–325. [Google Scholar] [CrossRef]
- Desai, D.D.; Raol, J.B.; Patel, S.; Chauhan, I. Application of Solar Energy for Sustainable Dairy Development. Eur. J. Sustain. Dev. 2013, 2, 131–140. [Google Scholar] [CrossRef]
- Mekhilef, S.; Saidur, R.; Safari, A. A Review on Solar Energy Use in Industries. Renew. Sustain. Energy Rev. 2011, 15, 1777–1790. [Google Scholar] [CrossRef]
- Anderson, T.N.; Duke, M. Solar Energy Use for Energy Savings in Dairy Processing Plants. IPENZ Eng. TreNz 2007, 2008, 1–9. Available online: https://hdl.handle.net/10289/3204 (accessed on 20 September 2021).
- Zahira, R.; Akif, H.; Amin, N.; Azam, M.; Haq, Z.U. Fabrication and Performance Study of a Solar Milk Pasteurizer. Pak. J. Agric. Sci. 2009, 46, 162–168. [Google Scholar]
- Fathey Mohamed Atia, M.; Mostafa, M.M.; El-Nono, A.M.; Abdel-Salam, F.M. Solar Energy Utilization for Milk Pasteurization. Misr J. Agric. Eng. 2011, 28, 729–744. [Google Scholar]
- Wayua, F.O.; Okoth, M.W.; Wangoh, J. Design and Performance Assessment of a Flat-Plate Solar Milk Pasteurizer for Arid Pastoral Areas of Kenya. J. Food Process. Preserv. 2013, 37, 120–125. [Google Scholar] [CrossRef]
- Yaseen, M.U.; Ashraf, M.; Munir, A. Development and performance evaluation of solar assisted milk pasteurizer by using vacuum tube collector. Pak. J. Agric. Sci. 2019, 56, 693–700. [Google Scholar] [CrossRef]
- Liu, Z.; Li, H.; Liu, K.; Yu, H.; Cheng, K. Design of high-performance water-in-glass evacuated tube solar water heaters by a high-throughput screening based on machine learning: A combined modeling and experimental study. Sol. Energy 2017, 142, 61–67. [Google Scholar] [CrossRef]
- Ben Taher, M.; Benseddik, Z.; Afass, A.; Smouh, S.; Ahachad, M.; Mahdaoui, M. Energy life cycle cost analysis of various solar water heating systems under Middle East and North Africa region. Case Stud. Therm. Eng. 2021, 27, 101262. [Google Scholar] [CrossRef]
- Mohammed, A.K.; Hamakhan, I.A. Analysis of energy savings for residential electrical and solar water heating systems. Case Stud. Therm. Eng. 2021, 27, 101347. [Google Scholar] [CrossRef]
- Cengel, Y.A. Heat Transference a Practical Approach; MacGraw-Hill: New York, NY, USA, 2004; Volume 4, p. 874. [Google Scholar]
- Ghafoor, A.; Munir, A. Design and Economics Analysis of an Off-Grid PV System for Household Electrification. Renew. Sustain. Energy Rev. 2015, 42, 496–502. [Google Scholar] [CrossRef]
- Vendan, S.P.; Shunmuganathan, L.P.A.; Manojkumar, T.; Thanu, C.S. Study on Design of an Evacuated Tube Solar Collector for High Temperature Steam Generation. Int. J. Emerg. Technol. Adv. Eng. 2012, 2, 539–541. [Google Scholar]
- Thornton, B.; Wagner, A. Prepared for the General Services Administration by Pacific Northwest National Laboratory Variable Refrigerant Flow Systems. 2012. Available online: https://www.gsa.gov/cdnstatic/GPG_VRFTechnologyReport_20121220.pdf (accessed on 22 August 2021).
- Alsagri, A.S. Photovoltaic and Photovoltaic Thermal Technologies for Refrigeration Purposes: An Overview. Arab. J. Sci. Eng. 2022, 1–34. [Google Scholar] [CrossRef] [PubMed]
- Neri, I. Second law of thermodynamics at stopping times. Phys. Rev. Lett. 2020, 124, 40601. [Google Scholar] [CrossRef] [PubMed] [Green Version]
Figure 1.
Three-dimensional (3D) layout of solar-assisted yogurt processing unit.

Figure 2.
Layout of the experimental setup of the solar-assisted yogurt processing unit.
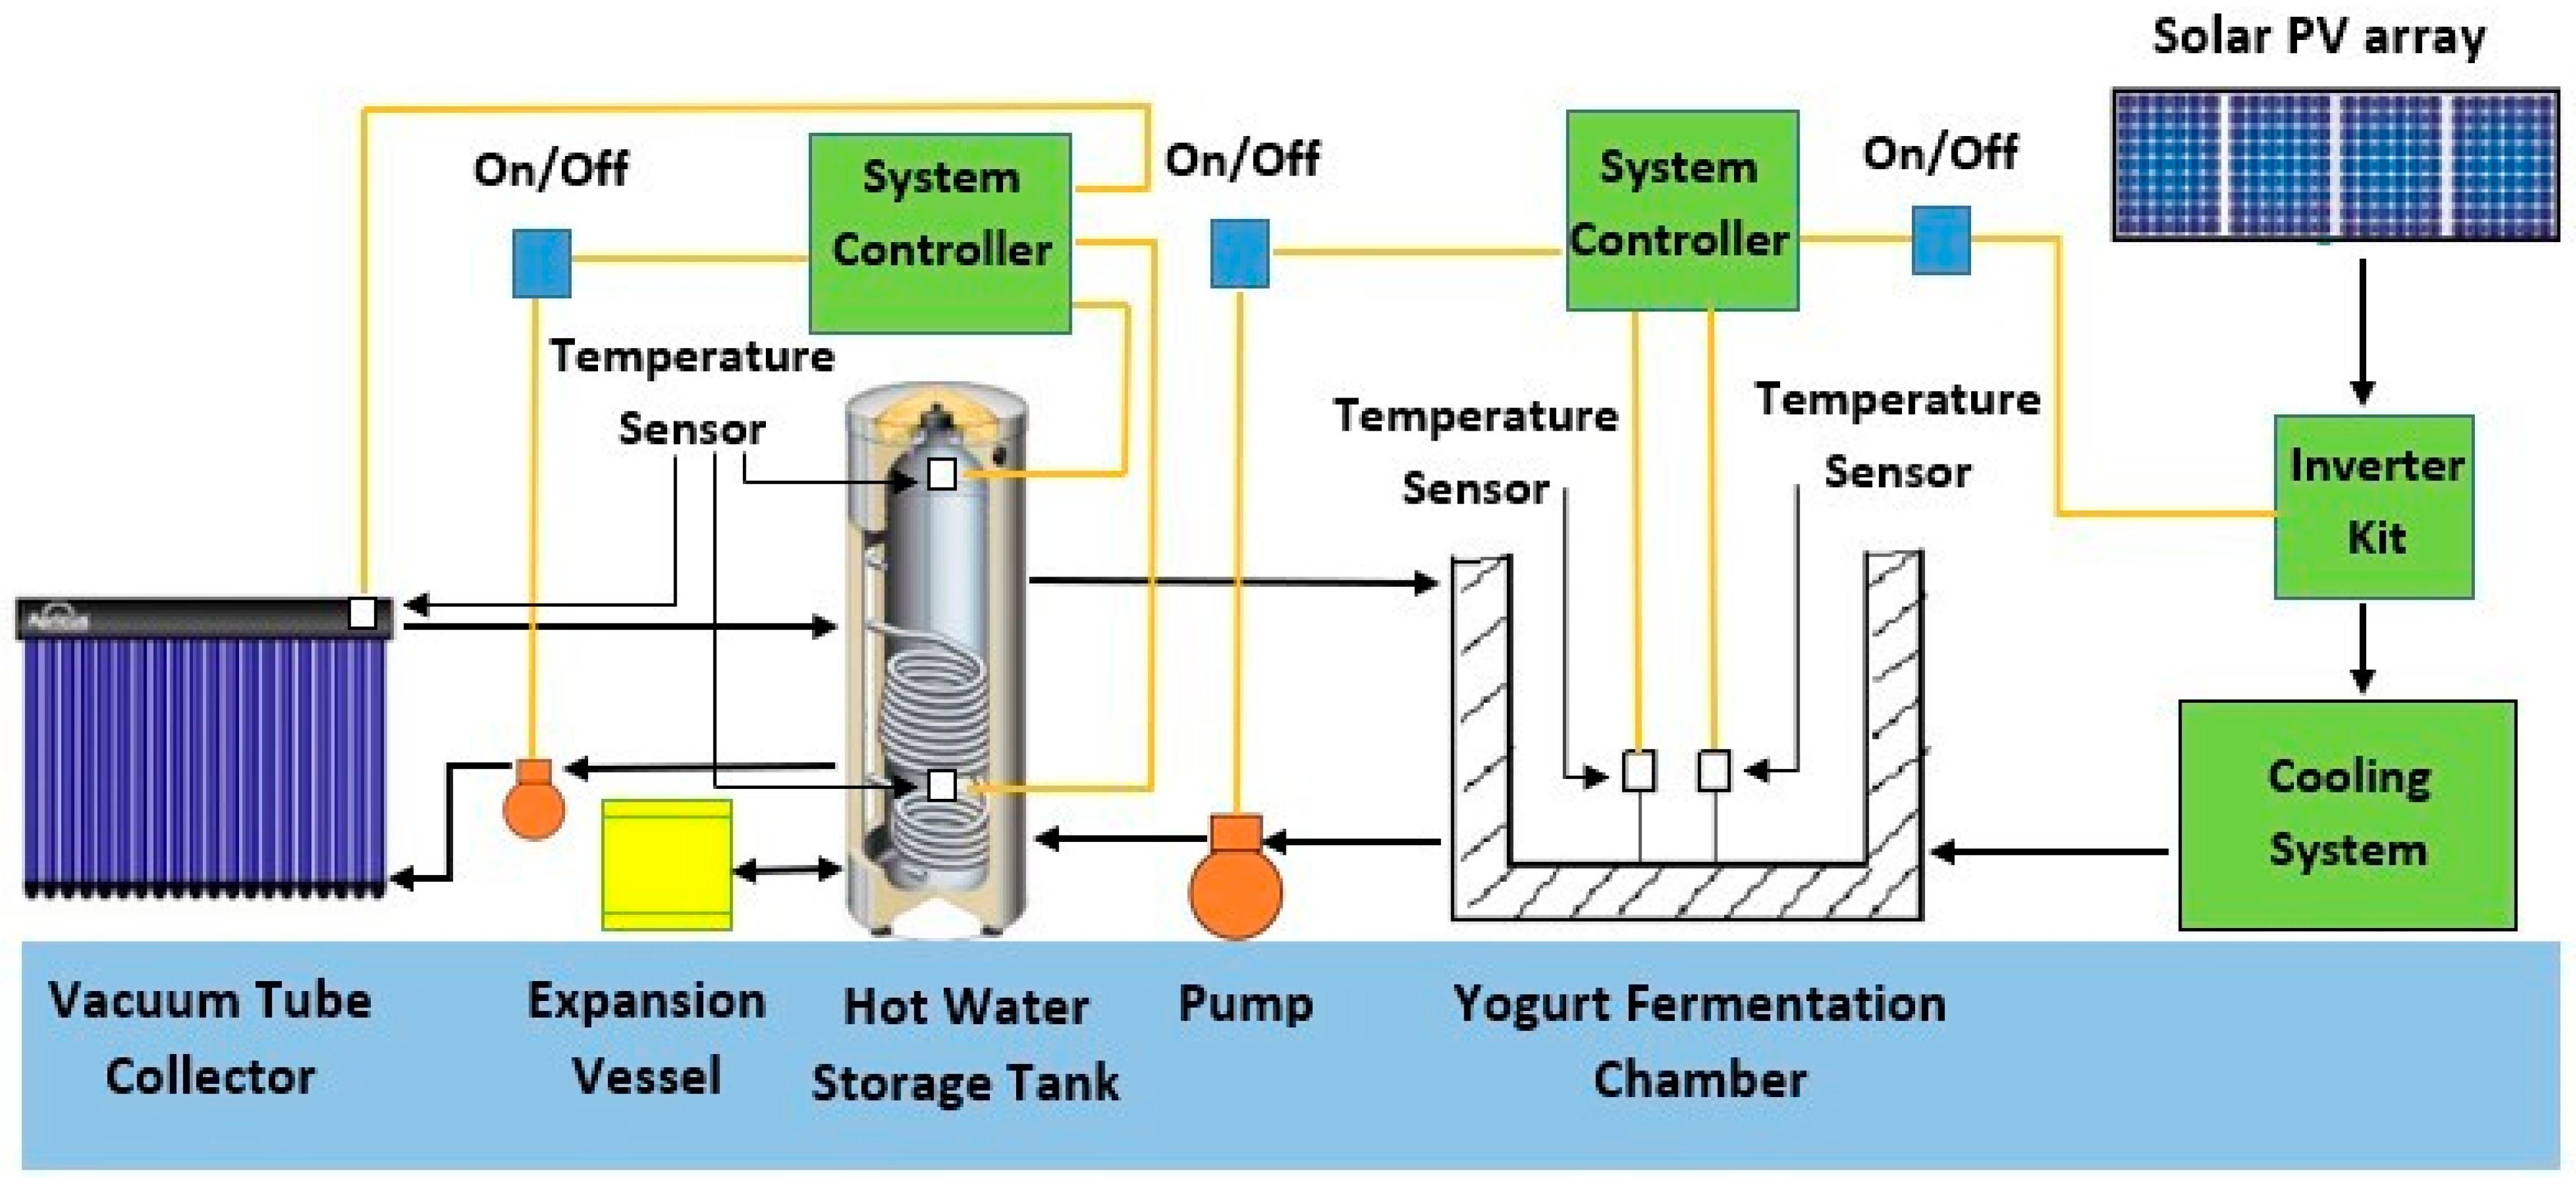
Figure 3.
Pictorial view of the installed solar-assisted yogurt processing unit.

Figure 4.
Temperature–entropy (T-s) and pressure–enthalpy (p-h) diagrams of the optimized compressor of the yogurt processing system.
Figure 4.
Temperature–entropy (T-s) and pressure–enthalpy (p-h) diagrams of the optimized compressor of the yogurt processing system.
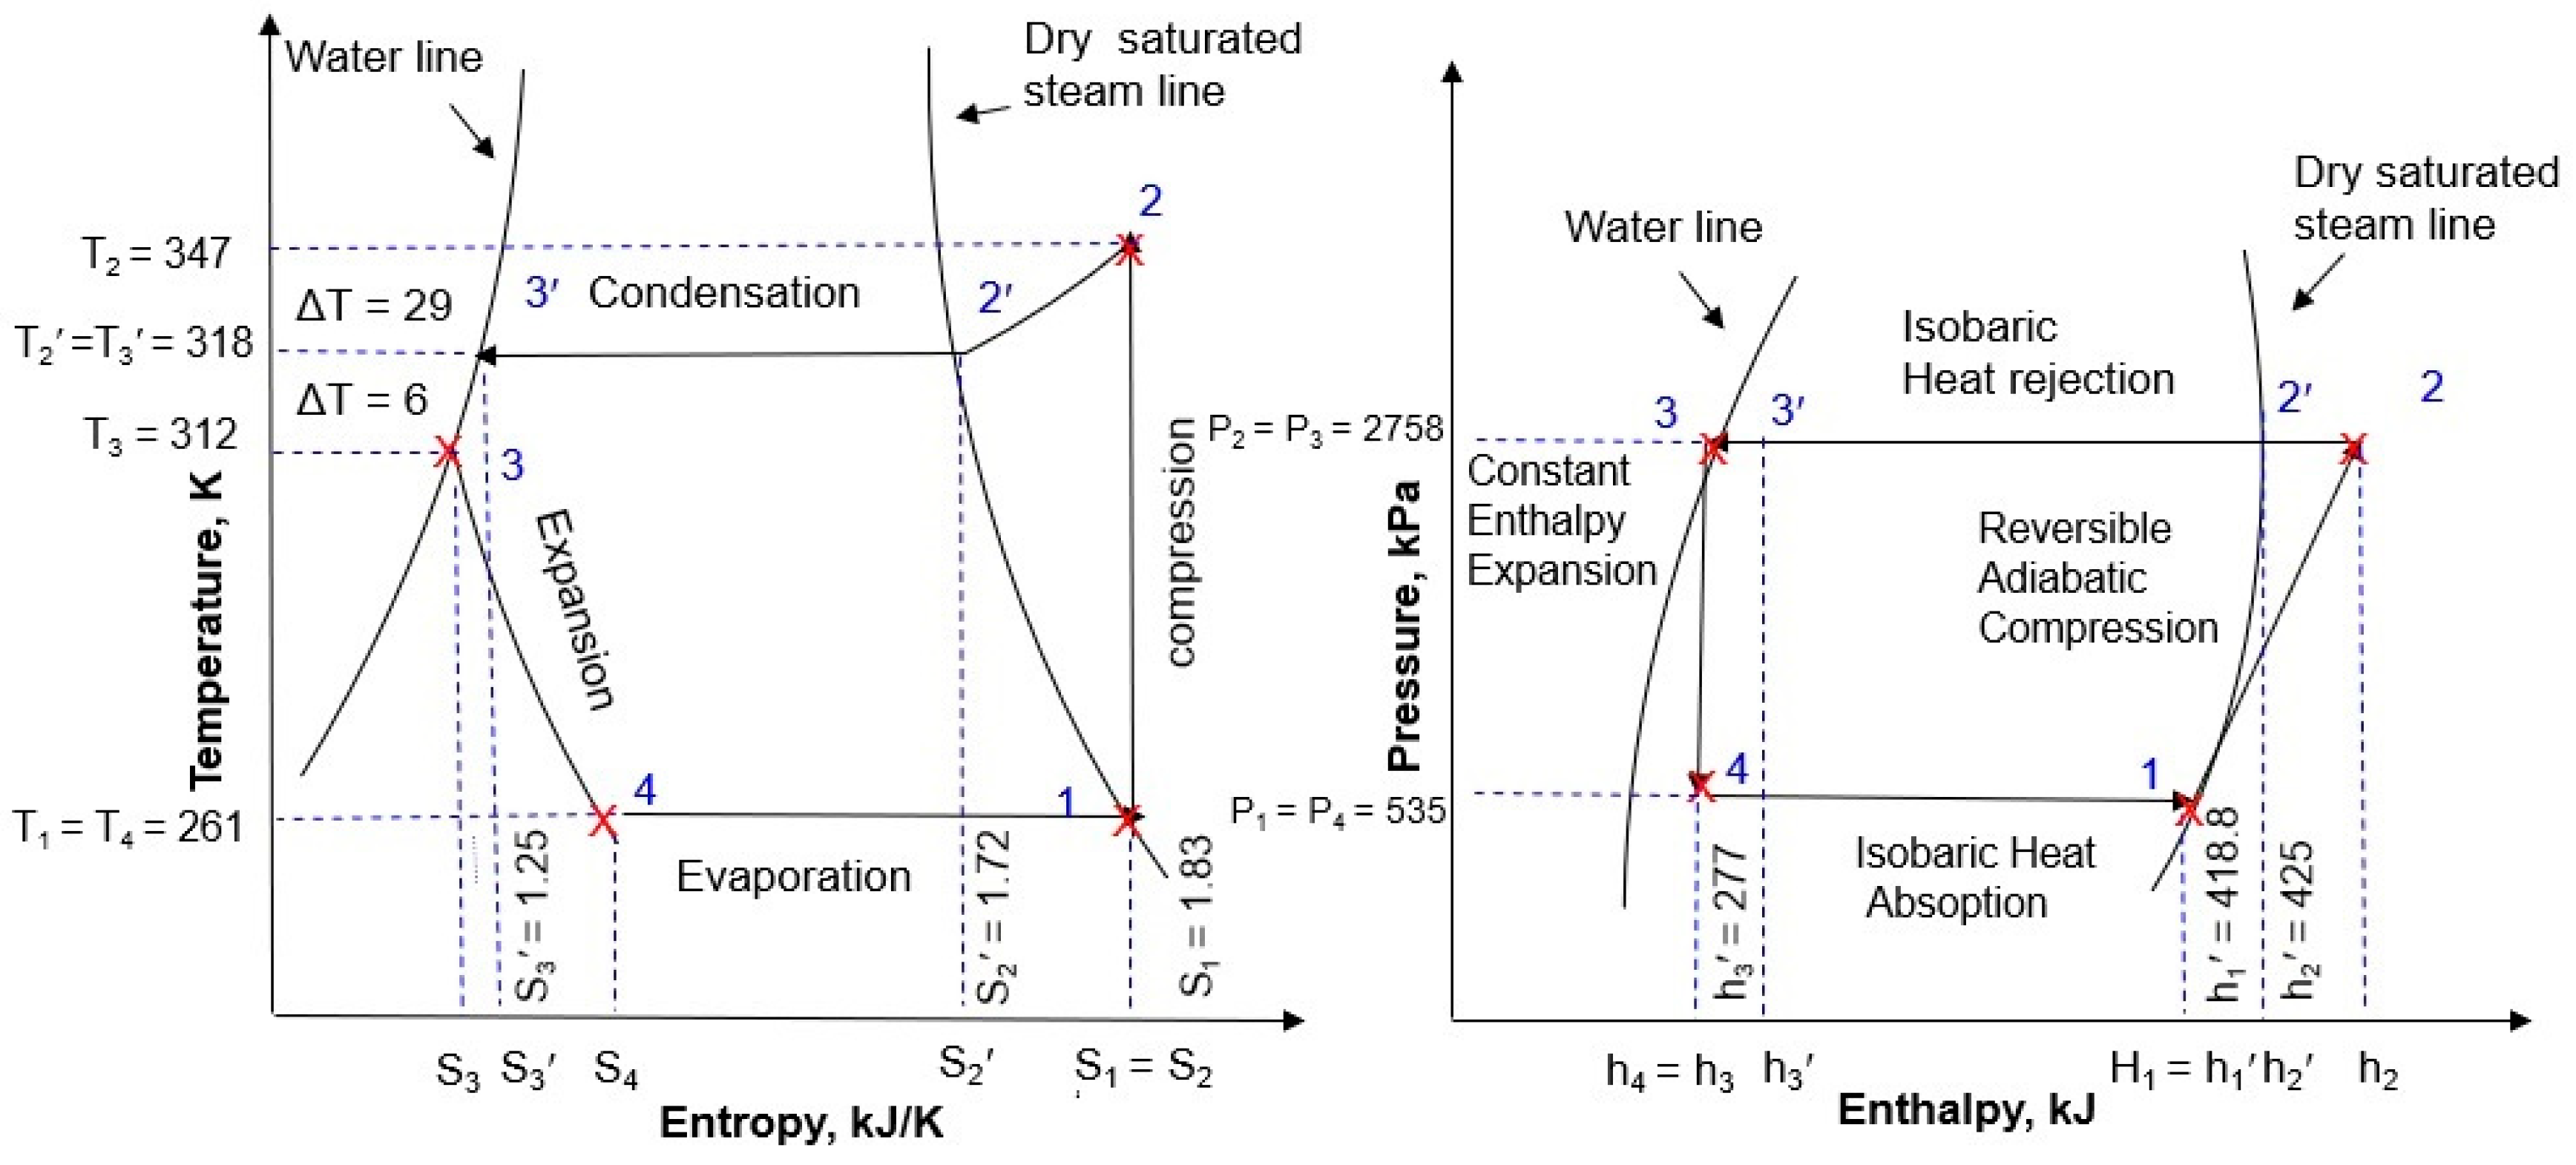
Figure 5.
Relationship between change in the hot water of the storage tank and milk temperatures under different loading capacities.
Figure 5.
Relationship between change in the hot water of the storage tank and milk temperatures under different loading capacities.
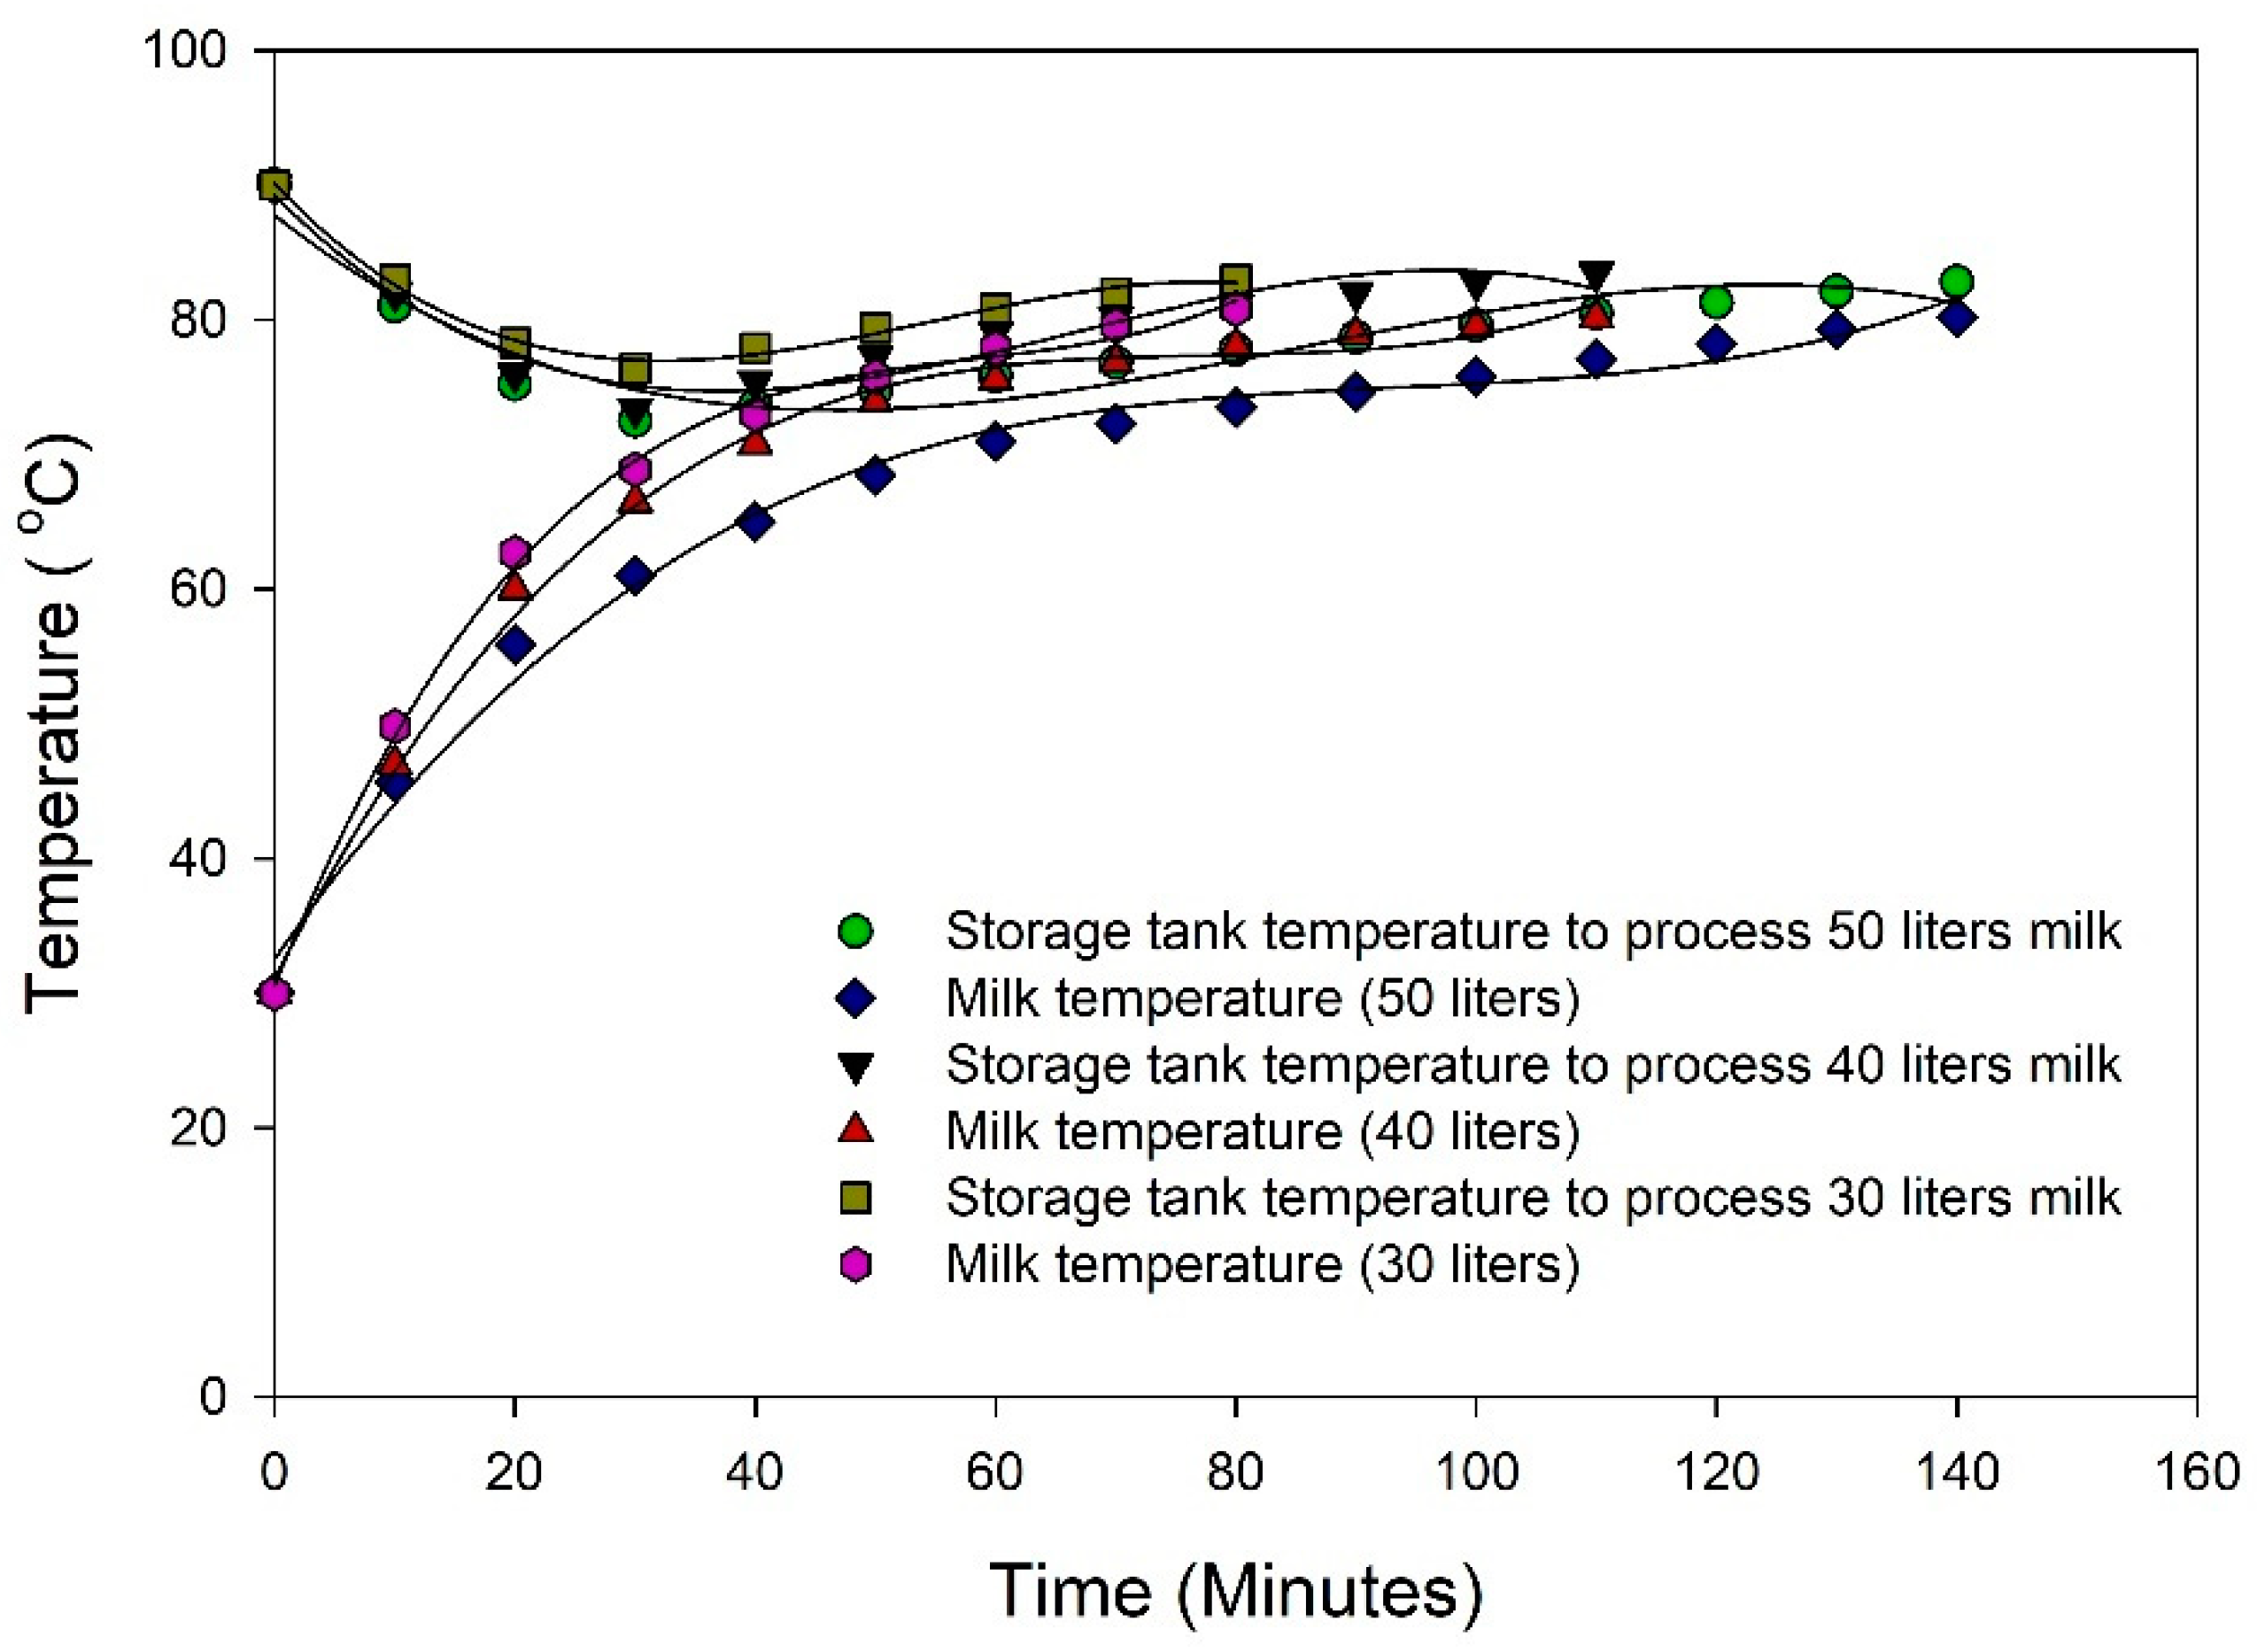
Figure 6.
Effect of solar irradiance on the performance parameters of the system (heating rate of circulation water, milk and net heating rate) during the heating process of milk at 50 L (a), 40 L (b) and 30 L (c) of milk.
Figure 6.
Effect of solar irradiance on the performance parameters of the system (heating rate of circulation water, milk and net heating rate) during the heating process of milk at 50 L (a), 40 L (b) and 30 L (c) of milk.
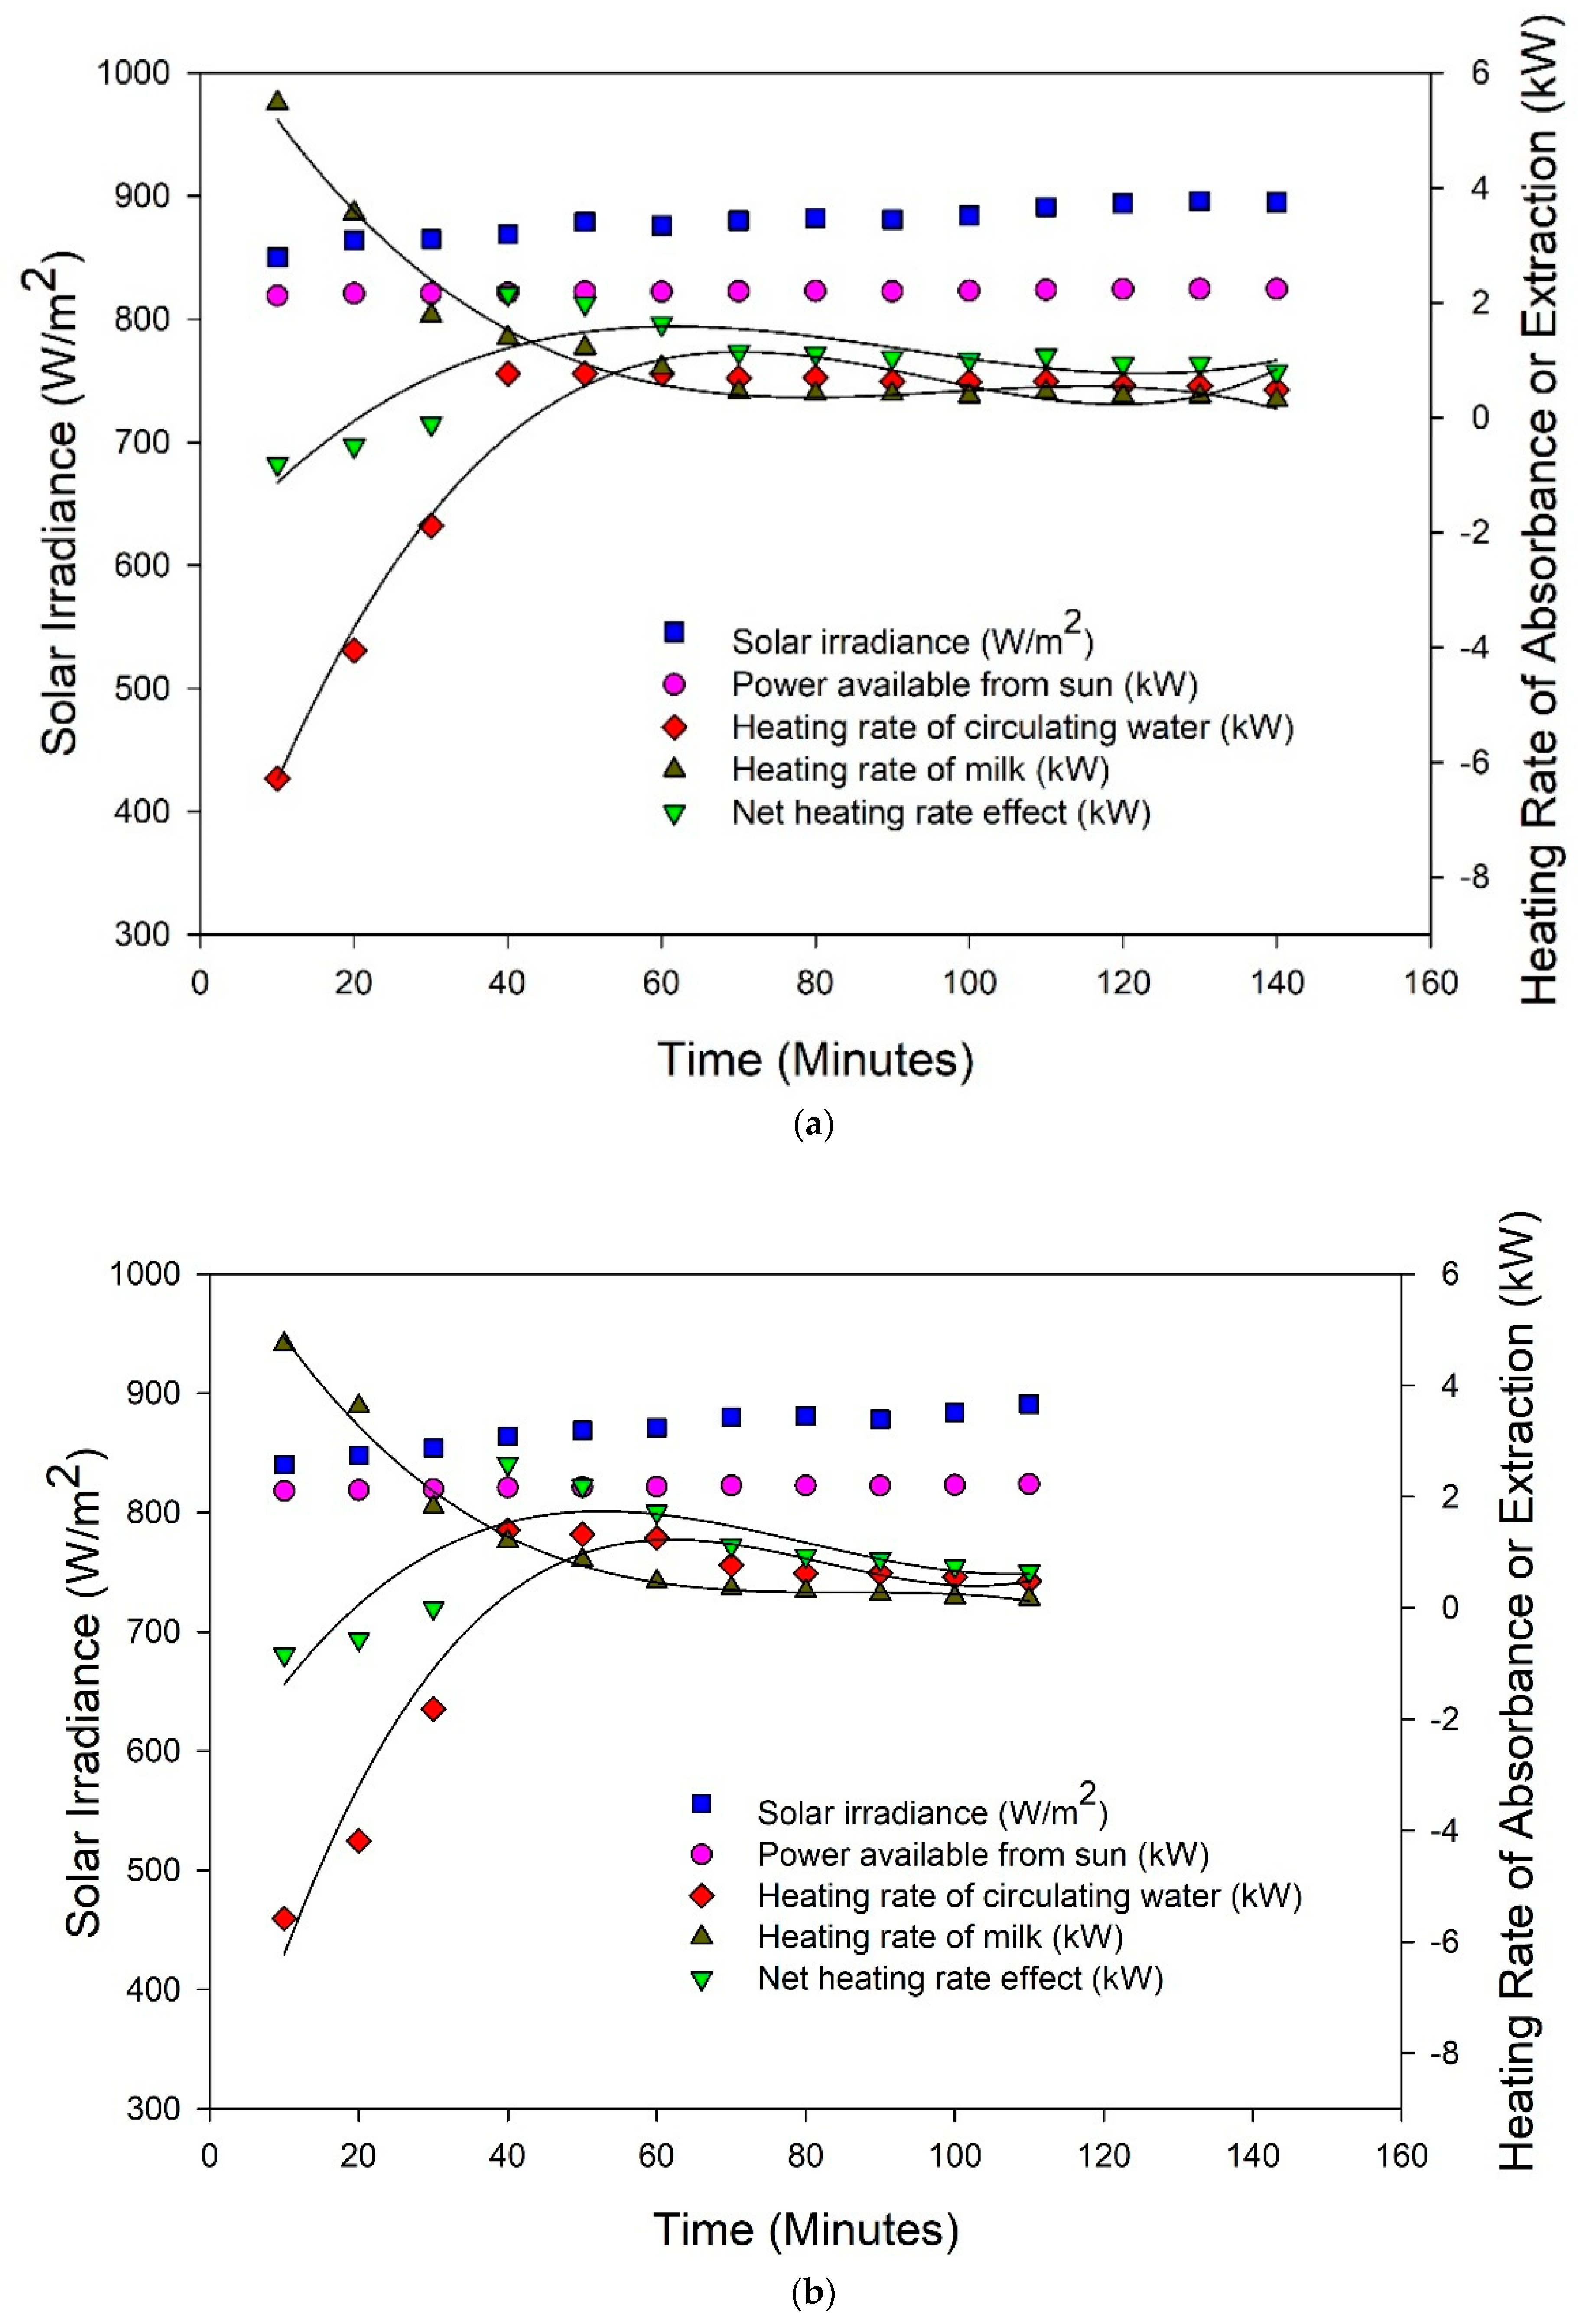
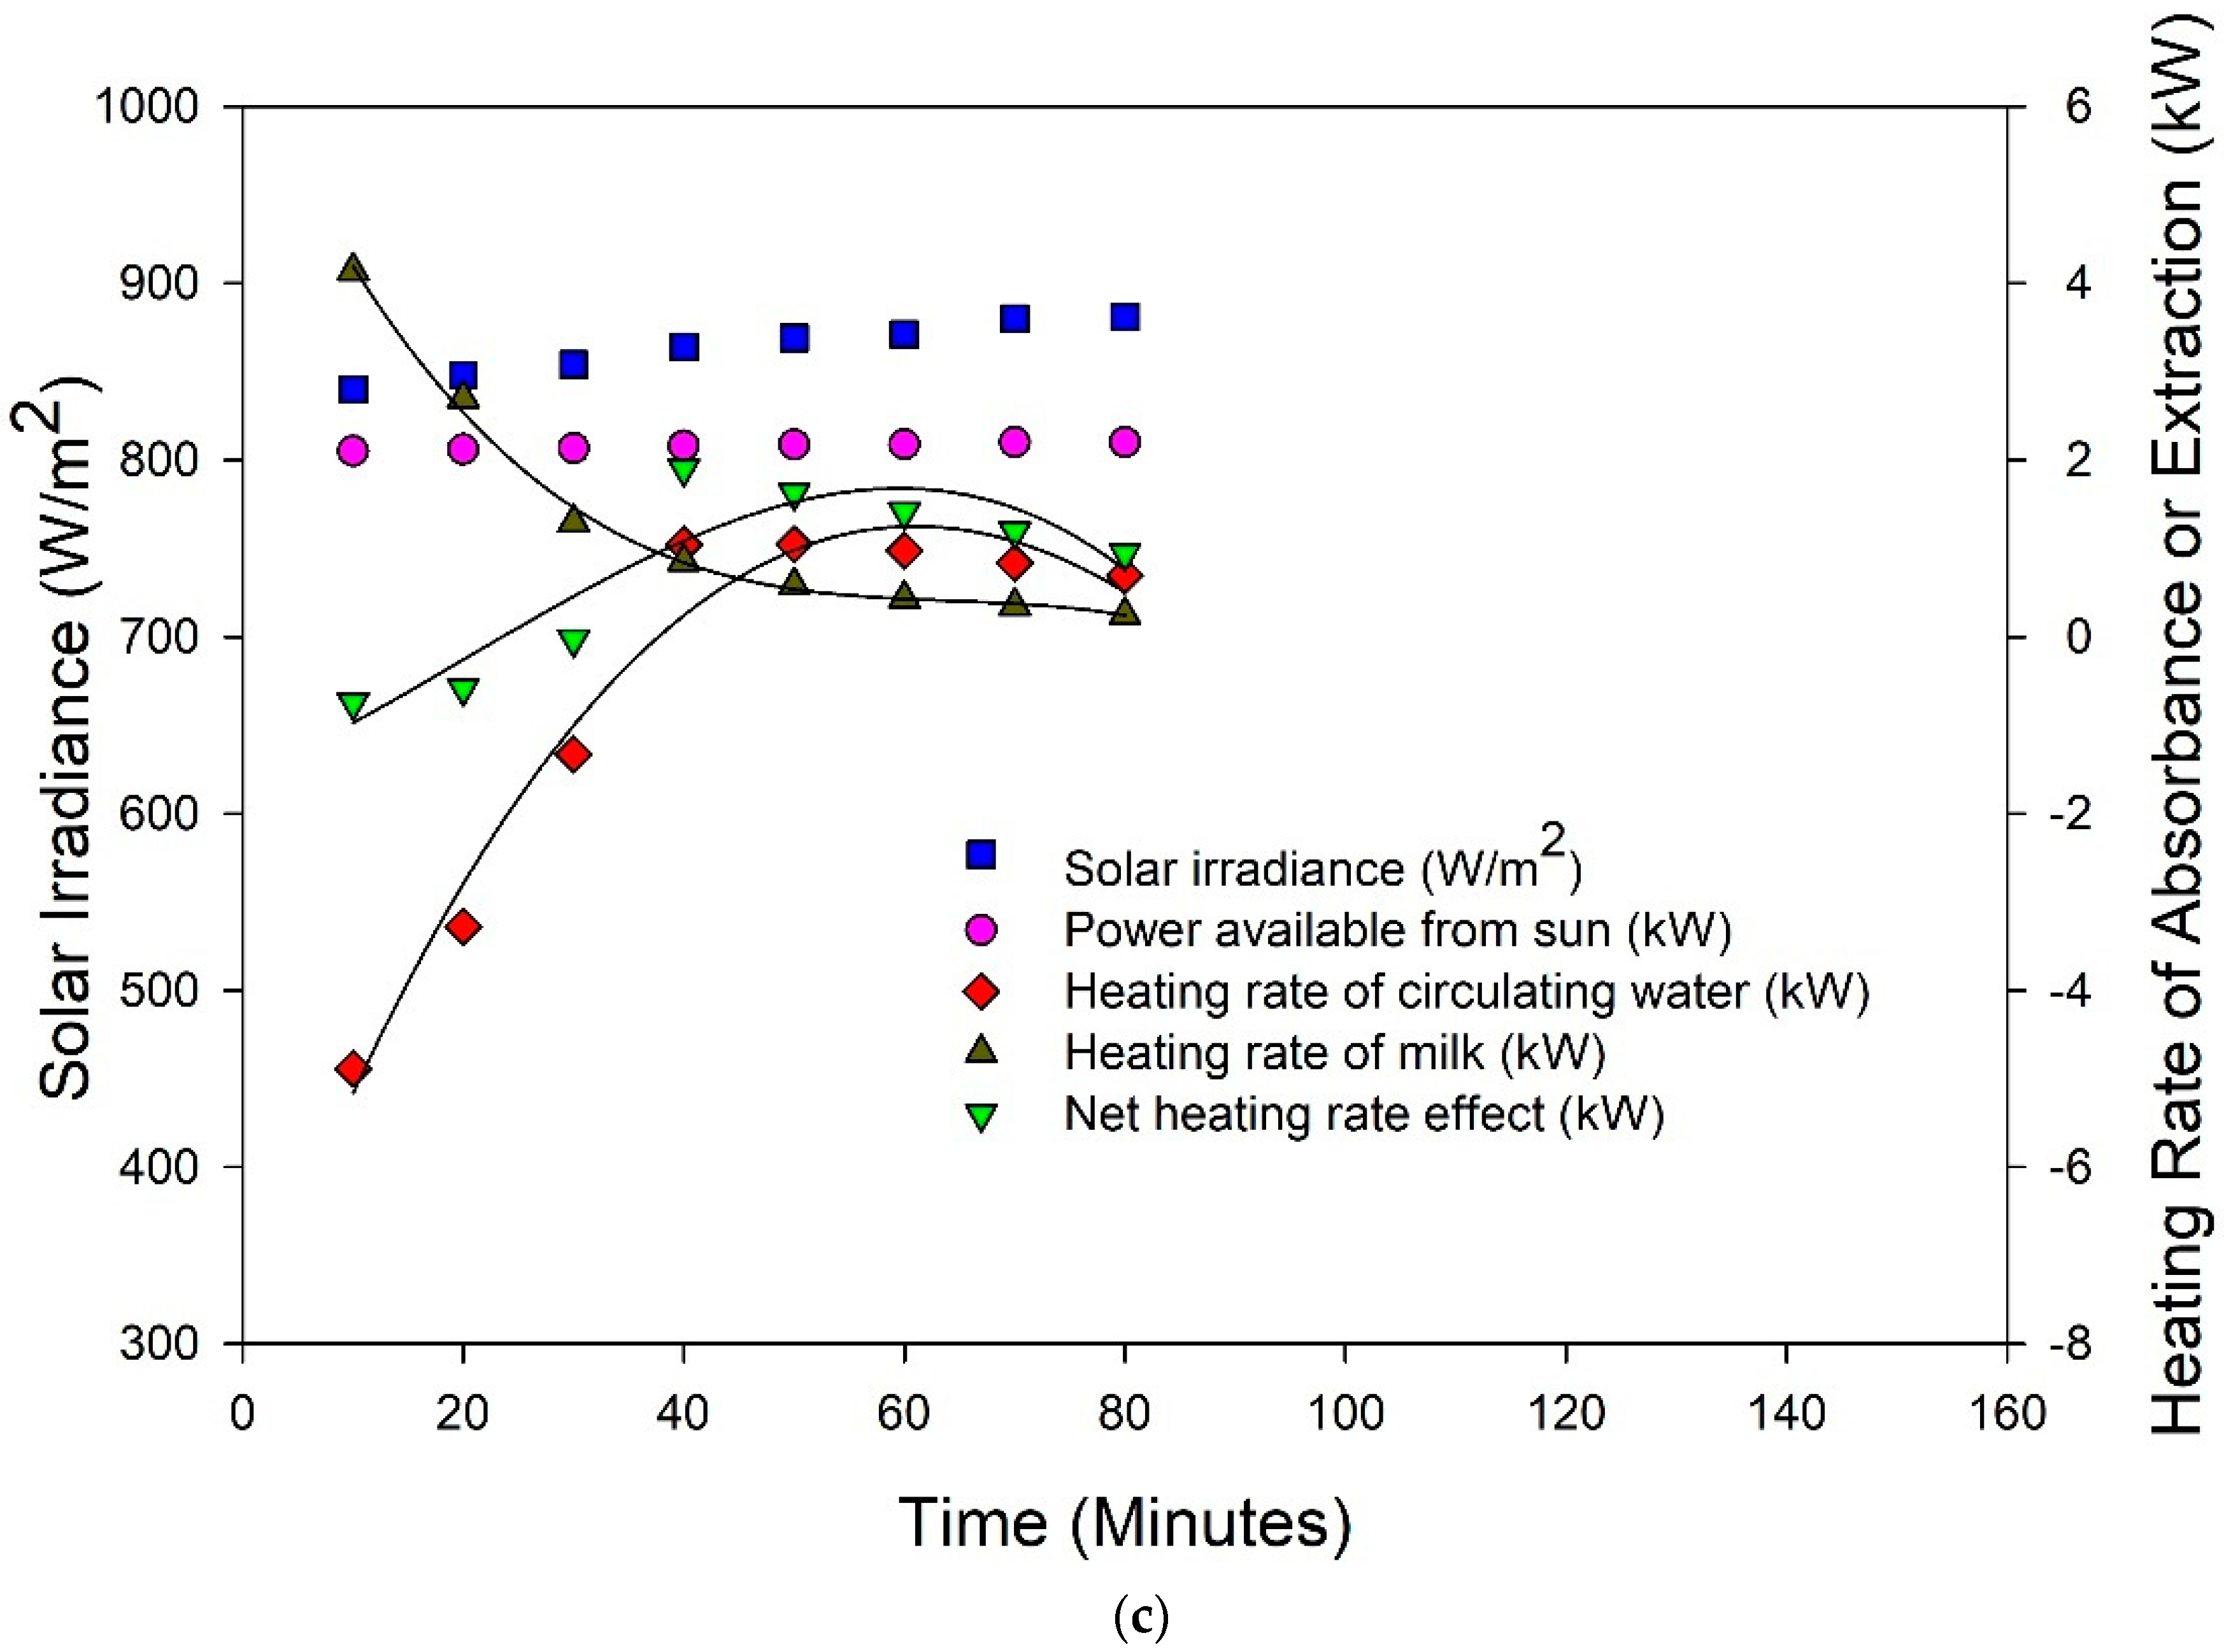
Figure 7.
Total heat energy released by water and absorbed by milk during the processing of 50 L (a), 40 L (b) and 30 L (c) milk.
Figure 7.
Total heat energy released by water and absorbed by milk during the processing of 50 L (a), 40 L (b) and 30 L (c) milk.
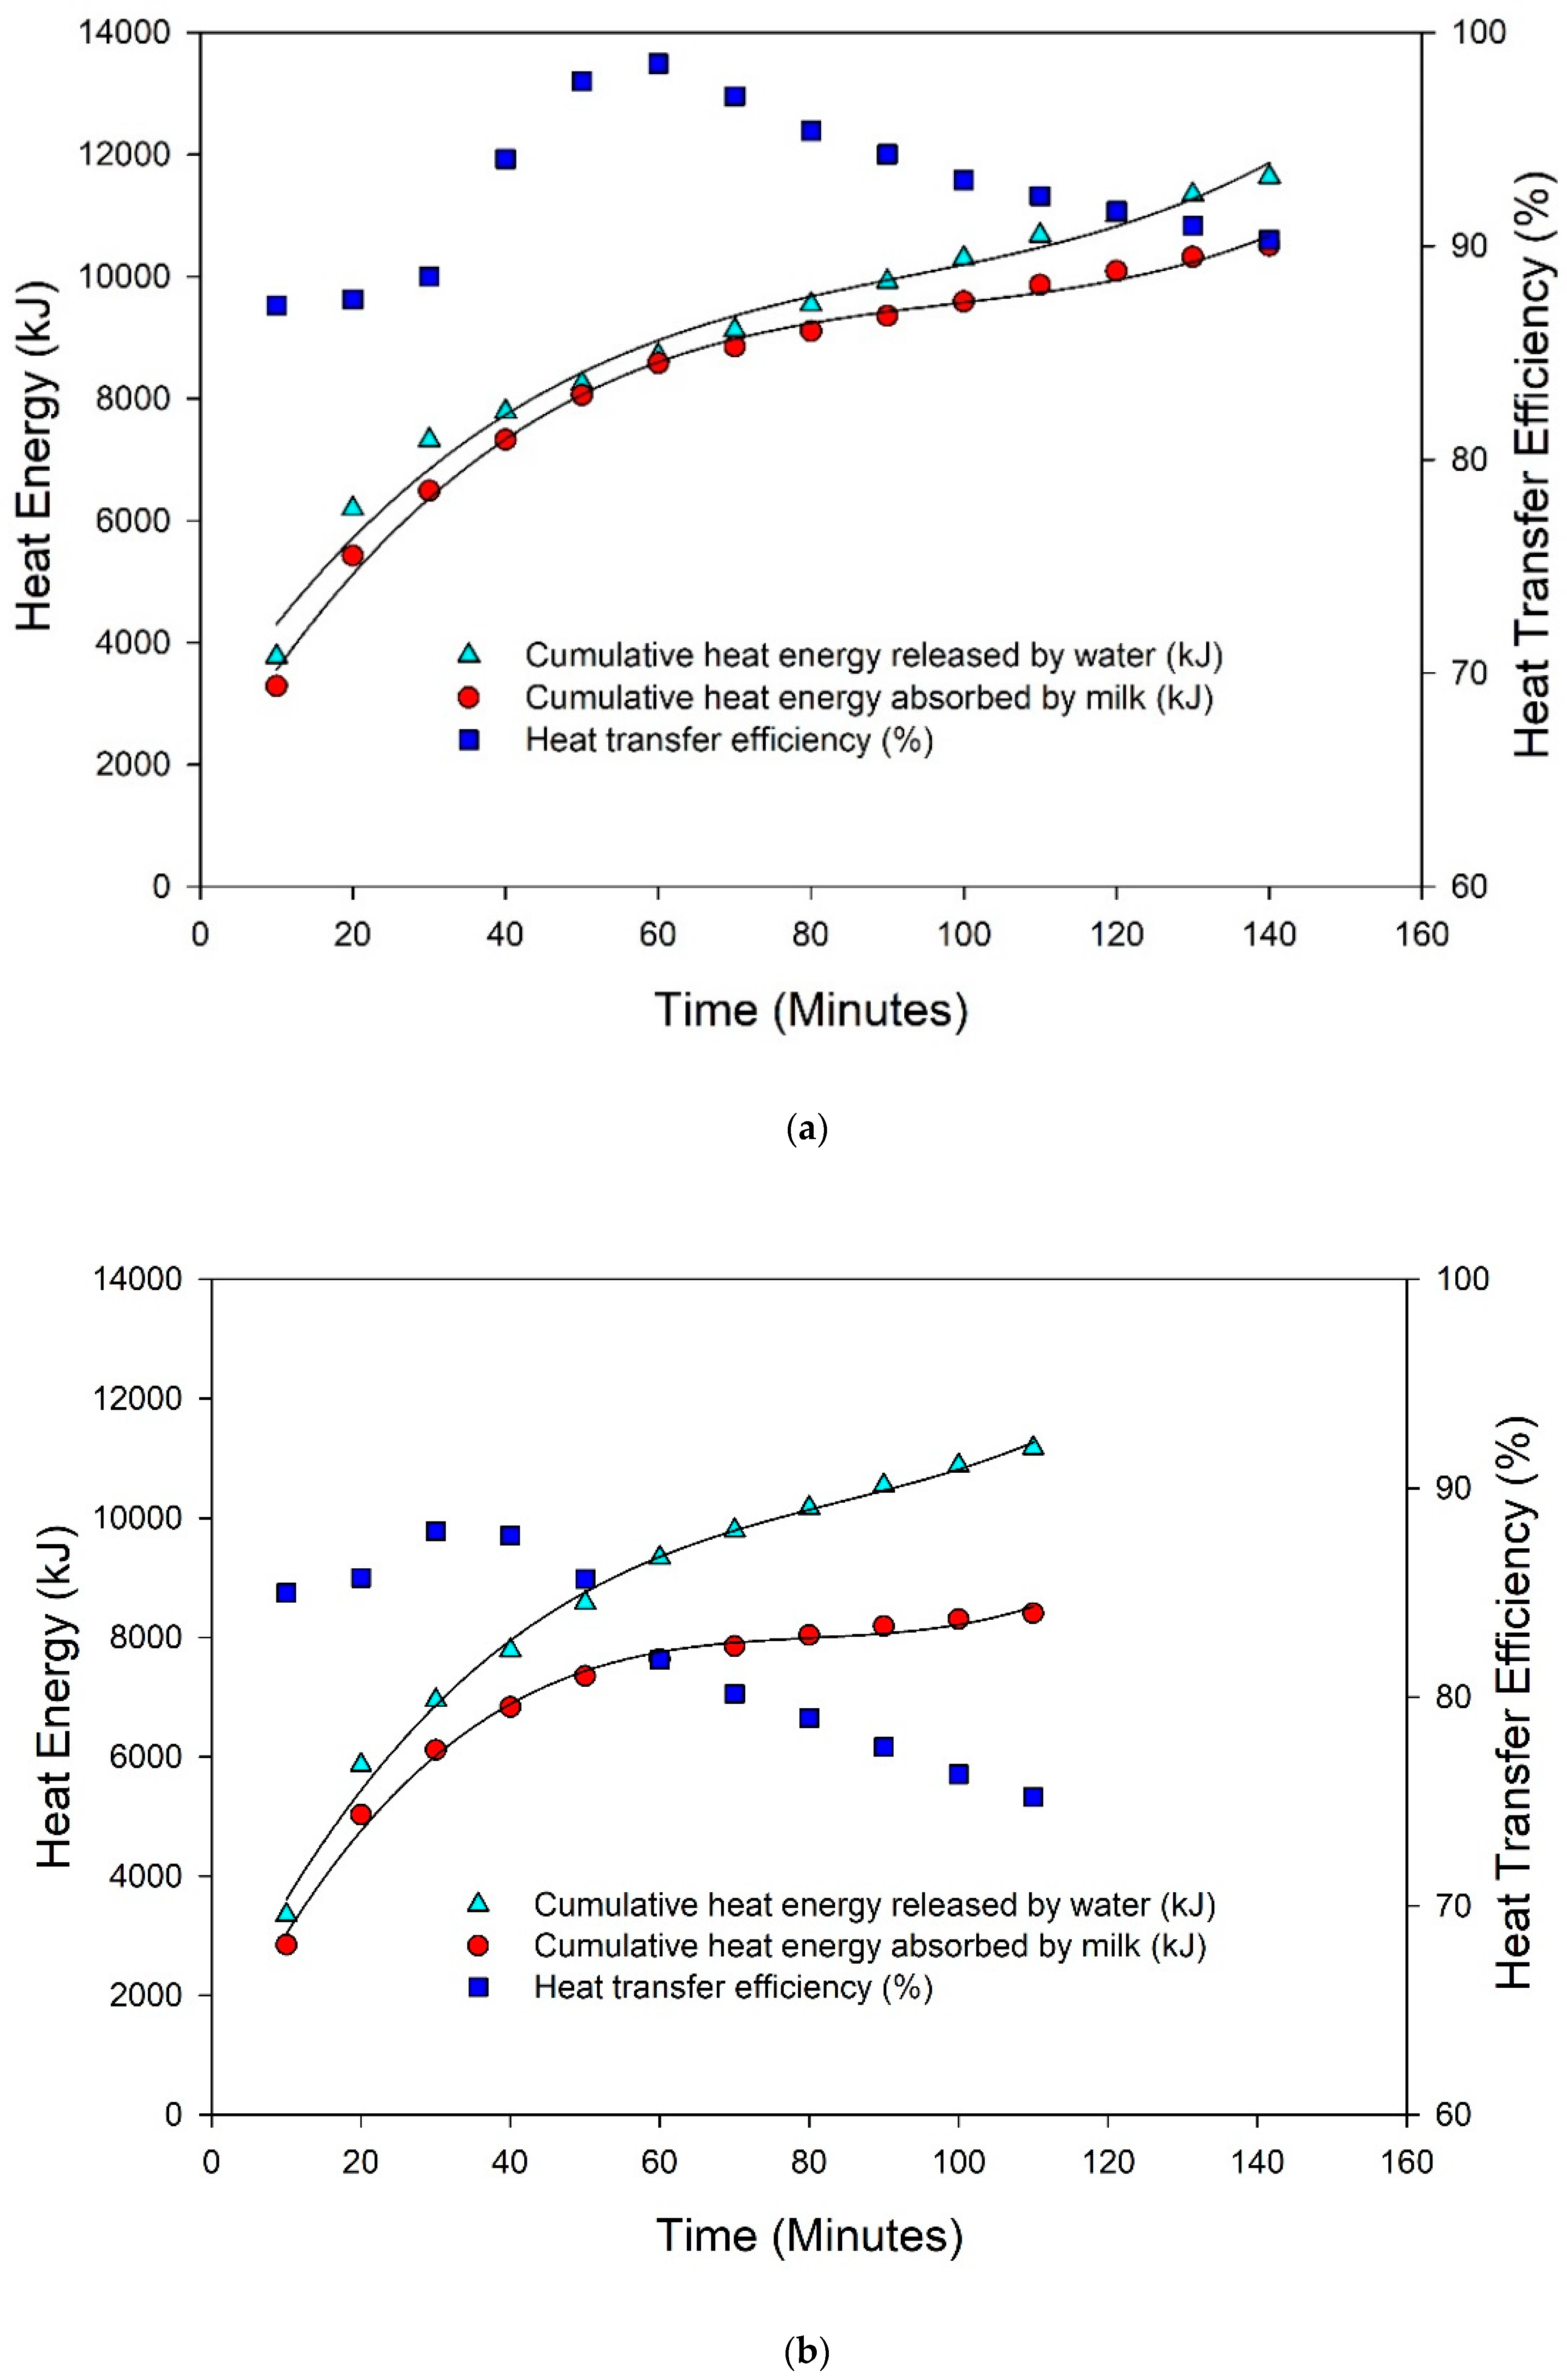
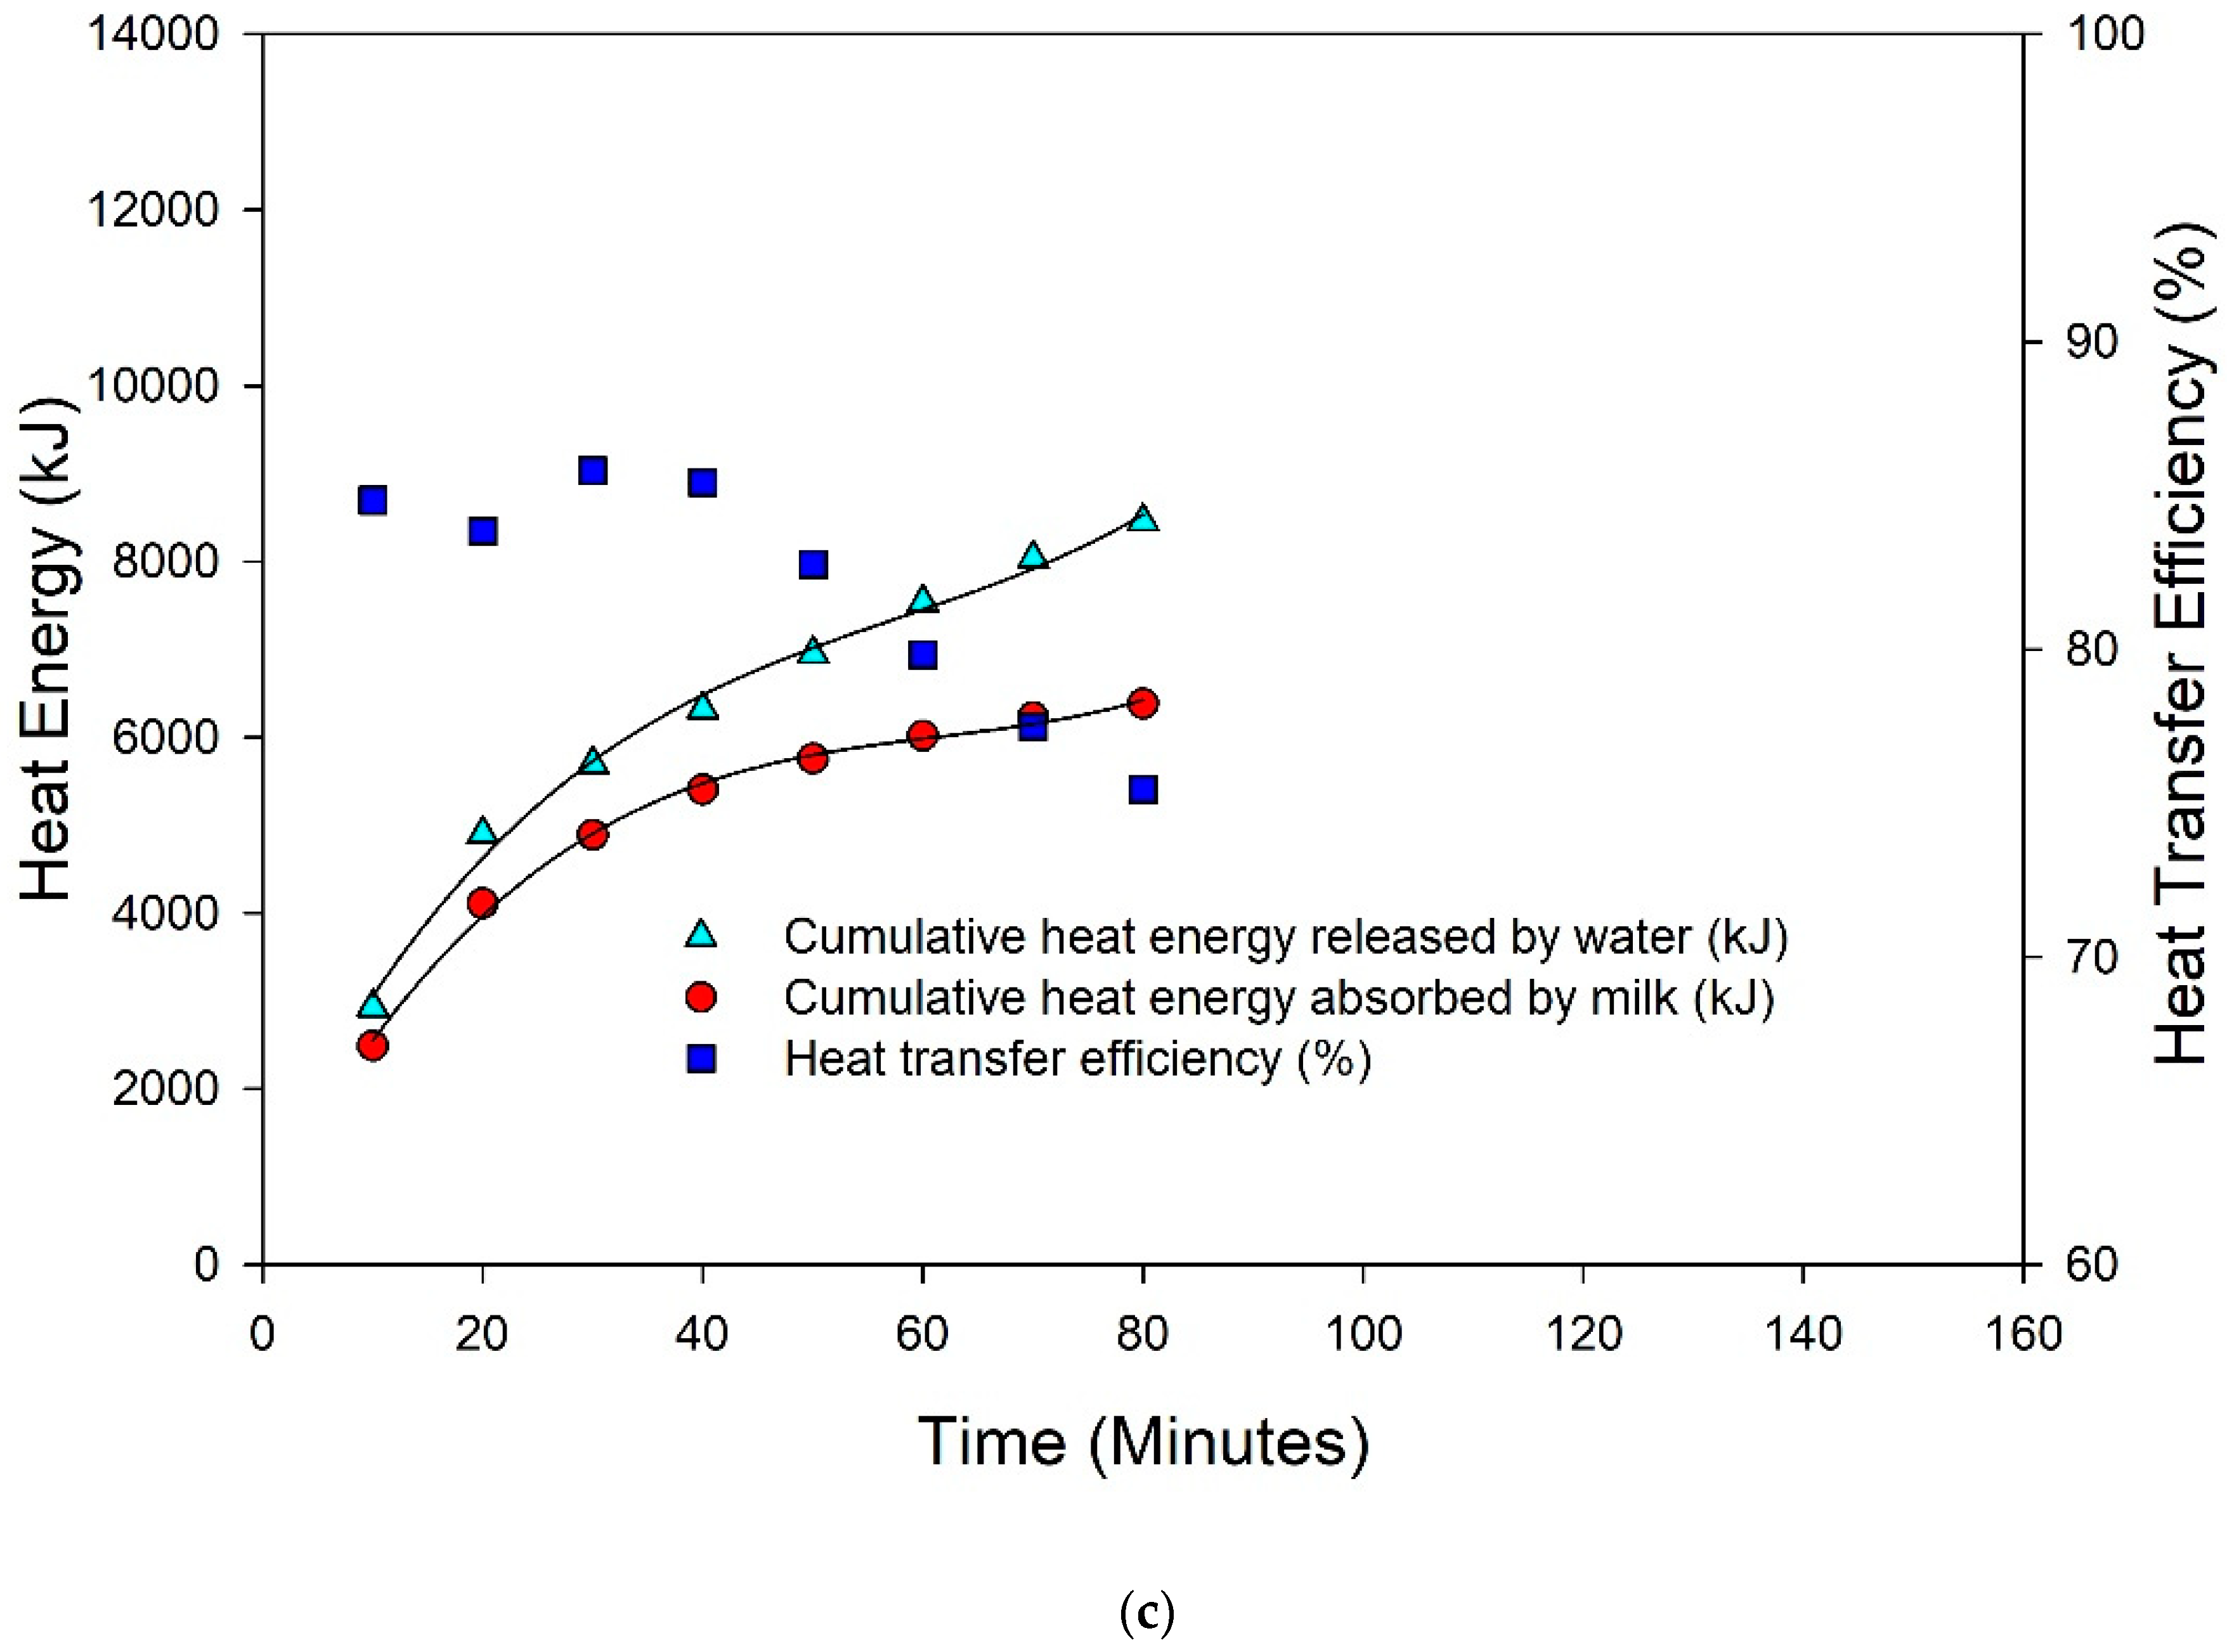
Figure 8.
Time required to cool down the temperature of heated milk of different capacities up to 43 °C using tap water.
Figure 8.
Time required to cool down the temperature of heated milk of different capacities up to 43 °C using tap water.
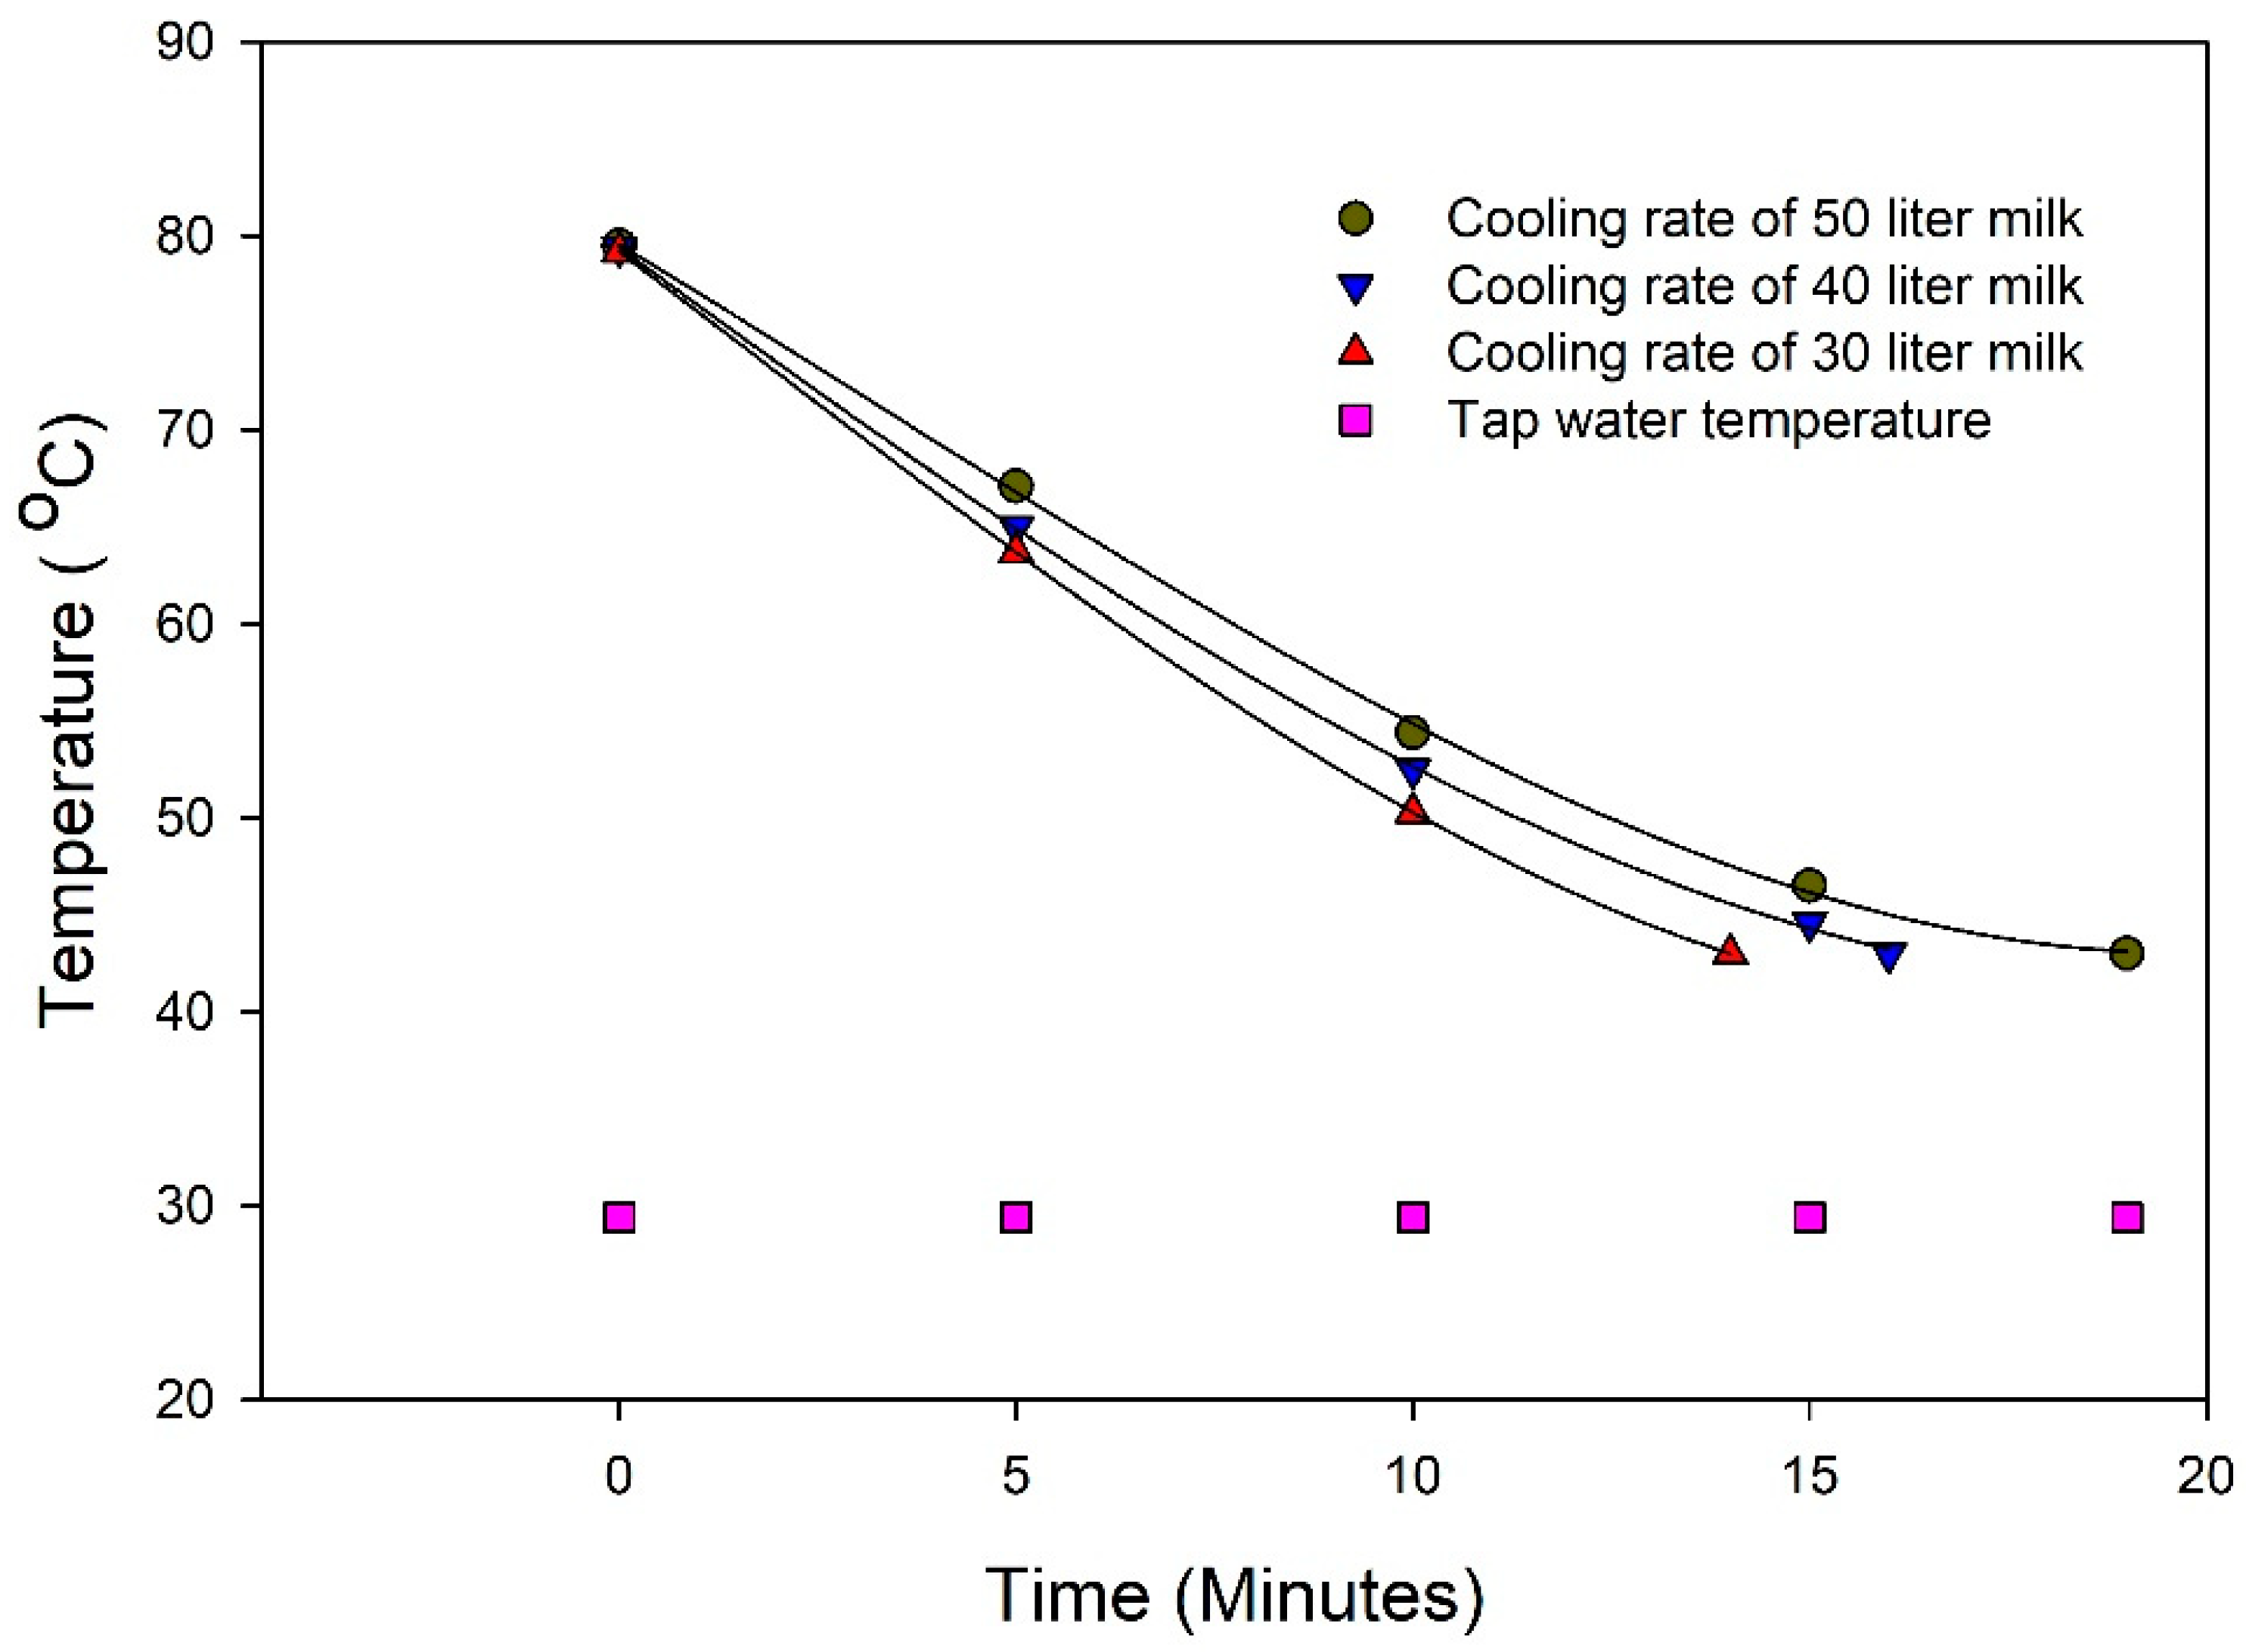
Figure 9.
Effect of stirrer speeds on cooling rates for different volumes of yogurt.
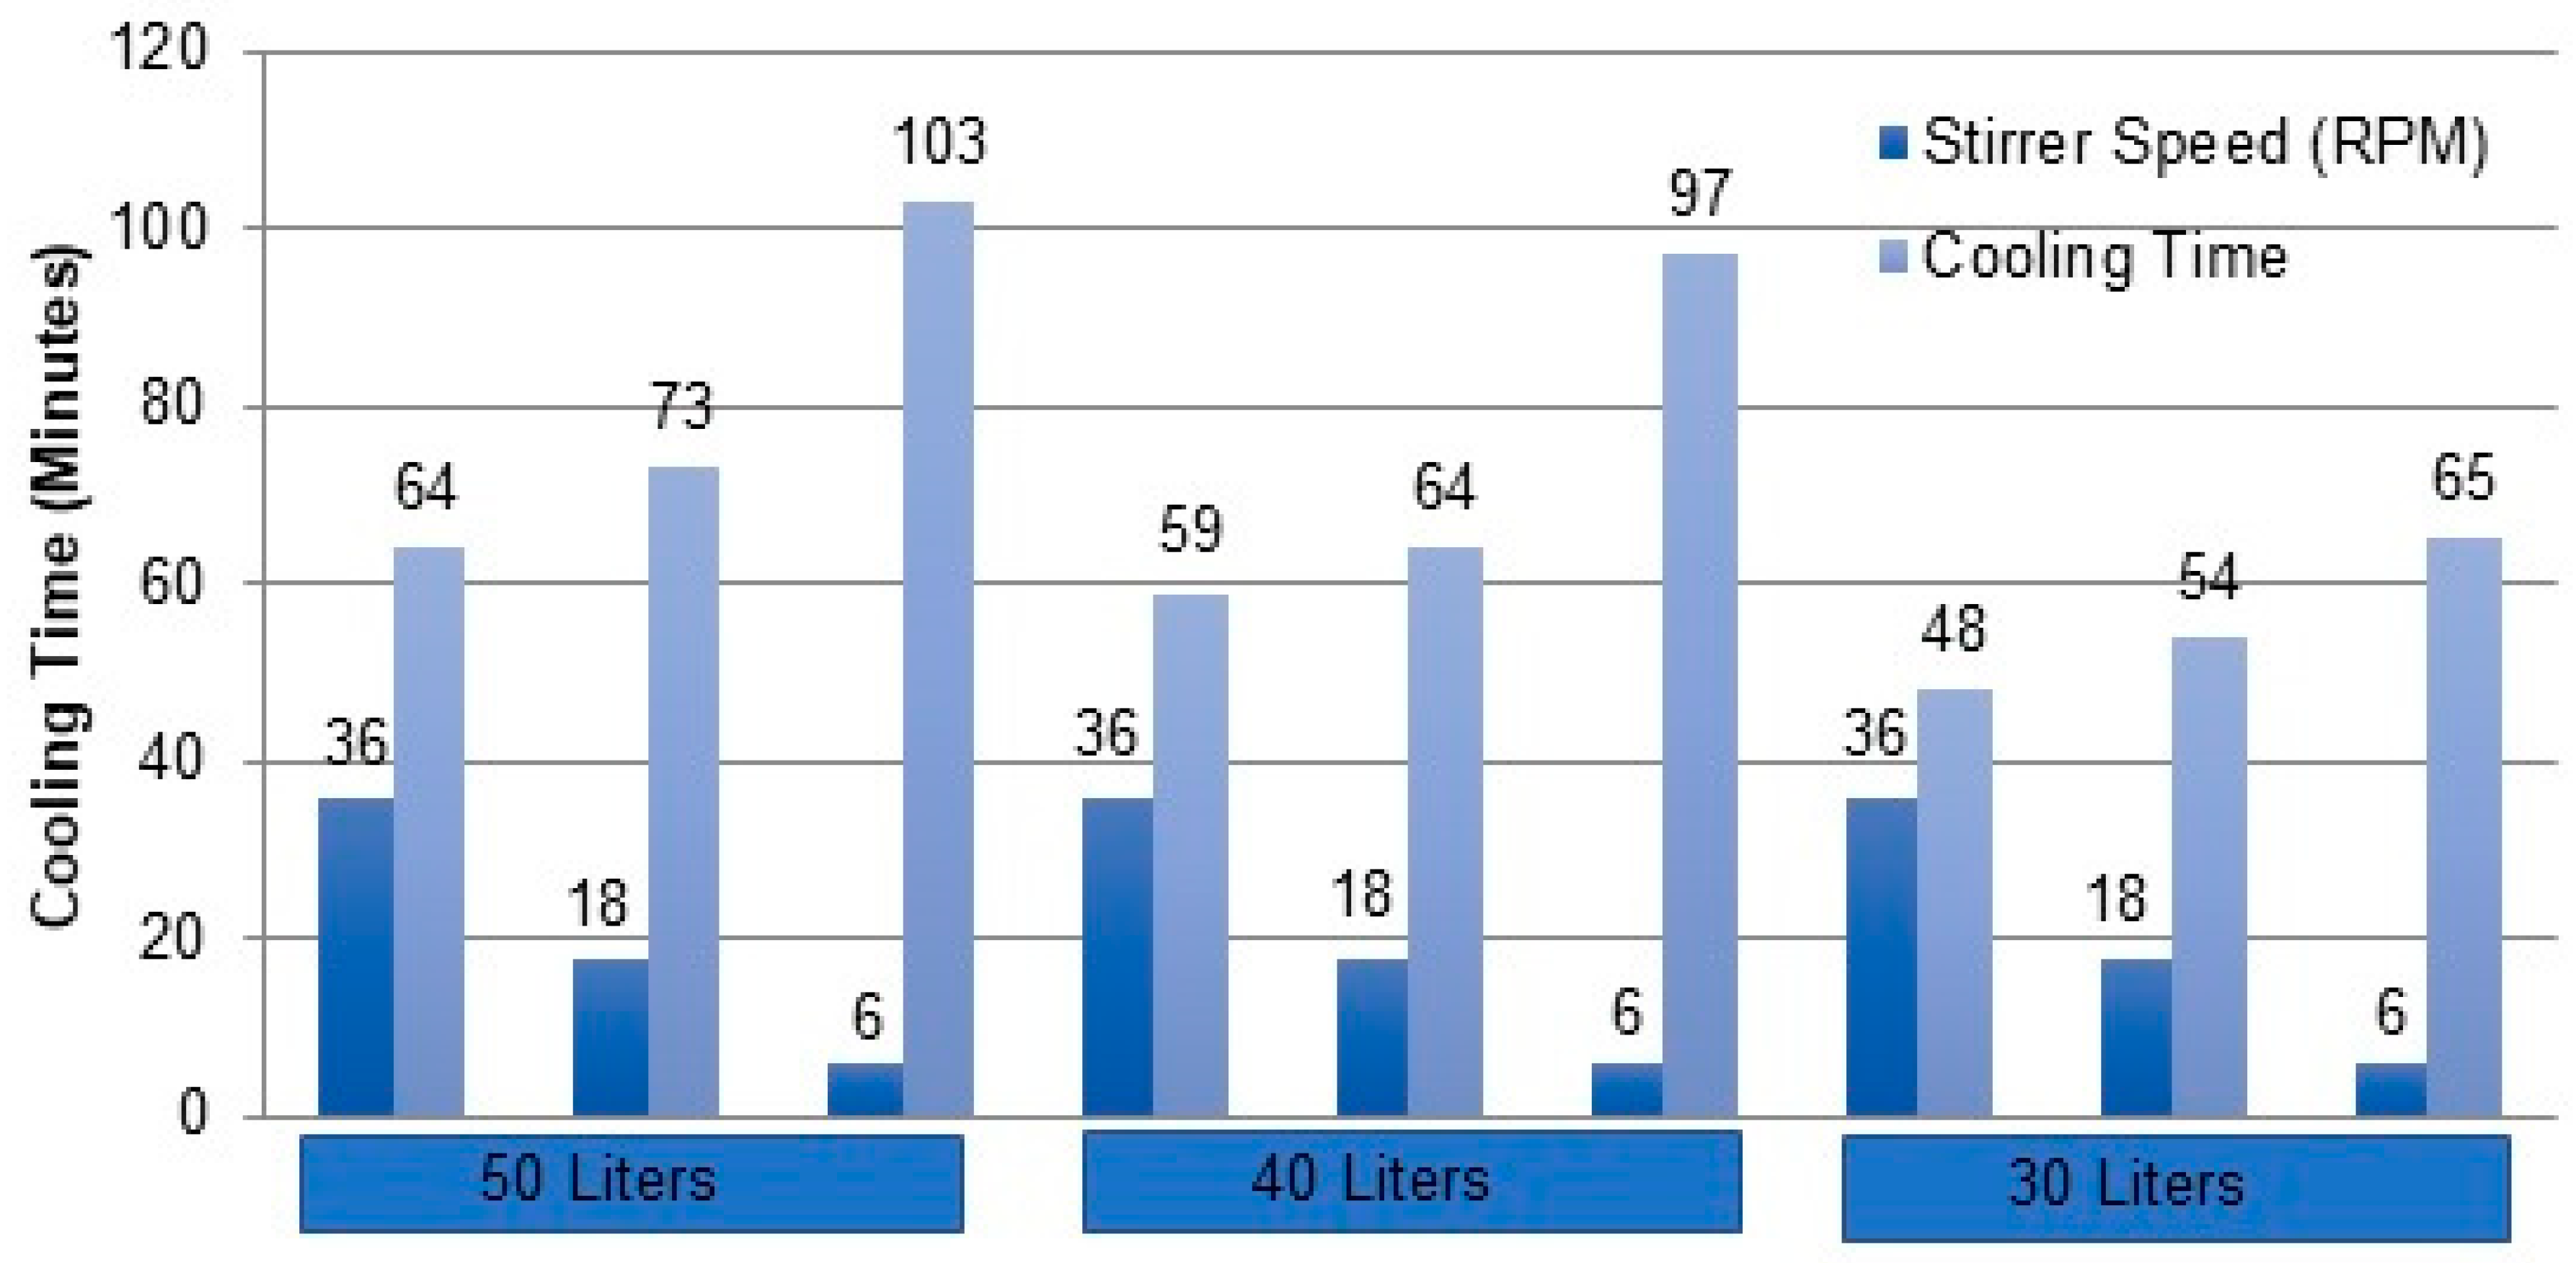
Figure 10.
Effect of stirring speed on the COP of the refrigeration unit for 50 L (a), 40 L (b) and 30 L (c) yogurt volumes.
Figure 10.
Effect of stirring speed on the COP of the refrigeration unit for 50 L (a), 40 L (b) and 30 L (c) yogurt volumes.
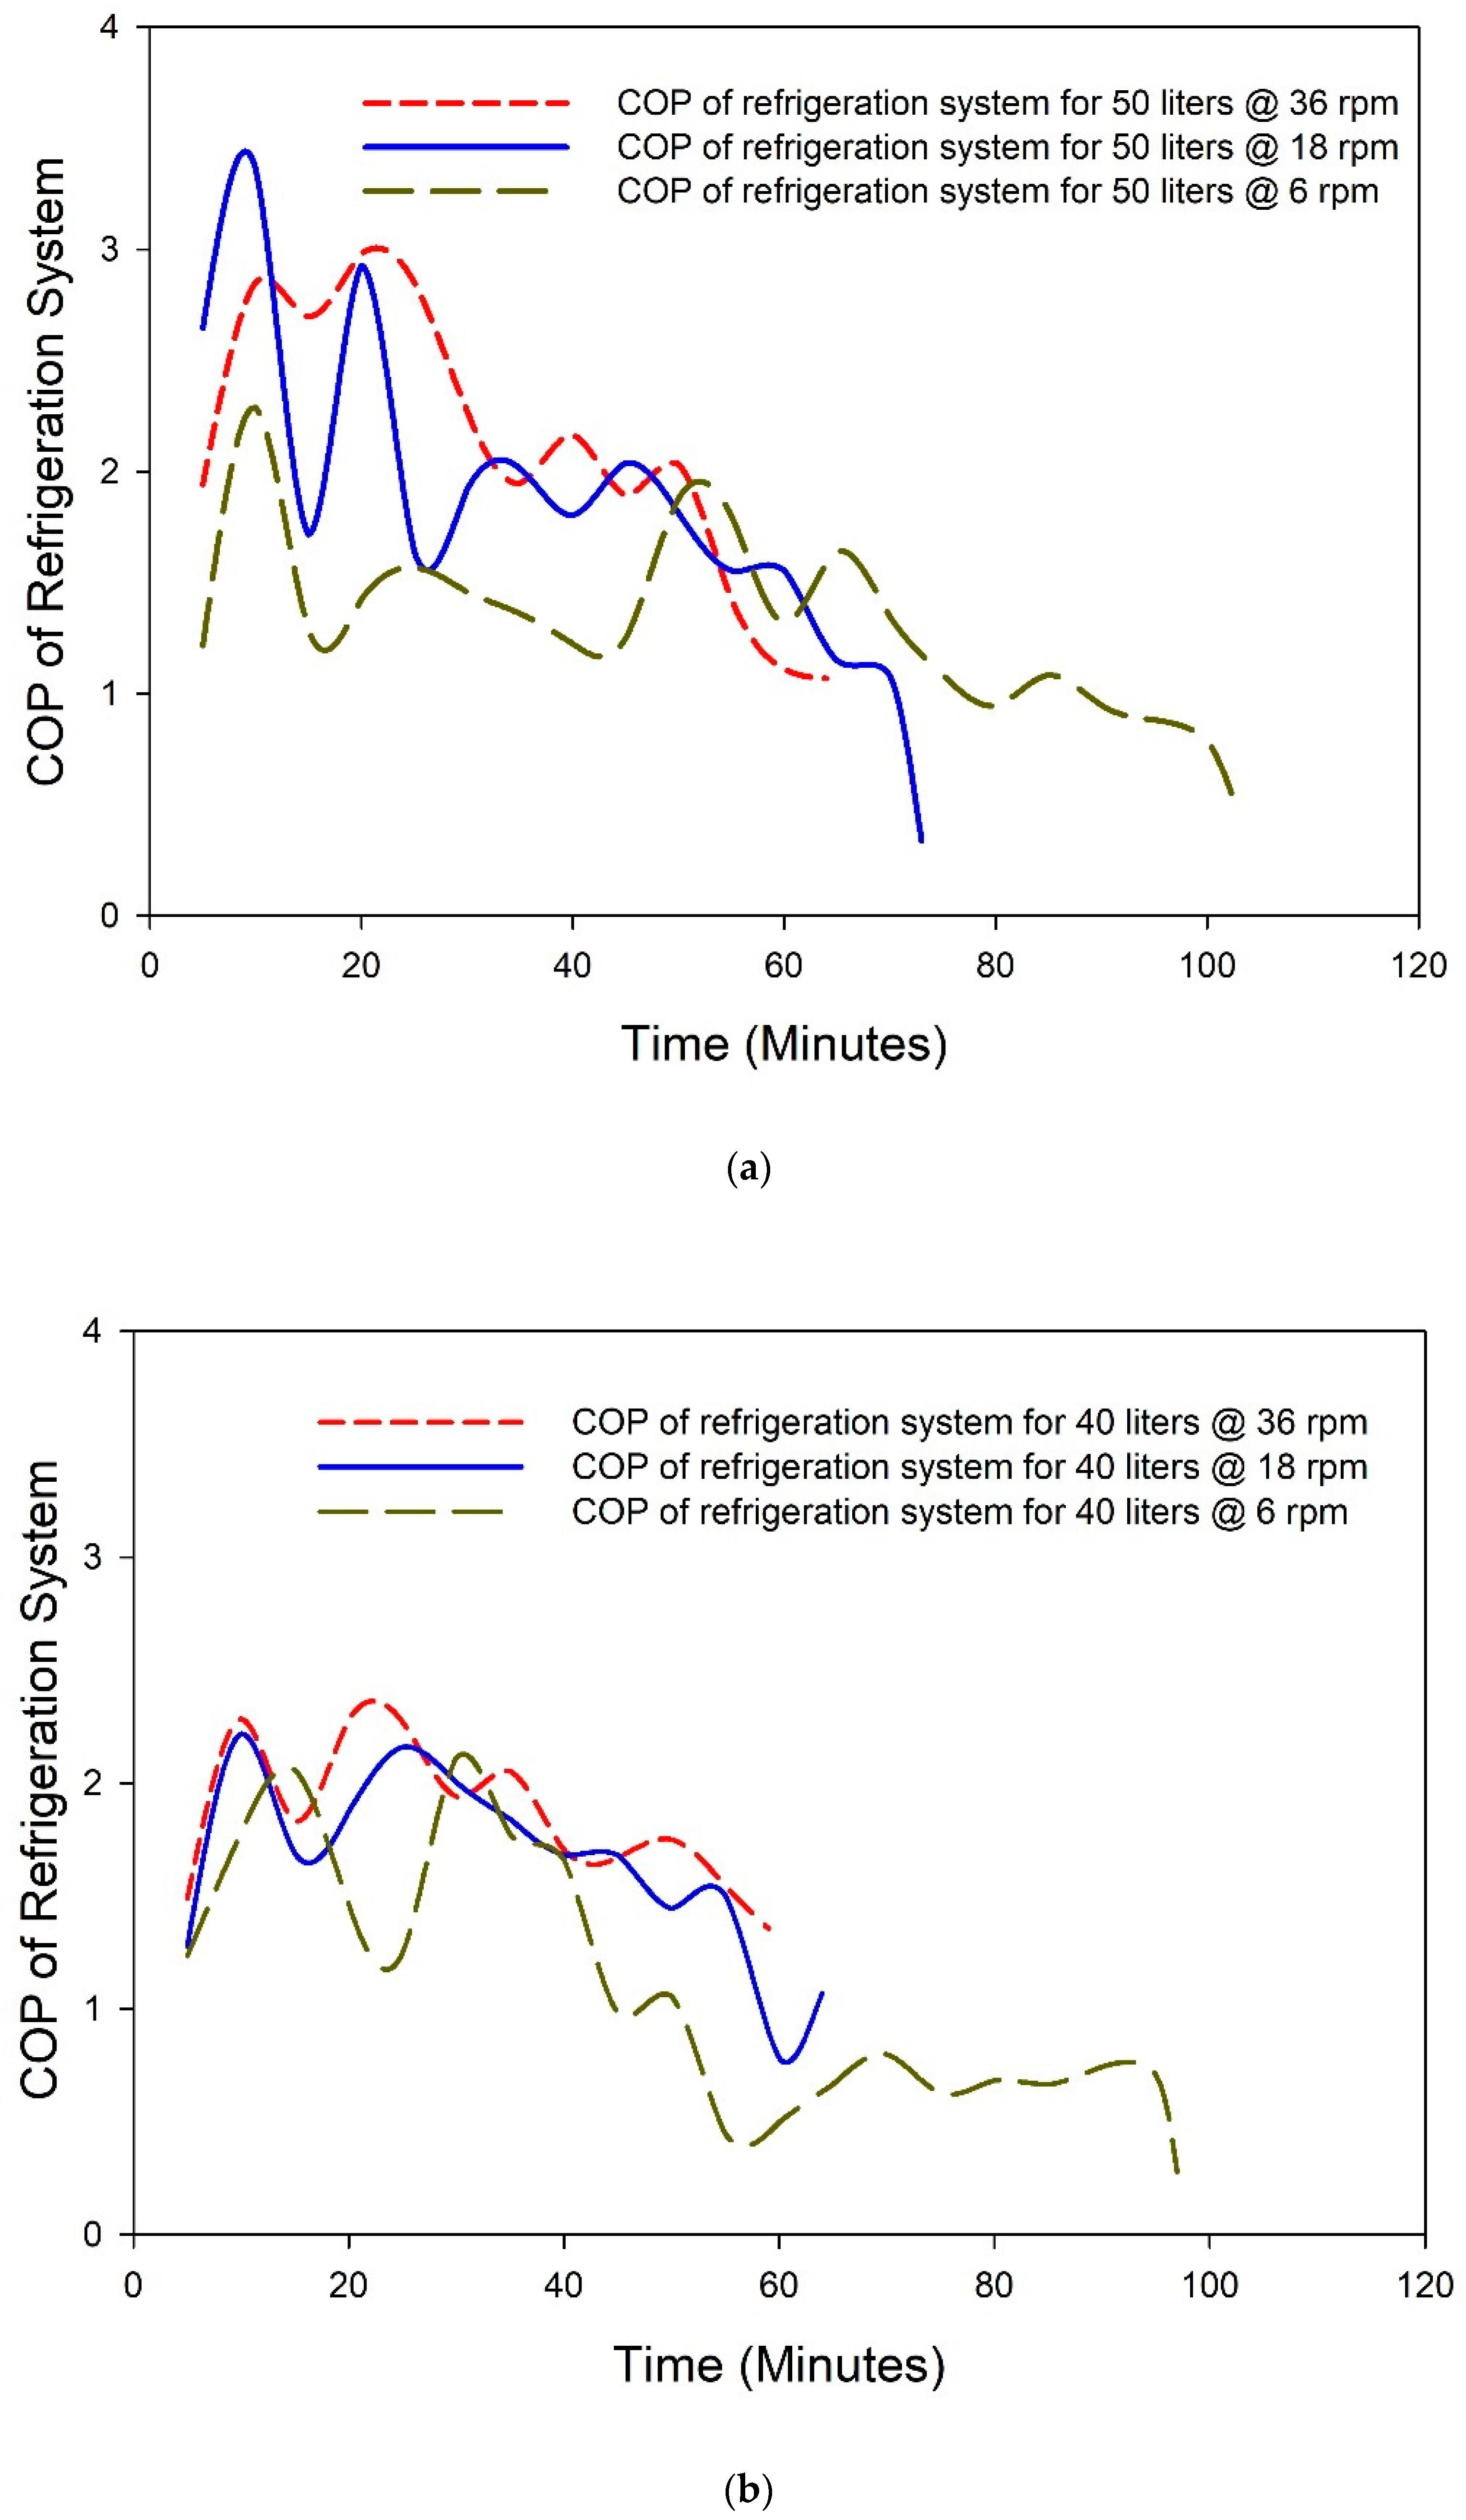
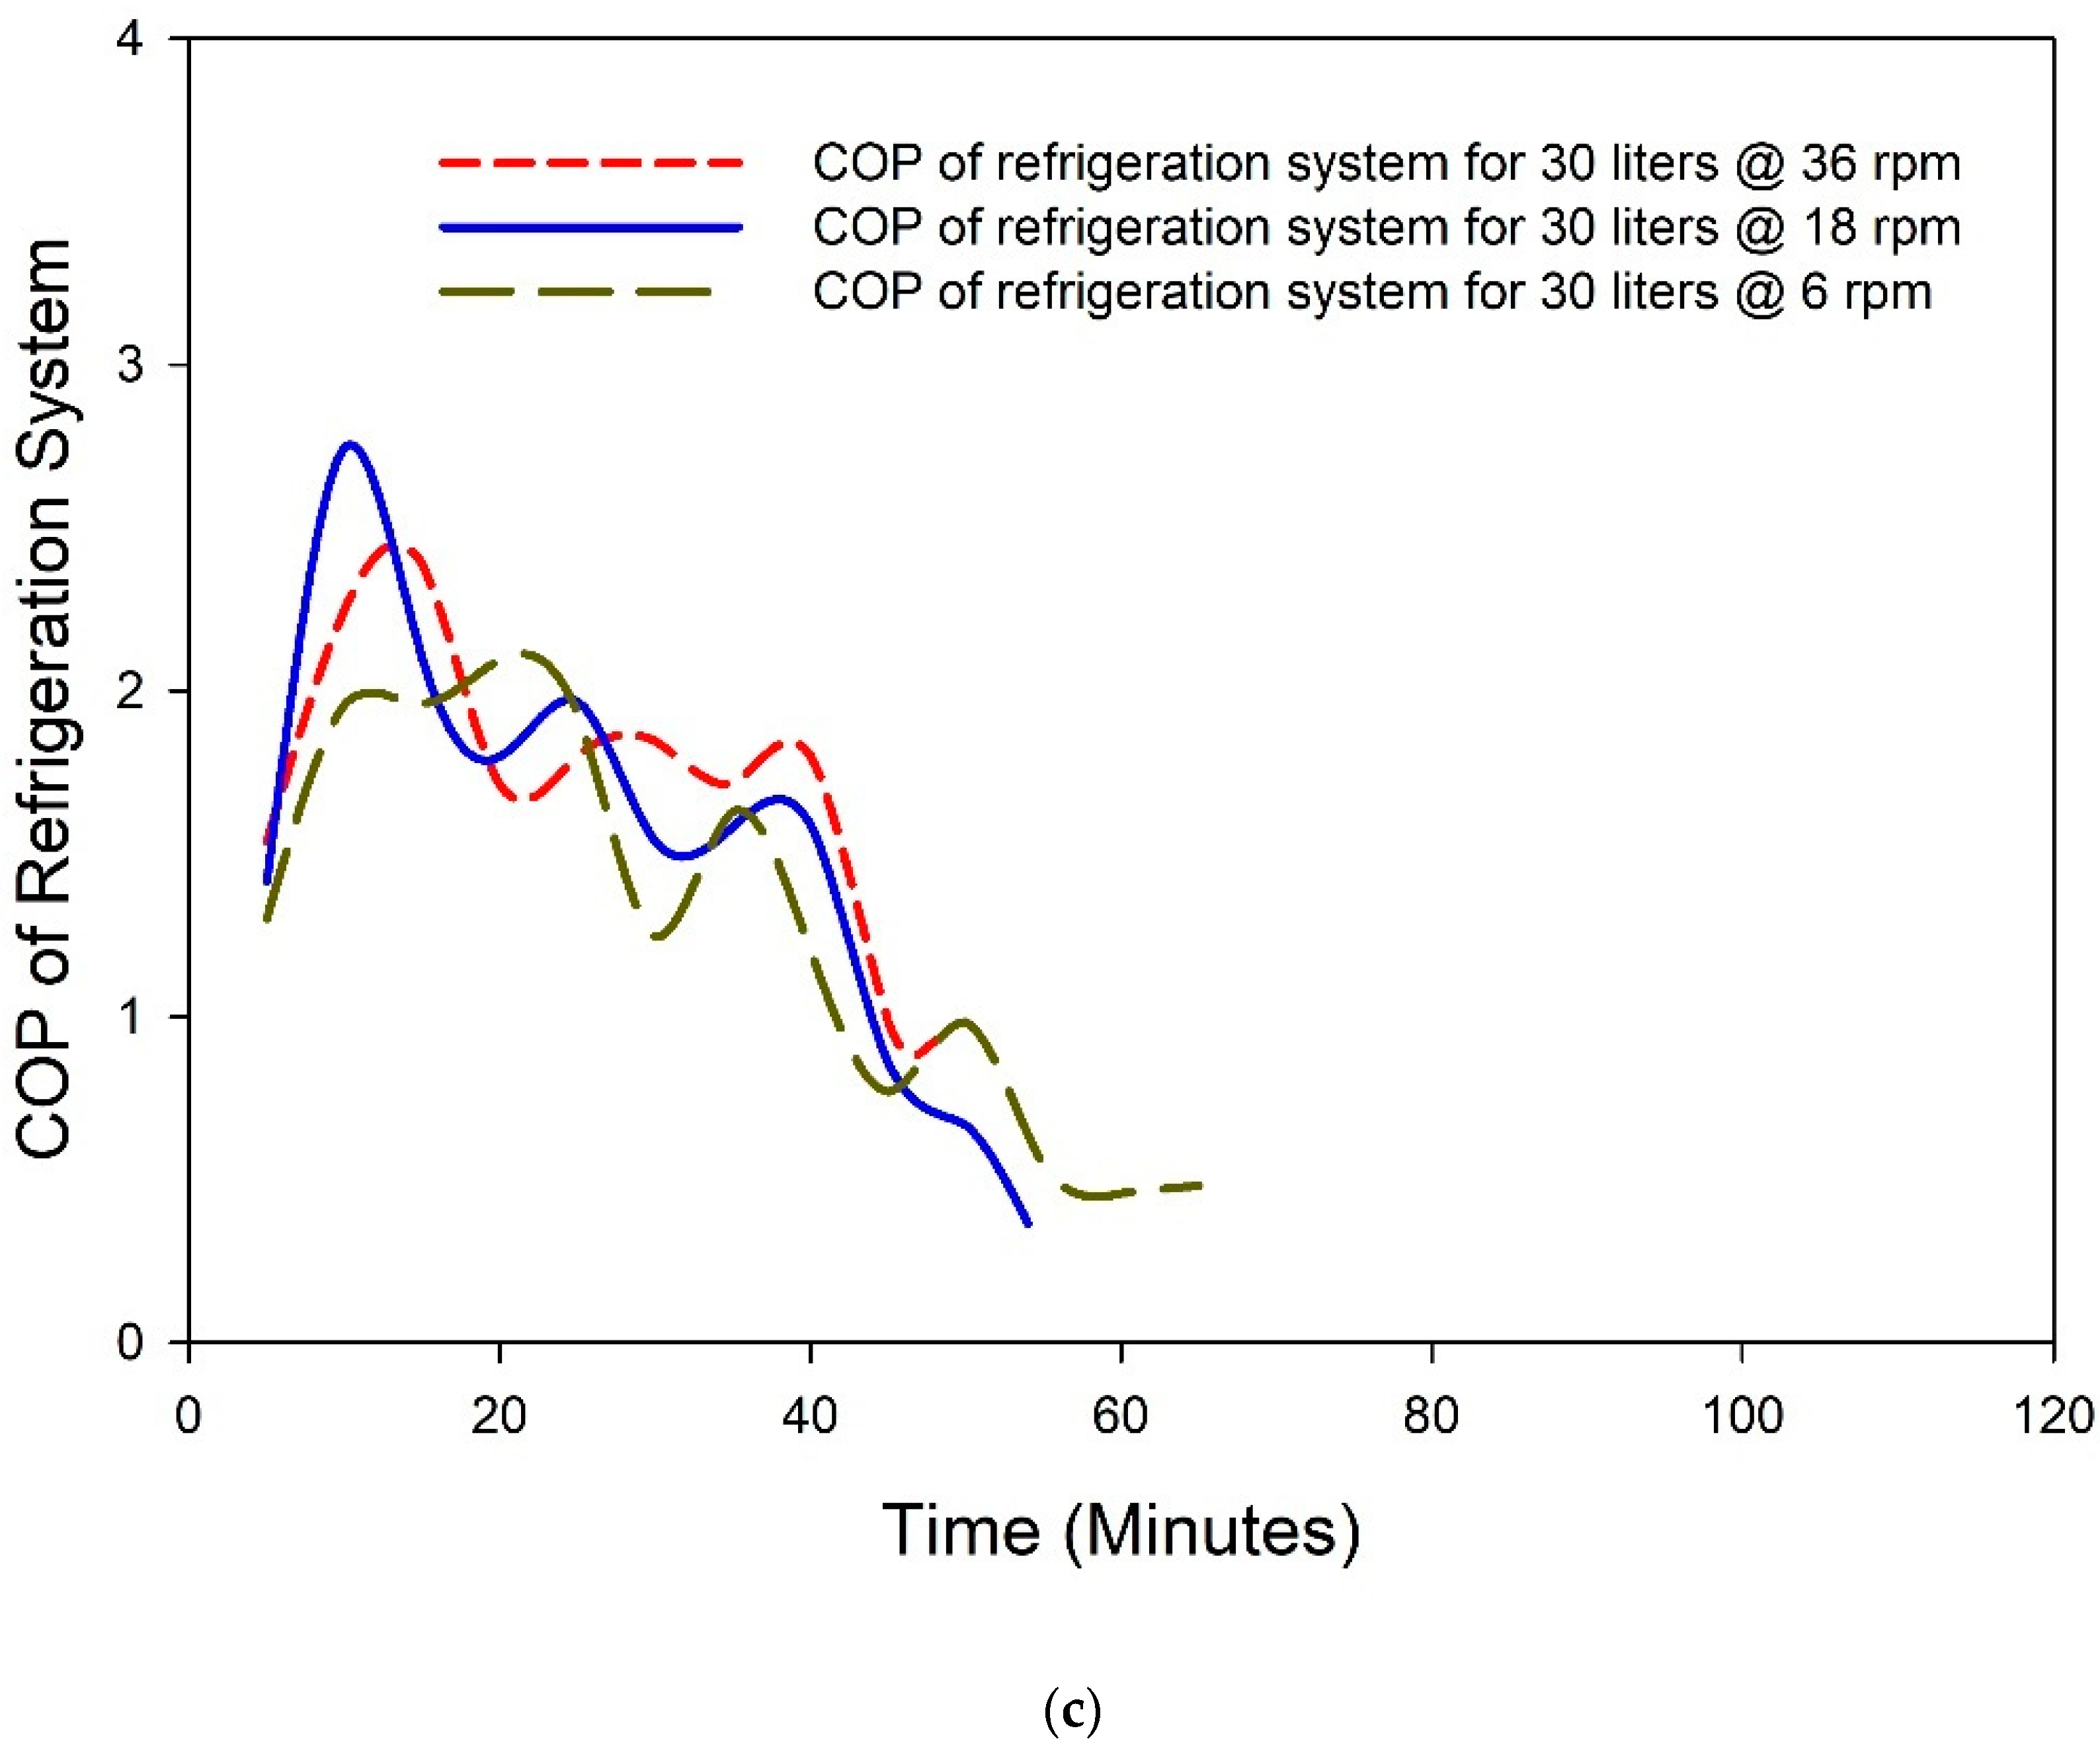
Figure 11.
Thermal profile of the yogurt-making process for 50 L (a), 40 L (b) and 30 L (c) yogurt under a constant stirrer speed of 18 rpm.
Figure 11.
Thermal profile of the yogurt-making process for 50 L (a), 40 L (b) and 30 L (c) yogurt under a constant stirrer speed of 18 rpm.
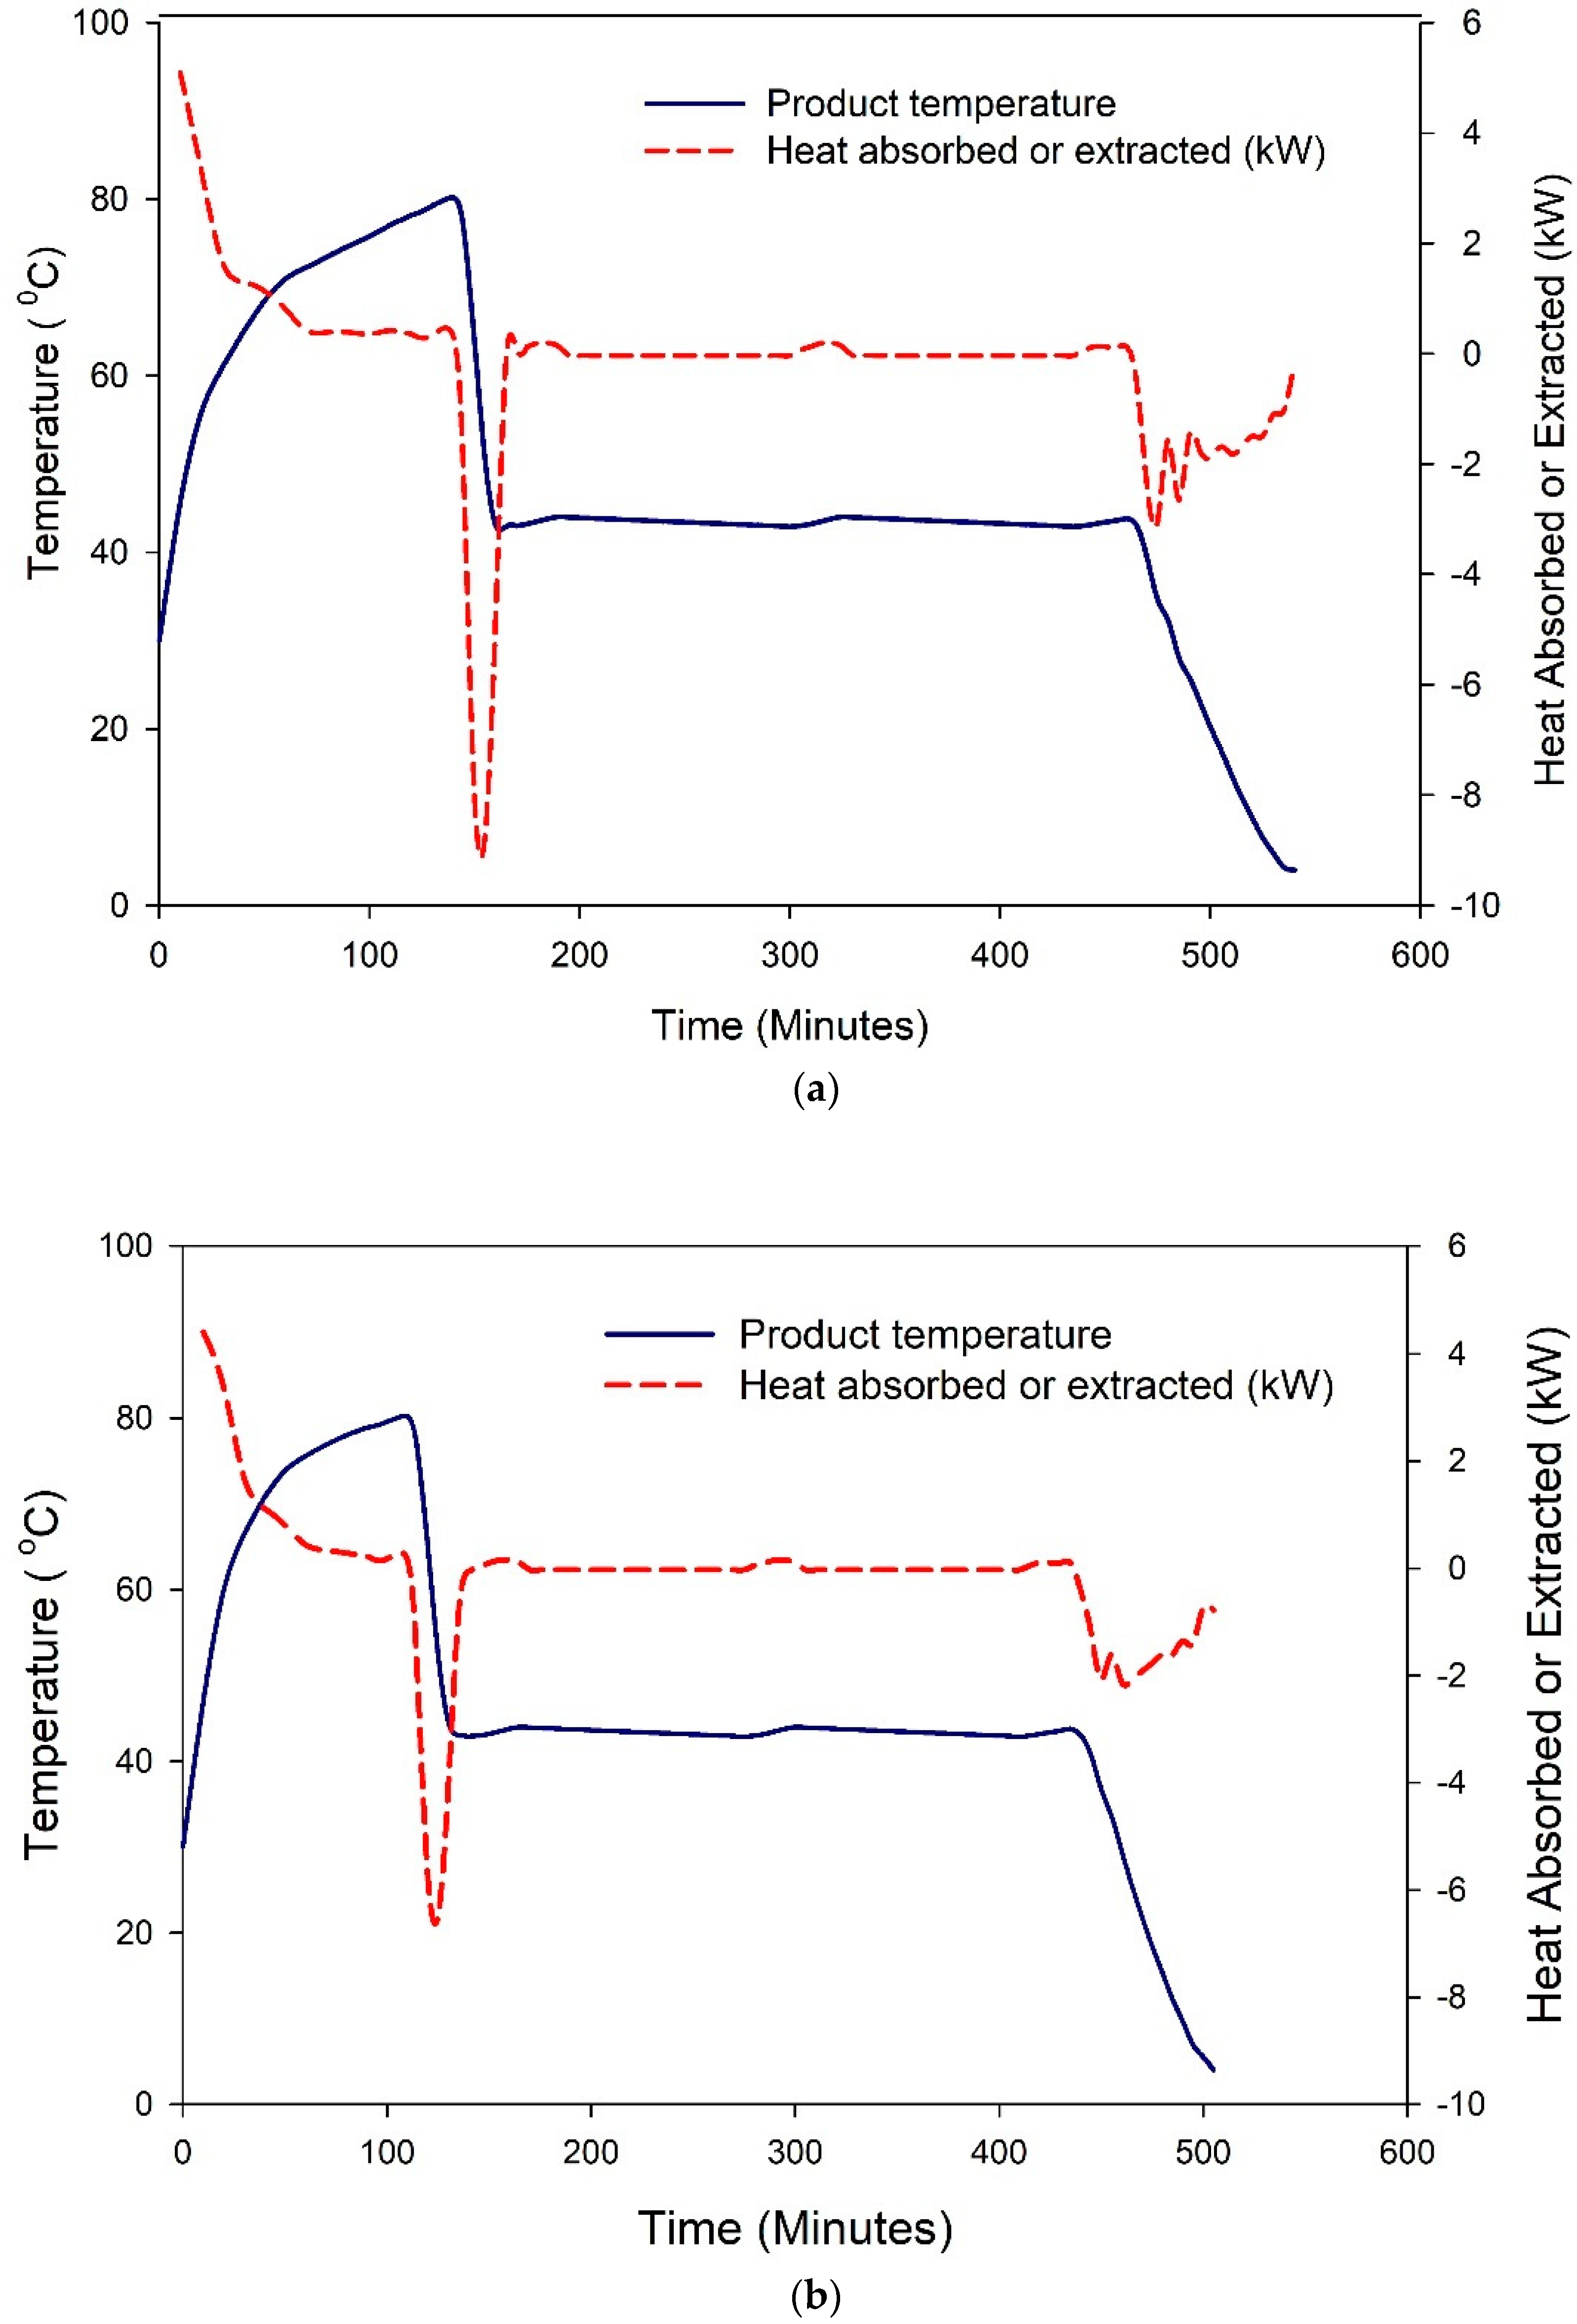
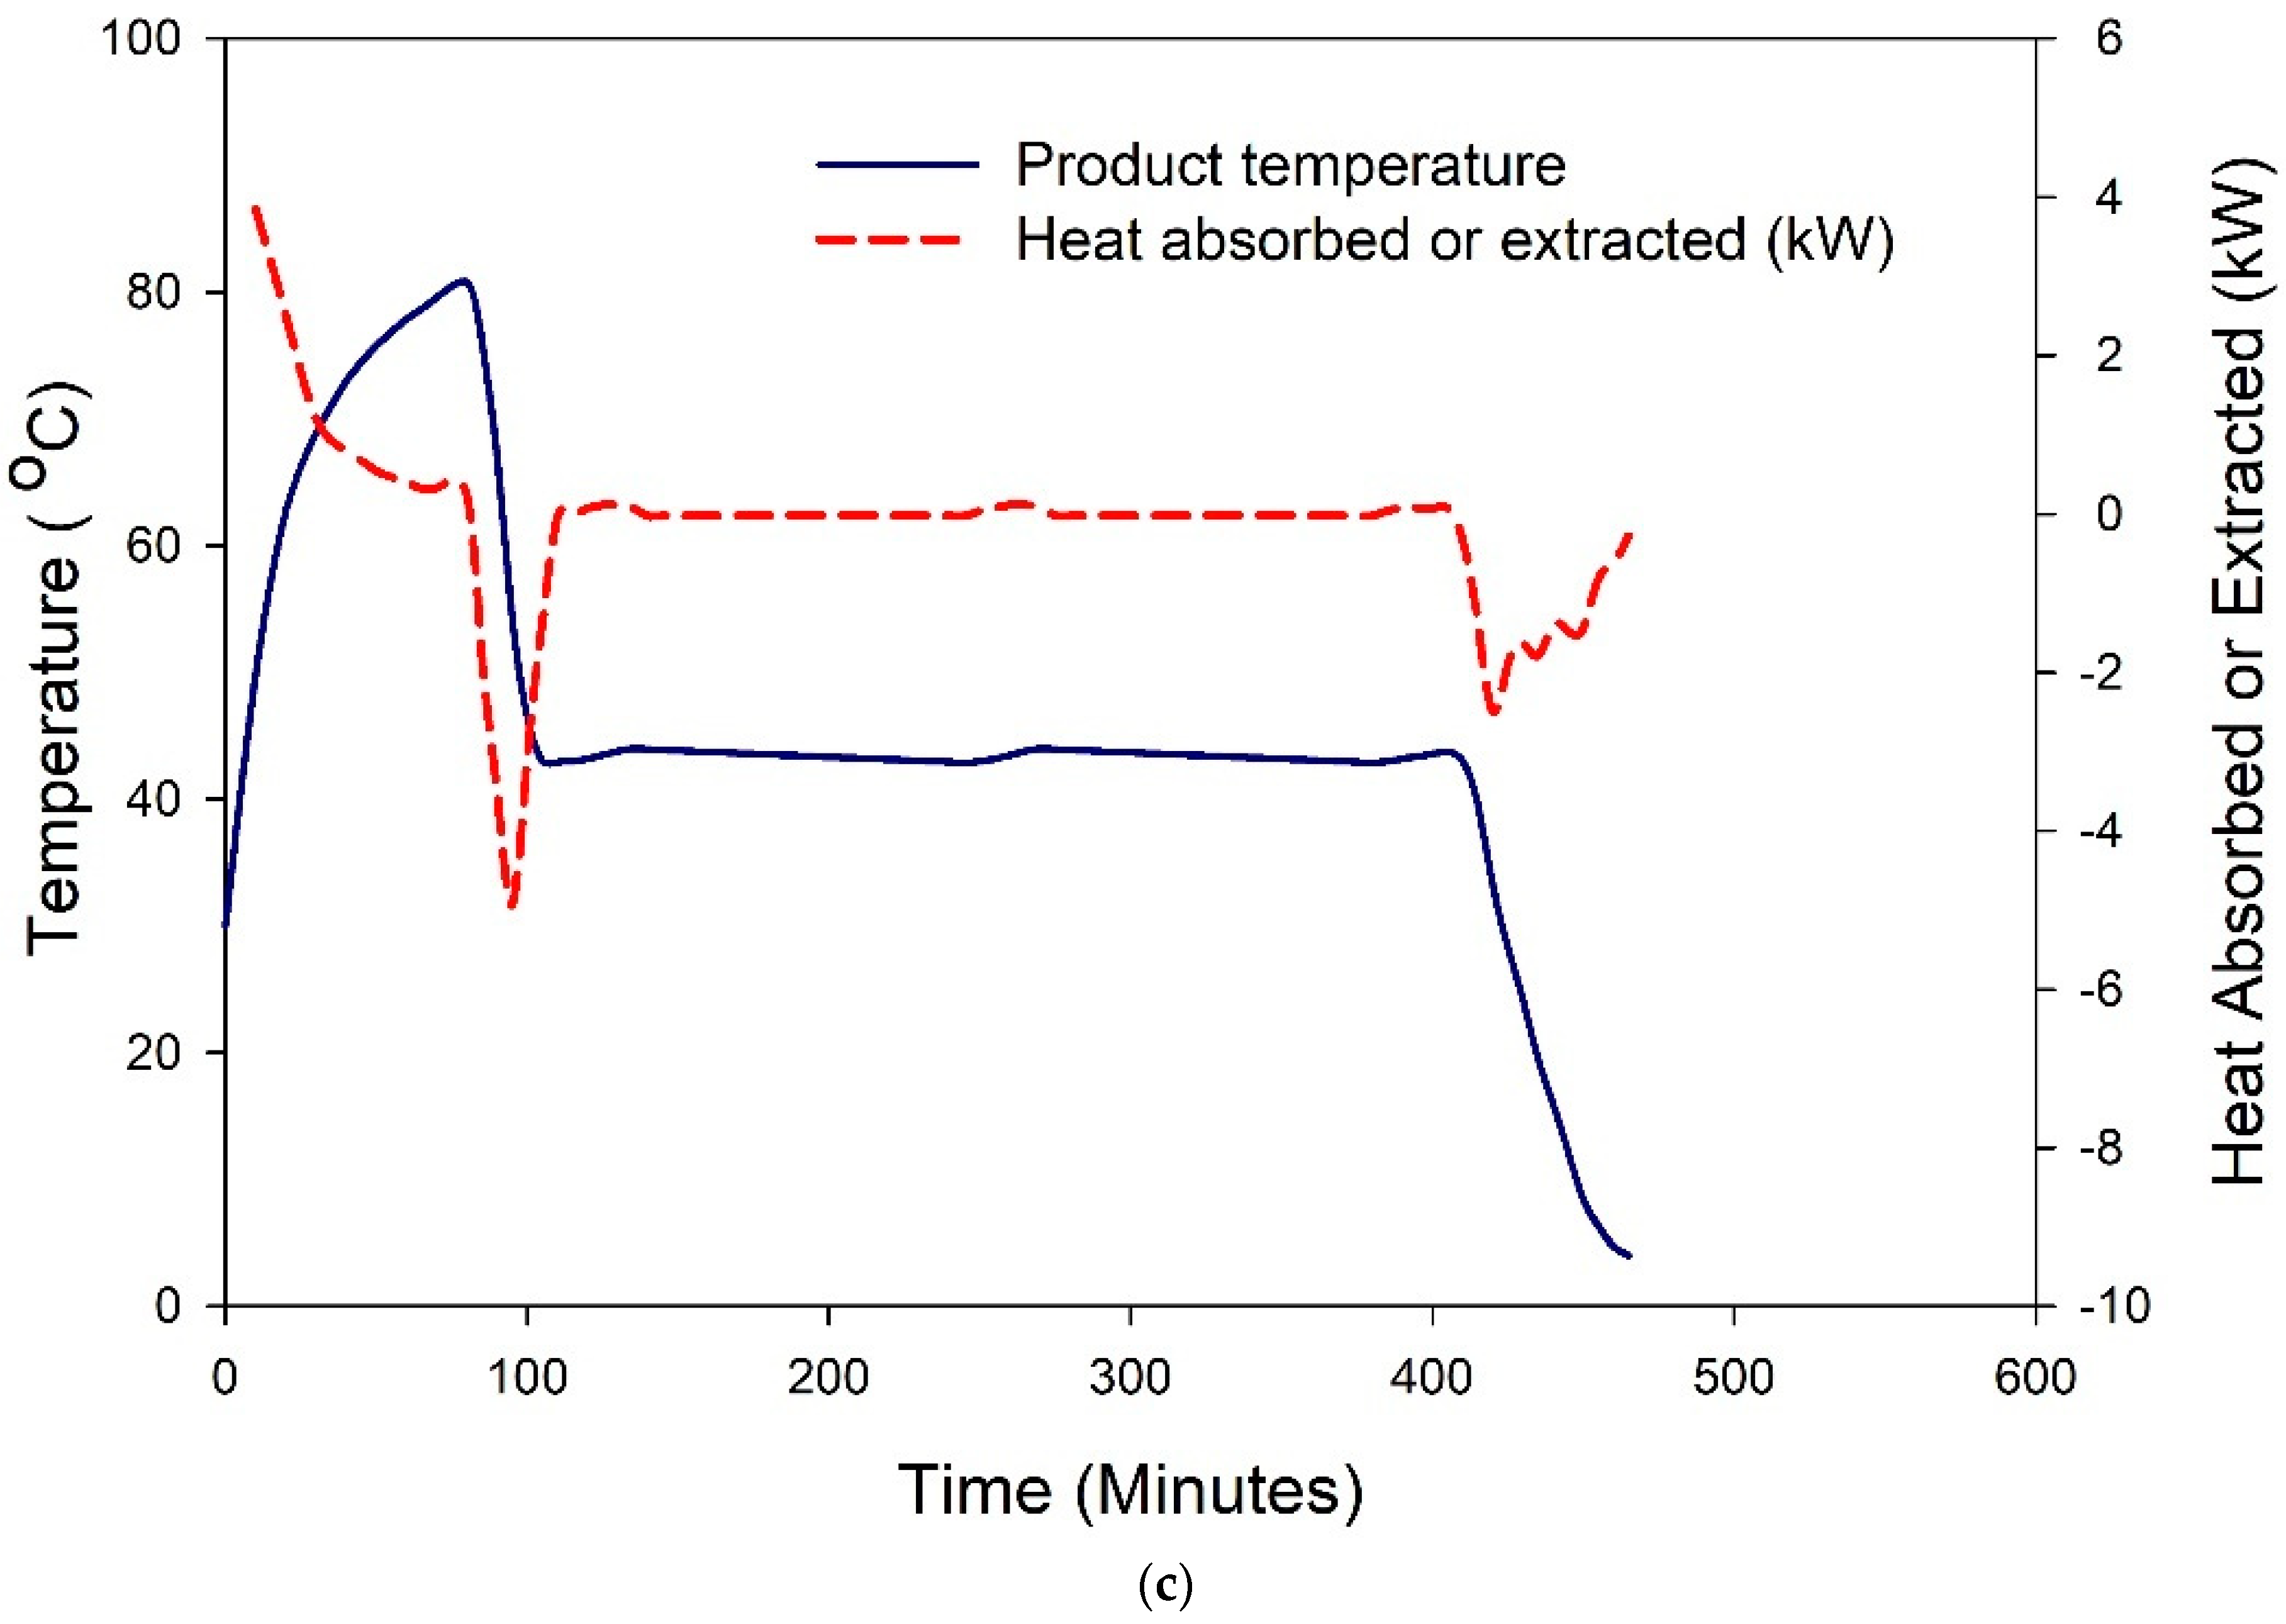
Figure 12.
Energy consumption pattern during the yogurt-making process under 50 (a), 40 (b) and 30 (c) L.
Figure 12.
Energy consumption pattern during the yogurt-making process under 50 (a), 40 (b) and 30 (c) L.

Table 1.
Datasheet and specification of PV modules, inverter and battery bank.
| Component of Solar PV System | Attributes | Rating | Unit |
|---|---|---|---|
| PV Module Model (TSPP-6U (60)-250W) | Power Output Tolerance | ±3.00 | % |
| Temperature Coefficient | −0.0047 | %/°C | |
| Open Circuit Voltage (Voc) at STC | 37.30 | V | |
| Short Circuit Current (Isc) at STC | 8.50 | A | |
| Peak Power Watts (Wp) at STC | 250.00 | W | |
| Maximum Power Voltage (Vmpp) at STC | 30.90 | V | |
| Maximum Power Current (Impp) at STC | 8.00 | A | |
| Efficiency of Module | 0.155 | % | |
| Dimension of solar panel | 1650 × 1000 × 40 | mm3 | |
| Inverter Model ((Premier-PW-24DC) | Maximum Input Current | 50.00 | A |
| Maximum input DC Voltage to controller | 60.00 | V | |
| Operated Voltage Range | 30–32 | V | |
| Output Voltage to battery | 24.00 | V | |
| Max. Power can be connected | 3.00 | kW | |
| Battery bank (Lithium-ion Battery) | Nominal Voltage | 12.00 | V |
| Nominal capacity | 150.00 | Ah | |
| Depth of discharge | 0.60 | ||
| Charging current | 100.00 | A | |
| Continuous discharging current | 100.00 | A | |
| Discharging working temperature | −20~60 °C | °C | |
| Charging working temperature | 0–45 | °C | |
| Dimensions | 479 × 482 × 132 | mm3 | |
| Efficiency of battery | 0.95 | % | |
| Cell combination | 36,130,170 8S2P + Smart BMS |
Table 2.
The parameters of fitted models (polynomial cubic) for the investigated parameters.
| Parameter | Milk Quantity | Y0 | A | b | C | R2 |
|---|---|---|---|---|---|---|
| Storage tank temperature | 50 | 87.7742 | −0.7063 | 0.0104 | −0.000040523 | 0.8903 |
| 40 | 89.2370 | −0.8957 | 0.0167 | −0.000082776 | 0.9315 | |
| 30 | 90.1101 | −0.9468 | 0.0208 | −0.0001 | 0.9907 | |
| Milk temperature | 50 | 32.5390 | 1.2812 | −0.0133 | 0.000047356 | 0.9905 |
| 40 | 31.0960 | 1.7573 | −0.0225 | 0.000096685 | 0.9957 | |
| 30 | 30.6020 | 2.1874 | −0.0358 | 0.0002 | 0.9978 | |
| Heating rate of circulating water (kW) | 50 | −9.7531 | 0.3859 | −0.0044 | 0.000015318 | 0.9648 |
| 40 | −10.3078 | 0.4659 | −0.0060 | 0.000024359 | 0.9377 | |
| 30 | −8.1497 | 0.3307 | −0.0033 | 0.0000059915 | 0.9672 | |
| Heating rate of milk (kW) | 50 | 7.1966 | −0.2242 | 0.0024 | −0.0000081955 | 0.9751 |
| 40 | 6.9267 | −0.2331 | 0.0027 | −0.000010638 | 0.9896 | |
| 30 | 6.5691 | −0.2777 | 0.0042 | −0.000021992 | 0.9956 | |
| Net heating rate effect | 50 | −2.5565 | 0.1617 | −0.0020 | 0.0000071226 | 0.7301 |
| 40 | −3.3811 | 0.2328 | −0.0033 | 0.000013721 | 0.7165 | |
| 30 | −1.5806 | 0.0530 | 0.0010 | −0.000016001 | 0.8302 | |
| Cumulative heat released by water (kJ) | 50 | 2577.6611 | 189.5369 | −1.7670 | 0.0063 | 0.9830 |
| 40 | 1312.5611 | 254.9214 | −2.6405 | 0.0104 | 0.9943 | |
| 30 | 888.2421 | 250.5796 | −3.5952 | 0.0207 | 0.9936 | |
| Cumulative heat absorbed by milk | 50 | 1624.8781 | 212.2518 | −2.0089 | 0.0068 | 0.9950 |
| 40 | 759.2427 | 257.3700 | −3.1228 | 0.0129 | 0.9939 | |
| 30 | 534.7397 | 235.4172 | −3.5727 | 0.0194 | 0.9967 | |
| Cooling rate of milk | 50 | 79.5733 | −2.4785 | −0.0311 | 0.0032 | 0.9995 |
| 40 | 79.4196 | −3.0165 | 0.0122 | 0.0022 | 0.9998 | |
| 30 | 79.2000 | −3.1207 | −0.0148 | 0.0038 | 1.0000 |
Publisher’s Note: MDPI stays neutral with regard to jurisdictional claims in published maps and institutional affiliations. |
© 2022 by the authors. Licensee MDPI, Basel, Switzerland. This article is an open access article distributed under the terms and conditions of the Creative Commons Attribution (CC BY) license (https://creativecommons.org/licenses/by/4.0/).
Share and Cite
MDPI and ACS Style
Husnain, S.N.; Amjad, W.; Munir, A.; Hensel, O. Development and Experimental Study of Smart Solar Assisted Yogurt Processing Unit for Decentralized Dairy Value Chain. Sustainability 2022, 14, 4285. https://doi.org/10.3390/su14074285
AMA Style
Husnain SN, Amjad W, Munir A, Hensel O. Development and Experimental Study of Smart Solar Assisted Yogurt Processing Unit for Decentralized Dairy Value Chain. Sustainability. 2022; 14(7):4285. https://doi.org/10.3390/su14074285
Chicago/Turabian StyleHusnain, Syed Nabeel, Waseem Amjad, Anjum Munir, and Oliver Hensel. 2022. "Development and Experimental Study of Smart Solar Assisted Yogurt Processing Unit for Decentralized Dairy Value Chain" Sustainability 14, no. 7: 4285. https://doi.org/10.3390/su14074285
Note that from the first issue of 2016, this journal uses article numbers instead of page numbers. See further details here.