
A Novel Multi-Criteria Assessment Approach for Post-COVID-19 Production Strategies in Vietnam Manufacturing Industry: OPA–Fuzzy EDAS Model


1
Department of Industrial Systems Engineering, Faculty of Mechanical Engineering, Ho Chi Minh City University of Technology and Education, Ho Chi Minh City 71307, Vietnam
2
Department of Industrial Engineering and Management, National Kaohsiung University of Science and Technology, Kaohsiung 807778, Taiwan
*
Authors to whom correspondence should be addressed.
Sustainability 2022, 14(8), 4732; https://doi.org/10.3390/su14084732
Submission received: 17 February 2022
/
Revised: 1 April 2022
/
Accepted: 11 April 2022
/
Published: 14 April 2022
(This article belongs to the Special Issue Decision-Making Approaches to Support the Sustainability of Supply Chain System in Pandemic Disruptions)
Abstract
:The global manufacturing supply chain has been disrupted by the negative impacts of the pandemic. In Southeast Asia, Vietnam’s manufacturing industry is one of the most strongly integrated with global and regional supply chains. The production strategies in the “new normal” are the key solution to the survival and sustainable development of manufacturers. This study aims to develop a two-stage framework to investigate the impacts of COVID-19 and the post-COVID-19 production strategies for Vietnam’s manufacturing industry. As a theoretical contribution, this study proposes a novel and robust integration approach, which combines the Ordinal Priority Approach (OPA) and Fuzzy Evaluation Based on Distance from Average Solution (Fuzzy EDAS), for the first time. The negative impacts of the pandemic were identified and weighted by the OPA method. Then, production strategies were comprehensively evaluated using the Fuzzy EDAS method. Findings indicate that digitization and on-site renewable energy are the most essential recovery strategies for manufacturing in Vietnam. These findings are validated by comparisons with the results of recent multiple criteria decision-making (MCDM) methods. Furthermore, weight sensitivity analysis reveals different suitability of strategies for short-term and long-term negative impacts. As a managerial implication, the multi-scenario ranking results help managers to make resource-allocation decisions for the implementation of post-COVID-19 production strategies.
1. Introduction
The global spread of the COVID-19 pandemic has caused negative impacts on the global manufacturing supply chain. The obvious signs are that stock market’s values have fallen to negative levels while food prices have risen rapidly [1]. In addition, the COVID-19 pandemic has resulted in both supply and demand shocks in the global oil market. As a result, the volatility of oil prices has increased to high levels [2]. Severe economic downturn has occurred in all types of businesses. Even for countries with strong economies, such as the UK, the quarantine period is estimated to have reduced their GDP by around 3.0% [3]. According to the World Bank, forecasts are concerned that global gross domestic product (GDP) will shrink by 2.1%. In developing countries, GDP will decrease by 2.5%, and in developed countries, GDP will decrease by 1.9% [4]. Consequently, the crisis has caused numerous manufacturers to be disbanded or closed. According to statistics, production capacity has even halved in Europe (50%) and China (53%) [5]. In Southeast Asia, Vietnam is among the top countries that are heavily integrated with regional supply chains, especially with China. Therefore, Vietnam’s production is also greatly affected by the decrease in demand and shortage of raw materials because of the pandemic [6]. The post-COVID-19 phase aims to boost the economy and transform production systems and supply chains towards more sustainability. Therefore, the formation of strategies and operational policies to overcome losses in production is extremely urgent and important [7]. However, analyses of the effects of the pandemic and assessment of appropriate production recovery strategies for the post-COVID-19 era are still lacking in the case of Vietnam and Southeast Asia. The work presented in this paper is motivated by this fact.
This study aims to develop a two-stage framework to investigate the COVID-19 impacts and the production strategies to deal with it. The objective of the first stage is to analyze the negative effects of the pandemic. Based on relevant studies and expert surveys, the negative impacts of the pandemic on Vietnam’s production were determined. Using the Ordinal Priority Approach (OPA), the importance of negative impacts is determined in terms of weights. Thereafter, the mitigating ability of the potential post-COVID-19 production strategies was determined using the Fuzzy Evaluation Based on Distance from Average Solution (EDAS) procedures. As a first contribution, the results of this study provide useful references for manufacturers to recover and move forward after the pandemic. The second contribution, which is also the remarkable novelty of this study, is that for the first time, the OPA-Fuzzy EDAS integrated approach has been proposed for Multiple Criteria Decision Making (MCDM) problems. The OPA method uses ordinal judgments instead of pairwise comparisons. At the same time, OPA’s calculations are based on a foundation of linear programming that allows performing analyses without a normalized procedure and completeness of the data.
This study is organized as follows: It begins with the motivations, research objectives, contributions, and novelties in Section 1. In Section 2, a systematic review of relevant studies is conducted and discussed. The proposed methodology and its numerical results for the manufacturing industry in Vietnam are presented in Section 3 and Section 4, respectively. Finally, conclusions are presented to close this article.
2. Related Works
Due to the severe negative consequences for the global supply chain, the impacts of the pandemic and mitigation strategies have become an emerging and exciting topic for researchers [8]. By analyzing the impacts of the pandemic, Kumar et al. pointed out difficulties in the production field as well as research directions for the post-COVID-19 situation [9]. In 2020, Deshmukh and Haleem stated that the gap between the real and virtual worlds will quickly close due to the impacts of the pandemic. In addition, manufacturing activities in countries will be highly dependent on health care systems [10]. However, comprehensive assessments of integrated technology solutions for the manufacturing industry are lacking. Tao et al.’s study analyzed and discussed Internet-Enabled production strategies for post-pandemic recovery [11]. The role of Industry 4.0 has been empirically verified for the recovery of production in the short-term and medium-term by Cugno et al. According to the research results, the authors expressed interest in two factors, the digital and the classical reorganization for recovery [12]. Another multifactorial analysis of post-pandemic production strategies has been developed for the mining industry by Marimuthu et al. The authors found that the large workforce requirement and the decline in demand are the leading factors for sustainability in the mining industry. In addition, the eco-innovation practices are also found to be the most effective strategy [4]. For the airline and automobile industries, supply localization and Industry 4.0 technologies are important mitigation strategies [13]. Meanwhile, Yao has developed analyses of environmental regulations in the post-pandemic situation in China. His results show that green purchasing and resource efficiency are key strategies for a green economy in China [14]. In 2021, a strategic management framework for the energy sector during the pandemic was proposed by Ghoferh et al. The proposed framework is recognized as a useful tool for energy strategy developers [15]. Moreover, more detailed studies on policy development for production and environmental improvement have also been consulted by the authors [16,17,18]. A closer look at the review shows that prior strategy studies focused on aspects such as technology, human resources, cooperation, environment, and energy in post-COVID-19 strategy development, as shown in Table 1.
From our search of the literature, it is clear that MCDM methods have been widely applied in assessing negative impacts and strategies, as shown in Table 2. However, the methods are rarely applied in isolation. Instead, scholars tend to combine methods to enhance assessment results [27,28]. Moreover, the fuzzy theory is also commonly integrated with both quantitative and qualitative MCDM analyses. In a study published in 2021, Yao used the Fuzzy Analytical Hierarchy Process (AHP) method to determine the weights of the criteria and the Fuzzy VIekriterijumsko KOmpromisno Rangiranje (VIKOR) to evaluate the strategies [14]. Meanwhile, Ilyas et al. integrated a recent MCDM method, the Best–Worst Method (BWM), with a classical method, Technique for Order of Preference by Similarity to Ideal Solution (TOPSIS), to analyze supplier selection strategies during the pandemic [23]. In another study, the Fuzzy Complex Proportional Assessment (COPRAS) method was used by R. Marimuthu to evaluate factors and strategies in the Indian mining industry [4]. In mid-2021, Paul et al. identified core challenges for post-pandemic supply chain recovery using the grey decision-making trial and evaluation laboratory (DEMATEL) method [29]. A grey-based digraph-matrix approach was proposed to analyze the post-COVID-19 strategy by Taqi et al. [30]. On the other hand, optimization mathematical models have also been used by previous studies to analyze this problem. In 2021, a linear programming model was developed for the strategic design of supply chain management during the pandemic by Alkahtani et al. The model’s objective function is to minimize the total cost for manufacturers in the pandemic era [22]. Another multi-objective linear planning model has been developed and published for oil and gas supply chain configuration design in crisis conditions due to the COVID-19 pandemic. This model contains many uncertainties, including demand and supply capacity, in the design and operation of the oil and gas supply chain [31].
Based on the above references, it can be seen that studies of production strategies to respond to pandemic impacts have been applied in many industries globally. Despite being rated as one of the world’s most dynamic economies, similar studies for Vietnam’s manufacturing industry are still limited. On the other hand, the evolution of MCDM methods is increasingly rapid. The emergence of more modern methods promises to provide more robust analytical results. The OPA is a novel and potential choice. In 2020, this method was introduced with distinct advantages compared to other MCDM methods [42]. However, the application of OPA is still meager in multi-criteria strategic analysis. To close this gap, an integrated model of OPA and Fuzzy EDAS is proposed in this study for the strategic evaluation problem in Vietnam.
3. Methodology
As shown in Figure 1, the proposed methodology can be seen as a two-stage process. The first stage aims to determine the weight of the impacts. A group of highly experienced experts in the mechanical industry field was surveyed and ranked based on their expertise. The negative impacts of the pandemic on manufacturing and supply chains were determined based on references, relevant studies, and expert surveys. These negative impacts are ranked according to each expert’s point of view in the form of ordinal priority judgments. The expert rank and their ordinal priority judgments for the criteria are then used to determine the weights of the impacts as well as the experts via OPA. The second stage of the proposed methodology is designed to evaluate and rank production strategies. At this stage, potential post-COVID-19 production strategies are selected based on previous research as well as actual implementation. In the next step, experts contribute linguistic judgments for mitigating the effectiveness of production strategies for each pandemic’s negative impact. The linguistics judgments are then converted to fuzzy triangular numbers and aggregated into an integrated fuzzy decision matrix. Finally, the procedure of the Fuzzy EDAS method is applied to analyze, evaluate, and rank production strategies.
3.1. Ordinal Priority Approach
The Ordinal Priority Approach (OPA) is an emerging MCDM method proposed by Ataei et al. in 2020 [42]. This method is developed based on linear programming and ordinal relations to solve MCDM problems. The OPA is recognized by researchers as an effective, objective, and flexible method. The distinct advantages of this method are that it does not require the normalization procedure, pairwise comparisons, and data completeness. The set, parameters, and decision variables of the OPA mathematical model in this study are presented in Table 3.
The procedure for weighting the criteria using OPA in this study includes the following steps:
Step 1: Identify a group of experts or decision-makers. Because their expertise is different, experts are ranked by ordinal numbers based on level of education and years of experience.
Step 2: The criteria are prioritized by each expert.
Step 3: Based on the ordinal judgments in steps 1 and 2, the mathematical model (1) is developed and solved.
where : unrestricted in sign
After solving Model (1), the criteria and expert’s weights are determined using Equations (19)–(21):
The remarkable advantages of the OPA method compared with other MCDM methods are described in Table 4 below.
3.2. Fuzzy Sets
The fuzzy sets are used both for criteria weighting and for alternative prioritization processes to support the decision-making procedure under ambiguous conditions. [43,44].
Definition 1
- is a closed interval for any;
- There existssuch that.
- Where ,, and represent the membership function, fuzzy set, and real number set, respectively.
Definition 2
([46]). A triangular fuzzy number (TFN) denoted by . Where , and represent the smallest, most-likely, and largest possible value of TFN . Thus, the membership function of can be defined as Equation (4).
Then, the fuzzy decision matrix ofalternatives andcriteria can be expressed as (5):
Because it is difficult to properly express the opinion of experts with exact numbers, linguistic judgments are used to qualitatively evaluate alternatives according to criteria. Then, linguistic judgments are converted into TFNs to perform quantitative calculations.
Definition 3
- ,
- ,
- ,
Definition 4
3.3. The Fuzzy Evaluation Based on Distance from Average Solution Method
The Evaluation Based on Distance from Average Solution (EDAS) method is a modern MCDM compromise method. This method was first proposed in 2015 by M. K. Ghorabaee [49]. The EDAS method uses positive distance () and negative distance () from the average solution instead of the distances from the ideal solution and negative ideal solutions such as VIKOR or TOPSIS. To increase the objectivity of the assessments, fuzzy sets were incorporated into the EDAS method in recent related studies [50,51,52]. The Fuzzy EDAS method allows performing analyses based on expert linguistics judgments. The linguistic assessments are converted into TFNs for quantitative analysis according to the relationships in Table 5.
Consider the MCDM problem with alternatives, criteria, and experts. The fuzzy EDAS procedure is presented as follows:
- Step 1:
- The matrix of the criteria fuzzy weight is constructed as Equations (7) and (8).
- Step 2:
- The integrated fuzzy decision matrix is constructed as Equations (9) and (10).
- Step 3:
- The average solutions matrix is defined as Equations (11) and (12).
- Step 4:
- The matrices of fuzzy positive distance from average () and fuzzy negative distance from average () are constructed as Equations (13)–(18).
- Step 5:
- The weighted sum of positive and negative distances for all alternatives is calculated as Equations (19) and (20).
- Step 6:
- The normalized weighted sum of positive and negative distances for all alternatives is calculated as Equations (21) and (22).
- Step 7:
- The appraisal score for all alternatives is calculated as Equation (23)
- Step 8:
- The defuzzied appraisal score for all alternatives is calculated as a crisp value according to Equation (6).
- Step 9:
- The alternative with a larger value of defuzzied appraisal score is seen as the better choice. In other words, the highest-ranked alternative has the largest value of defuzzied appraisal score.
4. Case Study of Manufacturing in Vietnam
To assess the influence of production strategies on pandemic impacts, the approach described in Figure 1 has been proposed and applied to the mechanical and manufacturing industry in Vietnam. In the beginning, a group of ten experts was formed and surveyed on the negative impacts of the pandemic and production strategies that could help mitigate those impacts. As shown in Table 6, the qualifications and years of experience of these professionals are sufficient to participate in the assessment. Because their expertise is different, experts are ranked to enhance the correctness of judgments.
4.1. Impact Weighting by Ordinal Priority Approach
Based on references as well as expert opinion, ten negative impacts of the pandemic have been identified, including short-, medium-, and long-term impacts as shown in Table 7.
For short-term negative impacts, the global oil supply chain has been disrupted. This leads to a shortage of energy for production activities (NI-1). In addition, the import and export activities and logistics were stalled, leading to a decrease in the supply of raw materials (NI-2). In terms of sales, sales operations were hampered by uncertainties in the later tiers of the supply chain. As a result, cash flows and investments are negatively impacted (NI-3). At the same time, the chain collapse effect across the supply chain left manufacturing plants with canceled orders (NI-4). Another key element of the system is the workforce, which has also been affected. During the pandemic, workforce availability is severely decreased by health issues and pandemic control activities (NI-5). Concerning transportation and delivery, border gates and seaports are closed, regions are divided, and delivery costs are high, leading to unstable and inconsistent delivery activities (NI-6). Moreover, the manufacturing industry requires constant updating of technology. Due to difficulties in immigration activities, leading to the absence of foreign technology experts. This leads to the stagnation of manufacturing technology transfer activities (NI-7).
For medium- and long-term negative impacts, distributors face a situation where their revenue balances their operating costs during the pandemic. Consequently, closure decisions are made. Among them, many distributors were unable to resume operations, leading to a continuous restructuring of the manufacturing supply chain (NI-8). Another long-term negative effect on manufacturing is the high level of job cuts due to reduced production (NI-9). Last but not least, public policies, regulations, and taxes are constantly changing depending on the epidemic control situation of each locality, country, and region (NI-10).
Then, each expert evaluates the importance of negative impacts in terms of ordinal numbers. The impacts with higher priority are considered more important and urgent. These ordinal evaluations are presented in Table 8. According to the highest-ranking expert, EP-03, impact NI-8 has the greatest importance, so it needs the most attention. According to this expert, the importance of negative impacts is as follows:
NI-8 > NI-2 = NI-4 > NI-5 > NI-6 > NI-10 > NI-7 > NI-1 = NI-3 > NI-9
Based on the ranking of experts and the judgments in Table 8, the OPA mathematical model (1) was programmed and solved by the CPLEX Solver. Table 9 shows the optimization results of experts’ weights. As shown Figure 2, manufacturing experts in Vietnam are focusing on restoring and stabilizing key factors of the production system such as raw materials, labor force, and sales. In the long term, the constant fluctuation of the structure and the players in the supply chain is a major concern for manufacturers.
4.2. Post-COVID-19 Production Strategy Evaluation by Fuzzy EDAS
In Stage 2, new production strategies are analyzed to assess the effectiveness of their mitigation of the pandemic’s impacts. Firstly, nine potential production strategies were identified based on previous strategy studies, as shown in Table 10. These strategies are confirmed to help manufacturing businesses mitigate the negative impacts of the pandemic. The analytical problem in this study is schematically shown in Figure 3.
In the next step of the evaluation procedure, experts were surveyed to make linguistic judgments about the influence of production strategies on each negative impact. Table A1 shows the results of the survey of linguistic judgments by Expert 1. The linguistic judgments were then converted into the corresponding TFNs according to Table 5. Accordingly, the fuzzy decision matrices of experts were established as shown in Appendix A. Table 11 shows the aggregated results of experts’ fuzzy decision matrices, which were constructed according to Equation (10). Based on this result, the fuzzy value of the average solution was determined by Equation (12) and is presented in Table 12.
According to Equations (13)–(18), the fuzzy positive and negative distances from the average solution were determined as shown in Table A12 and Table A13, respectively. In the next step, the Fuzzy EDAS procedure determined the fuzzy weighted positive and negative distances from the average solution as shown in Table A14 and Table A15. According to Equations (19) and (20), the fuzzy weighted sums of positive and negative distances for strategies were determined as shown in Table 13. These fuzzy weighted sum values were normalized according to Equations (21) and (22). Table 14 summarizes the results for normalization.
In the final step of the Fuzzy EDAS procedure, the appraisal scores of the strategies were calculated and defuzzied according to Equations (6) and (23). Based on the defuzzied appraisal scores, strategies were ranked in terms of their ability to mitigate the effects of the pandemic. An overall summary of the results is given in Table 15 and Figure 4.
The findings seem to suggest that digitalization/automation (ST-7) is the most effective and urgent strategy used by experts to mitigate the negative effects of the pandemic on Vietnam’s manufacturing industry. The speed of implementation of digitization and automation projects is considered by experts as an important factor to help manufacturers survive sustainably. The next key strategy is the transition to using on-site renewable energy (ST-9) in manufacturing operations. Maintaining a high level of local energy security is believed to be a precondition for avoiding energy crises caused by disruptions in oil and gas supply chains. The third most important strategy recommended is the rapid deployment of mechanisms and training people for working online (ST-6). Meanwhile, fintech applications (ST-8) and low-cost rapid human resource management systems (ST-3) are seen as low-effective strategies in the current situation in Vietnam’s manufacturing industry.
4.3. Validation and Sensitivity Analysis
To check the results’ validity and objectivity, a sensitivity analysis was performed in this study related to the weights of negative impacts. Furthermore, the results were also compared with other MCDM methods.
For the result validation process, the results obtained from the proposed method were compared with the results of the Fuzzy TOPSIS and Fuzzy VIKOR methods. As can be seen in Table 16, it can be concluded that the results of the proposed method are highly consistent with other MCDM methods, such that the strategic groups only change within the high, medium, and low-ranking groups.
In the weight sensitivity analysis procedure, three scenarios were developed in this study about the weight of negative impacts, including equal weighting, weighting focusing on short-term impacts, and weighting focusing on long-term impacts. Accordingly, in the equal weighting scenario, the weight of the negative impacts is divided equally. For the other two scenarios, the proportion of negative impacts is first determined by short-term and long-term groups separately based on the OPA results as shown in Figure 5.
In the next step, the weights in these two scenarios were recomputed according to the structure shown in Figure 6. For the scenario focusing on short-term impacts, the proportion of this group of impacts accounts for 70% compared to 30% of the group of long-term impacts. This ratio is assumed to be the opposite for a scenario that focuses on long-term impacts.
Accordingly, the weight of negative impacts according to the scenarios is recalculated and presented in Table 17. Then, the procedural calculations of the fuzzy EDAS method are applied to each scenario. The results are shown graphically in Figure 7.
The results of the sensitivity analysis show that the rankings of the digitization strategy (ST-7) and comprehensive cooperation strategy (ST-4) are consistently high. Meanwhile, according to experts in Vietnam, strategies ST-6 and ST-9 are more appropriate when focusing on mitigating short-term impacts. In summary, the results show that the strongest recommendation from experts on the issue of developing post-COVID-19 production strategies is digitization and automation.
4.4. Managerial Implications
The spread of the pandemic leads to short-term and long-term negative impacts on production systems. Post-COVID-19 production strategies are seen as essential for the survival and recovery of manufacturers. However, planning and implementing strategies simultaneously is difficult because of the finiteness of resources. The findings of the OPA-Fuzzy EDAS proposed approach help managers prioritize post-pandemic production strategies. Based on the ranking of production strategies in different scenarios, production managers can determine the appropriate pathway for their business to implement the strategies. In other words, the multi-scenarios ranking results of strategies support managers to make resource allocation decisions for the implementation of strategies according to each specific stage and production situation.
5. Conclusions
The role of production strategies is becoming more important in post-pandemic recovery and sustainable development. This study presents a novel multi-criteria approach in assessing post-pandemic production strategies for manufacturing in Vietnam. In Stage 1 of the proposed approach, the negative impacts of the pandemic were determined based on references and expert opinions. Then, each expert, who was ranked based on expertise, made ordinal judgments about the importance of the impacts. In the next step, the weight of the impacts was calculated using the OPA method. In Stage 2, post-COVID-19 production strategies were evaluated and ranked based on expert linguistic judgments using the Fuzzy EDAS method. The findings indicate that manufacturers in Vietnam focus their concerns on impacts to maintain production such as raw material shortages, worker shortages, and order cancellations. On the other hand, through validated results and sensitivity analyses, the digitization/automation strategy is the decisive direction for recovery and sustainable production. In addition, the appropriateness of strategies depends on Vietnam manufacturing managers’ concerns about short-term or long-term impacts.
The primary contribution is to propose a novel integrated approach to multiple-criteria decision-making (MCDM) problems. This method integrates the strengths of two emerging and robust MCDM techniques, OPA and EDAS, in a fuzzy environment. Regarding managerial implications, this study contributes a multi-criteria assessment of production strategy under new conditions in Vietnam. This contribution aims to close the remaining research gap on strategic post-COVID-19 productions for the case of the manufacturing industry in Vietnam.
The main limitation relates to the fact that the findings depend on the expertise and opinions of experts. Therefore, extensive expert surveys and quantitative indicators can overcome this limitation. For future studies, predictive and time-series analyses may enhance the findings of this study.
Author Contributions
Conceptualization, M.-T.L. and N.-L.N.; methodology, N.-L.N.; validation, M.-T.L. and N.-L.N.; formal analysis, M.-T.L. and N.-L.N.; investigation, M.-T.L. and N.-L.N.; data curation, M.-T.L. and N.-L.N.; writing—original draft preparation, N.-L.N.; writing—review and editing, M.-T.L. and N.-L.N.; project administration, N.-L.N.; funding acquisition, M.-T.L. All authors have read and agreed to the published version of the manuscript.
Funding
This work belongs to the project in 2022 funded by Ho Chi Minh City University of Technology and Education, Vietnam.
Institutional Review Board Statement
Not applicable.
Informed Consent Statement
Not applicable.
Acknowledgments
The authors appreciate the support from the Ho Chi Minh City University of Technology and Education, Vietnam.
Conflicts of Interest
The authors declare no conflict of interest.
Appendix A

Table A1.
Linguistic judgments by Expert 1.
| Strategy | Impact | |||||||||
|---|---|---|---|---|---|---|---|---|---|---|
| NI-1 | NI-2 | NI-3 | NI-4 | NI-5 | NI-6 | NI-7 | NI-8 | NI-9 | NI-10 | |
| ST-1 | H | M | N | E | N | UM | N | E | I | M |
| ST-2 | H | M | M | N | E | N | N | L | N | LM |
| ST-3 | N | LM | E | S | S | L | H | LM | M | E |
| ST-4 | N | L | L | S | H | H | N | LM | E | I |
| ST-5 | E | M | L | N | L | M | M | H | S | S |
| ST-6 | LM | M | M | LM | S | E | I | M | N | I |
| ST-7 | L | N | S | LM | S | LM | S | E | H | H |
| ST-8 | L | M | H | N | UM | I | M | LM | M | N |
| ST-9 | I | LM | H | L | N | LM | E | N | H | E |
Table A2.
Fuzzy decision matrix by Expert 1.
| Strategy | Impact | |||||||||
|---|---|---|---|---|---|---|---|---|---|---|
| NI-1 | NI-2 | NI-3 | NI-4 | NI-5 | NI-6 | NI-7 | NI-8 | NI-9 | NI-10 | |
| ST-1 | (7, 8, 9) | (4, 5, 6) | (1, 1, 2) | (8, 9, 9) | (1, 1, 2) | (5, 6, 7) | (1, 1, 2) | (8, 9, 9) | (2, 3, 4) | (4, 5, 6) |
| ST-2 | (7, 8, 9) | (4, 5, 6) | (4, 5, 6) | (1, 1, 2) | (8, 9, 9) | (1, 1, 2) | (1, 1, 2) | (1, 2, 3) | (1, 1, 2) | (3, 4, 5) |
| ST-3 | (1, 1, 2) | (3, 4, 5) | (8, 9, 9) | (6, 7, 8) | (6, 7, 8) | (1, 2, 3) | (7, 8, 9) | (3, 4, 5) | (4, 5, 6) | (8, 9, 9) |
| ST-4 | (1, 1, 2) | (1, 2, 3) | (1, 2, 3) | (6, 7, 8) | (7, 8, 9) | (7, 8, 9) | (1, 1, 2) | (3, 4, 5) | (8, 9, 9) | (2, 3, 4) |
| ST-5 | (8, 9, 9) | (4, 5, 6) | (1, 2, 3) | (1, 1, 2) | (1, 2, 3) | (4, 5, 6) | (4, 5, 6) | (7, 8, 9) | (6, 7, 8) | (6, 7, 8) |
| ST-6 | (3, 4, 5) | (4, 5, 6) | (4, 5, 6) | (3, 4, 5) | (6, 7, 8) | (8, 9, 9) | (2, 3, 4) | (4, 5, 6) | (1, 1, 2) | (2, 3, 4) |
| ST-7 | (1, 2, 3) | (1, 1, 2) | (6, 7, 8) | (3, 4, 5) | (6, 7, 8) | (3, 4, 5) | (6, 7, 8) | (8, 9, 9) | (7, 8, 9) | (7, 8, 9) |
| ST-8 | (1, 2, 3) | (4, 5, 6) | (7, 8, 9) | (1, 1, 2) | (5, 6, 7) | (2, 3, 4) | (4, 5, 6) | (3, 4, 5) | (4, 5, 6) | (1, 1, 2) |
| ST-9 | (2, 3, 4) | (3, 4, 5) | (7, 8, 9) | (1, 2, 3) | (1, 1, 2) | (3, 4, 5) | (8, 9, 9) | (1, 1, 2) | (7, 8, 9) | (8, 9, 9) |
Table A3.
Fuzzy decision matrix by Expert 2.
| Strategy | Impact | |||||||||
|---|---|---|---|---|---|---|---|---|---|---|
| NI-1 | NI-2 | NI-3 | NI-4 | NI-5 | NI-6 | NI-7 | NI-8 | NI-9 | NI-10 | |
| ST-1 | (6, 7, 8) | (6, 7, 8) | (4, 5, 6) | (1, 2, 3) | (7, 8, 9) | (1, 1, 2) | (5, 6, 7) | (1, 2, 3) | (6, 7, 8) | (1, 2, 3) |
| ST-2 | (7, 8, 9) | (2, 3, 4) | (5, 6, 7) | (4, 5, 6) | (1, 2, 3) | (5, 6, 7) | (6, 7, 8) | (2, 3, 4) | (1, 2, 3) | (1, 2, 3) |
| ST-3 | (1, 1, 2) | (1, 1, 2) | (7, 8, 9) | (3, 4, 5) | (8, 9, 9) | (3, 4, 5) | (2, 3, 4) | (7, 8, 9) | (5, 6, 7) | (3, 4, 5) |
| ST-4 | (7, 8, 9) | (1, 1, 2) | (7, 8, 9) | (6, 7, 8) | (2, 3, 4) | (1, 1, 2) | (4, 5, 6) | (2, 3, 4) | (7, 8, 9) | (6, 7, 8) |
| ST-5 | (5, 6, 7) | (7, 8, 9) | (8, 9, 9) | (2, 3, 4) | (1, 2, 3) | (3, 4, 5) | (3, 4, 5) | (1, 1, 2) | (8, 9, 9) | (7, 8, 9) |
| ST-6 | (3, 4, 5) | (2, 3, 4) | (8, 9, 9) | (1, 1, 2) | (8, 9, 9) | (7, 8, 9) | (7, 8, 9) | (5, 6, 7) | (1, 1, 2) | (7, 8, 9) |
| ST-7 | (5, 6, 7) | (6, 7, 8) | (4, 5, 6) | (5, 6, 7) | (7, 8, 9) | (8, 9, 9) | (7, 8, 9) | (7, 8, 9) | (5, 6, 7) | (5, 6, 7) |
| ST-8 | (4, 5, 6) | (4, 5, 6) | (3, 4, 5) | (1, 1, 2) | (1, 1, 2) | (4, 5, 6) | (4, 5, 6) | (5, 6, 7) | (1, 1, 2) | (4, 5, 6) |
| ST-9 | (7, 8, 9) | (2, 3, 4) | (6, 7, 8) | (1, 2, 3) | (5, 6, 7) | (8, 9, 9) | (1, 1, 2) | (1, 1, 2) | (1, 2, 3) | (5, 6, 7) |
Table A4.
Fuzzy decision matrix by Expert 3.
| Strategy | Impact | |||||||||
|---|---|---|---|---|---|---|---|---|---|---|
| NI-1 | NI-2 | NI-3 | NI-4 | NI-5 | NI-6 | NI-7 | NI-8 | NI-9 | NI-10 | |
| ST-1 | (1, 2, 3) | (6, 7, 8) | (6, 7, 8) | (1, 1, 2) | (1, 2, 3) | (8, 9, 9) | (1, 1, 2) | (7, 8, 9) | (3, 4, 5) | (7, 8, 9) |
| ST-2 | (3, 4, 5) | (5, 6, 7) | (3, 4, 5) | (7, 8, 9) | (1, 1, 2) | (7, 8, 9) | (1, 2, 3) | (7, 8, 9) | (6, 7, 8) | (4, 5, 6) |
| ST-3 | (8, 9, 9) | (5, 6, 7) | (5, 6, 7) | (1, 1, 2) | (7, 8, 9) | (3, 4, 5) | (5, 6, 7) | (3, 4, 5) | (1, 1, 2) | (1, 1, 2) |
| ST-4 | (8, 9, 9) | (4, 5, 6) | (5, 6, 7) | (8, 9, 9) | (2, 3, 4) | (2, 3, 4) | (8, 9, 9) | (6, 7, 8) | (1, 2, 3) | (1, 2, 3) |
| ST-5 | (1, 1, 2) | (1, 1, 2) | (4, 5, 6) | (2, 3, 4) | (7, 8, 9) | (2, 3, 4) | (3, 4, 5) | (6, 7, 8) | (4, 5, 6) | (5, 6, 7) |
| ST-6 | (1, 1, 2) | (6, 7, 8) | (4, 5, 6) | (4, 5, 6) | (8, 9, 9) | (1, 2, 3) | (8, 9, 9) | (4, 5, 6) | (1, 2, 3) | (7, 8, 9) |
| ST-7 | (1, 1, 2) | (6, 7, 8) | (7, 8, 9) | (7, 8, 9) | (8, 9, 9) | (2, 3, 4) | (2, 3, 4) | (7, 8, 9) | (8, 9, 9) | (5, 6, 7) |
| ST-8 | (1, 2, 3) | (4, 5, 6) | (6, 7, 8) | (4, 5, 6) | (3, 4, 5) | (4, 5, 6) | (1, 1, 2) | (1, 1, 2) | (6, 7, 8) | (5, 6, 7) |
| ST-9 | (8, 9, 9) | (8, 9, 9) | (6, 7, 8) | (1, 2, 3) | (8, 9, 9) | (3, 4, 5) | (8, 9, 9) | (4, 5, 6) | (2, 3, 4) | (2, 3, 4) |
Table A5.
Fuzzy decision matrix by Expert 4.
| Strategy | Impact | |||||||||
|---|---|---|---|---|---|---|---|---|---|---|
| NI-1 | NI-2 | NI-3 | NI-4 | NI-5 | NI-6 | NI-7 | NI-8 | NI-9 | NI-10 | |
| ST-1 | (4, 5, 6) | (1, 1, 2) | (3, 4, 5) | (6, 7, 8) | (7, 8, 9) | (4, 5, 6) | (4, 5, 6) | (8, 9, 9) | (8, 9, 9) | (2, 3, 4) |
| ST-2 | (8, 9, 9) | (8, 9, 9) | (7, 8, 9) | (2, 3, 4) | (3, 4, 5) | (7, 8, 9) | (5, 6, 7) | (5, 6, 7) | (4, 5, 6) | (4, 5, 6) |
| ST-3 | (1, 1, 2) | (1, 1, 2) | (5, 6, 7) | (2, 3, 4) | (4, 5, 6) | (1, 1, 2) | (1, 1, 2) | (3, 4, 5) | (5, 6, 7) | (8, 9, 9) |
| ST-4 | (1, 2, 3) | (5, 6, 7) | (8, 9, 9) | (4, 5, 6) | (5, 6, 7) | (2, 3, 4) | (7, 8, 9) | (4, 5, 6) | (8, 9, 9) | (8, 9, 9) |
| ST-5 | (3, 4, 5) | (5, 6, 7) | (4, 5, 6) | (8, 9, 9) | (6, 7, 8) | (1, 1, 2) | (2, 3, 4) | (1, 1, 2) | (7, 8, 9) | (1, 2, 3) |
| ST-6 | (5, 6, 7) | (8, 9, 9) | (1, 1, 2) | (7, 8, 9) | (7, 8, 9) | (1, 1, 2) | (8, 9, 9) | (3, 4, 5) | (5, 6, 7) | (1, 1, 2) |
| ST-7 | (5, 6, 7) | (4, 5, 6) | (8, 9, 9) | (3, 4, 5) | (1, 2, 3) | (1, 2, 3) | (1, 2, 3) | (8, 9, 9) | (8, 9, 9) | (6, 7, 8) |
| ST-8 | (2, 3, 4) | (7, 8, 9) | (6, 7, 8) | (3, 4, 5) | (1, 2, 3) | (5, 6, 7) | (5, 6, 7) | (1, 2, 3) | (8, 9, 9) | (6, 7, 8) |
| ST-9 | (6, 7, 8) | (3, 4, 5) | (8, 9, 9) | (8, 9, 9) | (3, 4, 5) | (3, 4, 5) | (8, 9, 9) | (1, 2, 3) | (2, 3, 4) | (8, 9, 9) |
Table A6.
Fuzzy decision matrix by Expert 5.
| Strategy | Impact | |||||||||
|---|---|---|---|---|---|---|---|---|---|---|
| NI-1 | NI-2 | NI-3 | NI-4 | NI-5 | NI-6 | NI-7 | NI-8 | NI-9 | NI-10 | |
| ST-1 | (1, 1, 2) | (4, 5, 6) | (4, 5, 6) | (7, 8, 9) | (7, 8, 9) | (8, 9, 9) | (5, 6, 7) | (7, 8, 9) | (5, 6, 7) | (7, 8, 9) |
| ST-2 | (1, 1, 2) | (1, 1, 2) | (8, 9, 9) | (1, 1, 2) | (4, 5, 6) | (8, 9, 9) | (7, 8, 9) | (8, 9, 9) | (1, 1, 2) | (2, 3, 4) |
| ST-3 | (8, 9, 9) | (1, 2, 3) | (4, 5, 6) | (6, 7, 8) | (5, 6, 7) | (1, 1, 2) | (8, 9, 9) | (2, 3, 4) | (1, 1, 2) | (2, 3, 4) |
| ST-4 | (1, 1, 2) | (3, 4, 5) | (8, 9, 9) | (7, 8, 9) | (2, 3, 4) | (1, 2, 3) | (4, 5, 6) | (8, 9, 9) | (8, 9, 9) | (1, 2, 3) |
| ST-5 | (1, 2, 3) | (1, 2, 3) | (2, 3, 4) | (1, 1, 2) | (6, 7, 8) | (6, 7, 8) | (1, 1, 2) | (1, 2, 3) | (7, 8, 9) | (1, 2, 3) |
| ST-6 | (6, 7, 8) | (6, 7, 8) | (1, 2, 3) | (1, 2, 3) | (2, 3, 4) | (5, 6, 7) | (3, 4, 5) | (6, 7, 8) | (8, 9, 9) | (3, 4, 5) |
| ST-7 | (6, 7, 8) | (5, 6, 7) | (7, 8, 9) | (6, 7, 8) | (7, 8, 9) | (3, 4, 5) | (7, 8, 9) | (1, 2, 3) | (2, 3, 4) | (1, 2, 3) |
| ST-8 | (6, 7, 8) | (1, 1, 2) | (5, 6, 7) | (1, 1, 2) | (1, 2, 3) | (5, 6, 7) | (6, 7, 8) | (2, 3, 4) | (7, 8, 9) | (1, 2, 3) |
| ST-9 | (7, 8, 9) | (3, 4, 5) | (3, 4, 5) | (2, 3, 4) | (4, 5, 6) | (3, 4, 5) | (4, 5, 6) | (1, 1, 2) | (4, 5, 6) | (8, 9, 9) |
Table A7.
Fuzzy decision matrix by Expert 6.
| Strategy | Impact | |||||||||
|---|---|---|---|---|---|---|---|---|---|---|
| NI-1 | NI-2 | NI-3 | NI-4 | NI-5 | NI-6 | NI-7 | NI-8 | NI-9 | NI-10 | |
| ST-1 | (1, 2, 3) | (1, 2, 3) | (1, 2, 3) | (5, 6, 7) | (4, 5, 6) | (7, 8, 9) | (2, 3, 4) | (4, 5, 6) | (6, 7, 8) | (1, 2, 3) |
| ST-2 | (2, 3, 4) | (1, 1, 2) | (7, 8, 9) | (4, 5, 6) | (5, 6, 7) | (7, 8, 9) | (4, 5, 6) | (4, 5, 6) | (2, 3, 4) | (1, 2, 3) |
| ST-3 | (7, 8, 9) | (1, 1, 2) | (5, 6, 7) | (3, 4, 5) | (2, 3, 4) | (8, 9, 9) | (2, 3, 4) | (7, 8, 9) | (1, 2, 3) | (7, 8, 9) |
| ST-4 | (6, 7, 8) | (5, 6, 7) | (6, 7, 8) | (5, 6, 7) | (4, 5, 6) | (4, 5, 6) | (2, 3, 4) | (5, 6, 7) | (1, 2, 3) | (7, 8, 9) |
| ST-5 | (4, 5, 6) | (1, 1, 2) | (1, 1, 2) | (2, 3, 4) | (7, 8, 9) | (6, 7, 8) | (7, 8, 9) | (2, 3, 4) | (1, 1, 2) | (8, 9, 9) |
| ST-6 | (7, 8, 9) | (5, 6, 7) | (4, 5, 6) | (6, 7, 8) | (7, 8, 9) | (3, 4, 5) | (1, 2, 3) | (3, 4, 5) | (4, 5, 6) | (8, 9, 9) |
| ST-7 | (8, 9, 9) | (5, 6, 7) | (2, 3, 4) | (1, 2, 3) | (6, 7, 8) | (3, 4, 5) | (7, 8, 9) | (4, 5, 6) | (6, 7, 8) | (8, 9, 9) |
| ST-8 | (7, 8, 9) | (8, 9, 9) | (2, 3, 4) | (4, 5, 6) | (7, 8, 9) | (8, 9, 9) | (1, 1, 2) | (7, 8, 9) | (5, 6, 7) | (3, 4, 5) |
| ST-9 | (8, 9, 9) | (6, 7, 8) | (7, 8, 9) | (7, 8, 9) | (6, 7, 8) | (3, 4, 5) | (2, 3, 4) | (1, 1, 2) | (3, 4, 5) | (3, 4, 5) |
Table A8.
Fuzzy decision matrix by Expert 7.
| Strategy | Impact | |||||||||
|---|---|---|---|---|---|---|---|---|---|---|
| NI-1 | NI-2 | NI-3 | NI-4 | NI-5 | NI-6 | NI-7 | NI-8 | NI-9 | NI-10 | |
| ST-1 | (2, 3, 4) | (1, 1, 2) | (2, 3, 4) | (5, 6, 7) | (5, 6, 7) | (6, 7, 8) | (5, 6, 7) | (5, 6, 7) | (4, 5, 6) | (8, 9, 9) |
| ST-2 | (3, 4, 5) | (2, 3, 4) | (3, 4, 5) | (2, 3, 4) | (8, 9, 9) | (5, 6, 7) | (3, 4, 5) | (7, 8, 9) | (1, 1, 2) | (7, 8, 9) |
| ST-3 | (6, 7, 8) | (5, 6, 7) | (3, 4, 5) | (3, 4, 5) | (3, 4, 5) | (8, 9, 9) | (3, 4, 5) | (1, 2, 3) | (8, 9, 9) | (1, 1, 2) |
| ST-4 | (8, 9, 9) | (7, 8, 9) | (3, 4, 5) | (1, 2, 3) | (1, 1, 2) | (4, 5, 6) | (3, 4, 5) | (7, 8, 9) | (3, 4, 5) | (7, 8, 9) |
| ST-5 | (7, 8, 9) | (5, 6, 7) | (6, 7, 8) | (1, 2, 3) | (4, 5, 6) | (1, 1, 2) | (7, 8, 9) | (4, 5, 6) | (8, 9, 9) | (6, 7, 8) |
| ST-6 | (5, 6, 7) | (1, 1, 2) | (7, 8, 9) | (8, 9, 9) | (2, 3, 4) | (8, 9, 9) | (2, 3, 4) | (6, 7, 8) | (2, 3, 4) | (4, 5, 6) |
| ST-7 | (1, 2, 3) | (4, 5, 6) | (5, 6, 7) | (3, 4, 5) | (1, 2, 3) | (8, 9, 9) | (4, 5, 6) | (4, 5, 6) | (5, 6, 7) | (2, 3, 4) |
| ST-8 | (8, 9, 9) | (1, 2, 3) | (1, 2, 3) | (5, 6, 7) | (1, 2, 3) | (3, 4, 5) | (2, 3, 4) | (5, 6, 7) | (1, 2, 3) | (3, 4, 5) |
| ST-9 | (8, 9, 9) | (8, 9, 9) | (5, 6, 7) | (4, 5, 6) | (2, 3, 4) | (5, 6, 7) | (2, 3, 4) | (8, 9, 9) | (8, 9, 9) | (1, 2, 3) |
Table A9.
Fuzzy decision matrix by Expert 8.
| Strategy | Impact | |||||||||
|---|---|---|---|---|---|---|---|---|---|---|
| NI-1 | NI-2 | NI-3 | NI-4 | NI-5 | NI-6 | NI-7 | NI-8 | NI-9 | NI-10 | |
| ST-1 | (1, 1, 2) | (1, 1, 2) | (5, 6, 7) | (8, 9, 9) | (3, 4, 5) | (3, 4, 5) | (2, 3, 4) | (4, 5, 6) | (8, 9, 9) | (8, 9, 9) |
| ST-2 | (1, 2, 3) | (1, 2, 3) | (3, 4, 5) | (3, 4, 5) | (2, 3, 4) | (3, 4, 5) | (8, 9, 9) | (4, 5, 6) | (1, 1, 2) | (4, 5, 6) |
| ST-3 | (5, 6, 7) | (7, 8, 9) | (5, 6, 7) | (8, 9, 9) | (5, 6, 7) | (4, 5, 6) | (2, 3, 4) | (1, 2, 3) | (3, 4, 5) | (8, 9, 9) |
| ST-4 | (3, 4, 5) | (1, 1, 2) | (6, 7, 8) | (4, 5, 6) | (2, 3, 4) | (4, 5, 6) | (7, 8, 9) | (1, 1, 2) | (2, 3, 4) | (5, 6, 7) |
| ST-5 | (1, 1, 2) | (8, 9, 9) | (1, 2, 3) | (7, 8, 9) | (6, 7, 8) | (5, 6, 7) | (1, 2, 3) | (1, 2, 3) | (4, 5, 6) | (8, 9, 9) |
| ST-6 | (3, 4, 5) | (2, 3, 4) | (4, 5, 6) | (1, 1, 2) | (2, 3, 4) | (1, 1, 2) | (6, 7, 8) | (2, 3, 4) | (3, 4, 5) | (6, 7, 8) |
| ST-7 | (3, 4, 5) | (4, 5, 6) | (2, 3, 4) | (7, 8, 9) | (7, 8, 9) | (8, 9, 9) | (1, 2, 3) | (8, 9, 9) | (4, 5, 6) | (8, 9, 9) |
| ST-8 | (5, 6, 7) | (1, 1, 2) | (4, 5, 6) | (7, 8, 9) | (2, 3, 4) | (6, 7, 8) | (4, 5, 6) | (3, 4, 5) | (8, 9, 9) | (8, 9, 9) |
| ST-9 | (1, 1, 2) | (6, 7, 8) | (4, 5, 6) | (1, 1, 2) | (2, 3, 4) | (1, 2, 3) | (8, 9, 9) | (4, 5, 6) | (7, 8, 9) | (5, 6, 7) |
Table A10.
Fuzzy decision matrix by Expert 9.
| Strategy | Impact | |||||||||
|---|---|---|---|---|---|---|---|---|---|---|
| NI-1 | NI-2 | NI-3 | NI-4 | NI-5 | NI-6 | NI-7 | NI-8 | NI-9 | NI-10 | |
| ST-1 | (3, 4, 5) | (5, 6, 7) | (3, 4, 5) | (6, 7, 8) | (7, 8, 9) | (3, 4, 5) | (4, 5, 6) | (5, 6, 7) | (1, 2, 3) | (4, 5, 6) |
| ST-2 | (8, 9, 9) | (1, 2, 3) | (3, 4, 5) | (5, 6, 7) | (2, 3, 4) | (3, 4, 5) | (8, 9, 9) | (8, 9, 9) | (1, 2, 3) | (1, 2, 3) |
| ST-3 | (1, 2, 3) | (1, 2, 3) | (8, 9, 9) | (6, 7, 8) | (3, 4, 5) | (3, 4, 5) | (1, 2, 3) | (1, 1, 2) | (7, 8, 9) | (2, 3, 4) |
| ST-4 | (3, 4, 5) | (4, 5, 6) | (7, 8, 9) | (3, 4, 5) | (5, 6, 7) | (1, 2, 3) | (8, 9, 9) | (1, 1, 2) | (1, 2, 3) | (5, 6, 7) |
| ST-5 | (8, 9, 9) | (7, 8, 9) | (1, 1, 2) | (6, 7, 8) | (2, 3, 4) | (7, 8, 9) | (5, 6, 7) | (5, 6, 7) | (5, 6, 7) | (5, 6, 7) |
| ST-6 | (5, 6, 7) | (1, 2, 3) | (1, 2, 3) | (2, 3, 4) | (4, 5, 6) | (6, 7, 8) | (2, 3, 4) | (1, 2, 3) | (2, 3, 4) | (1, 2, 3) |
| ST-7 | (5, 6, 7) | (1, 1, 2) | (3, 4, 5) | (1, 1, 2) | (1, 1, 2) | (2, 3, 4) | (7, 8, 9) | (4, 5, 6) | (5, 6, 7) | (8, 9, 9) |
| ST-8 | (3, 4, 5) | (7, 8, 9) | (6, 7, 8) | (4, 5, 6) | (1, 1, 2) | (7, 8, 9) | (6, 7, 8) | (3, 4, 5) | (4, 5, 6) | (2, 3, 4) |
| ST-9 | (7, 8, 9) | (2, 3, 4) | (8, 9, 9) | (5, 6, 7) | (5, 6, 7) | (3, 4, 5) | (5, 6, 7) | (4, 5, 6) | (2, 3, 4) | (8, 9, 9) |
Table A11.
Fuzzy decision matrix by Expert 10.
| Strategy | Impact | |||||||||
|---|---|---|---|---|---|---|---|---|---|---|
| NI-1 | NI-2 | NI-3 | NI-4 | NI-5 | NI-6 | NI-7 | NI-8 | NI-9 | NI-10 | |
| ST-1 | (2, 3, 4) | (8, 9, 9) | (8, 9, 9) | (4, 5, 6) | (8, 9, 9) | (7, 8, 9) | (2, 3, 4) | (2, 3, 4) | (1, 1, 2) | (8, 9, 9) |
| ST-2 | (1, 2, 3) | (1, 1, 2) | (6, 7, 8) | (5, 6, 7) | (7, 8, 9) | (5, 6, 7) | (2, 3, 4) | (1, 2, 3) | (1, 2, 3) | (3, 4, 5) |
| ST-3 | (8, 9, 9) | (8, 9, 9) | (3, 4, 5) | (3, 4, 5) | (7, 8, 9) | (8, 9, 9) | (2, 3, 4) | (3, 4, 5) | (1, 2, 3) | (5, 6, 7) |
| ST-4 | (4, 5, 6) | (2, 3, 4) | (3, 4, 5) | (8, 9, 9) | (5, 6, 7) | (7, 8, 9) | (2, 3, 4) | (6, 7, 8) | (3, 4, 5) | (1, 2, 3) |
| ST-5 | (5, 6, 7) | (8, 9, 9) | (2, 3, 4) | (3, 4, 5) | (7, 8, 9) | (7, 8, 9) | (4, 5, 6) | (8, 9, 9) | (7, 8, 9) | (8, 9, 9) |
| ST-6 | (5, 6, 7) | (4, 5, 6) | (3, 4, 5) | (7, 8, 9) | (1, 2, 3) | (6, 7, 8) | (5, 6, 7) | (5, 6, 7) | (7, 8, 9) | (5, 6, 7) |
| ST-7 | (1, 1, 2) | (8, 9, 9) | (2, 3, 4) | (5, 6, 7) | (7, 8, 9) | (1, 1, 2) | (4, 5, 6) | (2, 3, 4) | (6, 7, 8) | (5, 6, 7) |
| ST-8 | (1, 2, 3) | (5, 6, 7) | (1, 2, 3) | (4, 5, 6) | (6, 7, 8) | (6, 7, 8) | (6, 7, 8) | (6, 7, 8) | (7, 8, 9) | (8, 9, 9) |
| ST-9 | (6, 7, 8) | (6, 7, 8) | (4, 5, 6) | (5, 6, 7) | (5, 6, 7) | (6, 7, 8) | (6, 7, 8) | (3, 4, 5) | (6, 7, 8) | (5, 6, 7) |
Table A12.
The fuzzy positive distance from the average solution .
| Strategy | Impact | ||||
|---|---|---|---|---|---|
| NI-1 | NI-2 | NI-3 | NI-4 | NI-5 | |
| ST-1 | (0.000, 0.000, 0.000) | (0.000, 0.000, 0.000) | (0.000, 0.000, 0.000) | (0.000, 0.000, 0.000) | (0.000, 0.000, 0.000) |
| ST-2 | (0.064, 0.071, 0.082) | (0.000, 0.000, 0.000) | (0.000, 0.000, 0.000) | (0.081, 0.086, 0.087) | (0.000, 0.000, 0.000) |
| ST-3 | (0.074, 0.134, 0.199) | (0.000, 0.000, 0.000) | (0.078, 0.087, 0.097) | (0.000, 0.000, 0.000) | (0.197, 0.226, 0.255) |
| ST-4 | (0.182, 0.252, 0.281) | (0.000, 0.000, 0.000) | (0.113, 0.145, 0.166) | (0.334, 0.453, 0.510) | (0.000, 0.000, 0.000) |
| ST-5 | (0.000, 0.000, 0.000) | (0.000, 0.000, 0.000) | (0.000, 0.000, 0.000) | (0.000, 0.000, 0.000) | (0.128, 0.136, 0.137) |
| ST-6 | (0.000, 0.000, 0.000) | (0.105, 0.124, 0.130) | (0.000, 0.000, 0.000) | (0.009, 0.015, 0.024) | (0.229, 0.322, 0.370) |
| ST-7 | (0.000, 0.000, 0.000) | (0.158, 0.173, 0.185) | (0.089, 0.107, 0.121) | (0.202, 0.219, 0.236) | (0.179, 0.236, 0.275) |
| ST-8 | (0.000, 0.000, 0.000) | (0.052, 0.055, 0.058) | (0.000, 0.000, 0.000) | (0.000, 0.000, 0.000) | (0.000, 0.000, 0.000) |
| ST-9 | (0.419, 0.544, 0.618) | (0.164, 0.246, 0.250) | (0.175, 0.213, 0.248) | (0.000, 0.000, 0.000) | (0.073, 0.115, 0.133) |
| Strategy | NI-6 | NI-7 | NI-8 | NI-9 | NI-10 |
| ST-1 | (0.205, 0.290, 0.363) | (0.000, 0.000, 0.000) | (0.209, 0.271, 0.298) | (0.084, 0.106, 0.11) | (0.053, 0.060, 0.062) |
| ST-2 | (0.334, 0.377, 0.447) | (0.000, 0.000, 0.000) | (0.152, 0.182, 0.192) | (0.000, 0.000, 0.000) | (0.000, 0.000, 0.000) |
| ST-3 | (0.000, 0.000, 0.000) | (0.000, 0.000, 0.000) | (0.000, 0.000, 0.000) | (0.000, 0.000, 0.000) | (0.000, 0.000, 0.000) |
| ST-4 | (0.000, 0.000, 0.000) | (0.224, 0.298, 0.341) | (0.059, 0.064, 0.073) | (0.000, 0.000, 0.000) | (0.000, 0.000, 0.000) |
| ST-5 | (0.000, 0.000, 0.000) | (0.000, 0.000, 0.000) | (0.000, 0.000, 0.000) | (0.217, 0.261, 0.306) | (0.111, 0.133, 0.146) |
| ST-6 | (0.000, 0.000, 0.000) | (0.268, 0.370, 0.414) | (0.000, 0.000, 0.000) | (0.000, 0.000, 0.000) | (0.105, 0.107, 0.146) |
| ST-7 | (0.000, 0.000, 0.000) | (0.000, 0.000, 0.000) | (0.319, 0.413, 0.47) | (0.347, 0.463, 0.532) | (0.150, 0.178, 0.201) |
| ST-8 | (0.141, 0.154, 0.161) | (0.000, 0.000, 0.000) | (0.000, 0.000, 0.000) | (0.163, 0.197, 0.246) | (0.000, 0.000, 0.000) |
| ST-9 | (0.000, 0.000, 0.000) | (0.198, 0.313, 0.380) | (0.000, 0.000, 0.000) | (0.000, 0.000, 0.000) | (0.000, 0.009, 0.020) |
Table A13.
The fuzzy positive distance from the average solution .
| Strategy | Impact | ||||
|---|---|---|---|---|---|
| NI-1 | NI-2 | NI-3 | NI-4 | NI-5 | |
| ST-1 | (0.196, 0.266, 0.338) | (0.007, 0.008, 0.021) | (0.097, 0.123, 0.143) | (0.049, 0.066, 0.074) | (0.03, 0.056, 0.072) |
| ST-2 | (0.000, 0.000, 0.000) | (0.093, 0.102, 0.125) | (0.019, 0.033, 0.046) | (0.000, 0.000, 0.000) | (0.288, 0.340, 0.357) |
| ST-3 | (0.000, 0.000, 0.000) | (0.174, 0.216, 0.218) | (0.000, 0.000, 0.000) | (0.188, 0.232, 0.241) | (0.000, 0.000, 0.000) |
| ST-4 | (0.000, 0.000, 0.000) | (0.112, 0.153, 0.178) | (0.000, 0.000, 0.000) | (0.000, 0.000, 0.000) | (0.202, 0.262, 0.321) |
| ST-5 | (0.155, 0.193, 0.199) | (0.085, 0.096, 0.114) | (0.176, 0.196, 0.218) | (0.127, 0.141, 0.184) | (0.000, 0.000, 0.000) |
| ST-6 | (0.111, 0.167, 0.170) | (0.000, 0.000, 0.000) | (0.149, 0.166, 0.177) | (0.000, 0.000, 0.000) | (0.000, 0.000, 0.000) |
| ST-7 | (0.155, 0.201, 0.202) | (0.000, 0.000, 0.000) | (0.000, 0.000, 0.000) | (0.000, 0.000, 0.000) | (0.000, 0.000, 0.000) |
| ST-8 | (0.129, 0.177, 0.259) | (0.000, 0.000, 0.000) | (0.013, 0.035, 0.049) | (0.108, 0.149, 0.155) | (0.295, 0.370, 0.421) |
| ST-9 | (0.000, 0.000, 0.000) | (0.000, 0.000, 0.000) | (0.000, 0.000, 0.000) | (0.148, 0.167, 0.228) | (0.000, 0.000, 0.000) |
| Strategy | NI-6 | NI-7 | NI-8 | NI-9 | NI-10 |
| ST-1 | (0.000, 0.000, 0.000) | (0.25, 0.326, 0.336) | (0.000, 0.000, 0.000) | (0.000, 0.000, 0.000) | (0.000, 0.000, 0.000) |
| ST-2 | (0.000, 0.000, 0.000) | (0.047, 0.070, 0.103) | (0.000, 0.000, 0.000) | (0.172, 0.233, 0.257) | (0.181, 0.238, 0.301) |
| ST-3 | (0.124, 0.137, 0.146) | (0.102, 0.143, 0.171) | (0.084, 0.115, 0.158) | (0.211, 0.263, 0.268) | (0.142, 0.168, 0.175) |
| ST-4 | (0.220, 0.286, 0.340) | (0.000, 0.000, 0.000) | (0.000, 0.000, 0.000) | (0.023, 0.035, 0.057) | (0.069, 0.081, 0.113) |
| ST-5 | (0.135, 0.186, 0.206) | (0.096, 0.146, 0.197) | (0.118, 0.136, 0.146) | (0.000, 0.000, 0.000) | (0.000, 0.000, 0.000) |
| ST-6 | (0.107, 0.130, 0.136) | (0.000, 0.000, 0.000) | (0.012, 0.029, 0.064) | (0.254, 0.318, 0.364) | (0.000, 0.000, 0.000) |
| ST-7 | (0.074, 0.085, 0.107) | (0.003, 0.037, 0.078) | (0.000, 0.000, 0.000) | (0.000, 0.000, 0.000) | (0.000, 0.000, 0.000) |
| ST-8 | (0.000, 0.000, 0.000) | (0.193, 0.250, 0.259) | (0.244, 0.303, 0.320) | (0.000, 0.000, 0.000) | (0.000, 0.005, 0.007) |
| ST-9 | (0.007, 0.009, 0.037) | (0.000, 0.000, 0.000) | (0.281, 0.337, 0.355) | (0.140, 0.185, 0.252) | (0.000, 0.000, 0.005) |
Table A14.
The fuzzy weighted positive distance from the average solution.
| Strategy | Impact | ||||
|---|---|---|---|---|---|
| NI-1 | NI-2 | NI-3 | NI-4 | NI-5 | |
| ST-1 | (0.000, 0.000, 0.000) | (0.000, 0.000, 0.000) | (0.000, 0.000, 0.000) | (0.000, 0.000, 0.000) | (0.000, 0.000, 0.000) |
| ST-2 | (0.004, 0.004, 0.005) | (0.000, 0.000, 0.000) | (0.000, 0.000, 0.000) | (0.010, 0.010, 0.010) | (0.000, 0.000, 0.000) |
| ST-3 | (0.005, 0.008, 0.012) | (0.000, 0.000, 0.000) | (0.008, 0.009, 0.010) | (0.000, 0.000, 0.000) | (0.026, 0.03, 0.0340) |
| ST-4 | (0.011, 0.016, 0.018) | (0.000, 0.000, 0.000) | (0.012, 0.015, 0.017) | (0.039, 0.053, 0.060) | (0.000, 0.000, 0.000) |
| ST-5 | (0.000, 0.000, 0.000) | (0.000, 0.000, 0.000) | (0.000, 0.000, 0.000) | (0.000, 0.000, 0.000) | (0.017, 0.018, 0.018) |
| ST-6 | (0.000, 0.000, 0.000) | (0.018, 0.022, 0.023) | (0.000, 0.000, 0.000) | (0.001, 0.002, 0.003) | (0.03, 0.043, 0.0409) |
| ST-7 | (0.000, 0.000, 0.000) | (0.027, 0.03, 0.0320) | (0.009, 0.011, 0.012) | (0.024, 0.026, 0.028) | (0.024, 0.031, 0.037) |
| ST-8 | (0.000, 0.000, 0.000) | (0.009, 0.009, 0.010) | (0.000, 0.000, 0.000) | (0.000, 0.000, 0.000) | (0.000, 0.000, 0.000) |
| ST-9 | (0.026, 0.034, 0.039) | (0.029, 0.043, 0.044) | (0.018, 0.022, 0.025) | (0.000, 0.000, 0.000) | (0.01, 0.015, 0.0180) |
| Strategy | NI-6 | NI-7 | NI-8 | NI-9 | NI-10 |
| ST-1 | (0.017, 0.024, 0.030) | (0.000, 0.000, 0.000) | (0.024, 0.031, 0.034) | (0.005, 0.006, 0.006) | (0.003, 0.004, 0.004) |
| ST-2 | (0.027, 0.031, 0.037) | (0.000, 0.000, 0.000) | (0.017, 0.021, 0.022) | (0.000, 0.000, 0.000) | (0.000, 0.000, 0.000) |
| ST-3 | (0.000, 0.000, 0.000) | (0.000, 0.000, 0.000) | (0.000, 0.000, 0.000) | (0.000, 0.000, 0.000) | (0.000, 0.000, 0.000) |
| ST-4 | (0.000, 0.000, 0.000) | (0.022, 0.029, 0.033) | (0.007, 0.007, 0.008) | (0.000, 0.000, 0.000) | (0.000, 0.000, 0.000) |
| ST-5 | (0.000, 0.000, 0.000) | (0.000, 0.000, 0.000) | (0.000, 0.000, 0.000) | (0.012, 0.014, 0.016) | (0.007, 0.009, 0.009) |
| ST-6 | (0.000, 0.000, 0.000) | (0.026, 0.036, 0.040) | (0.000, 0.000, 0.000) | (0.000, 0.000, 0.000) | (0.007, 0.007, 0.009) |
| ST-7 | (0.000, 0.000, 0.000) | (0.000, 0.000, 0.000) | (0.036, 0.047, 0.053) | (0.019, 0.025, 0.029) | (0.01, 0.011, 0.0130) |
| ST-8 | (0.012, 0.013, 0.013) | (0.000, 0.000, 0.000) | (0.000, 0.000, 0.000) | (0.009, 0.011, 0.013) | (0.000, 0.000, 0.000) |
| ST-9 | (0.000, 0.000, 0.000) | (0.019, 0.031, 0.037) | (0.000, 0.000, 0.000) | (0.000, 0.000, 0.000) | (0.000, 0.001, 0.001) |
Table A15.
The fuzzy weighted negative distance from the average solution.
| Strategy | Impact | ||||
|---|---|---|---|---|---|
| NI-1 | NI-2 | NI-3 | NI-4 | NI-5 | |
| ST-1 | (0.012, 0.017, 0.021) | (0.001, 0.001, 0.004) | (0.001, 0.013, 0.015) | (0.006, 0.008, 0.009) | (0.004, 0.007, 0.010) |
| ST-2 | (0.000, 0.000, 0.000) | (0.016, 0.018, 0.022) | (0.002, 0.003, 0.005) | (0.000, 0.000, 0.000) | (0.038, 0.045, 0.047) |
| ST-3 | (0.000, 0.000, 0.000) | (0.030, 0.038, 0.038) | (0.000, 0.000, 0.000) | (0.022, 0.027, 0.028) | (0.000, 0.000, 0.000) |
| ST-4 | (0.000, 0.000, 0.000) | (0.019, 0.027, 0.031) | (0.000, 0.000, 0.000) | (0.000, 0.000, 0.000) | (0.027, 0.035, 0.043) |
| ST-5 | (0.010, 0.012, 0.013) | (0.015, 0.017, 0.020) | (0.018, 0.020, 0.022) | (0.015, 0.017, 0.022) | (0.000, 0.000, 0.000) |
| ST-6 | (0.007, 0.011, 0.011) | (0.000, 0.000, 0.000) | (0.015, 0.017, 0.018) | (0.000, 0.000, 0.000) | (0.000, 0.000, 0.000) |
| ST-7 | (0.010, 0.013, 0.013) | (0.000, 0.000, 0.000) | (0.000, 0.000, 0.000) | (0.000, 0.000, 0.000) | (0.000, 0.000, 0.000) |
| ST-8 | (0.008, 0.011, 0.016) | (0.000, 0.000, 0.000) | (0.001, 0.004, 0.005) | (0.013, 0.018, 0.018) | (0.039, 0.049, 0.056) |
| ST-9 | (0.000, 0.000, 0.000) | (0.000, 0.000, 0.000) | (0.000, 0.000, 0.000) | (0.017, 0.020, 0.027) | (0.000, 0.000, 0.000) |
| Strategy | NI-6 | NI-7 | NI-8 | NI-9 | NI-10 |
| ST-1 | (0.000, 0.000, 0.000) | (0.024, 0.032, 0.033) | (0.000, 0.000, 0.000) | (0.000, 0.000, 0.000) | (0.000, 0.000, 0.000) |
| ST-2 | (0.000, 0.000, 0.000) | (0.005, 0.007, 0.010) | (0.000, 0.000, 0.000) | (0.009, 0.013, 0.014) | (0.012, 0.015, 0.019) |
| ST-3 | (0.010, 0.011, 0.012) | (0.010, 0.014, 0.017) | (0.010, 0.013, 0.018) | (0.011, 0.014, 0.014) | (0.009, 0.011, 0.011) |
| ST-4 | (0.018, 0.023, 0.028) | (0.000, 0.000, 0.000) | (0.000, 0.000, 0.000) | (0.001, 0.002, 0.003) | (0.004, 0.005, 0.007) |
| ST-5 | (0.011, 0.015, 0.017) | (0.009, 0.014, 0.019) | (0.013, 0.015, 0.017) | (0.000, 0.000, 0.000) | (0.000, 0.000, 0.000) |
| ST-6 | (0.009, 0.011, 0.011) | (0.000, 0.000, 0.000) | (0.001, 0.003, 0.007) | (0.014, 0.017, 0.020) | (0.000, 0.000, 0.000) |
| ST-7 | (0.006, 0.007, 0.009) | (0.000, 0.004, 0.008) | (0.000, 0.000, 0.000) | (0.000, 0.000, 0.000) | (0.000, 0.000, 0.000) |
| ST-8 | (0.000, 0.000, 0.000) | (0.019, 0.024, 0.025) | (0.028, 0.034, 0.036) | (0.000, 0.000, 0.000) | (0.000, 0.000, 0.000) |
| ST-9 | (0.001, 0.001, 0.003) | (0.000, 0.000, 0.000) | (0.032, 0.038, 0.040) | (0.008, 0.010, 0.014) | (0.000, 0.000, 0.000) |
References
- Abubakar, A. Coronavirus (COVID-19): Effect and Survival Strategy for Businesses. J. Econ. Bus. 2020, 3. Available online: https://ssrn.com/abstract=3599117 (accessed on 22 January 2022).
- Bourghelle, D.; Jawadi, F.; Rozin, P. Oil price volatility in the context of COVID-19. Int. Econ. 2021, 167, 39–49. [Google Scholar] [CrossRef]
- Caballero-Morales, S.O. Innovation as recovery strategy for SMEs in emerging economies during the COVID-19 pandemic. Res. Int. Bus. Financ. 2021, 57, 101396. [Google Scholar] [CrossRef] [PubMed]
- Marimuthu, R.; Sankaranarayanan, B.; Ali, S.M.; Karuppiah, K. Green recovery strategies for the mining industry of India: Lessons learned from the COVID-19 pandemic. J. Asia Bus. Stud. 2021, ahead-of-print. [CrossRef]
- Ivanov, D.; Dolgui, A. OR-methods for coping with the ripple effect in supply chains during COVID-19 pandemic: Managerial insights and research implications. Int. J. Prod. Econ. 2021, 232, 107921. [Google Scholar] [CrossRef]
- Menon, J. Special Review: COVID-19 in East Asia: Impacts and Response. Thail. World Econ. 2020, 38, 119–127. [Google Scholar]
- Ivanov, D.; Dolgui, A. Viability of intertwined supply networks: Extending the supply chain resilience angles towards survivability. A position paper motivated by COVID-19 outbreak. Int. J. Prod. Res. 2020, 58, 2904–2915. [Google Scholar] [CrossRef] [Green Version]
- Chowdhury, P.; Paul, S.K.; Kaisar, S.; Moktadir, M.A. COVID-19 pandemic related supply chain studies: A systematic review. Transp. Res. E Logist. Transp. Rev. 2021, 148, 102271. [Google Scholar] [CrossRef]
- Kumar, A.; Luthra, S.; Mangla, S.K.; Kazançoğlu, Y. COVID-19 impact on sustainable production and operations management. Sustain. Oper. Comput. 2020, 1, 1–7. [Google Scholar] [CrossRef]
- Deshmukh, S.G.; Haleem, A. Framework for Manufacturing in Post-COVID-19 World Order: An Indian Perspective. Int. J. Glob. Bus. Compet. 2020, 15, 49–60. [Google Scholar] [CrossRef]
- Peng, T.; He, Q.; Zhang, Z.; Wang, B.; Xu, X. Industrial Internet-enabled Resilient Manufacturing Strategy in the Wake of COVID-19 Pandemic: A Conceptual Framework and Implementations in China. Chin. J. Mech. Eng. 2021, 34, 48. [Google Scholar] [CrossRef]
- Cugno, M.; Castagnoli, R.; Büchi, G.; Pini, M. Industry 4.0 and production recovery in the covid era. Technovation 2022, 114, 102443. [Google Scholar] [CrossRef]
- Belhadi, A.; Kamble, S.; Jabbour, C.J.C.; Gunasekaran, A.; Ndubisi, N.O.; Venkatesh, M. Manufacturing and service supply chain resilience to the COVID-19 outbreak: Lessons learned from the automobile and airline industries. Technol. Soc. Chang. 2021, 163, 120447. [Google Scholar] [CrossRef] [PubMed]
- Yao, S. Fuzzy-based multi-criteria decision analysis of environmental regulation and green economic efficiency in a post-COVID-19 scenario: The case of China. Env. Sci. Pollut. Res. Int. 2021, 28, 30675–30701. [Google Scholar] [CrossRef]
- Chofreh, A.G.; Goni, F.A.; Klemeš, J.J.; Seyed Moosavi, S.M.; Davoudi, M.; Zeinalnezhad, M. COVID-19 shock: Development of strategic management framework for global energy. Renew. Sustain. Energy Rev. 2021, 139, 110643. [Google Scholar] [CrossRef]
- Lei, W.; Hui, Z.; Xiang, L.; Zelin, Z.; Xu-Hui, X.; Evans, S. Optimal remanufacturing service resource allocation for generalized growth of retired mechanical products: Maximizing matching efficiency. IEEE Access 2021, 9, 89655–89674. [Google Scholar] [CrossRef]
- Pan, D.; Chen, H. Border pollution reduction in China: The role of livestock environmental regulations. China Econ. Rev. 2021, 69, 101681. [Google Scholar] [CrossRef]
- Zhuang, M.; Zhu, W.; Huang, L.; Pan, W.-T. Research of influence mechanism of corporate social responsibility for smart cities on consumers’ purchasing intention. Libr. Hi Tech. 2021, ahead-of-print. [CrossRef]
- Chowdhury, M.T.; Sarkar, A.; Paul, S.K.; Moktadir, M.A. A case study on strategies to deal with the impacts of COVID-19 pandemic in the food and beverage industry. Oper. Manag. Res. 2020. [Google Scholar] [CrossRef]
- Chiaramonti, D.; Maniatis, K. Security of supply, strategic storage and COVID-19: Which lessons learnt for renewable and recycled carbon fuels, and their future role in decarbonizing transport? Appl. Energy 2020, 271, 115216. [Google Scholar] [CrossRef]
- Farias, P.I.V.; Freire, E.; Cunha, A.L.C.D.; Grumbach, R.J.D.S.; Antunes, A.M.D.S. The Fertilizer Industry in Brazil and the Assurance of Inputs for Biofuels Production: Prospective Scenarios after COVID-19. Sustainability 2020, 12, 8889. [Google Scholar] [CrossRef]
- Alkahtani, M.; Omair, M.; Khalid, Q.S.; Hussain, G.; Ahmad, I.; Pruncu, C. A COVID-19 Supply Chain Management Strategy Based on Variable Production under Uncertain Environment Conditions. Int. J. Env. Res. Public Health 2021, 18, 1662. [Google Scholar] [CrossRef] [PubMed]
- Ilyas, M.; Carpitella, S.; Zoubir, E. Designing Supplier Selection Strategies under COVID-19 Constraints for Industrial Environments. In Proceedings of the 31st CIRP Design Conference, Online, 19–21 May 2021; pp. 589–594. [Google Scholar]
- Ferrannini, A.; Barbieri, E.; Biggeri, M.; Di Tommaso, M.R. Industrial policy for sustainable human development in the post-COVID-19 era. World Dev. 2021, 137, 105215. [Google Scholar] [CrossRef] [PubMed]
- Ali, M.H.; Suleiman, N.; Khalid, N.; Tan, K.H.; Tseng, M.L.; Kumar, M. Supply chain resilience reactive strategies for food SMEs in coping to COVID-19 crisis. Trends Food Sci. Technol. 2021, 109, 94–102. [Google Scholar] [CrossRef] [PubMed]
- D’Adamo, I.; Lupi, G. Sustainability and Resilience after COVID-19: A Circular Premium in the Fashion Industry. Sustainability 2021, 13, 1861. [Google Scholar] [CrossRef]
- Tzeng, G.H.; Shen, K.Y. New Concepts and Trends of Hybrid Multiple Criteria Decision Making; CRC Press: Boca Raton, FL, USA, 2017. [Google Scholar]
- Wang, C.-N.; Nhieu, N.-L.; Nguyen, H.-P.; Wang, J.-W. Simulation-Based Optimization Integrated Multiple Criteria Decision-Making Framework for Wave Energy Site Selection: A Case Study of Australia. IEEE Access 2021, 9, 167458–167476. [Google Scholar] [CrossRef]
- Paul, S.K.; Chowdhury, P.; Moktadir, M.A.; Lau, K.H. Supply chain recovery challenges in the wake of COVID-19 pandemic. J. Bus Res. 2021, 136, 316–329. [Google Scholar] [CrossRef] [PubMed]
- Taqi, H.M.M.; Ahmed, H.N.; Paul, S.; Garshasbi, M.; Ali, S.M.; Kabir, G.; Paul, S.K. Strategies to Manage the Impacts of the COVID-19 Pandemic in the Supply Chain: Implications for Improving Economic and Social Sustainability. Sustainability 2020, 12, 9483. [Google Scholar] [CrossRef]
- Wang, C.-N.; Nhieu, N.-L.; Tran, K.-P.; Wang, Y.-H. Sustainable Integrated Fuzzy Optimization for Multimodal Petroleum Supply Chain Design with Pipeline System: The Case Study of Vietnam. Axioms 2022, 11, 60. [Google Scholar] [CrossRef]
- Samanlioglu, F.; Kaya, B.E. Evaluation of the COVID-19 Pandemic Intervention Strategies with Hesitant F-AHP. J. Health Eng. 2020, 2020, 8835258. [Google Scholar] [CrossRef]
- Kaya, S.K. Evaluation of the Effect of COVID-19 on Countries’ Sustainable Development Level: A comparative MCDM framework. Oper. Res. Eng. Sci. Theory Appl. 2020, 3, 101. [Google Scholar] [CrossRef]
- Taddese, G.; Durieux, S.; Duc, E. Sustainability Performance Evaluation of Faceshield Bracket Manufacturing by Using the Analytic Hierarchy Process. Sustainability 2021, 13, 13883. [Google Scholar] [CrossRef]
- Ahmad, N.; Hasan, M.G.; Barbhuiya, R.K. Identification and prioritization of strategies to tackle COVID-19 outbreak: A group-BWM based MCDM approach. Appl. Soft. Comput. 2021, 111, 107642. [Google Scholar] [CrossRef] [PubMed]
- Alkan, N.; Kahraman, C. Evaluation of government strategies against COVID-19 pandemic using q-rung orthopair fuzzy TOPSIS method. Appl. Soft. Comput. 2021, 110, 107653. [Google Scholar] [CrossRef] [PubMed]
- Mohammed, A.; Yazdani, M.; Oukil, A.; Santibanez Gonzalez, E.D.R. A Hybrid MCDM Approach towards Resilient Sourcing. Sustainability 2021, 13, 2695. [Google Scholar] [CrossRef]
- Abdul Ghaffar, A.R.; Nadeem, M.R.; Hasan, M.G. Cost-benefit analysis of shale development in India: A best-worst method based MCDM approach. J. King Saud. Univ. Sci. 2021, 33, 101591. [Google Scholar] [CrossRef]
- Wang, C.-N.; Nhieu, N.-L.; Dao, T.-H.; Huang, C.-C. Simulation-Based Optimized Weighting TODIM Decision-Making Approach for National Oil Company Global Benchmarking. IEEE Trans. Eng. Manag. 2022, 1–15. [Google Scholar] [CrossRef]
- Chodha, V.; Dubey, R.; Kumar, R.; Singh, S.; Kaur, S. Selection of industrial arc welding robot with TOPSIS and Entropy MCDM techniques. Mater. Today Proc. 2022, 50, 709–715. [Google Scholar] [CrossRef]
- Zeng, S.; Zhou, J.; Zhang, C.; Merigó, J.M. Intuitionistic fuzzy social network hybrid MCDM model for an assessment of digital reforms of manufacturing industry in China. Technol. Forecast. Soc. Chang. 2022, 176, 121435. [Google Scholar] [CrossRef]
- Ataei, Y.; Mahmoudi, A.; Feylizadeh, M.R.; Li, D.-F. Ordinal Priority Approach (OPA) in Multiple Attribute Decision-Making. Appl. Soft Comput. 2020, 86, 105893. [Google Scholar] [CrossRef]
- Zadeh, L.A. Fuzzy Sets. Inf. Control. 1965, 8, 335–338. [Google Scholar] [CrossRef] [Green Version]
- Bellman, R.E.; Zadeh, L.A. Decision-Making in a Fuzzy Environment. Manag. Sci. 1970, 17, B-141–B-164. [Google Scholar] [CrossRef]
- Guo, S.; Zhao, H. Fuzzy best-worst multi-criteria decision-making method and its applications. Knowl.-Based Syst. 2017, 121, 23–31. [Google Scholar] [CrossRef]
- Hwang, C.-L.; Yoon, K. Methods for Multiple Attribute Decision Making. In Multiple Attribute Decision Making; Springer: Berlin/Heidelberg, Germany, 1981; pp. 58–191. [Google Scholar]
- Li, D.-F. A ratio ranking method of triangular intuitionistic fuzzy numbers and its application to MADM problems. Comput. Math. Appl. 2010, 60, 1557–1570. [Google Scholar] [CrossRef] [Green Version]
- Yao, J.-S.; Wu, K. Ranking fuzzy numbers based on decomposition principle and signed distance. Fuzzy Sets Syst. 2000, 116, 275–288. [Google Scholar] [CrossRef]
- Keshavarz Ghorabaee, M.; Zavadskas, E.K.; Olfat, L.; Turskis, Z. Multi-Criteria Inventory Classification Using a New Method of Evaluation Based on Distance from Average Solution (EDAS). Informatica 2015, 26, 435–451. [Google Scholar] [CrossRef]
- Ghorabaee, M.K.; Zavadskas, E.K.; Amiri, M.; Turskis, Z. Extended EDAS Method for Fuzzy Multi-criteria Decision-making: An Application to Supplier Selection. Int. J. Comput. Commun. Control 2016, 11, 358–371. [Google Scholar] [CrossRef] [Green Version]
- Liang, Y. An EDAS Method for Multiple Attribute Group Decision-Making under Intuitionistic Fuzzy Environment and Its Application for Evaluating Green Building Energy-Saving Design Projects. Symmetry 2020, 12, 484. [Google Scholar] [CrossRef] [Green Version]
- Vesković, S.; Stević, Ž.; Karabašević, D.; Rajilić, S.; Milinković, S.; Stojić, G. A New Integrated Fuzzy Approach to Selecting the Best Solution for Business Balance of Passenger Rail Operator: Fuzzy PIPRECIA-Fuzzy EDAS Model. Symmetry 2020, 12, 743. [Google Scholar] [CrossRef]
- Hoang, A.T.; Sandro, N.; Olcer, A.I.; Ong, H.C.; Chen, W.H.; Chong, C.T.; Thomas, S.; Bandh, S.A.; Nguyen, X.P. Impacts of COVID-19 pandemic on the global energy system and the shift progress to renewable energy: Opportunities, challenges, and policy implications. Energy Policy 2021, 154, 112322. [Google Scholar] [CrossRef]
- Tian, J.; Yu, L.; Xue, R.; Zhuang, S.; Shan, Y. Global low-carbon energy transition in the post-COVID-19 era. Appl. Energy 2022, 307, 118205. [Google Scholar] [CrossRef]
- Ibn-Mohammed, T.; Mustapha, K.B.; Godsell, J.; Adamu, Z.; Babatunde, K.A.; Akintade, D.D.; Acquaye, A.; Fujii, H.; Ndiaye, M.M.; Yamoah, F.A.; et al. A critical analysis of the impacts of COVID-19 on the global economy and ecosystems and opportunities for circular economy strategies. Resour. Conserv. Recycl. 2021, 164, 105169. [Google Scholar] [CrossRef] [PubMed]
- Son, J.; Kang, J.H.; Jang, S. The effects of out-of-stock, return, and cancellation amounts on the order amounts of an online retailer. J. Retail. Consum. Serv. 2019, 51, 421–427. [Google Scholar] [CrossRef]
- Japutra, A.; Situmorang, R. The repercussions and challenges of COVID-19 in the hotel industry: Potential strategies from a case study of Indonesia. Int. J. Hosp. Manag. 2021, 95, 102890. [Google Scholar] [CrossRef]
- Sahay, M.R.; von Allmen, M.U.E.; Lahreche, M.A.; Khera, P.; Ogawa, M.S.; Bazarbash, M.; Beaton, M.K. The Promise of Fintech: Financial Inclusion in the Post COVID-19 Era; International Monetary Fund: Washington, DC, USA, 2020. [Google Scholar]
Figure 1.
Proposed OPA-Fuzzy EDAS methodology.
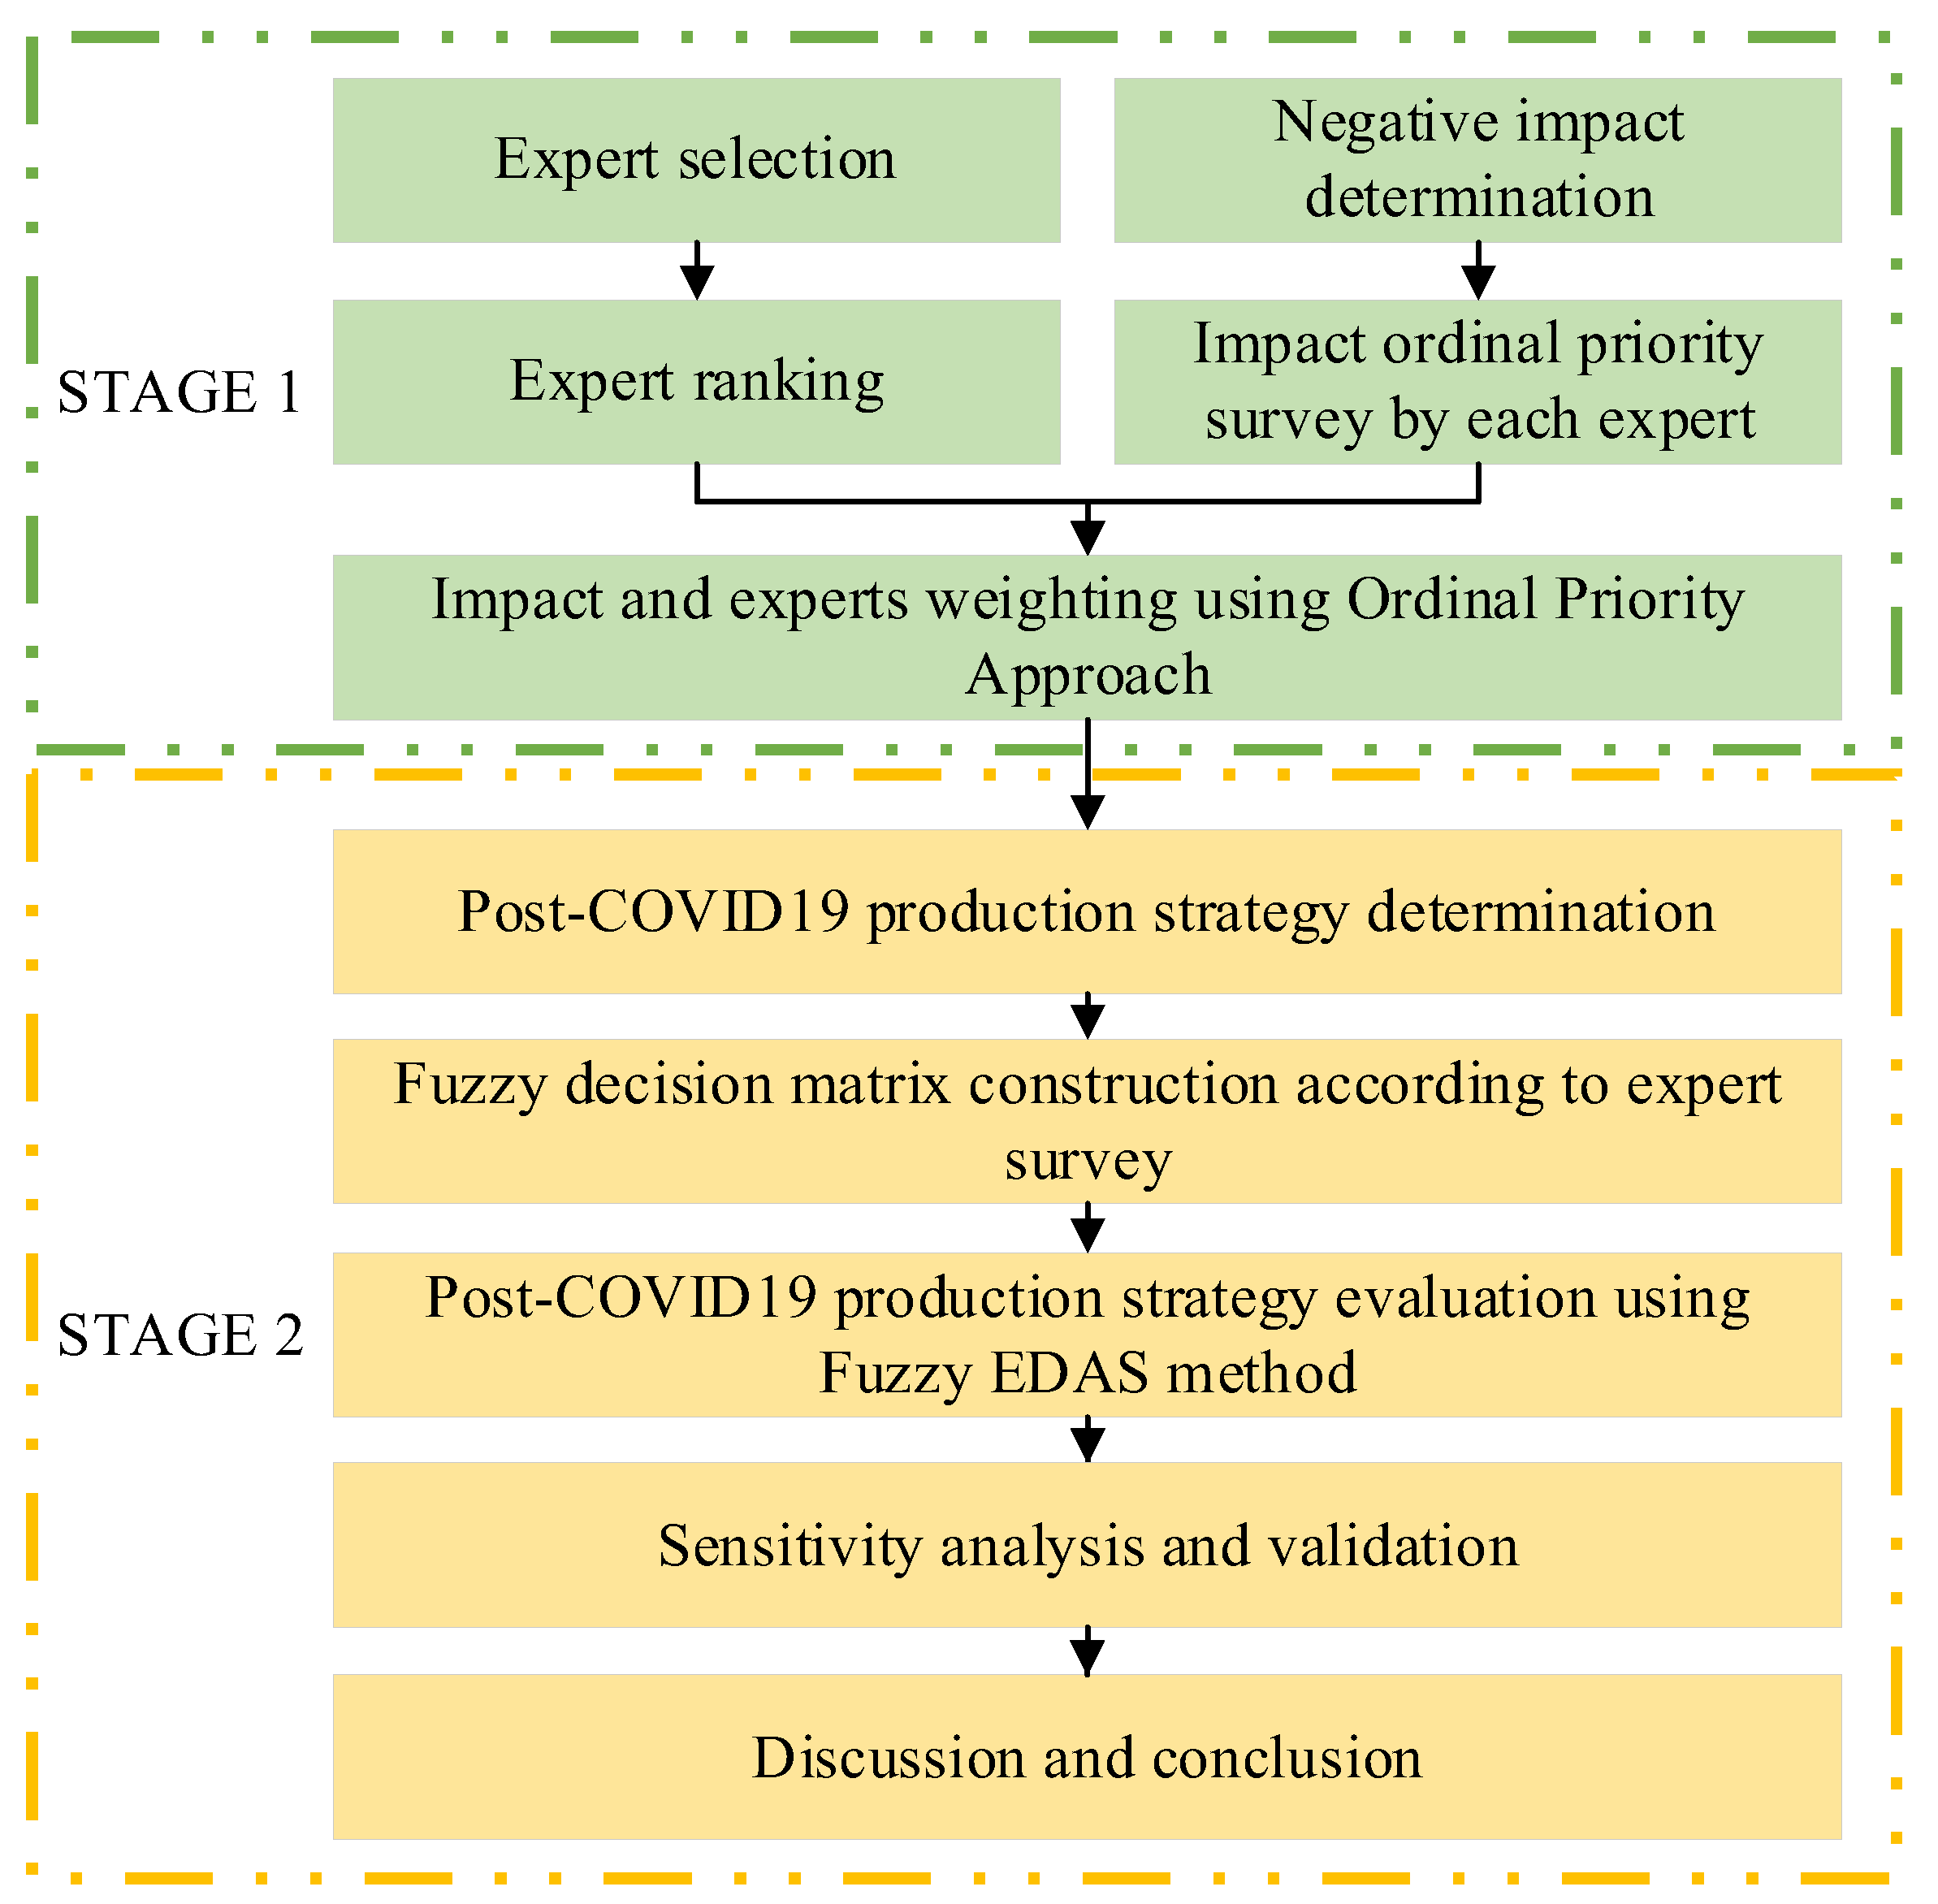
Figure 2.
Negative impact weight according to OPA results.
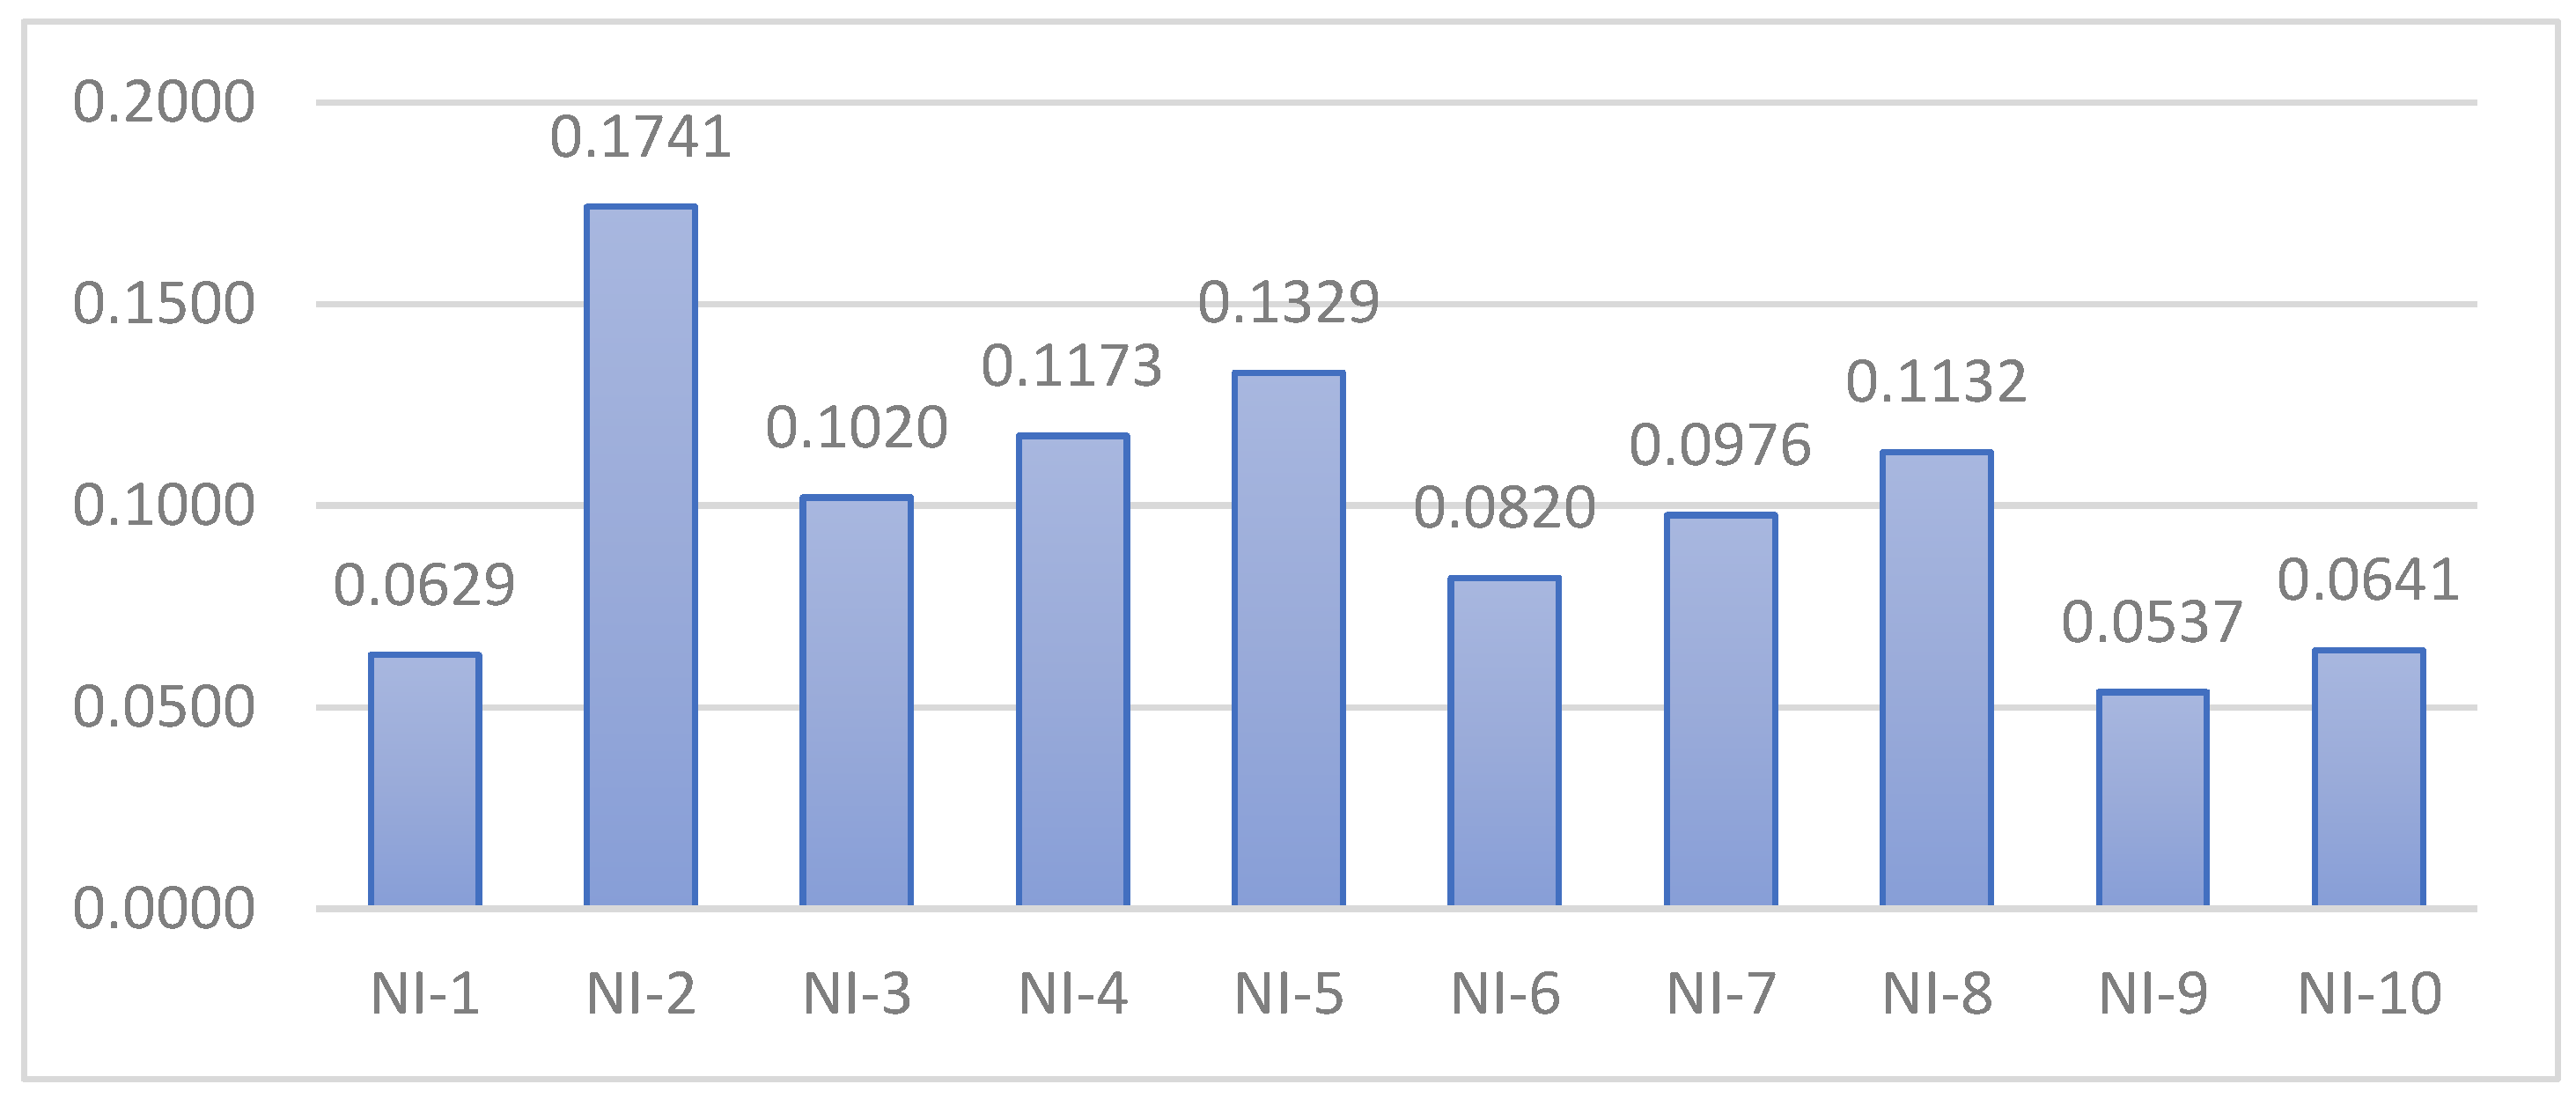
Figure 3.
Negative impacts and post-COVID-19 potential production strategies for mitigation.
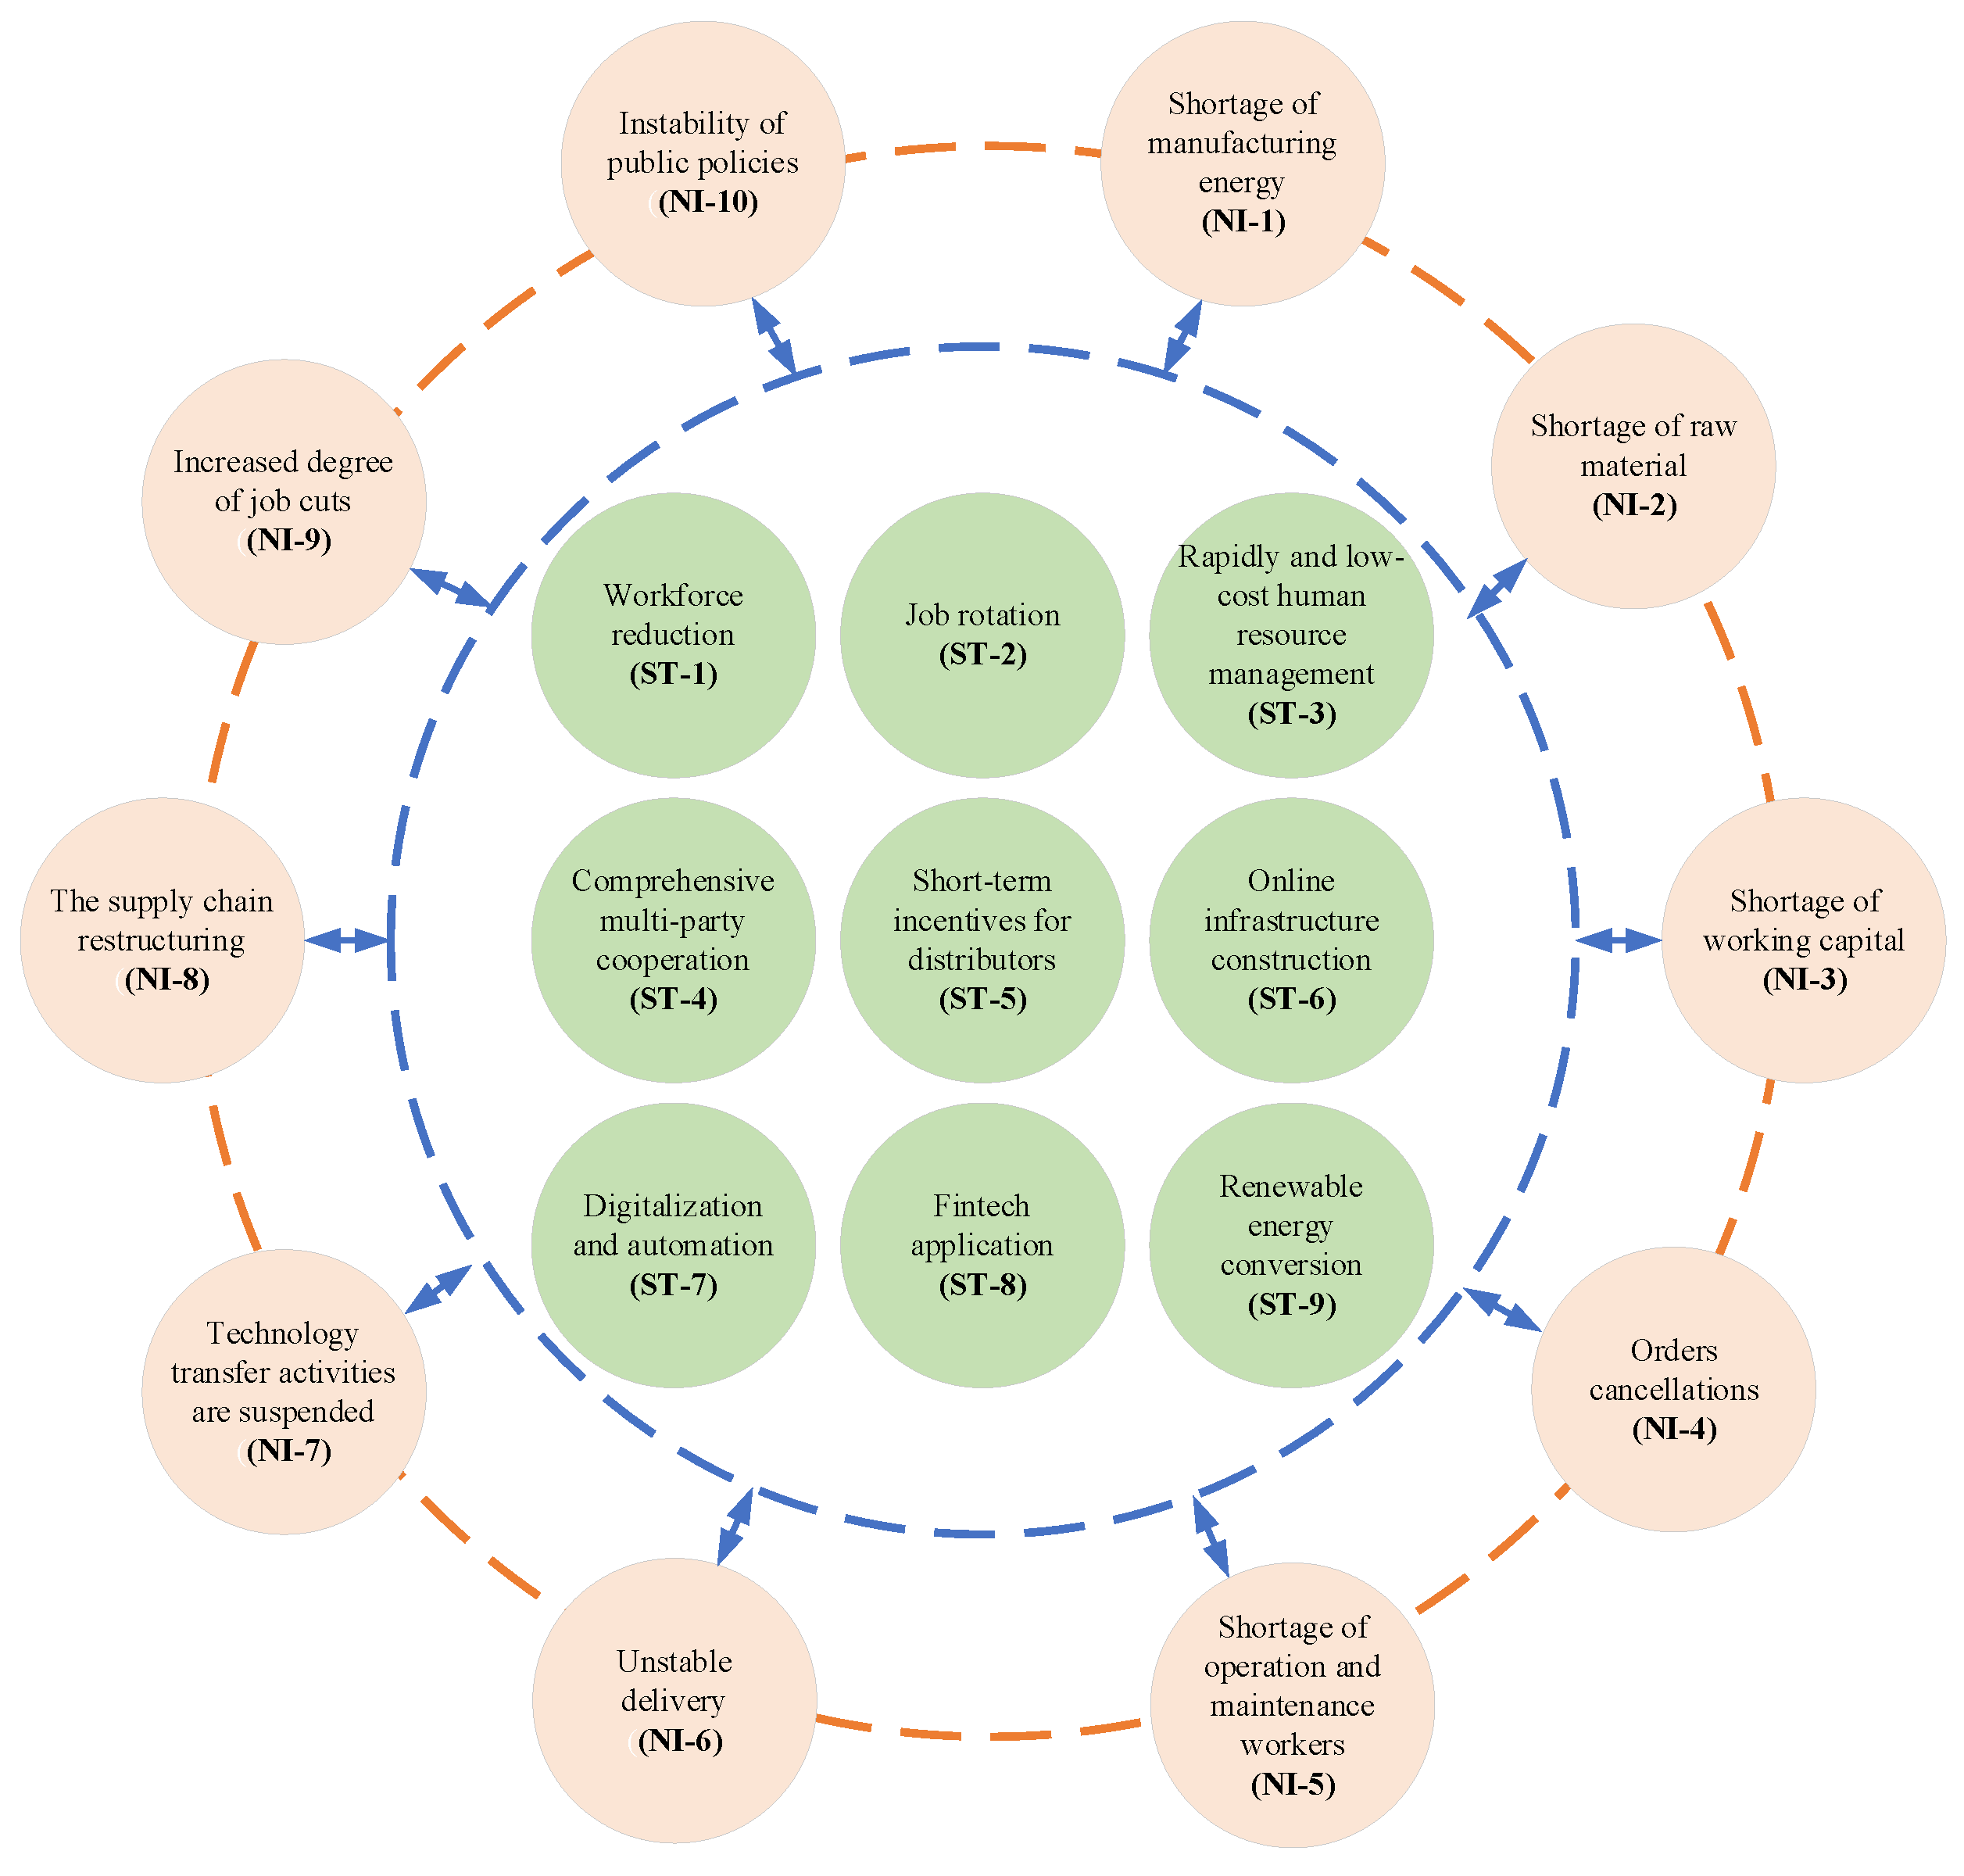
Figure 4.
Post-COVID-19 production strategy rankings.
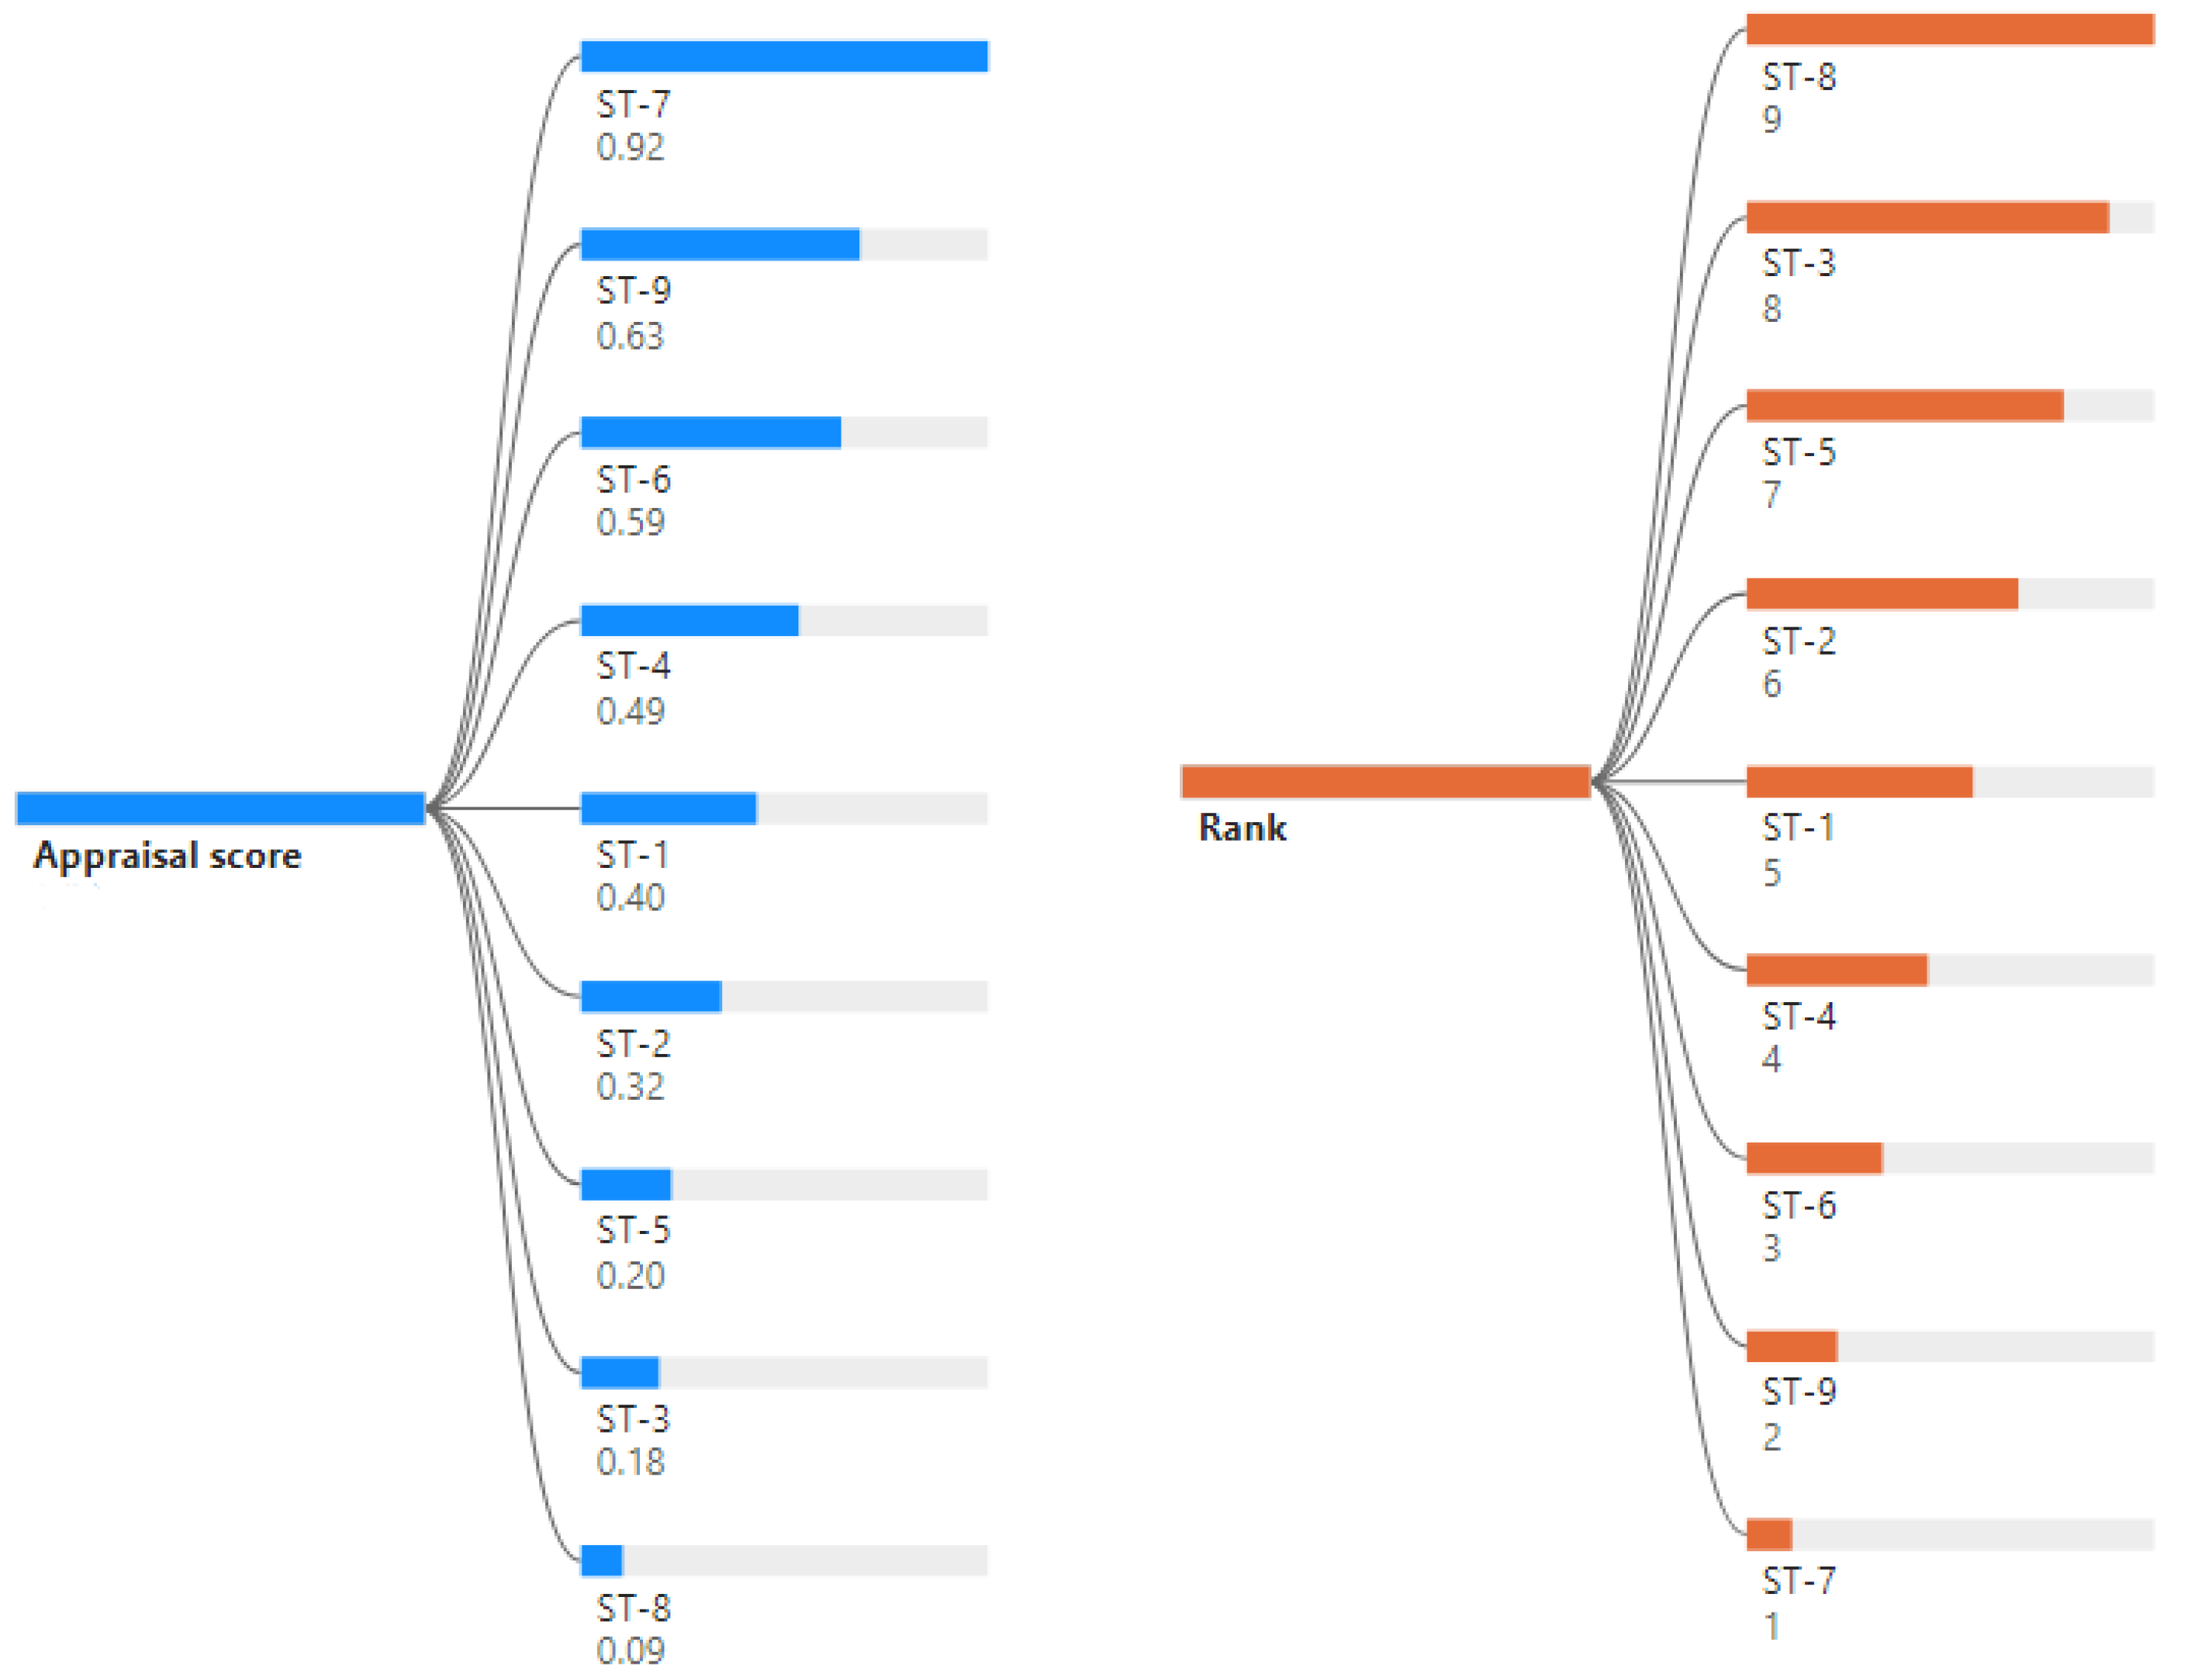
Figure 5.
The proportion of short-term impacts and long-term impacts.
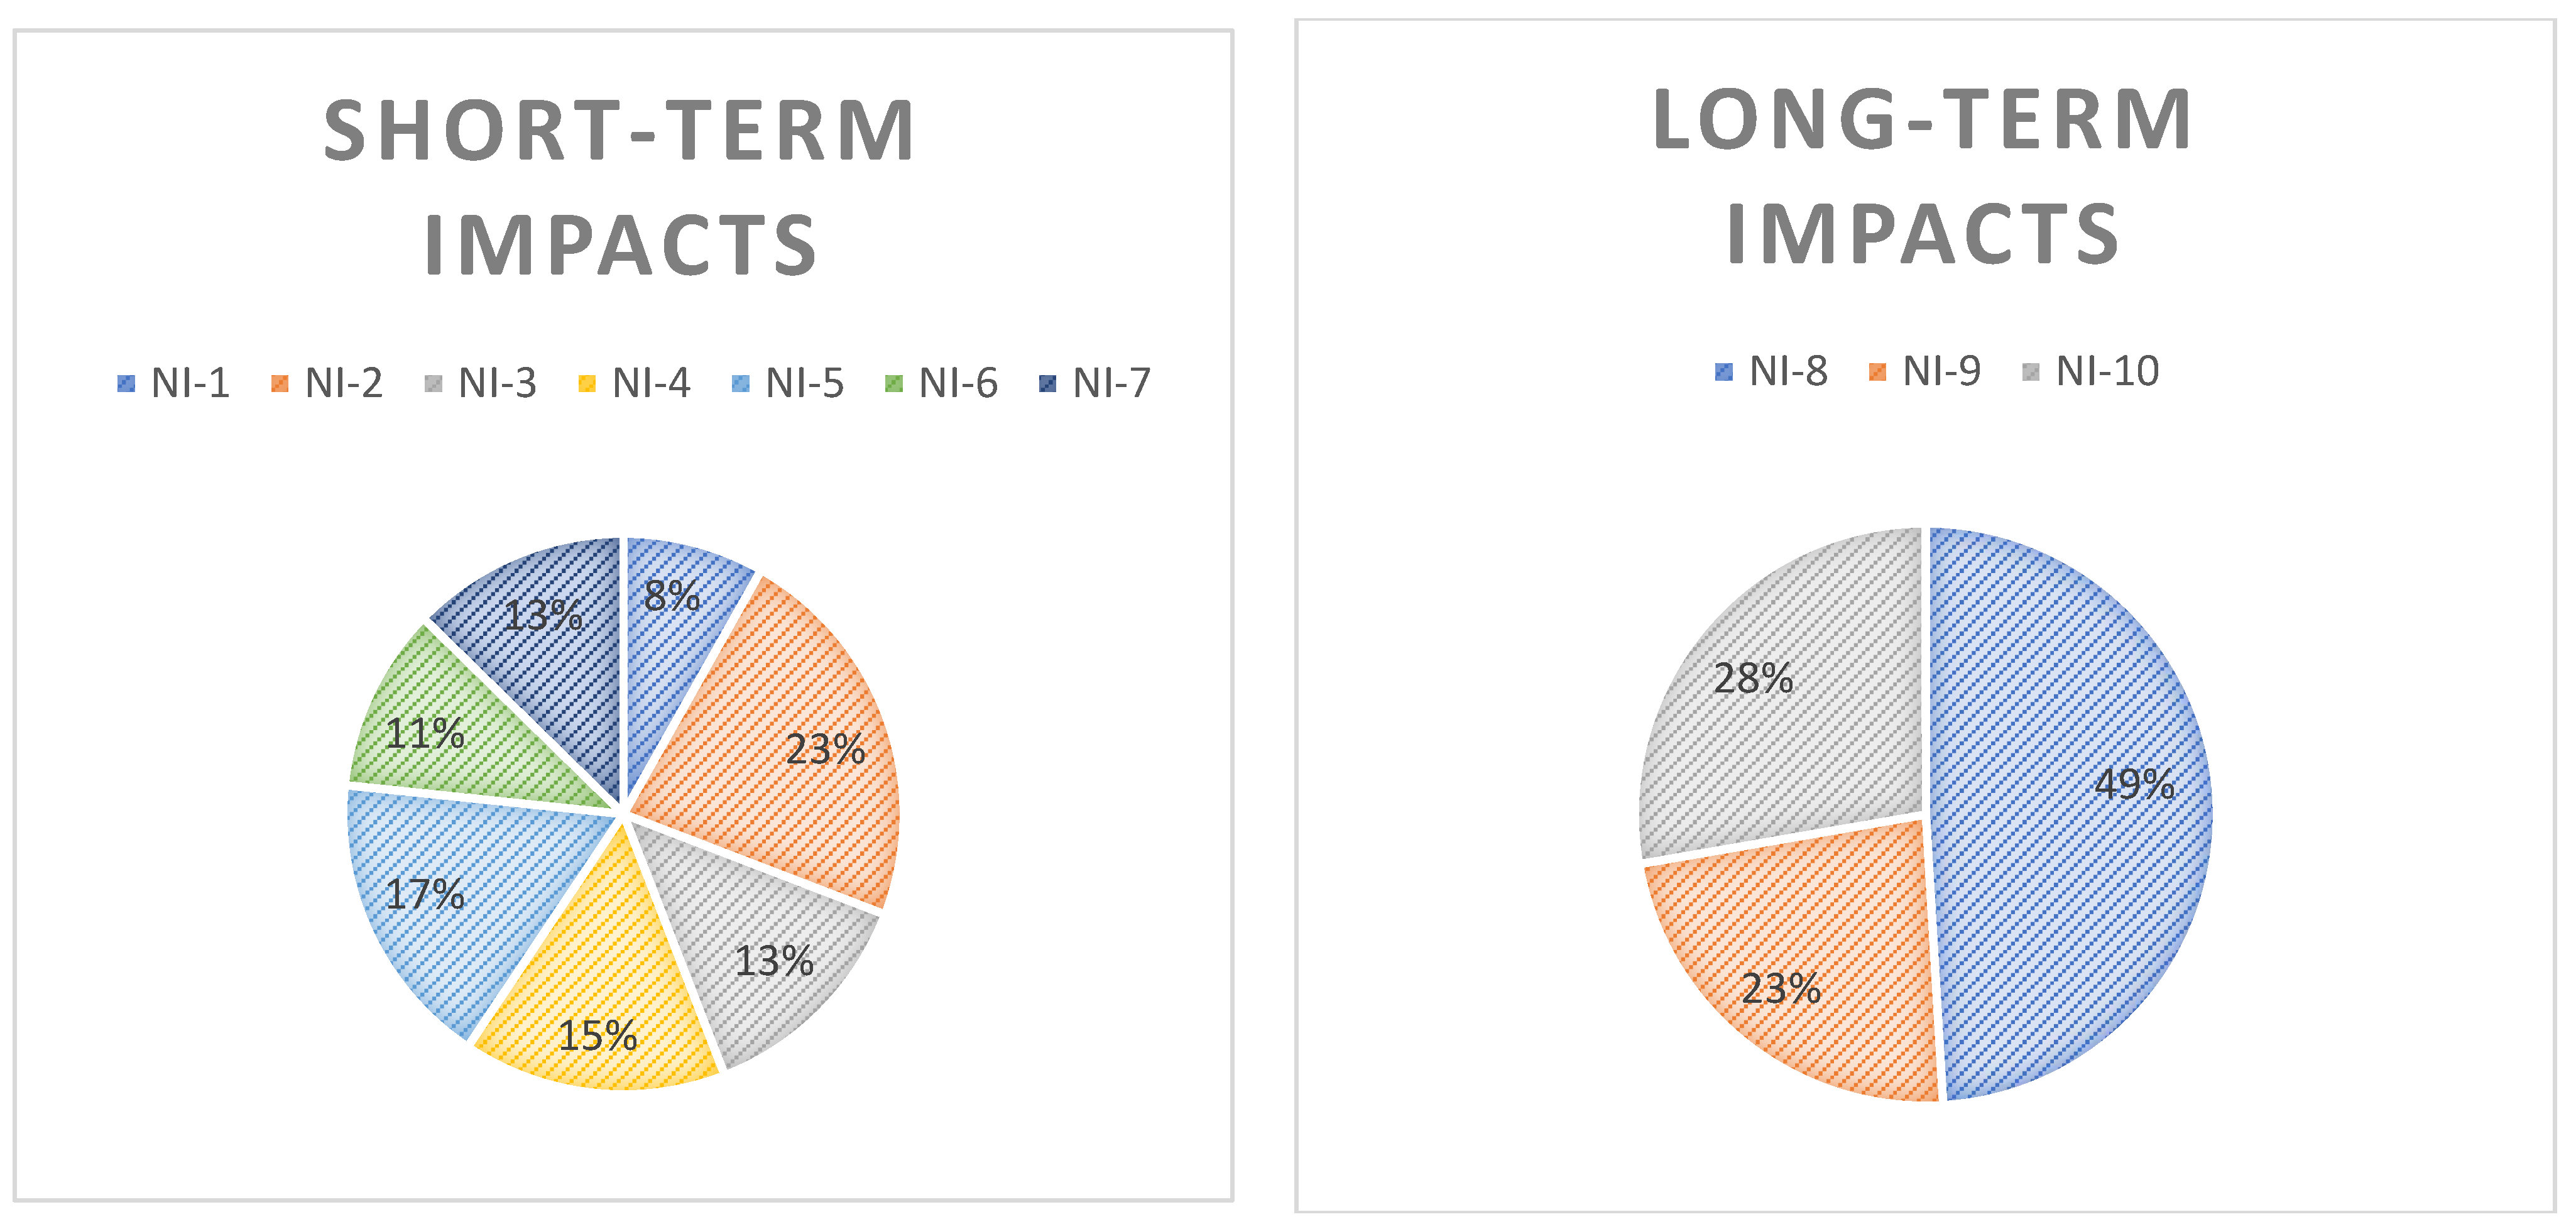
Figure 6.
Scenarios’ weighting structure.

Figure 7.
Strategy rank according to scenarios.
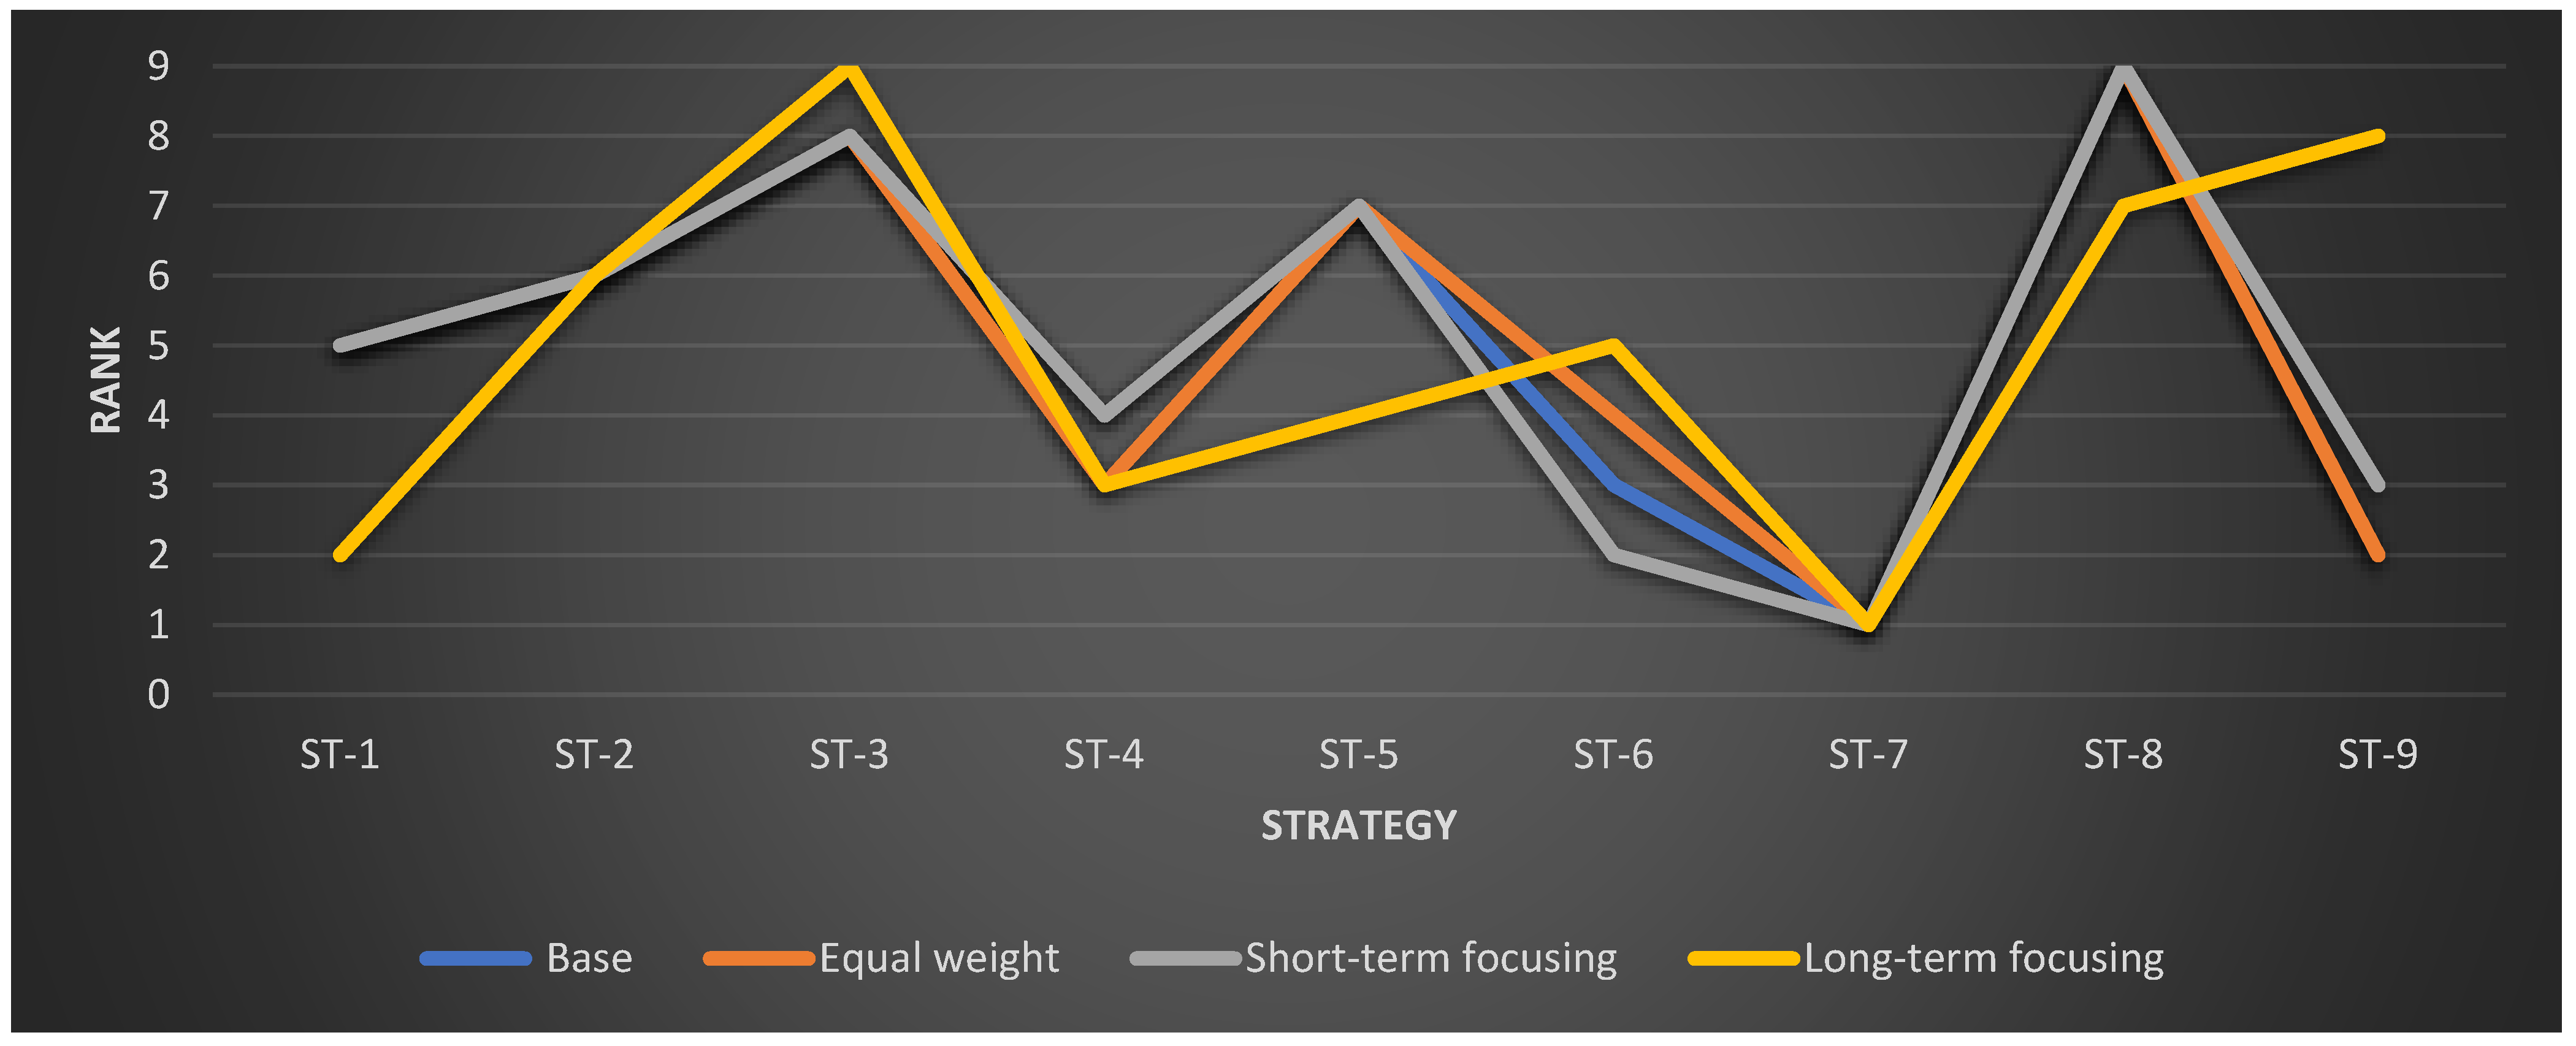
Table 1.
Post-COVID-19 production strategy related works.
| No. | Authors | Year | Industry | Country/Region | Factor Focusing |
|---|---|---|---|---|---|
| 1 | Chowdhury et al. [19] | 2020 | Food and beverage | Bangladesh | Economic |
| 2 | Abubakar [1] | 2020 | Hospitality | Global | Economic |
| 3 | Chiaramonti and Maniatis [20] | 2020 | Renewable and recycled carbon fuels | Europe | Economic and environmental |
| 4 | Farias et al. [21] | 2021 | Fertilizer | Brazil | Cooperation |
| 5 | Ibn-Mohammed et al. [22] | 2021 | Cross-industry | Global | Economic |
| 6 | Alkahtani et al. [22] | 2021 | Cross-industry | Global | Environmental |
| 7 | Chofreh et al. [15] | 2021 | Energy supply | Global | Environmental |
| 8 | Ilyasa et al. [23] | 2021 | Automotive | Global | Environmental |
| 9 | Yao [14] | 2021 | Cross-industry | China | Environmental and economic |
| 10 | Marimuthu et al. [4] | 2021 | Mining | India | Environmental |
| 11 | Peng et al. [11] | 2021 | Cross-industry | China | Technology |
| 12 | Ferrannini et al. [24] | 2021 | Cross-industry | Global | Human resources |
| 13 | Caballero-Morales [3] | 2021 | Cross-industry | Global | Technology |
| 14 | Belhadi et al. [13] | 2021 | Automobile and airline | China | Technology |
| 15 | Ali et al. [25] | 2021 | Food and beverage | Global | Economic |
| 16 | D’Adamo andLupi [26] | 2021 | Fashion | Global | Environment |
Table 2.
MCDM method application review.
| No. | Authors | Year | Method | Fuzzy Set Application | Mathematical Model |
|---|---|---|---|---|---|
| 1 | Taqi et al. [30] | 2020 | Grey digraph-matrix | ||
| 2 | Samanlioglu and Kaya [32] | 2020 | AHP | X | |
| 3 | Kaya [33] | 2020 | MABAC-WASPAS | ||
| 4 | Ilyas et al. [23] | 2021 | BWM-TOPSIS | X | X |
| 5 | Yao [14] | 2021 | AHP-VIKOR | X | |
| 6 | Alkahtani et al. [22] | 2021 | LP | X | |
| 7 | Marimuthu et al. [4] | 2021 | COPRAS | X | |
| 8 | Paul et al. [29] | 2021 | Grey-DEMATEL | ||
| 9 | Taddese et al. [34] | 2021 | AHP-VIKOR | ||
| 10 | Ahmad et al. [35] | 2021 | BWM | ||
| 11 | Alkan and Kahraman [36] | 2021 | TOPSIS | X | |
| 12 | Mohammed et al. [37] | 2021 | DEMATEL | ||
| 13 | Ghaffar et al. [38] | 2021 | BWM | ||
| 14 | Wang et al. [31] | 2022 | LP | X | X |
| 15 | Wang et al. [39] | 2022 | BWM-TODIM | X | |
| 16 | Chodha et al. [40] | 2022 | TOPSIS-Entropy | ||
| 17 | Zeng et al. [41] | 2022 | AHP | X |
Note: Multi-Attributive Border Approximation Area Comparison (MABAC); Weighted Aggregated Sum Product Assessment (WASPAS); Linear Programming (LP).
Table 3.
Sets, parameters, and variables of the OPA method.
| Sets | |
|---|---|
| Indexes | |
| ) | |
| ) | |
| Variables | |
| Objective function | |
Table 4.
Comparison of the Ordinal Priority Approach and other MCDM methods.
| Characteristic | AHP | DEMATEL | TOPSIS | COPRAS | BWM | OPA |
|---|---|---|---|---|---|---|
| Year | 1972 | 1976 | 1981 | 1994 | 2015 | 2020 |
| Pairwise comparison | Required | Required | No | No | Required | No |
| Decision matrix | No | No | Required | Required | No | No |
| Normalization | No | No | Required | Required | No | No |
| Experts’ opinion aggregation | Required | Required | Required | Required | No | No |
| Are experts allowed to evaluate only those criteria they consider critical instead of all? | No | No | No | No | No | Yes |
| Is it necessary to distinguish between benefit and non-benefit criteria? | No | No | Yes | Yes | No | No |
| Are the results optimized by the mathematical model? | No | No | No | No | Yes | Yes |
| Is it possible to determine the weights of criteria by themselves? | Yes | Yes | No | No | Yes | Yes |
Table 5.
Fuzzy EDAS evaluation linguistic judgment for the degree of influence.
| Linguistic Judgment | TFNs |
|---|---|
| None (N) | (1, 1, 2) |
| Low (L) | (1, 2, 3) |
| Insignificant (I) | (2, 3, 4) |
| Lower Medium (LM) | (3, 4, 5) |
| Medium (M) | (4, 5, 6) |
| Upper Medium (UM) | (5, 6, 7) |
| Significant (S) | (6, 7, 8) |
| High (H) | (7, 8, 9) |
| Extreme (E) | (8, 9, 9) |
Table 6.
Expert’s qualification and rank.
| Expert | Level of Education (Highest Degree) | Experience (in Year) | Rank |
|---|---|---|---|
| EP-1 | Master | 6 years | 5 |
| EP-2 | Doctoral | 7 years | 2 |
| EP-3 | Doctoral | 10 years | 1 |
| EP-4 | Doctoral | 5 years | 3 |
| EP-5 | Bachelor | 8 years | 6 |
| EP-6 | Master | 7 years | 4 |
| EP-7 | Master | 3 years | 7 |
| EP-8 | Bachelor | 10 years | 5 |
| EP-9 | Bachelor | 6 years | 9 |
| EP-10 | Bachelor | 7 years | 8 |
Table 7.
List of pandemic negative impacts.
| Notation | Impact | Reference |
|---|---|---|
| NI-1 | Shortage of manufacturing energy | [53,54] |
| NI-2 | Shortage of raw material | [9,55] |
| NI-3 | Shortage of working capital | [9,19] |
| NI-4 | Orders cancellations | [9,55,56] |
| NI-5 | Shortage of operation and maintenance workers | [9,30] |
| NI-6 | Unstable delivery | [9,55] |
| NI-7 | Technology transfer activities are suspended | Proposed by Experts |
| NI-8 | The supply chain restructuring | [19,55] |
| NI-9 | Increased degree of job cuts | [9,19,30,55] |
| NI-10 | Instability of public policies | [55] |
Table 8.
The rank of negative impacts by each expert.
| Expert | Impact | |||||||||
|---|---|---|---|---|---|---|---|---|---|---|
| NI-1 | NI-2 | NI-3 | NI-4 | NI-5 | NI-6 | NI-7 | NI-8 | NI-9 | NI-10 | |
| EP-1 | 3 | 1 | 5 | 7 | 4 | 8 | 6 | 6 | 2 | 5 |
| EP-2 | 6 | 1 | 2 | 9 | 3 | 4 | 7 | 8 | 5 | 7 |
| EP-3 | 7 | 2 | 7 | 2 | 3 | 4 | 6 | 1 | 8 | 5 |
| EP-4 | 8 | 2 | 1 | 3 | 1 | 4 | 1 | 6 | 5 | 7 |
| EP-5 | 6 | 4 | 8 | 2 | 3 | 3 | 1 | 7 | 4 | 5 |
| EP-6 | 2 | 7 | 8 | 5 | 4 | 4 | 1 | 6 | 4 | 3 |
| EP-7 | 6 | 2 | 1 | 3 | 5 | 9 | 4 | 7 | 8 | 1 |
| EP-8 | 2 | 4 | 7 | 1 | 3 | 5 | 6 | 7 | 9 | 8 |
| EP-9 | 4 | 2 | 1 | 2 | 2 | 5 | 7 | 6 | 3 | 4 |
| EP-10 | 4 | 1 | 3 | 6 | 2 | 2 | 7 | 3 | 5 | 8 |
Table 9.
Expert’s weight according to OPA results.
| Expert | OPA Weight | Expert | OPA Weight |
|---|---|---|---|
| EP-1 | 0.0581 | EP-6 | 0.0782 |
| EP-2 | 0.1501 | EP-7 | 0.0541 |
| EP-3 | 0.3196 | EP-8 | 0.0600 |
| EP-4 | 0.1434 | EP-9 | 0.0389 |
| EP-5 | 0.0539 | EP-10 | 0.0438 |
Table 10.
Potential Post-COVID-19 production strategies.
| Group | Notation | Strategy | Description |
|---|---|---|---|
| Workforce related | ST-1 | Workforce reduction [57] | Maintaining a skilled and low-scale workforce will make manufacturers leaner and more resilient to survive |
| ST-2 | Job rotation [4] | Implement job rotation plans between on-site and off-site working | |
| ST-3 | Rapidly and low-cost human resource management [25] | Standardizing and optimizing HR operations can make re-hiring operations faster and less expensive | |
| Collaboration related | ST-4 | Comprehensive multi-party cooperation [4] | Strengthen cross-sector collaboration between businesses, communities, and governments to support recovery |
| ST-5 | Short-term incentives for distributors [19] | Short-term incentives can help increase cash flow, sales, and maintain relationships with distributors | |
| Technology-related | ST-6 | Online infrastructure construction [19] | Strengthen human resource training and deploy online working platforms |
| ST-7 | Digitalization and automation [55] | Increase digitization of operations, management, and manufacturing. Accelerate investment to rapidly increase the level of automation of manufacturing systems. | |
| ST-8 | Fintech applications [58] | Deploy applications of finance technology to financial activities. | |
| Environmental related | ST-9 | Renewable energy conversion [53,54] | Developing direct use renewable energy systems for stability manufacturing |
Table 11.
Integrated fuzzy decision matrix.
| Strategy | Impact | ||||
|---|---|---|---|---|---|
| NI-1 | NI-2 | NI-3 | NI-4 | NI-5 | |
| ST-1 | (2.705, 3.591, 4.591) | (4.146, 4.889, 5.845) | (4.175, 5.117, 6.073) | (3.722, 4.402, 5.284) | (4.195, 5.137, 6.093) |
| ST-2 | (4.350, 5.297, 6.114) | (3.660, 4.484, 5.341) | (4.645, 5.645, 6.591) | (4.251, 5.139, 6.139) | (2.908, 3.588, 4.476) |
| ST-3 | (4.901, 5.549, 6.132) | (3.277, 3.906, 4.862) | (5.342, 6.342, 7.245) | (2.97, 3.651, 4.591) | (5.671, 6.671, 7.521) |
| ST-4 | (5.237, 6.125, 6.751) | (3.438, 4.228, 5.228) | (5.680, 6.680, 7.483) | (5.908, 6.908, 7.545) | (3.071, 4.017, 5.017) |
| ST-5 | (3.300, 3.920, 4.823) | (3.825, 4.427, 5.323) | (3.808, 4.691, 5.541) | (3.194, 4.082, 4.938) | (5.137, 6.137, 7.137) |
| ST-6 | (3.395, 4.076, 5.076) | (4.699, 5.645, 6.502) | (4.010, 4.867, 5.717) | (4.006, 4.796, 5.742) | (6.192, 7.192, 7.723) |
| ST-7 | (3.266, 3.903, 4.825) | (4.956, 5.859, 6.815) | (5.461, 6.461, 7.318) | (4.834, 5.795, 6.795) | (5.765, 6.726, 7.407) |
| ST-8 | (3.029, 4.029, 4.975) | (4.399, 5.285, 6.207) | (4.632, 5.632, 6.632) | (3.305, 4.043, 5.043) | (2.619, 3.430, 4.430) |
| ST-9 | (6.614, 7.554, 8.102) | (5.225, 6.225, 6.852) | (6.077, 7.077, 7.895) | (3.019, 3.959, 4.816) | (5.122, 6.064, 6.744) |
| Strategy | NI-6 | NI-7 | NI-8 | NI-9 | NI-10 |
| ST-1 | (5.477, 6.327, 6.953) | (2.761, 3.383, 4.383) | (5.481, 6.481, 7.28) | (4.640, 5.596, 6.393) | (4.781, 5.781, 6.623) |
| ST-2 | (5.814, 6.756, 7.702) | (3.726, 4.668, 5.569) | (5.030, 6.030, 6.937) | (3.106, 3.880, 4.880) | (3.151, 4.151, 5.151) |
| ST-3 | (3.430, 4.232, 5.056) | (3.444, 4.301, 5.247) | (3.553, 4.514, 5.514) | (3.080, 3.707, 4.653) | (3.867, 4.493, 5.232) |
| ST-4 | (2.651, 3.501, 4.501) | (5.572, 6.514, 7.156) | (4.528, 5.429, 6.375) | (3.943, 4.943, 5.688) | (4.001, 5.001, 5.858) |
| ST-5 | (3.191, 3.993, 4.993) | (3.337, 4.284, 5.284) | (3.649, 4.355, 5.312) | (5.460, 6.382, 7.178) | (5.169, 6.169, 6.987) |
| ST-6 | (3.471, 4.268, 5.155) | (5.875, 6.875, 7.413) | (3.951, 4.951, 5.951) | (2.661, 3.453, 4.399) | (5.169, 6.026, 6.947) |
| ST-7 | (3.588, 4.545, 5.280) | (3.830, 4.830, 5.830) | (6.206, 7.206, 7.944) | (6.405, 7.405, 7.942) | (5.413, 6.413, 7.236) |
| ST-8 | (4.664, 5.664, 6.586) | (3.115, 3.717, 4.717) | (2.872, 3.553, 4.553) | (5.211, 6.061, 6.858) | (4.476, 5.417, 6.314) |
| ST-9 | (3.870, 4.870, 5.720) | (5.736, 6.586, 7.005) | (2.722, 3.382, 4.328) | (3.126, 4.126, 5.072) | (4.551, 5.551, 6.257) |
Table 12.
The fuzzy average solution according to impacts .
| Impact | |||||
| NI-1 | NI-2 | NI-3 | NI-4 | NI-5 | |
| Value | (4.089, 4.894, 5.710) | (4.181, 4.994, 5.886) | (4.870, 5.835, 6.722) | (3.912, 4.753, 5.655) | (4.520, 5.440, 6.283) |
| NI-6 | NI-7 | NI-8 | NI-9 | NI-10 | |
| Value | (4.017, 4.906, 5.772) | (4.155, 5.018, 5.845) | (4.221, 5.100, 6.022) | (4.181, 5.061, 5.896) | (4.509, 5.445, 6.289) |
Table 13.
The fuzzy weighted sum of positive and negative distances.
| Strategy | ||
|---|---|---|
| ST-1 | (0.048, 0.064, 0.073) | (0.060, 0.081, 0.085) |
| ST-2 | (0.059, 0.066, 0.073) | (0.082, 0.101, 0.117) |
| ST-3 | (0.039, 0.047, 0.056) | (0.104, 0.129, 0.136) |
| ST-4 | (0.091, 0.120, 0.136) | (0.071, 0.091, 0.112) |
| ST-5 | (0.037, 0.040, 0.044) | (0.093, 0.115, 0.122) |
| ST-6 | (0.083, 0.110, 0.123) | (0.046, 0.058, 0.067) |
| ST-7 | (0.148, 0.181, 0.204) | (0.017, 0.022, 0.029) |
| ST-8 | (0.030, 0.033, 0.036) | (0.108, 0.141, 0.156) |
| ST-9 | (0.102, 0.146, 0.163) | (0.058, 0.068, 0.084) |
Table 14.
The normalized fuzzy weighted sum of positive and negative distances.
| Strategy | ||
|---|---|---|
| ST-1 | (0.267, 0.360, 0.431) | (0.428, 0.448, 0.455) |
| ST-2 | (0.326, 0.356, 0.447) | (0.241, 0.252, 0.285) |
| ST-3 | (0.214, 0.276, 0.319) | (0.034, 0.087, 0.132) |
| ST-4 | (0.501, 0.668, 0.810) | (0.286, 0.345, 0.352) |
| ST-5 | (0.203, 0.216, 0.267) | (0.137, 0.186, 0.219) |
| ST-6 | (0.460, 0.606, 0.738) | (0.574, 0.574, 0.586) |
| ST-7 | (0.819, 1,000, 1.221) | (0.814, 0.841, 0.842) |
| ST-8 | (0.166, 0.174, 0.225) | (0.000, 0.000, 0.000) |
| ST-9 | (0.562, 0.801, 0.983) | (0.464, 0.466, 0.517) |
Table 15.
The fuzzy appraisal score, defuzzied appraisal score, and strategy rank.
| Strategy | Rank | ||
|---|---|---|---|
| ST-1 | (0.347, 0.404, 0.443) | 0.3982 | 5 |
| ST-2 | (0.284, 0.304, 0.366) | 0.3180 | 6 |
| ST-3 | (0.124, 0.182, 0.226) | 0.1771 | 8 |
| ST-4 | (0.393, 0.506, 0.581) | 0.4937 | 4 |
| ST-5 | (0.170, 0.201, 0.243) | 0.2047 | 7 |
| ST-6 | (0.517, 0.590, 0.662) | 0.5896 | 3 |
| ST-7 | (0.816, 0.921, 1.032) | 0.9230 | 1 |
| ST-8 | (0.083, 0.087, 0.113) | 0.0943 | 9 |
| ST-9 | (0.513, 0.634, 0.750) | 0.6321 | 2 |
Table 16.
Comparison of ranking results with other MCDM methods.
| Strategy | OPA-Fuzzy EDAS | OPA-Fuzzy TOPSIS | OPA-Fuzzy VIKOR |
|---|---|---|---|
| ST-1 | 5 | 5 | 4 |
| ST-2 | 6 | 6 | 6 |
| ST-3 | 8 | 8 | 9 |
| ST-4 | 4 | 4 | 5 |
| ST-5 | 7 | 7 | 7 |
| ST-6 | 3 | 3 | 2 |
| ST-7 | 1 | 1 | 1 |
| ST-8 | 9 | 9 | 8 |
| ST-9 | 2 | 2 | 3 |
Table 17.
Negative impact weighting according to scenarios.
| Impact | Scenario Base | Scenario 1 | Scenario 2 | Scenario 3 |
|---|---|---|---|---|
| NI-1 | 0.063 | 0.100 | 0.057 | 0.025 |
| NI-2 | 0.174 | 0.100 | 0.159 | 0.068 |
| NI-3 | 0.102 | 0.100 | 0.093 | 0.040 |
| NI-4 | 0.117 | 0.100 | 0.107 | 0.046 |
| NI-5 | 0.133 | 0.100 | 0.121 | 0.052 |
| NI-6 | 0.082 | 0.100 | 0.075 | 0.032 |
| NI-7 | 0.098 | 0.100 | 0.089 | 0.038 |
| NI-8 | 0.113 | 0.100 | 0.147 | 0.343 |
| NI-9 | 0.054 | 0.100 | 0.070 | 0.163 |
Publisher’s Note: MDPI stays neutral with regard to jurisdictional claims in published maps and institutional affiliations. |
© 2022 by the authors. Licensee MDPI, Basel, Switzerland. This article is an open access article distributed under the terms and conditions of the Creative Commons Attribution (CC BY) license (https://creativecommons.org/licenses/by/4.0/).
Share and Cite
MDPI and ACS Style
Le, M.-T.; Nhieu, N.-L. A Novel Multi-Criteria Assessment Approach for Post-COVID-19 Production Strategies in Vietnam Manufacturing Industry: OPA–Fuzzy EDAS Model. Sustainability 2022, 14, 4732. https://doi.org/10.3390/su14084732
AMA Style
Le M-T, Nhieu N-L. A Novel Multi-Criteria Assessment Approach for Post-COVID-19 Production Strategies in Vietnam Manufacturing Industry: OPA–Fuzzy EDAS Model. Sustainability. 2022; 14(8):4732. https://doi.org/10.3390/su14084732
Chicago/Turabian StyleLe, Minh-Tai, and Nhat-Luong Nhieu. 2022. "A Novel Multi-Criteria Assessment Approach for Post-COVID-19 Production Strategies in Vietnam Manufacturing Industry: OPA–Fuzzy EDAS Model" Sustainability 14, no. 8: 4732. https://doi.org/10.3390/su14084732
Note that from the first issue of 2016, this journal uses article numbers instead of page numbers. See further details here.