Article

Spatiotemporal Variations in Grassland Vulnerability on the Qinghai-Tibet Plateau Based on a Comprehensive Framework

1
State Key Laboratory of Urban and Regional Ecology, Research Center for Eco-Environmental Sciences, Chinese Academy of Sciences, Beijing 100085, China
2
College of Resources and Environment, University of Chinese Academy of Sciences, Beijing 100049, China
*
Author to whom correspondence should be addressed.
Sustainability 2022, 14(9), 4912; https://doi.org/10.3390/su14094912
Submission received: 25 March 2022 / Revised: 17 April 2022 / Accepted: 18 April 2022 / Published: 19 April 2022
(This article belongs to the Section Environmental Sustainability and Applications)

Abstract

:
Grasslands are globally important for providing essential ecosystem services and maintaining ecological security. Monitoring and assessing grassland vulnerability are critical for developing long-term grassland management policies and strategies. The grassland vulnerability on the Qinghai-Tibet Plateau (QTP) is considered high, but its spatial and temporal variations in response to human activities and climate change are not well understood. In this study, a comprehensive grassland vulnerability index (GVI), which includes natural factors (VNF), environmental disturbances (VED), and socioeconomic impacts (VSI), was developed by using the analytic hierarchy process (AHP), principal component analysis (PCA), and environmental vulnerability distance index (EVDI). Our results showed that the spatial distribution of GVI had obvious heterogeneity, decreasing from northwest to southeast; the regions with serious and extreme vulnerability were mainly concentrated in the north-western alpine steppe and desert steppe. From 2000 to 2018, GVI decreased from 0.61 in 2000 to 0.60 in 2010 and then to 0.59 in 2018, demonstrating a healthy tendency. The normalized difference vegetation index (NDVI), land desertification, and population were the factors that had the most significant impact on VNF, VED, and VSI, respectively. The global Moran’s I index of grassland vulnerability was greater than 0, with a significant positive spatial correlation. The number of High-High and Low-Low units decreased, indicating that the High-High and Low-Low cluster regions tended to be discrete. Moreover, our results suggest that understanding the variations in grassland vulnerability on the QTP is important for regional sustainable development in the context of intensified climate change and human disturbances.

1. Introduction

The assessment of ecosystem vulnerability, which focuses on the potential consequences of disruptions, has become a key issue in global change ecology and sustainability studies [1,2,3]. Climate change presents numerous challenges to global ecosystems, including ecosystem degradation, biodiversity loss, and land desertification, all of which are expected to become more frequent and intense in the future, especially for the sensitive and vulnerable grassland ecosystem [4,5]. The grassland ecosystem provides feed for grazing livestock as well as a food supply and a source of income for over 800 million people [6]. It also provides numerous key ecosystem functions (e.g., absorbing the carbon dioxide (CO2) stored underground, boosting the carbon sink capacity of ecosystems, and providing the rich animal and plant gene bank) [4,7,8]. In summary, the assessment of grassland vulnerability is vital and can be used as a key factor in possible ecological issues [9,10].
Assessing grassland vulnerability has become an essential prerequisite and important foundation for grassland management decision-making. Currently, research on vulnerability assessment is dominated by case studies. Some scholars have focused on different scales of study regions, mainly including countries [11,12], geographical areas [13,14], provinces [15], and cities [10,16]. Based on the characteristics of the study region, multiple methods have been proposed and used, such as the analytic hierarchy process (AHP) [17,18], principal component analysis (PCA) [19], spatial principal component analysis (SPCA) [20,21], environmental vulnerability distance index (EVDI) [22], grey system evaluation method [23], and other techniques. In addition, the selection of the assessment framework is one of the crucial links but does not form a set of standard frameworks among ecosystems so far, especially in grasslands. The selection of indicators is highly subjective and arbitrary. Sensitivity-resilience-pressure (SRP) [15,24], pressure-state-response (PSR) [25], and driver-pressure-state-impact-response (DPSIR) [26,27] are the most commonly used frameworks. Meanwhile, to better understand the spatial and temporal changes in vulnerability, it is necessary to explore the spatial differentiation characteristics of vulnerability. Spatial autocorrelation is useful for analysing spatial dependence and identifying high-vulnerability concentrations. However, the existing research is not without flaws. First, the framework takes full account of the natural conditions of the study area; however, the impact of socioeconomic and natural disasters, which are important components of vulnerability, have not been considered. Second, the subjective analysis methods represented by AHP depend on experts’ previous expertise and experience, making it difficult to prevent a certain degree of subjectivity. Objective analysis methods represented by PCA and EVDI are prone to information loss. Therefore, the combination of subjective and objective analysis methods is required to calculate the vulnerability weights. Finally, because of regional environmental variances, assessing vulnerability over wide regions is a challenging and complex task [22]. Therefore, a vulnerability assessment can be carried out by selecting an ecosystem as the study scale.
With high elevations, low temperatures, rare precipitation, simple ecosystem structure, limited resilience, and vulnerability to environmental changes, the Qinghai-Tibet Plateau (QTP) is one of the most sensitive and vulnerable regions in China [28,29]. The grassland ecosystem accounts for the largest proportion of the ecosystem, and most grasslands have experienced rapid warming in recent decades, at a rate almost three times the global warming rate [30,31,32]. Warmer temperatures, fluctuations in temperature and precipitation, shrinking glaciers, and melting frozen soil are causing significant ecosystem degradation, including land desertification, freeze–thaw erosion, and grassland degradation [30,33]. Furthermore, the intensification of human activities, such as overgrazing and incorrect land usage, has harmed the surrounding environment [34]. These factors are likely to make grassland ecosystems on the QTP more vulnerable, presenting a severe danger to ecological security and regional sustainability [1]. In summary, it is critical to understand and assess grassland vulnerability under climate change and anthropogenic influences, as it helps planners and decision-makers in conservation planning and environmental management.
In this study, we established a comprehensive framework with vulnerability by natural factors (VNF), vulnerability by environmental disturbances (VED), and vulnerability by socioeconomic impacts (VSI), combined with AHP–PCA–EVDI, to assess the grassland vulnerability on the QTP from 2000 to 2018. Because of the poor natural conditions, serious natural disasters, and intense human activities, the research area was an appropriate region to assess grassland vulnerability. The objectives of this study were to:
(1)
Establish a comprehensive framework for grassland vulnerability assessment.
(2)
Analyse spatiotemporal changes in grassland vulnerability on the QTP.
(3)
Explore spatial autocorrelation and detect its driving factors.

2. Materials and Methods

2.1. Study Area

The Qinghai-Tibet Plateau, covering about one-fourth of the total area of China (2.5 × 10⁶ km2), is called the Third Pole. With an average elevation of more than 4000 metres, it is geomorphologically the largest and highest plateau on Earth [31]. It lies from 26° to 39° north latitude and 73° to 104° east longitude, covering Tibet and the Xinjiang Uygur Autonomous Regions and the Qinghai, Gansu, Sichuan, and Yunnan Provinces. Under the influence of the Asian monsoon, the plateau is also the source of nine large rivers, supplying billions of people downstream with freshwater, adequate food, and other ecosystem services [35,36]. Meanwhile, because of the unique and complex interactions between the atmosphere, cryosphere, hydrology, and geology, the region is highly vulnerable to environmental changes [33]. In the last century, environmental conditions have changed dramatically. The air temperature on the QTP has warmed dramatically faster than the global average [35,37]. These changes may cause glacier retreat [38,39], snow cover change [33,40], and permafrost melting [41], and drive environmental changes at local, regional, and even global scales.
Grassland is the dominant vegetation type across the QTP, which covers approximately 15.3 × 10⁵ km2 and accounts for 59.15% of the total QTP area. It is one of the most important pasture regions in China and even in Asia [42]. It is also vital for livestock husbandry and environmental security [1]. From southeast to northwest, given the influence of plateau climate changes, the grassland types change from alpine meadow to alpine steppe to desert steppe (Figure 1).

2.2. Framework for GVI Assessment

Ecosystem vulnerability assessment is a complicated procedure that focuses on the relationship between environmental conditions and human interference [15,28]. Based on comprehensive analyses of the vulnerability of grassland, we accepted a novel framework presented by Sun et al. [28], which divided vulnerability into three subsystems, namely, vulnerability by natural factors (VNF), vulnerability by environmental disturbances (VED), and vulnerability by socioeconomic impacts (VSI), and was successfully used in assessing forest vulnerability on the QTP. Based on the characteristics of grasslands and the novel framework, we selected 13 indicators, considering the operability and availability, and built a framework of VNF–VED–VSI (Table 1).
Natural factors can directly reflect ecological and environmental changes, which are vital for vulnerability evaluation [28]. Temperature and precipitation can impact the biodiversity and quality of the environment. Differences in elevation and slope change the topographical features. Indicators, including annual average temperature, annual average precipitation, elevation, slope, soil organic matter content, and the normalized difference vegetation index (NDVI), were chosen to characterize vulnerability by natural factors.
The QTP is vulnerable to environmental disturbances and natural disasters. The occurrence of freeze–thaw erosion, land desertification, landslides, and grazing pressure causes serious and direct damage to grasslands. Therefore, it is an important foundation for assessing the risk of grassland vulnerability [28].
Vulnerability by socioeconomic impact indicators is selected to quantify anthropic pressures across the QTP because human activities significantly change the evolution of environmental characteristics [28,34]. With the population increase and rapid economic development, socioeconomic activities (e.g., grazing and land cover changes) modify the vulnerability and increase such uncertainties [30]. Population, gross domestic product (GDP), and actual livestock are selected. Population and GDP can directly reflect human disturbance and economic activities, and actual livestock can reflect the pressure of the livestock industry on the grassland ecosystem.

2.3. Data Collection and Approaches

In this paper, the data used mainly included remote sensing, socioeconomic, and meteorological data. Meteorological datasets were obtained from the National Earth System Science Data Centre, National Science and Technology Infrastructure of China (http://www.geodata.cn/ (accessed on 10 August 2021)) and consisted of the annual average temperature data and annual average precipitation data in 2000, 2010, and 2018, with a spatial resolution of 1000 m. A digital elevation model (DEM) and slope data were derived from the sharing platform Geospatial Data Cloud (http://www.gscloud.cn/ (accessed on 26 August 2021)), with a spatial resolution of 90 m. Soil organic matter content was provided by the Harmonized World Soil Database (HWSD), Food and Agriculture Organization of the United Nations (https://www.fao.org/ (accessed on 10 August 2021)), with a spatial resolution of 1000 m. Grazing pressure and actual livestock datasets for 2000, 2010, and 2018 were obtained from the Qinghai-Tibet Plateau ecosystem data integration platform (http://www.gscloud.cn/qtp/qtpecosys/ (accessed on 2 September 2021)) with a spatial resolution of 1000 m. GDP, population, and NDVI data in 2000, 2010, and 2018 were obtained from the Resources and Environmental Sciences and Data Centre (http://www.resdc.cn/ (accessed on 21 August 2021)), with a spatial resolution of 1000 m (population and GDP in 2015 were adopted as assessments in 2018).
Multiple factors were selected for the freeze–thaw erosion vulnerability assessment, including the annual temperature range, annual average precipitation, slope, aspect, and vegetation coverage. Based on previous research, we built an evaluation index system and weighted assignment of different factors using the weighted average method to calculate the impact of freeze–thaw erosion on grassland [43]. In the present study, the vulnerability of landslides was calculated by analysing hazard factors (population, slope, elevation, distance to roads, and distance to streams). Following the method of previous studies with some additions, we quantified the index and assigned weight values, forming a map of landslide vulnerability with ArcGIS 10.2 [28,44]. The NDVI is an index that can accurately assess the status, change, and trends of desertification [45]. Therefore, we used NDVI to reflect the vulnerability of land desertification based on previous research [17,45].
In light of the relationship between grassland vulnerability and evaluation factors, indicators were classified as positive or negative indicators. When the grassland vulnerability index values increased, the positively correlated indicators increased and the negatively correlated indicators decreased [15]. To reduce the influence of differences among various factors, we used the maximum-minimum standardization method so that the indicator values ranged between 0 and 1 [13,46]. The indicators were standardized using Equations (1) and (2):
Positive   indicator : X i = ( X i X m i n ) ( X m a x X m i n )
Negative   indicator : X i = ( X m a x X i ) ( X m a x X m i n )
where X i represents the normalized value of i in the grid cell; is the actual value of the index; and X m i n and X m a x are the minimum and maximum values of the index in the study region.
All indicators were pre-processed in ArcGIS 10.2, including merging, clipping, reprojection, and resampling. All indicators were converted uniformly to raster with a spatial resolution of 1000 m.

2.4. Data Analysis

Combining the AHP–PCA–EVDI, autocorrelation between index factors was effectively solved, and the accuracy of the evaluation results was apparently improved. Accounting for prior experience and expert knowledge, AHP constructed a judging matrix and assigned the weights subjectively [15]. To reduce the dimensionality of a dataset, PCA extracted indicators of significant difference, and the related indicators were objectively transformed into a set [47]. In this study, indicators of VNF, VED, and VSI were calculated using an entropy weight model, integrating AHP with PCA. In addition, the EVDI described the minimum vulnerability point as a determinate point; the distances between each of the other points and the minimum point were calculated in a multidimensional space [22]. As a result, the GVI was calculated using the distances from VNF, VED, and VSI to their minimum point. The EVDI allowed a reasonable evaluation procedure and made each subsystem effective. The comprehensive method united subjective and objective approaches, which made the results reasonable and convincing.
Step 1: Use the AHP to determine the weights of indictors of VNF, VED, and VSI. Classify the importance level of each factor, assign a value, and form a judging matrix according to the pairwise comparisons. Calculate the consistency ratio (CR) and the weight of each indicator ( W 1 j ) using Equations (3) and (4):
C I = λ m a x n ( n 1 )
where CI is the consistency index; λ m a x is the maximum eigenvalue of the judging matrix; and n is the order of the judging matrix and the number of judgement factors.
C R = C I R I
where CR is the consistency ratio; CI is the consistency index; and RI is the random index. In this study, all of the values of CR in VNF, VED, and VSI are 0.000, suggesting that the judgement is acceptable (Table 2, Table 3 and Table 4).
Step 2: Calculate the weights for the PCA using ArcGIS 12.0 spatial analysis. Obtain the contribution rate and cumulative contribution rate of each principal component. Apply the Equations (5) and (6) to calculate the weight of indicators ( W 2 j ):
H j = j = 1 m λ j k 2
W 2 j = H j j = 1 n H j
where H j is the variance of each factor; W 2 j is the PCA weight of factors; j is the number of indicators; and k is the number of principal components.
Step 3: Calculate the subjective and objective weights using AHP and PCA for VNF, VED, and VSI. Apply the principle of minimum information entropy to calculate the combined weight. Then, calculate the comprehensive weight of VNF, VED, and VSI using Equation (7):
W j = ( w 1 j w 2 j ) 0.5 j = 1 m ( w 1 j w 2 j ) 0.5 ( j = 1 ,   2 m )
where Wj is the comprehensive weight; W1j is the subjective weight; W2j is the objective weight; and j is the number of indicators.
Step 4: Based on the results of VNF, VED, and VSI, the EVDI was used to assess grassland vulnerability. The smaller the distance index is, the better the ecological conditions of grassland. Calculate the distance index using Equation (8):
G V I = ( V N F V N F m i n ) 2 + ( V E D V E D m i n ) 2 + ( V S I V S I m i n ) 2
where G V I represents the grassland vulnerability index; V N F , V E D , and V S I represent the vulnerability by natural factors, vulnerability by environmental disturbance factors, and vulnerability by socioeconomic impact factors, respectively; and V N F m i n , V E D m i n , and V S I m i n represent the minimum VNF, VED, and VSI, respectively.

2.5. Classification Method

In ArcGIS 12.0, based on Natural Breaks (Jenks), we divided grassland vulnerability into five levels of VNF, VED, VSI, and GVI: normal, slight vulnerability, moderate vulnerability, serious vulnerability, and extreme vulnerability (Table S1). An increase in the level of vulnerability was considered a significantly increased vulnerability, while a decrease in the level of vulnerability was considered a significantly decreased vulnerability.

2.6. Correlation Analysis

The spatial autocorrelation indicator was useful for determining whether the values of attributes were strongly associated with the values of adjacent spatial attributes [48]. In this paper, Moran’s I index (global spatial autocorrelation) and the local indicator of spatial association (LISA) were used to analyse the spatial correlation of the GVI.
(1) Global Moran’s I
The correlation of attribute values for the spatially adjacent unit was shown by Moran’s I coefficient. When Moran’s I had an absolute value close to 1, the unit’s spatial autocorrelation was strong. Moreover, when Moran’s I had an absolute value close to 0, the unit’s spatial autocorrelation was weak. Spatial correlation can be calculated using Equation (9):
I = i = 1 n j = 1 n ω i j ( x i x ¯ ) ( x j x ¯ ) i = 1 n j = 1 n ω i j i = 1 n ( x i x ¯ ) 2
where x i ,   x j is the attribute value of the location of i, j; n is the total number of grids; ω i j is the weight of the matrix; and x ¯ is the average value of the GVI.
(2) Local Moran’s I
The local spatial autocorrelation index analyses the effectiveness of Moran’s I at each spatial unit, effectively representing local spatial connections. Equation (10) is applied:
I = ( x i x ¯ ) 2 S 2 j ω i j ( x j x ¯ )
where x i ,   x j is the attribute value of the location of i, j; ω i j is the weight of the matrix; x ¯ is the average value of the GVI; and S is the sum of the spatial weight matrix.

3. Results

3.1. Spatiotemporal Variations in VNF, VED, and VSI

The spatial and temporal variations in VNF are shown in Figure 2. Western and northern grasslands, which were dominated by serious and extreme vulnerability, were more vulnerable than eastern and southern grasslands. NDVI, annual average temperature, annual average precipitation, and elevation were the main influencing factors of VNF (Table 2). The average value decreased from 0.63 in 2000 to 0.61 in 2010 and then to 0.60 in 2018. VNF decreased significantly, indicating that the natural factors of the grassland ecosystem improved notably. From 2000 to 2018, the area with extreme vulnerability showed a decreasing trend from 34.17 × 10⁴ km2 (27.42%) in 2000, 29.12 × 10⁴ km2 (23.37%) in 2010, and 31.00 × 10⁴ km2 (24.88%) in 2018, The area with normal vulnerability showed an increasing trend from 4.56 × 10⁴ km2 (3.66%) in 2000, 10.55 × 10⁴ km2 (8.46%) in 2010, and 16.51 × 10⁴ km2 (13.25%) in 2018. Regions with significantly decreasing vulnerability accounted for 27.35% in the eastern part of the study area. There were a few regions with significantly increased vulnerability, accounting for 4.78% of the entire research area.
Figure 3 illustrates the results for VED. Land desertification was the main environmental disturbance in grasslands (Table 3). The average value of VED decreased from 0.50 in 2000 and 2010 to 0.49 in 2018. From 2000 to 2018, the area with extreme vulnerability showed a decreasing trend from 25.83 × 10⁴ km2 (20.73%) in 2000 to 23.49 × 10⁴ km2 (18.85%) in 2018. In general, the changes from 2000 to 2018 were not obvious. Parts of Tibet showed significantly decreasing vulnerability, yet the eastern and northern Qinghai Province showed significantly increasing vulnerability.
Figure 4 depicts the consequences of VSI. Due to the sparse population, the grasslands of QTP had normal vulnerability in more than 80% of the study area. The population had the largest influence on grassland (Table 4). The average value of VSI increased considerably from 0.011 in 2000 to 0.018 in 2010 and then to 0.022 in 2018. From 2000 to 2018, the area with extreme vulnerability showed an increasing trend from 0 km2 (0%) in 2000 to 0.26 × 10⁴ km2 (0.21%) in 2010 to 0.56 × 10⁴ km2 (0.45%) in 2018; the area with normal vulnerability showed a decreasing trend from 116.76 × 10⁴ km2 (93.69%) in 2000 to 106.36 × 10⁴ km2 (85.35%) in 2010 to 102.27 × 10⁴ km2 (82.06%) in 2018. Regions with significantly decreasing vulnerability were mainly concentrated in the eastern QTP.

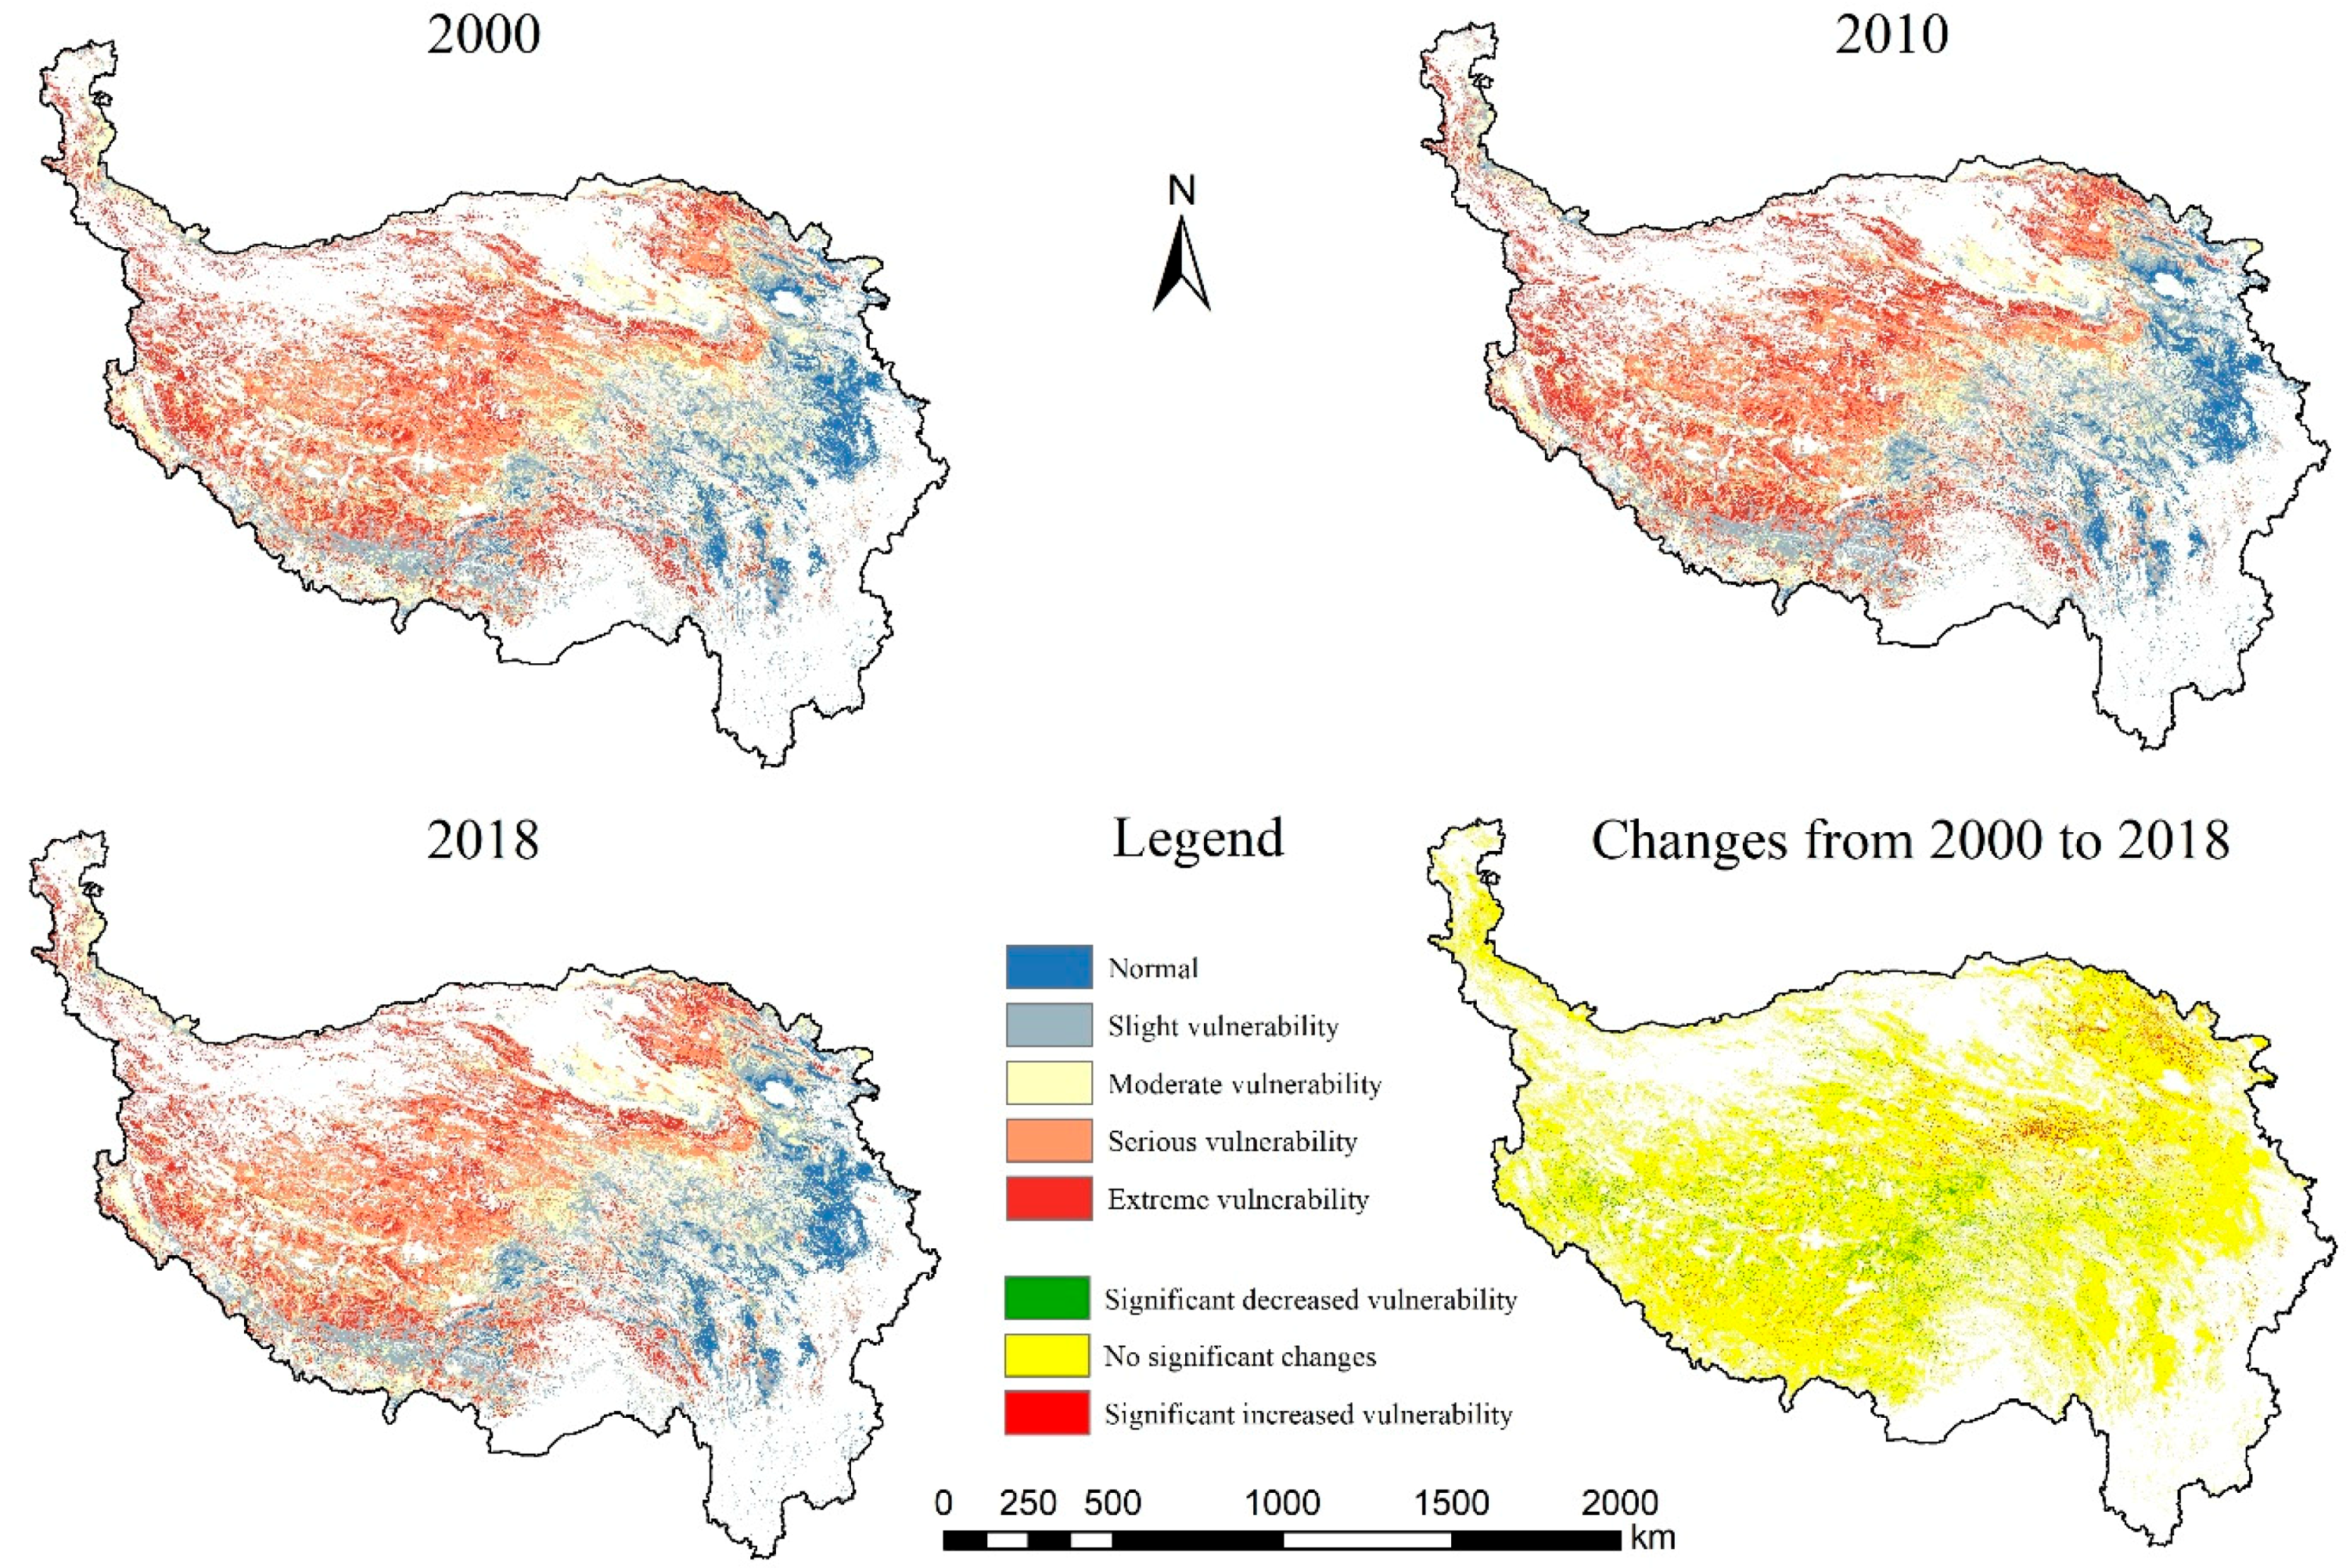
3.2. Spatiotemporal Variations in Grassland Vulnerability

The results for GVI are shown in Figure 5. In general, the trend of GVI decreased from northwest to southeast. Areas with normal, slight vulnerability, and moderate vulnerability were mostly found in the eastern and southern QTP. As a result of flat terrain, low elevation, high vegetation cover, suitable climate, and fertile soil, the main grassland type was alpine meadow, which was relatively stable. Areas with serious and extreme vulnerability were mostly found in the western and northern QTP, including Qinghai Province and Tibet, especially near the mountains. The main grassland types were alpine steppe and desert steppe, which had low precipitation, steep terrain, and high elevation. Because of these characteristics, the ecological environment was extremely fragile.
From 2000 to 2018, the average GVI value decreased from 0.61 in 2000 to 0.60 in 2010 and then to 0.59 in 2018. The area with extreme vulnerability area showed a decreasing trend from 30.28 × 10⁴ km2 (24.30%) in 2000 to 29.64 × 10⁴ km2 (23.79%) in 2010 to 26.14 × 10⁴ km2 (20.97%) in 2018; the normal area showed an increasing trend from 8.57 × 10⁴ km2 (6.87%) in 2000 to 10.71 × 10⁴ km2 (8.60%) in 2010 to 11.59 × 10⁴ km2 (9.30%) in 2018 (Table 5). The heterogeneity of grassland vulnerability across the entire area was indicated by the spatial distribution of the GVI rate of change. Areas with significantly decreasing vulnerability, which were largely located in the eastern and southern grasslands, accounted for 13.75% of the total study area. A few places with considerably elevated vulnerability existed, and these regions accounted for 2.60% of the total research area.

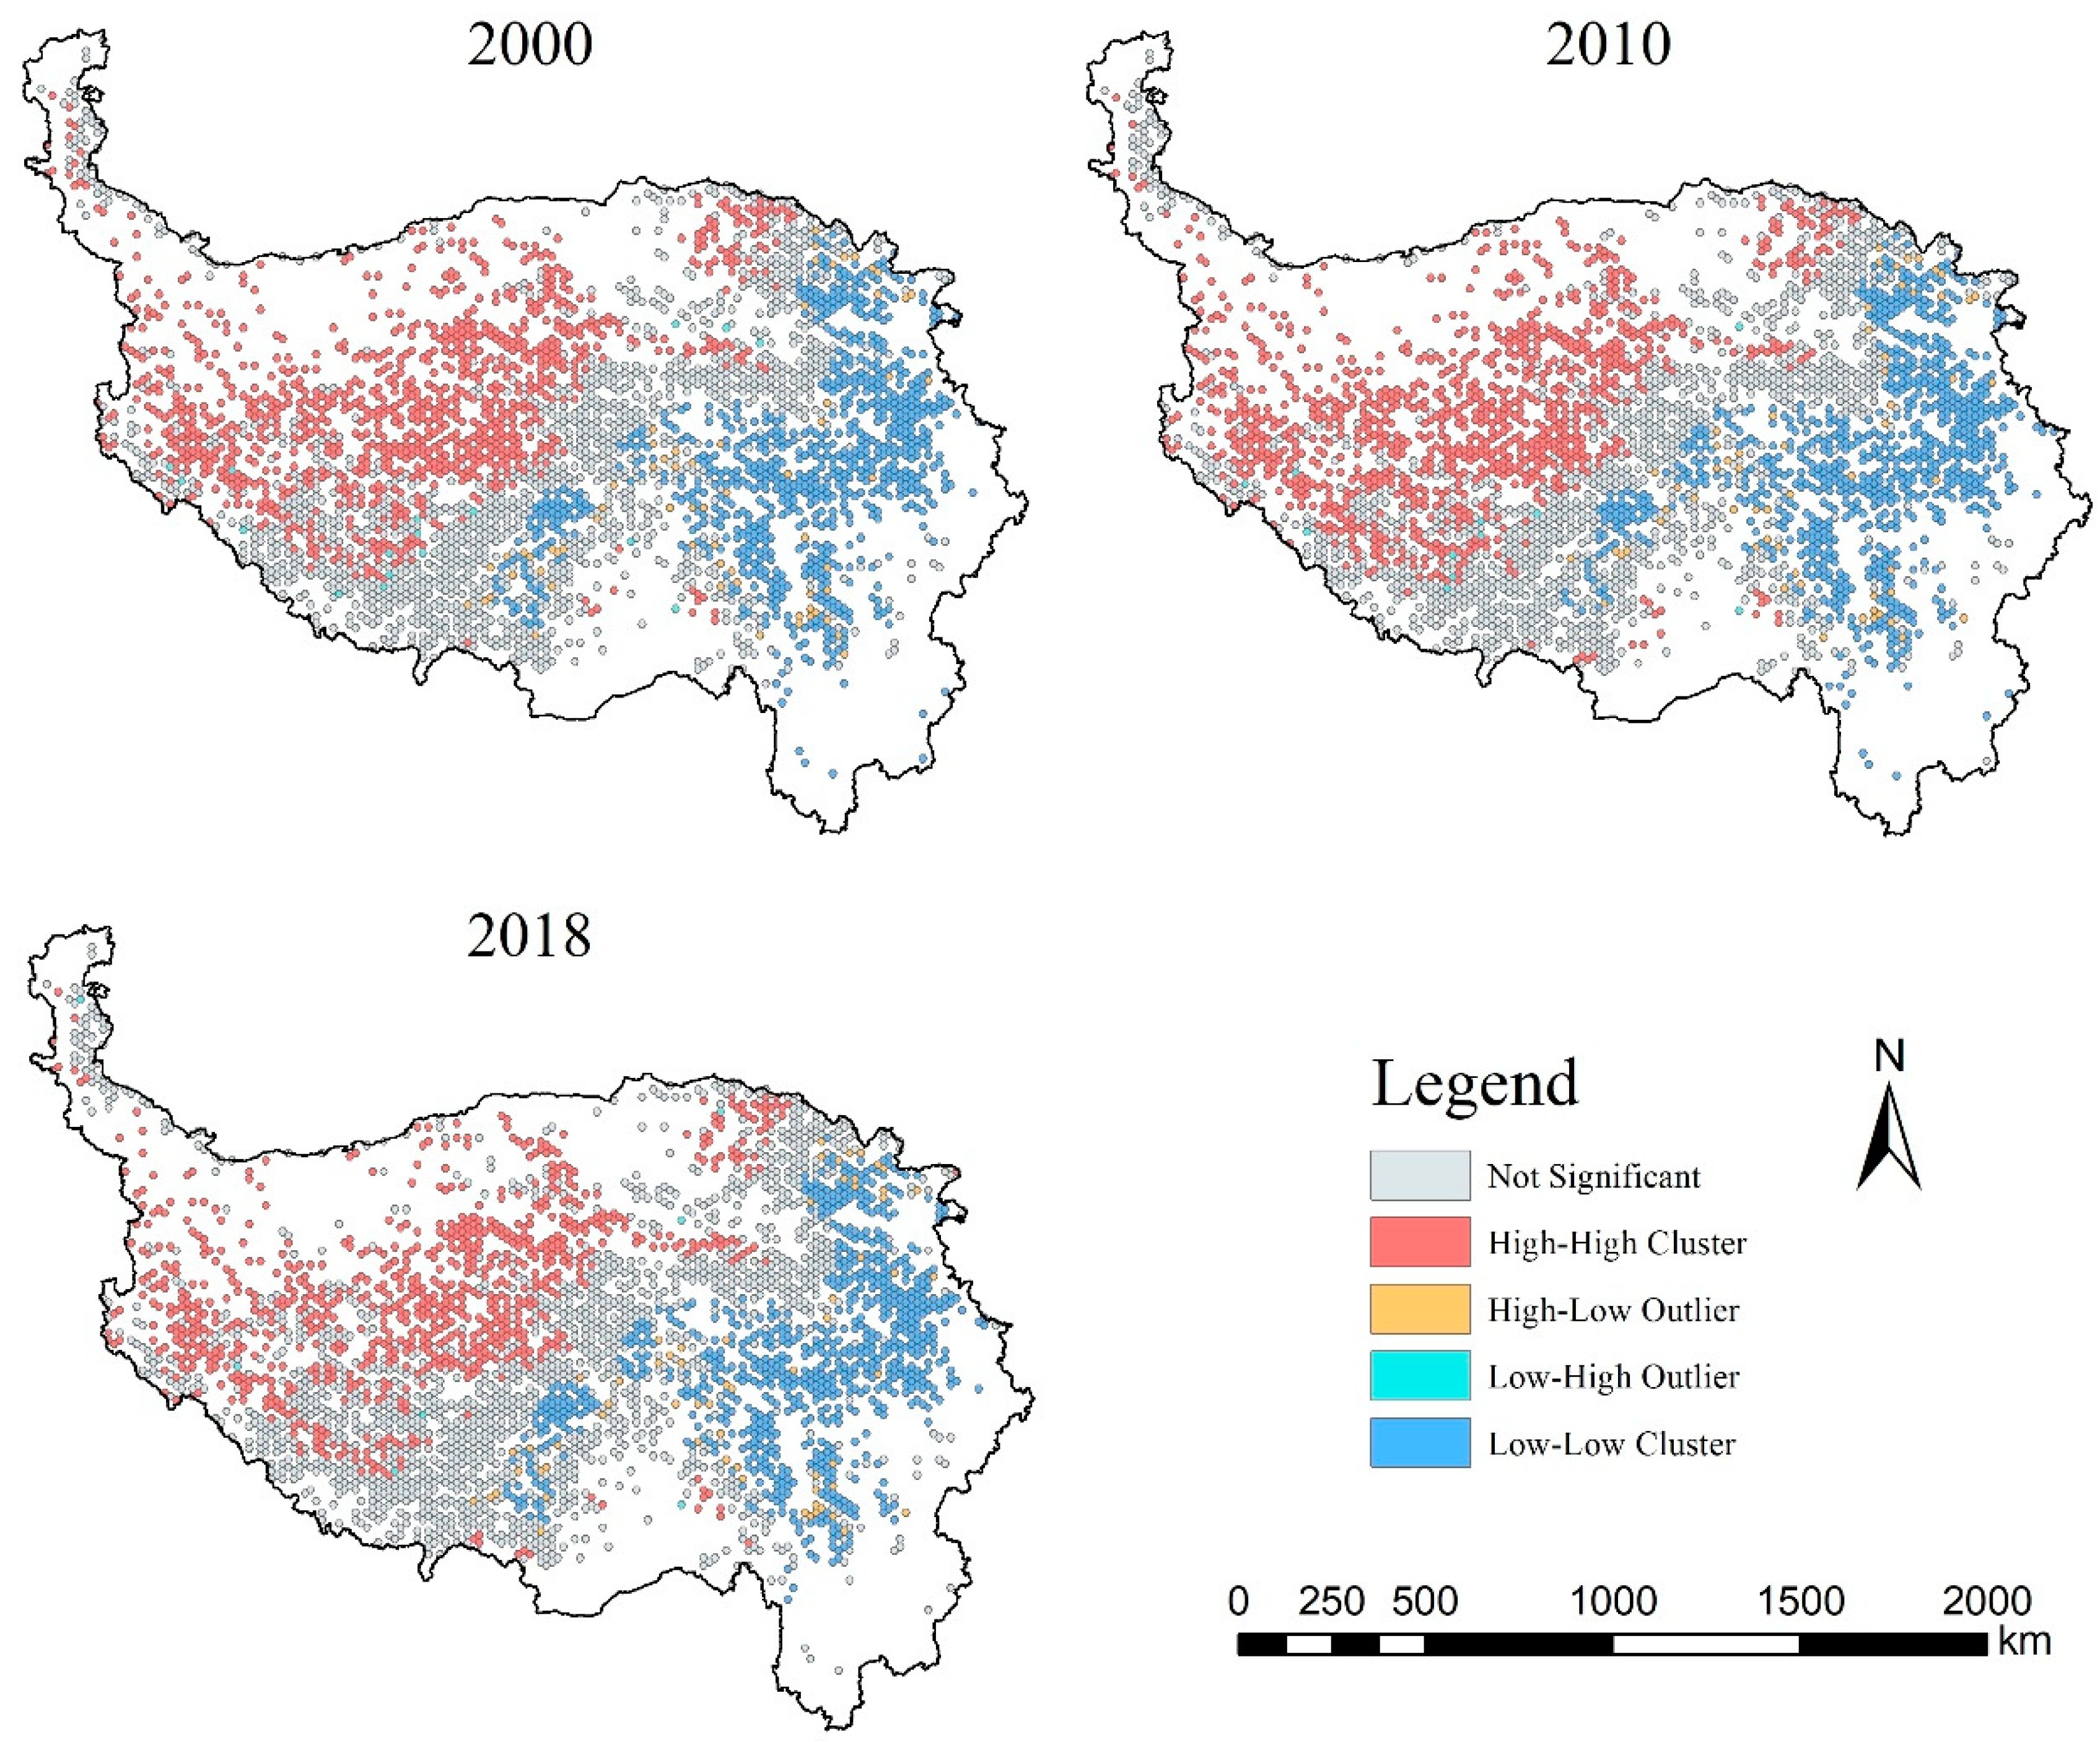
3.3. Spatial Autocorrelation Characteristics of GVI

In ArcGIS 12.0, we created hexagons with a side length of 10 km. For continually partitioning a two-dimensional space, hexagons are regarded as more efficient than square grids, but rectangular or square grids are commonly used [49]. Hexagonal forms provide an isotropic neighbourhood, which allows for more accurate neighbourhood analysis [49]. The global Moran’s I value of GVI in 2000, 2010, and 2018 was 0.565, 0.587, and 0.598, respectively. These findings suggested that grassland vulnerability featured clustering. In addition, the clustering was even more obvious from 2000 to 2018. The p values were 0.001, and the Z scores were greater than 2.58, passing a 99.9% confidence test, indicating that the spatial autocorrelation of grassland vulnerability was extremely significant (Table S2).
The correlation of adjacent regions was measured by local spatial autocorrelation, which was generally based on LISA. The grassland of QTP was divided into five regions: (1) High-High cluster (H-H) regions, in which both the region and its adjacent areas had high grassland vulnerability, mainly including serious and extreme vulnerability; (2) Low-Low cluster (L-L) regions, in which both the region and its adjacent areas had low grassland vulnerability, mainly including normal, slight vulnerability, and moderate vulnerability; (3) Low-High outlier (L-H) regions, in which the grassland vulnerability of the region was low but the grassland vulnerability of the adjacent region was high; (4) High-Low outlier (H-L) regions, in which the grassland vulnerability of the region was high but the grassland vulnerability of the adjacent region was low; and (5) Not significant regions, in which there is no significant difference between the region and its adjacent areas [50]. Positive spatial correlations existed in the H-H and L-L regions, whereas negative correlations existed in the H-L and L-H regions. From 2000 to 2018, the spatial autocorrelation produced similar results (Figure 6). The H-H regions were mainly found in the western and northern QTP, mainly including alpine steppe and desert steppe. The number of units decreased from 1020 in 2000 to 845 in 2018, indicating that the spatial distribution tended to be discrete. L-L regions were mainly found in the eastern and southern QTP, mainly including alpine meadows. The number of units decreased from 809 in 2000 to 778 in 2018, indicating that the spatial distribution tended to be discrete.

4. Discussion

4.1. Spatiotemporal Variations in Grassland Vulnerability

The QTP is a hotspot for vulnerability studies. Jiang et al. [51], Xia et al. [34], and Jiang et al. [52] assessed the vulnerability of the QTP or the Tibetan Plateau. The conclusions obtained were similar to those presented in this paper, with a dramatic trend of increasing vulnerability from the east and south to the west and north. Although the region had high VSI with strong human disturbance, the south-eastern QTP, which is composed of alpine meadow, had the lowest grassland vulnerability and was the main L-L region. Warm and humid air is brought from the Pacific, promoting vegetation growth and productivity, and making the grassland ecosystem less vulnerable [34,36]. Furthermore, the north-western QTP, which consisted of alpine steppe and desert steppe, had the highest grassland vulnerability and was the main H-H region. Because of the high elevations and low temperatures, it became barren and sparsely vegetated, making it vulnerable to environmental disturbances such as freeze–thaw erosion and desertification.
According to the temporal patterns, the grassland vulnerability of the QTP continuously improved, and the average value of GVI decreased from 2000 to 2018, with similar results found by Jiang et al. [52] and Jiang et al. [51]. However, based on trend analyses, Xia et al. [34] discovered that there were more areas with significantly increased vulnerability than areas with significantly decreased vulnerability. More detailed analyses showed that, following the environmental protection measures being implemented, the increasing trend of ecological vulnerability was alleviated, and more regions experienced significantly decreased vulnerability, suggesting that the government’s ecological restoration programs were effective [34,51]. During the study period, many natural programmes on the QTP were proposed: the Ecological Environment Protection and Comprehensive Controlling Plan of Qinghai Lake Basin in 2007, the Protection and Construction of Ecological Security Barrier Plan in Tibet (2008–2030) in 2009, the Regional Ecological Construction and Environmental Protection Plan of Qinghai-Tibetan Plateau (2011–2030) in 2011, and so on [34,51]. These programmes promoted the return of farmland to grassland, biodiversity conservation, and improvement of the ecological environment. The Prohibited Grazing Policy (PGP) was another ecological initiative that had an impact on grassland. The PGP was a major ecological service project started by the Chinese government in 2003 to recover highly degraded grasslands and environmentally fragile regions [20]. Many studies concluded that the PGP had a significant impact on environmental protection and resulted in significant ecological benefits [20,53]. Meanwhile, due to global warming, increased precipitation, temperature, and growing season length caused improvements in the alpine meadows and steppes in some regions of the QTP [33,54]. The start of the thermal growing season (STGS), net primary production (NPP), NDVI, and other indicators improved, indicating that the general health of grasslands was improving on the QTP [54,55,56].

4.2. Driving Factors of Grassland Vulnerability

The driving factors of grassland vulnerability can be traced back to natural factors, environmental disturbances, and socioeconomic impacts. Based on the weights obtained, we analysed the driving factors of grassland vulnerability (Table 2, Table 3 and Table 4). For VNF, among the selected indicators, NDVI had a strong influence, and the weight of NDVI increased from 2000 to 2018. In related studies, NDVI was a key indicator of vulnerability [34,51]. Green vegetation played an important role in water and soil conservation, biodiversity, and climate adjustment [34]. The increase in NDVI resulted in a more stable grassland ecosystem. Moreover, both temperature and precipitation were essential environmental elements that influenced vegetation dynamics. The weight of the annual average temperature decreased, while the weight of the annual average precipitation increased. Possibly due to climate change, temperature was not a limiting factor in grassland vulnerability, but precipitation remained a limiting factor.
Based on the background natural factors, land desertification was the most important environmental disturbance, followed by freeze–thaw erosion and landslides. In comparison, the significance of the grazing pressure was relatively low, with similar results found by Jiang et al. [51]. Grassland, especially alpine and desert steppes, was vulnerable to land desertification. Permafrost degradation has resulted in increased land desertification in previously permafrost-covered areas. The duration and annual mean area of frozen soil have decreased significantly as a result of global warming, making land desertification more severe [57]. Increased precipitation and runoff, combined with the steep mountain terrain, intensified the potential energy conditions, resulting in unstable rocks and dirt sliding down, causing collapses and landslides [44,49]. In addition, the intervention of human social and economic activities was an essential driving factor in grassland vulnerability change. The most essential socioeconomic impact indicator was the population, which reflected the frequency and intensity of human disturbance. Among the indicators, the weight of GDP increased significantly from 0.24 to 0.44 over the years examined, suggesting that the QTP grassland was experiencing rapid economic growth. The importance of actual livestock was relatively low, as a result of local governments restricting overgrazing to safeguard the QTP.
The GVI incorporated several contributing elements, including natural factors, environmental disturbances, and socioeconomic impacts, showing the spatiotemporal distributions of grassland vulnerability. Understanding the mechanisms of driving factors is critical to reducing vulnerability. However, calculating the index of grassland vulnerability to make judgements of vulnerability is insufficient. Long-term categorized monitoring and projections of driving factors are required to gain a thorough understanding of grassland vulnerability [28,51].

4.3. Suggestions and Uncertainty Analysis

The goal of the vulnerability assessment was to provide decision-makers with recommendations on how to improve environmental quality [22]. To select priority regions in the vast grassland of the QTP, indicators that convey information about the condition of the grassland ecosystems must be used [1]. In this paper, the grassland of QTP was divided into three types, namely, alpine meadow, alpine steppe, and desert steppe, which accounted for 60.22%, 33.82%, and 5.96% of the total area, respectively. Our results were similar to those of Li et al. [1], who conducted an alpine grassland vulnerability assessment of the QTP using the SPR model. Desert steppe was the most vulnerable (0.78), followed by alpine steppe (0.76) and alpine meadow (0.64). Desert steppe was the transitional region from grassland to desert, and it was the driest grassland. It was particularly sensitive to human activity and climate change, and land desertification was a strong possibility. Therefore, to slow the spread of deserts, national funds should be invested in combating desertification and expanding the construction of shelterbelts [22]. The alpine meadow and alpine steppe were suitable for grazing, while overgrazing had negative impacts on soil, even leading to grassland degradation. In severely degraded grasslands, rational management policies and strategies should be implemented [58,59]. To ensure the long-term sustainability of grassland, it was recommended that more ecological projects should be implemented and that the management of the project’s later stages should be strengthened.
This study reflected the spatiotemporal variations in QTP grassland vulnerability during the last 20 years. By selecting relevant indicators based on the VNF–VED–VSI framework and using a specific type of ecosystem as the study area, a comprehensive picture of ecosystem vulnerability on a regional scale could be created. However, this study also had limitations. First, because the assessment methods for factors have not yet been harmonized, the accuracy of the results requires further testing. A simple and accurate evaluation framework, as well as a method for factors, must be developed. Second, due to the large area of the QTP region, this study applied a 1000 m resolution, which is prone to accuracy errors. As a result, in future research, a smaller scale, higher resolution, and longer time series to assess the vulnerability of key areas should be considered. Third, ecosystem processes are complex and difficult to fully identify, especially when the ecosystem is disrupted by human activities. In this study, the impact of human activities by VSI was reflected using the indicators of population, GDP, and actual livestock, but it was far from sufficient. In future research, more appropriate indicators and more accurate models should be used to reflect complex ecosystem processes.

5. Conclusions

The grassland ecosystem accounted for the most significant proportion of the QTP and played important roles in conserving the soil and water, maintaining the biodiversity, and controlling the wind and sand. In this study, a comprehensive grassland vulnerability evaluation framework was developed by integrating the grassland vulnerability index with AHP, PCA, and EVDI approaches. Based on this framework, our results showed that the vulnerability by natural factors and environmental disturbances decreased from 2000 to 2018, while the vulnerability by socioeconomic impacts increased on the QTP. The factors that had the greatest impact on VNF, VED, and VSI were NDVI, land desertification, and population, respectively. The spatial distribution of GVI had obvious heterogeneity, decreasing from northwest to southeast. The regions with serious and extreme vulnerability were mainly located in the north-western alpine steppe and desert steppe, while the regions with normal, slight, and moderate vulnerability were mainly concentrated in the south-eastern alpine meadow. The global Moran’s I index of grassland vulnerability on the QTP was greater than 0, with a significant positive spatial correlation. The number of H-H and L-L units decreased from 2000 to 2018, indicating that the H-H and L-L Cluster regions tended to be discrete. In addition, the H-H and L-L aggregate distributions were highly coincident with the high and low value regions of GVI. These results suggested that the comprehensive GVI based on the AHP–PCA–EVDI approaches is useful for evaluating grassland vulnerability at the regional scale. Overall, our results indicated that understanding the variations in grassland vulnerability on the QTP is important for regional sustainable development in the context of intensified human activities and climate change.

Supplementary Materials

The following supporting information can be downloaded at: https://www.mdpi.com/article/10.3390/su14094912/s1, Table S1: Classification criteria of grassland vulnerability on the Qinghai-Tibet Plateau; Table S2: Global Moran’s I index statistic of grassland vulnerability on the Qinghai-Tibet Plateau from 2000 to 2018.

Author Contributions

Conceptualization, X.W. and Y.L.; methodology, Z.Z. and X.W.; software, Z.Z. and Y.Z.; validation, S.S., T.L., and W.J.; formal analysis, Z.Z.; writing—original draft preparation, Z.Z.; writing—review and editing, X.W. and Y.L.; supervision, Y.L.; funding acquisition, X.W. and Y.L. All authors have read and agreed to the published version of the manuscript.

Funding

This research was funded by the Second Tibetan Plateau Scientific Expedition and Research program, grant number 2019QZKK0308 and 2019QZKK0402, the Strategic Priority Research Program of Chinese Academy of Sciences, grant number XDA20020402, and the Youth Innovation Promotion Association of the Chinese Academy of Sciences, grant number 2018056.

Institutional Review Board Statement

Not applicable.

Informed Consent Statement

Not applicable.

Data Availability Statement

Not applicable.

Acknowledgments

We would like to thank the four anonymous reviewers for their valuable comments on the previous version of the manuscript.

Conflicts of Interest

The authors declare no conflict of interest.

References

  1. Li, M.; Zhang, X.; He, Y.; Niu, B.; Wu, J. Assessment of the vulnerability of alpine grasslands on the Qinghai-Tibetan Plateau. PeerJ 2020, 8, e8513. [Google Scholar] [CrossRef] [PubMed]
  2. Xu, Y.; Shen, Z.H.; Ying, L.X.; Ciais, P.; Liu, H.Y.; Piao, S.L.; Wen, C.; Jiang, Y.X. The exposure, sensitivity and vulnerability of natural vegetation in China to climate thermal variability (1901–2013): An indicator-based approach. Ecol. Indic. 2016, 63, 258–272. [Google Scholar] [CrossRef]
  3. Urruty, N.; Tailliez-Lefebvre, D.; Huyghe, C. Stability, robustness, vulnerability and resilience of agricultural systems. A review. Agron. Sustain. Dev. 2016, 36, 15. [Google Scholar] [CrossRef] [Green Version]
  4. Nandintsetseg, B.; Boldgiv, B.; Chang, J.; Ciais, P.; Davaanyam, E.; Batbold, A.; Bat-Oyun, T.; Stenseth, N.C. Risk and vulnerability of Mongolian grasslands under climate change. Environ. Res. Lett. 2021, 16, 034035. [Google Scholar] [CrossRef]
  5. Wei, F. Towards post-2020 global biodiversity conservation: Footprint and direction in China. Innovation 2021, 2, 100175. [Google Scholar] [CrossRef]
  6. O’Mara, F.P. The role of grasslands in food security and climate change. Ann. Bot. 2012, 110, 1263–1270. [Google Scholar] [CrossRef] [Green Version]
  7. Jones, M.B.; Donnelly, A. Carbon sequestration in temperate grassland ecosystems and the influence of management, climate and elevated CO2. New Phytol. 2004, 164, 423–439. [Google Scholar] [CrossRef]
  8. Olson, D.M.; Dinerstein, E. The Global 200: Priority ecoregions for global conservation. Ann. Mo. Bot. Gard. 2002, 89, 199–224. [Google Scholar] [CrossRef]
  9. Hong, W.; Jiang, R.; Yang, C.; Zhang, F.; Su, M.; Liao, Q. Establishing an ecological vulnerability assessment indicator system for spatial recognition and management of ecologically vulnerable areas in highly urbanized regions: A case study of Shenzhen, China. Ecol. Indic. 2016, 69, 540–547. [Google Scholar] [CrossRef]
  10. Yang, Y.J.; Song, G. Human disturbance changes based on spatiotemporal heterogeneity of regional ecological vulnerability: A case study of Qiqihaer city, northwestern Songnen Plain, China. J. Clean. Prod. 2020, 291, 125262. [Google Scholar] [CrossRef]
  11. Vanshika, D.; Shukla, R.; Gornott, C.; Joshi, P. Consistency in Vulnerability Assessments of Wheat to Climate Change—A District-Level Analysis in India. Sustainability 2020, 12, 8256. [Google Scholar]
  12. He, L.; Shen, J.; Zhang, Y. Ecological vulnerability assessment for ecological conservation and environmental management. J. Environ. Manag. 2018, 206, 1115–1125. [Google Scholar] [CrossRef]
  13. Li, X.; Song, L.; Xie, Z.; Gao, T.; Liu, L. Assessment of Ecological Vulnerability on Northern Sand Prevention Belt of China Based on the Ecological Pressure–Sensibility–Resilience Model. Sustainability 2021, 13, 6078. [Google Scholar] [CrossRef]
  14. Wu, C.S.; Liu, G.H.; Huang, C.; Liu, Q.S.; Guan, X.D. Ecological Vulnerability Assessment Based on Fuzzy Analytical Method and Analytic Hierarchy Process in Yellow River Delta. Int. J. Environ. Res. Public Health 2018, 15, 855. [Google Scholar] [CrossRef] [Green Version]
  15. Zou, T.; Chang, Y.; Chen, P.; Liu, J. Spatial-temporal variations of ecological vulnerability in Jilin Province (China), 2000 to 2018. Ecol. Indic. 2021, 133, 108429. [Google Scholar] [CrossRef]
  16. Wang, Y.; Zhang, F.; Wang, W.; Xiao, R. Effects of rapid urbanization on ecological functional vulnerability of the land system in Wuhan, China: A flow and stock perspective. J. Clean. Prod. 2020, 248, 119284. [Google Scholar] [CrossRef]
  17. Ren, X.; Dong, Z.; Hu, G.; Zhang, D.; Li, Q. A GIS-Based Assessment of Vulnerability to Aeolian Desertification in the Source Areas of the Yangtze and Yellow Rivers. Remote Sens. 2016, 8, 626. [Google Scholar] [CrossRef] [Green Version]
  18. Zhou, X.L.; Yan, Y.; Wang, H.; Zhang, F.; Wu, L.Y.; Ren, J.Z. Assessment of eco-environment vulnerability in the northeastern margin of the Qinghai-Tibetan Plateau, China. Environ. Earth Sci. 2010, 63, 667–674. [Google Scholar]
  19. Dossou, J.F.; Li, X.X.; Sadek, M.; Sidi Almouctar, M.; Mostafa, E. Hybrid model for ecological vulnerability assessment in Benin. Sci. Rep. 2021, 11, 2449. [Google Scholar] [CrossRef]
  20. Li, R.; Han, R.; Yu, Q.; Qi, S.; Guo, L. Spatial Heterogeneous of Ecological Vulnerability in Arid and Semi-Arid Area: A Case of the Ningxia Hui Autonomous Region, China. Sustainability 2020, 12, 4401. [Google Scholar] [CrossRef]
  21. Li, Q.; Shi, X.; Wu, Q. Effects of protection and restoration on reducing ecological vulnerability. Sci. Total Environ. 2020, 761, 143180. [Google Scholar] [CrossRef]
  22. Wei, W.; Shi, S.; Zhang, X.Y.; Zhou, L.; Xie, B.B.; Zhou, J.J.; Li, C.H. Regional-scale assessment of environmental vulnerability in an arid inland basin. Ecol. Indic. 2020, 109, 105792. [Google Scholar] [CrossRef]
  23. Sahoo, S.; Dhar, A.; Kar, A. Environmental vulnerability assessment using Grey Analytic Hierarchy Process based model. Environ. Impact Assess. Rev. 2016, 56, 145–154. [Google Scholar] [CrossRef]
  24. Chen, X.; Li, X.; Eladawy, A.; Yu, T.; Sha, J. A multi-dimensional vulnerability assessment of Pingtan Island (China) and Nile Delta (Egypt) using ecological Sensitivity-Resilience-Pressure (SRP) model. Hum. Ecol. Risk Assess. 2021, 27, 1860–1882. [Google Scholar] [CrossRef]
  25. Hu, X.; Ma, C.; Huang, P.; Guo, X. Ecological vulnerability assessment based on AHP-PSR method and analysis of its single parameter sensitivity and spatial autocorrelation for ecological protection—A case of Weifang City, China. Ecol. Indic. 2021, 125, 107464. [Google Scholar] [CrossRef]
  26. Newton, A.; Weichselgartner, J. Hotspots of coastal vulnerability: A DPSIR analysis to find societal pathways and responses. Estuar. Coast. Shelf Sci. 2014, 140, 123–133. [Google Scholar] [CrossRef]
  27. Beaujean, J.; Lemieux, J.M.; Dassargues, A.; Therrien, R.; Brouyère, S. Physically Based Groundwater Vulnerability Assessment Using Sensitivity Analysis Methods. Ground Water 2014, 52, 864–874. [Google Scholar] [CrossRef]
  28. Sun, S.; Lu, Y.; Lü, D.; Wang, C. Quantifying the Variability of Forest Ecosystem Vulnerability in the Largest Water Tower Region Globally. Int. J. Environ. Res. Public Health 2021, 18, 7529. [Google Scholar] [CrossRef]
  29. Jiang, H.; Xu, X.; Guan, M.; Wang, L.; Huang, Y.; Jiang, Y. Determining the contributions of climate change and human activities to vegetation dynamics in agro-pastural transitional zone of northern China from 2000 to 2015. Sci. Total Environ. 2019, 718, 134871. [Google Scholar] [CrossRef]
  30. Chen, H.; Zhu, Q.; Peng, C.; Wu, N.; Wang, Y.; Fang, X.; Gao, Y.; Zhu, D.; Yang, G.; Tian, J.; et al. The impacts of climate change and human activities on biogeochemical cycles on the Qinghai-Tibetan Plateau. Glob. Chang. Biol. 2013, 19, 2940–2955. [Google Scholar] [CrossRef]
  31. Qiu, J. China: The third pole. Nature 2008, 454, 393–396. [Google Scholar] [CrossRef] [Green Version]
  32. Maddalwar, S.; Nayak, K.K.; Kumar, M.; Singh, L. Plant microbial fuel cell: Opportunities, challenges, and prospects. Bioresour. Technol. 2021, 341, 125772. [Google Scholar] [CrossRef]
  33. Yao, T.; Thompson, L.; Mosbrugger, V.; Zhang, F.; Ma, Y.; Luo, T.; Xu, B.; Yang, X.; Joswiak, D.; Wang, W.; et al. Third Pole Environment (TPE). Environ. Dev. 2012, 3, 52–64. [Google Scholar] [CrossRef]
  34. Xia, M.; Jia, K.; Zhao, W.; Liu, S.; Wei, X.; Wang, B. Spatio-temporal changes of ecological vulnerability across the Qinghai-Tibetan Plateau. Ecol. Indic. 2021, 123, 107274. [Google Scholar] [CrossRef]
  35. Sills, J.; Liu, J.; Milne, R.I.; Cadotte, M.W.; Wu, Z.; Provan, J.; Zhu, G.; Gao, L.; Li, D. Protect Third Pole’s fragile ecosystem. Science 2018, 362, 1368. [Google Scholar]
  36. Xie, G.; Li, J.F.; Wang, S.Q.; Yao, Y.F.; Sun, B.; Ferguson, D.K.; Li, C.S.; Deng, T.; Liu, X.D.; Wang, Y.F. Bridging the knowledge gap on the evolution of the Asian monsoon during 26–16 Ma. Innovation 2021, 2, 100110. [Google Scholar] [CrossRef]
  37. Moors, E.J.; Groot, A.; Biemans, H.; Scheltinga, C.T.V.; Stoffel, M.; Huggel, C.; Wiltshire, A.; Mathison, C.; Ridley, J.; Jacob, D.; et al. Adaptation to changing water resources in the Ganges basin, northern India. Environ. Sci. Policy 2011, 14, 758–769. [Google Scholar] [CrossRef]
  38. Sun, C.; Xu, X.D.; Zhao, T.L.; Yao, T.D.; Zhang, D.Q.; Wang, N.L.; Ma, Y.M.; Ma, W.Q.; Chen, B.; Zhang, S.J.; et al. Distinct impacts of vapor transport from the tropical oceans on the regional glacier retreat over the Qinghai-Tibet Plateau. Sci. Total Environ. 2022, 823, 153545. [Google Scholar] [CrossRef]
  39. Chao, N.F.; Chen, G.; Wang, Z.T. Impact of Eastern Tibetan Plateau Glacier Melt on Land Water Storage Change across the Yangtze River Basin. J. Hydrol. Eng. 2020, 25, 05020002. [Google Scholar] [CrossRef]
  40. Qi, Y.; Wang, H.W.; Ma, X.F.; Zhang, J.L.; Yang, R. Relationship between vegetation phenology and snow cover changes during 2001-2018 in the Qilian Mountains. Ecol. Indic. 2021, 133, 108351. [Google Scholar] [CrossRef]
  41. Yang, Y.Z.; Wu, Q.B.; Jin, H.J.; Wang, Q.F.; Huang, Y.D.; Luo, D.L.; Gao, S.H.; Jin, X.Y. Delineating the hydrological processes and hydraulic connectivities under permafrost degradation on Northeastern Qinghai-Tibet Plateau, China. J. Hydrol. 2019, 569, 359–372. [Google Scholar] [CrossRef]
  42. Ding, M.; Zhang, Y.; Sun, X.; Liu, L.; Wang, Z.; Bai, W. Spatiotemporal variation in alpine grassland phenology in the Qinghai-Tibetan Plateau from 1999 to 2009. Chin. Sci. Bull. 2013, 58, 396–405. [Google Scholar] [CrossRef] [Green Version]
  43. Wang, L.; Xiao, Y.; Jiang, L.; Ouyang, Z. Assessment and analysis of the freeze-thaw erosion sensitivity on the Tibetan Plateau. J. Glaciol. Geocryol. 2017, 39, 61–69. [Google Scholar]
  44. Dikshit, A.; Sarkar, R.; Pradhan, B.; Acharya, S.; Alamri, A.M. Spatial Landslide Risk Assessment at Phuentsholing, Bhutan. Geosciences 2020, 10, 131. [Google Scholar] [CrossRef] [Green Version]
  45. Lin, M.L.; Chen, C.W.; Wang, Q.B.; Cao, Y.; Wang, S. Fuzzy model-based assessment and monitoring of desertification using MODIS satellite imagery. Eng. Comput. 2009, 26, 745–760. [Google Scholar] [CrossRef]
  46. Kang, H.; Tao, W.; Chang, Y.; Zhang, Y.; Li, X.; Chen, P. A feasible method for the division of ecological vulnerability and its driving forces in Southern Shaanxi. J. Clean. Prod. 2018, 205, 619–628. [Google Scholar] [CrossRef]
  47. Hotelling, H. Analysis of a complex of statistical variables in principal components. J. Educ. Psychol. 1933, 24, 498–520. [Google Scholar] [CrossRef]
  48. Jing, Y.; Zhang, F.; He, Y.; Kung, H.; Johnson, V.; Arikena, M. Assessment of spatial and temporal variation of ecological environment quality in Ebinur Lake Wetland National Nature Reserve, Xinjiang, China. Ecol. Indic. 2020, 110, 105874. [Google Scholar] [CrossRef]
  49. Faraji Sabokbar, H.; Shadman Roodposhti, M.; Tazik, E. Landslide susceptibility mapping using geographically-weighted principal component analysis. Geomorphology 2014, 226, 15–24. [Google Scholar] [CrossRef]
  50. Ding, Q.; Shi, X.; Zhuang, D.; Wang, Y. Temporal and Spatial Distributions of Ecological Vulnerability under the Influence of Natural and Anthropogenic Factors in an Eco-Province under Construction in China. Sustainability 2018, 10, 3087. [Google Scholar] [CrossRef] [Green Version]
  51. Jiang, Y.; Shi, Y.; Li, R.; Guo, L. A Long-Term Ecological Vulnerability Analysis of the Tibetan Region of Natural Conditions and Ecological Protection Programs. Sustainability 2021, 13, 10598. [Google Scholar] [CrossRef]
  52. Jiang, Y.; Shi, B.; Su, G.; Lu, Y.; Li, Q.; Meng, J.; Ding, Y.; Song, S.; Dai, L. Spatiotemporal analysis of ecological vulnerability in the Tibet Autonomous Region based on a pressure-state-response-management framework. Ecol. Indic. 2021, 130, 108054. [Google Scholar] [CrossRef]
  53. Hou, C.; Zhou, L.; Wen, Y.; Chen, Y. Farmers’ adaptability to the policy of ecological protection in China—A case study in Yanchi County, China. Soc. Sci. J. 2018, 55, 404–412. [Google Scholar] [CrossRef]
  54. Ding, M.; Zhang, Y.L.; Liu, L.S.; Wang, Z. Temporal and spatial distribution of grassland coverage change in the Tibetan Plateau during 1982–2009. J. Nat. Resour. 2010, 25, 2114–2122. [Google Scholar]
  55. Zhang, Y.; Qi, W.; Zhou, C.; Ding, M.; Liu, L.; Gao, J.; Bai, W.; Wang, Z.; Zheng, D. Spatial and temporal variability in the net primary production of alpine grassland on the Tibetan Plateau since 1982. J. Geogr. Sci. 2014, 24, 269–287. [Google Scholar] [CrossRef]
  56. Zhu, W.; Zhang, D.; Nan, J.; Zheng, Z. Spatiotemporal variations of the start of thermal growing season for grassland on the Qinghai-Tibetan Plateau during 1961–2014. Int. J. Biometeorol. 2017, 63, 1–9. [Google Scholar] [CrossRef]
  57. Li, T.; Chen, Y.Z.; Han, L.J.; Cheng, L.H.; Lv, Y.H.; Fu, B.J.; Feng, X.M.; Wu, X. Shortened duration and reduced area of frozen soil in the Northern Hemisphere. Innovation 2021, 2, 100146. [Google Scholar] [CrossRef]
  58. Liu, X.; Ma, Z.W.; Huang, X.T.; Li, L.H. How does grazing exclusion influence plant productivity and community structure in alpine grasslands of the Qinghai-Tibetan Plateau? Glob. Ecol. Conserv. 2020, 23, e01066. [Google Scholar] [CrossRef]
  59. Du, C.J.; Jing, J.; Shen, Y.; Liu, H.X.; Gao, Y.H. Short-term grazing exclusion improved topsoil conditions and plant characteristics in degraded alpine grasslands. Ecol. Indic. 2020, 108, 105680. [Google Scholar] [CrossRef]
Figure 1. Grassland types on the Qinghai-Tibet Plateau.
Sustainability 14 04912 g001
Figure 2. Vulnerability and change in vulnerability by natural factors (VNF) in grassland ecosystems of the Qinghai-Tibet Plateau from 2000 to 2018.
Sustainability 14 04912 g002
Figure 3. Vulnerability and change in vulnerability by environmental disturbances (VED) in the grassland ecosystem of the Qinghai-Tibet Plateau from 2000 to 2018.
Sustainability 14 04912 g003
Figure 4. Vulnerability and change in vulnerability by socioeconomic impacts (VSI) in the grassland ecosystem of the Qinghai-Tibet Plateau from 2000 to 2018.
Sustainability 14 04912 g004
Figure 5. Vulnerability and change in grassland vulnerability on the Qinghai-Tibet Plateau from 2000 to 2018.
Sustainability 14 04912 g005
Figure 6. LISA (local indicator of spatial association) aggregation of grassland vulnerability on the Qinghai-Tibet Plateau from 2000 to 2018.
Sustainability 14 04912 g006
Table 1. The framework of grassland vulnerability.
Target LayerCriterion LayerIndicatorIndex Category
Vulnerability by natural factorsClimateAnnual average temperaturenegative
Annual average precipitationnegative
TerrainElevationpositive
Slopepositive
SoilSoil organic matter contentnegative
VegetationNormalized difference vegetation indexnegative
Vulnerability by environmental disturbances Land desertificationpositive
Freeze–thaw erosionpositive
Landslidepositive
Grazing pressurepositive
Vulnerability by socioeconomic impactsSocietyPopulationpositive
EconomyGross domestic productpositive
Actual livestockpositive
Table 2. Weights of evaluation indicators of vulnerability by natural factors (VNF) in the grassland ecosystem of the Qinghai-Tibet Plateau from 2000 to 2018 (Wj is the comprehensive weight; W1j is the weight calculated by AHP; W2j is the weight derived from PCA).
IndicatorW1j200020102018
W2jWjW2jWjW2jWj
Annual average
temperature
0.210.150.180.100.140.090.14
Annual average
precipitation
0.160.110.130.100.130.120.14
Elevation0.130.130.130.160.150.140.14
Slope0.080.090.080.090.090.090.08
Soil organic matter content0.080.080.080.080.080.070.07
Normalized difference vegetation index0.350.450.400.470.410.500.42
Table 3. Weights of evaluation indicators of vulnerability by environmental disturbances (VED) in the grassland ecosystem of the Qinghai-Tibet Plateau from 2000 to 2018 (Wj is the comprehensive weight; W1j is the weight calculated by AHP; W2j is the weight derived from PCA).
IndicatorW1j200020102018
W2jWjW2jWjW2jWj
Land desertification0.410.420.430.460.450.430.43
Freeze–thaw erosion0.280.330.320.290.290.320.31
Landslide0.150.230.190.210.180.220.18
Grazing pressure0.160.030.070.040.080.030.07
Table 4. Weights of evaluation indicators of vulnerability by socioeconomic impacts (VSI) in the grassland ecosystem of the Qinghai-Tibet Plateau from 2000 to 2018 (Wj is the comprehensive weight; W1j is the weight calculated by AHP; W2j is the weight derived from PCA).
IndicatorW1j200020102018
W2jWjW2jWjW2jWj
Population0.490.670.600.490.490.450.48
Gross Domestic Product0.370.140.240.420.400.500.44
Actual livestock0.140.190.170.090.110.050.09
Table 5. Areas and ratios of different grassland vulnerability on the Qinghai-Tibet Plateau from 2000 to 2018.
Vulnerability Levels200020102018
Area/104 km2Ratio/%Area/104 km2Ratio/%Area/104 km2Ratio/%
Normal8.576.87%10.718.60%11.599.30%
Slight vulnerability19.1915.40%19.6515.77%20.7316.63%
Moderate vulnerability27.0621.72%26.7221.44%26.0920.94%
Serious vulnerability39.5231.71%37.9030.41%40.0732.16%
Extreme vulnerability30.2824.30%29.6423.79%26.1420.97%
Publisher’s Note: MDPI stays neutral with regard to jurisdictional claims in published maps and institutional affiliations.

