
Life Cycle Analysis Challenges through Building Rating Schemes within the European Framework


1
Department of Graphic Design and Engineering Projects, Faculty of Engineering, University of the Basque Country (UPV/EHU), Plaza Ingeniero Torres Quevedo, 48013 Bilbao, Spain
2
Green Building Council España (GBCe), 28014 Madrid, Spain
3
Life Cycle Thinking Group, University of the Basque Country (UPV/EHU), Plaza Ingeniero Torres Quevedo 1, 48013 Bilbao, Spain
4
CAVIAR Research Group, Department of Architecture, University of the Basque Country UPV/EHU, Plaza Oñati, 2, 20018 Donostia-San Sebastián, Spain
*
Author to whom correspondence should be addressed.
Sustainability 2022, 14(9), 5009; https://doi.org/10.3390/su14095009
Submission received: 24 March 2022
/
Revised: 17 April 2022
/
Accepted: 18 April 2022
/
Published: 21 April 2022
(This article belongs to the Collection Green Building Technologies)
Abstract
:The decarbonisation of buildings is a crucial milestone if European cities mean to reach their mitigation targets. The construction sector was responsible for 38% of the GHG emissions in 2020. From these emissions, 11% is calculated to be currently embodied in building materials. In this context, an evaluation from a life cycle perspective is becoming increasingly necessary to achieve the objectives set. Currently, there are different building rating systems (BRS) at European level that allow the evaluation of the degree of sustainability of buildings. During this study, the authors have evaluated to what extent and how the most extended five BRS (NF Habitat HQE, VERDE, DGNB, BREEAM, and HPI systems) in the European framework have integrated the life cycle methodology during their evaluation process. Four methodologies have been used in the research in order to analyse these five systems: quantitative assessment, multi-level perspective, mapping–gap analysis, and expert interviews. Although each methodology has produced different results, the need to harmonise the evaluation criteria at the European level, the insufficient consistency of data software, and the availability of skilled LCA professionals for wider LCA market penetration, among others, should be highlighted. The quality and harmonised data of construction products is required for LCA to give aggregated and transformative results.
1. Introduction
1.1. The Global Impact of Buildings
The decarbonisation of buildings is a crucial milestone if European cities mean to reach their mitigation targets and become sustainable. However, other environmental impact categories are also key in the reduction of the harmful effects of the European construction industry: greenhouse gas (GHG) emissions, abiotic depletion, acidification, eutrophication, energy footprint, water consumption, solid waste production, or the various social impacts. The new circular economy (CE) plans boost the reduction of these impacts, especially in terms of waste management [1]. This and other strategies bring life cycle assessment (LCA) to the forefront of the European buildings’ framework.
The construction sector is responsible for 39% of the GHG emissions [2], updated to 38% in 2020 [3]. From these emissions, 11% is calculated to be currently embodied in building materials and released before the infrastructures are used. Concrete, iron, and steel alone are responsible for ~9% of this 11%. Additionally, according to the Global Alliance for Buildings and Construction [4], in the 2010–2018 period, the newly built area increased by 24%, while GHG emissions and PE grew at a lower rate (by 6%). It has been estimated that embodied GHG emissions could reach up to 50% of the total emissions of the construction sector by 2050 [2]. Being aware of the need for decarbonisation throughout all the life stages of a building, 2010 in Europe was marked by the first version of the Energy Performance of Buildings Directive (EPBD) [5], which made it mandatory for all new buildings to be Nearly Zero Energy (NZEB) by 31 December 2020 [6]. For decarbonisation and energy efficiency purposes, rating systems, performance standards, and a plethora of databases, codes, regulations, and building solutions need to become part of the designing, erecting, and managing of buildings [7].
The construction sector also accounts for 36% of global primary energy (PE) use, meaning that international efforts need to be made in this sector in order to meet the global climate ambitions set forth in the Paris Agreement [8]. They have also estimated that by 2030 the energy intensity per square meter must be reduced by 30% in relation to the 2015 values. While energy efficiency policies are successful during the use-stage of buildings, the sector has recently started to take into account the embodied carbon emissions and energy consumption of building materials and building processes, which have seen rapid growth since 2015 [9]. Integration of the analysis of embodied energy impacts is still barely integrated within LCA in points 9, 10, and 11 of the EN15978 [10]. When this applies to building products, the EN15804 or environmental product declaration (EPD) is particularly noteworthy.
Concerning construction and demolition waste (CDW) generation, the European Union (EU) construction sector produced 923 million tons of waste in 2016 [1]. This represents the largest waste stream in the EU—30% of all waste generated, of which scarcely half was recycled (with a 70% target) [1]. Although the EU’s circular economy strategy is improving the situation, the LCA of CDW is being applied, and the overall landscape of construction stakeholders lacks internal common drivers [11].
1.2. The Historical Perspective
Briefly revisiting the evolution of buildings, primal builders had an intuitive and territorial approach to the efficient use of materials, the comfort of occupants, and indoor hydrothermal balance. Thus, vernacular architecture studies show a growing research interest in the sustainable features of traditional buildings across the globe [12]. Recalling ancient knowledge, architects and anthropologists are engaged in a comprehensive mutual understanding of urban environments [13], aiming at an integrated examination of building sustainability [14]. Both historical and current challenges, together with technical and policy solutions, are understood from a wide and well-founded cultural analysis [15]. This applies to everything, from an understanding of the complementary roles of builders, architects, and engineers in key construction achievements [16] to the assessment of sustainability indicators in vernacular architecture [17] and the emerging futures where artificial intelligence might replace human labour [18].
Industrialisation and demographic changes have turned the traditionally nature-integrated scenario into a vast and complex business, which at its peak of production in Europe (2005–2008) was producing more than 1.5 million homes per year [19]. The construction sector amounts currently to a 66% share of the total internal market trade in goods and services between EU member states [20]. However, the world’s main concentration of building impacts lies in current globalised market trends [21], where LCA gains relevance and is becoming unavoidable. The trend for deep renovation draws a stepwise approach from the life cycle perspective and facilitates the harmonisation of a “passport” that tells the whole history of the building [22].
1.3. The European Standardisation and Level(s) Framework
While local voluntary initiatives and best practices have historically led sustainability efforts within the sector, European policies are now taking over. At the heart of the circular economy and Renovation Wave strategies, the European Joint Research Centre (JRC) has created the Level(s) framework [23] geared towards transforming the sector [24]. Level(s) is a voluntary reporting framework to improve the sustainability of buildings. Using existing standards, it provides a common EU language and approach to assess performance in the built environment. The first version was published in 2017 and was tested in 83 buildings across Europe in 2019. The second version appeared at the start of the Renovation Wave plan in October 2020 [25]. It focuses on six “hotspots” through the whole building life cycle: GHG emissions, resource efficiency, water use, health and comfort, resilience and adaptation to climate change, and cost and value. Its 16 indicators can be used at the design, construction, and operational levels, giving the framework its name and bringing usability to various stakeholders. Relevantly here, Level(s) is the only framework covering all LCA stages [26], as well as the IEQ related factors (thermal, visual and acoustic comfort, plus indoor air quality).
One of the many activities for the penetration of Level(s) into the EU building market [27] is to take advantage of the fittest and most innovative building rating systems (BRS) in the EU. In this study, five BRS have been chosen to run against Level(s). Both BRS and Level(s) had to share a voluntary basis, a set of tools and datasets where life cycle thinking (LCT) is central. As an eligibility criteria, they are second generation BRS and fully integrated in their national sector. They represent a variety of European building cultures. They have been active in the development of Level(s). Other researchers have studied BRS but excluding Level(s) and with different purposes and eligibility criteria [28,29]. Research about Level(s) within BRS has just begun and only on specific issues [30].
1.4. Building Rating Systems (BRS)
The issue about how many BRS exist worldwide is still open, in spite of the much quoted [31] and the regularly updated [32,33] reports from BRE [34]. At that time, more than 600 tools that in some way measured or evaluated the environmental, economic, or social dimensions of the sustainability of buildings were reviewed. Some covered one, two, or all three dimensions. The types differed—147 were selected as environmental tools. Of these, 41 were checked and only 25 fully evaluated—seven for urban planning, three for design, seven for buildings, seven for LCA, and one for infrastructures. Currently, the World Green Building Council has evolved to become the main corporate body, updating what are called “Green Building Rating Tools” (GBRT). In 2016, their 55 GBRTs worldwide had certified 1.04 Bn m2 of sustainably built floor areas [35]. Scientific research has paid attention to whether “Green” BRS can be compared, how they have evolved, and how many aspects of sustainability they include [36]. Primarily Asian researchers have shown an interest in the regional differences of the prevailing “Green” BRS and their future research directions [37]. Additionally, in Europe, the importance of “Green” BRS to attain sustainable buildings is coming into focus [38] under similar premises (the most common BRS compared in scoring terms) with the added value of Level(s).
In our research, the updated version of Level(s) is analysed and five BRS are mapped against it with a focus on LCA and decarbonisation potential in Europe. The idea of harmonising existing BRS has been scanned before, however, not by taking Level(s) into account [39] The BRS align with a common framework contribute with the creation of an assessment method/process able to compare and benchmark buildings internationally. For the reasons discussed, some mainstream BRS have not been included: LEED because it is rooted in the building culture of the USA and because LCA weighs only 3% of the total credits (3 out of a maximum of 110) [40], as well as GreenStar and CASBEE, since they are used in the southeast Pacific and are relatively minor [41]. Another study [42] selected the 36 most representative BRS and compared them using four items: phase of life cycle applied, sustainability aspects assessed, categories considered, and the type and status of the building assessed. The results showed that many BRS do not assess all aspects of sustainable building. Many assess energy and the quality of the interior environment, but few assess relevant social and economic aspects. Our five chosen BRS do qualify in all these aspects. The discussion below will show to what extent their results are aggregable.
The name building “rating” system has been favoured over other frequent terms, such as “assessment” or “evaluation”, because the chosen BRS make use of the more academic “assessment” for rather commercial “rating” purposes. A prefixed adjective such as “green”, “environmental”, or “sustainable” has been avoided, as the selected BRS include process, climate, health, and cultural aspects on top of the environmental, economic, and social aspects common to sustainability. Although Green Building Rating System (GBRS) is frequently used in research and market activity, and has become a Taxonomy concept aimed at clarifying the role of BRS in relation to sustainability and climate change mitigation (Regulation (EU) 2020/852 of the European Parliament and of the Council of 18 June 2020 on the establishment of a framework to facilitate sustainable investment, and amending Regulation (EU) 2019/2088 [43], the term is still ambiguous and prone to “greenwashing”. Simply, BRS stresses the ongoing evolution of the related keywords. An extensive bibliometric analysis of 4203 records of “Sustainable Building Assessment Methods” from 1975 to 2017, assesses the importance of keywords in the evolution of the topic [44].
1.5. The Life Cycle Assessment (LCA)
Adding LCA to the sustainability indicator toolkit addresses the increasing presence of embodied impacts in buildings, especially as building energy efficiency improves and energy use in the operation of buildings decreases [45]. If, in current buildings, the use phase contributes to an 80–85% share in the total life cycle energy use [46], at the same time, other authors claim that their embodied impacts account for 50–70% of the total [47]. Once Nearly Zero-Energy Buildings (NZEB) are the norm, the embodied energy and carbon in buildings will be key to understanding how sustainable or “green” a building is, as well as the right proportion between direct and embedded energy consumption to minimise impacts. This will be also the key to transition towards E+ buildings [48], carbon sinks [49], or regenerative buildings [50]. Nevertheless, a differentiation appears when sustainability (rather qualitative) merges with LCA (more quantitative) into a life cycle sustainability assessment method, as opposed to sustainable building certification [51], which is less evolved than the BRS chosen in this paper. For our purpose, it is relevant to underline that embodied carbon and decarbonisation have not previously been treated as key concepts. Our LCA approach is rooted in all environmental interventions and impact categories [52]. The UNEP-SETAC life cycle initiative is improving an LCT approach to social issues, decision-making support, harmonisation, and uncertainty reduction, as well as further developing LCIA (buildings included). Consequently, the European building and construction sector is currently undergoing a socio-technical transition (STT) influenced by climate change [53], European policies [54], and the evolution of the building sector [55].
1.6. The Goal of the Study
These building rating systems (Table 1) are holistic and close-to-the-market managing bodies, which are key in identifying the real impacts of buildings. European Green Building Councils (GBCs) are at the forefront of this challenge. A goal of this research has been to analyse and compare the five most relevant European BRS, all managed by their respective country’s GBC in their newest version (2020). The study has implemented and combined four different methodologies in order to achieve this objective. They have been selected among other European-born methods for their maturity, representativeness, and market adoption. According to their marketing figures, more than 7000 European buildings have been certified using these BRS, more than 6000 consultants see that their specific skills are increasingly valued by the market, and more than 3000 market actors are associated with their corresponding association.
1.7. Structure of the Study
In the next Section 2, the applied research techniques are listed so as to display the wide range of specifications of the five BRS and to draft a framework for comparing them against Level(s). In the Section 3, the quantitative and qualitative results of the different analyses are shown. In the Section 4, the results are contextualised. Under Conclusions, the section provides clear information to policymakers and experts of the building sector to boost the sustainable transition of the present construction industry. It is not the purpose of this paper to describe in depth the BRS or the Level(s) framework, but to understand their potential for the harmonisation and aggregation of data more concretely in the light of Level(s) and regarding LCA integration. If this proves useful, a boost in these building sustainability assessment tools and an improvement in the sustainability of buildings can be expected. The challenges are complex, and this research and innovation strives to approach them leaving none aside. We also aim to make recommendations to strengthen the links between LCA, BRS, Level(s), and sustainable buildings.
2. Materials and Methods
The following four complementary methodologies have been used in the research in order to achieve a deeper perspective of current environmental impact analysis standardisation in the European framework:
- A quantitative analysis of the presence of the LCA approach in BRS;
- A multi-level perspective (MLP) was followed to contextualise BRS and the Level(s) framework within the building sector and sustainability-related systemic challenges;
- A combined mapping–gap analysis of the Level(s) indicators was performed to check the compliance of the BRS with Level(s);
- Expert interviews were run parallel to provide first-hand data and contextual interpretation from the managers of the BRS.
2.1. Quantitative Analysis of the State of the Art
The 5 BRS selected for this study are the closest to the European market, as they derive less from academic or public administrations, and more from national sectorial associations [61]. These 5 alone include more than 2400 associated corporations and 650 professionals from the sector. They are well interrelated, as the associations where they are carried out (European GBCs from France, Spain, Germany, The Netherlands, and Ireland, respectively) work closely together. These GBCs are active until 2022 in two current R&D projects running in the field: Building Life [62] and LIFE Levels [63]. The work is LCA-inclusive and easily adaptable to Level(s), as they are aligned with European directives and policies transposed into national law. As a result, these BRS are mature in the European construction sector. Of these, BREEAM is present globally and adapted to the Netherlands, while the others are mainly national or spread by language/culture. DGNB (Germany) is widely present in its neighbouring countries and is the most developed in terms of sustainability balance and LCA weight. Its international version, examined here, has been tested in other continents too. When running applied research projects, a common barrier is the limitations to market penetration within the wide scope of its scientific objectives. In the wider field of sustainability, science has provided in-depth awareness of the targets and theoretical processes to reach a balanced ecosystem or a clean, fertile, and thriving environment. Concerning buildings, optimal techniques, materials, and sustainable designs are available. However, market, assignment, and professional realities do not always follow. A gap appears between the expected and real results. However, this poses an opportunity to learn and improve the methodology. Science can reappear to explain said gaps. When this iteration has sufficient items or the procedure has run similarly in other contexts, there arises another opportunity for comparison, analysis, or testing. Mapping these generates new knowledge in a visual form that provides a general overview and allows for rapid conclusions and recommendations.
Moreover, from a bibliometric [64] and scientometric [65] approach, down to a very concrete approach at the encounter between the construction sector’s circular economy and LCA [66,67], the combination of a mapping and a gap analysis enables the researcher to discover patterns and trends, as well as missing strategies, processes, or skills. Then, it recommends steps to help meet the proposed goals. This research, after experiences analysing hundreds of items [42,68], focuses on a few concrete and applied items in the narrower geographical scale of five European countries, which still define a representative muster of the field.
The chosen BRS, through their websites/platforms, technical and administrative guidelines, and profile of customers/providers, have been compared to understand both their technical and operational aspects. As a result, we see that they follow common entry points, glossaries, strategies of implementation, a set of check points, consultants’ profiles, and insights that improve the sustainability of the building within its specifications. The effort, price, and need to engage other experts vary. The marketing, communication, and exploitation of the outcomes and ratings differ too. Sadly, due to data protection and processing efforts, figures aggregated in a harmonised manner, which are fit to inform the national and European markets and policymaking, are few and difficult to obtain.
2.2. Multi-Level Perspective (MLP)
A remarkable methodology for sustainability transitions research—and that is insufficiently applied to buildings—is the multi-level perspective (MLP) [69,70,71]. Using MLP helped place focus on one relatively unseen but key transition of the building sector, namely, that national BRS paired with the European Level(s) are slowly becoming “normal”, which has even inspired policies and Green Public Procurement (GPP) practices. Based on the assumption that (only) regulations make agents change, one would argue that as they are voluntary, BRS would never become mainstream, that merely rating, without the legal power to exclude items below a certain threshold, does not remove the lowest rated items from the sector, or that, in any case, buildings are solely real estate (RE) assets and not cultural and climate-resilient artifacts. Conversely, sustainable buildings are becoming the new norm, setting minimum values and accounting for optimal locations, market opportunities, and capacities to accommodate thriving and resilient societies. This methodology helps to connect the different scales of action and change. It starts by differentiating three levels, each of which comprises one or more socio-technical aspect (including science, the market, and sectorial actors and actions), which this study proposed to apply to the subject, as shown in Table 2.
By coupling LCT with a systemic approach to rating buildings as the selected BRS, buildings can become mainstream artifacts ready for a healthy, resource-efficient future. They can put an end to the “old” 3D (dirty, dangerous, and demeaning) sector [72], which is responsible for vast hazards on land, underground, in the atmosphere, and in the water, with insufficient consideration of comfort, fair distribution, and the right to thrive of all living beings, further alienated from the social value of housing, place, community, liveability, and sustainability. They embody a regime shift that explains many changes occurring. We will adapt Rip and Kemp’s representation of the multi-layered backdrop of novelty and irreversibility [73] and their earlier concept of the technological regime. This allows us to identify niche artifacts, such as LCA, as “technologies at work”, niches where the technological innovation and the socio-technical environment evolve into innovative artifacts.
Moreover, following Geels’ three interrelated conceptual dimensions of STT [69], a proposal is applied to our subject. The dynamic exchange between actors and rules is driven in the socio-technical transition, creating the system, which in turn defines and causes actors and rules to evolve. Continuing with Geels [70], the niche innovations applied in our context are the very specific actions BRS and Level(s) are taking to align and become trendy for European buildings. These are actions leading us to understand the importance of LCT in building design, construction, and management, as well as actions aimed at raising awareness of the health factors of the building, with a special focus on IEQ and actions calling for the public procurement of buildings to introduce these criteria as GPP.
Going further into the methodological detail of MLP applied to BRS, the transition pathways [71,74] for the success of BRS in collaboration with Level(s) speak of an endogenous regime transformation out of its very own unsustainability. This has special significance for the financial sector. As has already occurred with the surge of the electric car industry, we are observing a “selective translation” (Geels, 2018) [75] between green niches, such as BRS and the regime of the building sector. MLP helps to identify other issues, such as the political struggles and innovations around building codes: should these BRS stop being voluntary and become part of the body of the building codes? The way forward is probably to adopt “policy mixes” [76].
The issue of the cultural value of buildings remains open to anthropology—not only monuments are “heritage”. Common buildings are the locus of peoples and their cultures over generations. The way a country shapes its identity lies very much in the building codes and best practices it gives itself. What kind of society will be born out of resilient, decarbonised buildings and cities? What artifacts, rules, and systems will define its conceptual framework and shape its walls and roofs? In a global world ruled by corporations, which business struggles (among competitors but also in relation to nation states and regions) will ease or redirect transition pathways towards niches, such as BRS? Will corporations make a case for LCA in buildings, creating their own standard? Will different business models coexist in diverse sustainability niches?
Applying MLP here aims to identify the transitions between the niche of BRS and the next regime. The effects at a landscape level have been identified and are visible. However, this paper refers to the lower level of the technical struggles and dependencies between the chosen BRS and Level(s). While policies are fully present as GPP recommendations and the influence of BRS on the national decarbonisation roadmaps, we focus on arguably the most promising dependency: of that between LCA and the sustainability rating of buildings. MLP serves to identify and reframe the gaps, compliances, and challenges that appear at the crossroads of Level(s) and BRS in the field of LCA. Thus, the next step for the methodology is to map and analyse the gaps in these dependencies.
2.3. Mapping Procedure and Gap Analysis
The applied mapping procedure has been performed with a spreadsheet to identify how the Level(s) indicators align and conform to the indicators within the BRS. It calculates the percentage “degree of compliance” for the LCA indicator and others within a detailed quantitative conformity assessment. It also gives a rough overview of compliance through a qualitative conformity assessment of all Level(s) indicators. This feeds the gap analysis between Level(s) and the BRS. In addition, it shows compliance with Level(s) at the three levels. For the quantitative procedure, a deep dive into the Level(s) indicators was necessary to break them down into their “methodological aspects” (building scope, system boundaries, and reference standard, etc.). The official report on “How to make performance assessments using Level(s)—Part 3 for office and residential building” [24] and its related spreadsheet “Level(s) common reporting format for all indicators and tools, release v1.3” are the reference for this procedure. For the qualitative procedure, the approach was a brief set of questions sent to the BRS managers. For each item, the choice is “compliant” or “non-compliant”, and each “compliant” is awarded with 1 point and then added to the spreadsheet. Table 3 shows the “degree of compliance” (in %), calculated as the ratio of the achieved points to total possible points, following each one of the headings referenced in the above-mentioned reports. The degree of compliance is calculated for all three levels and sets up the gap analysis.
Finally, for the qualitative assessment, the level to be considered is chosen, and a subjective input is provided as “similar”, with “deviation” or “missing”, with the possibility to add a comment. The levels of knowledge of the building assessment, the BRS used, and Level(s) are high. A wider mapping procedure was performed in the research project (32 items); however, in this article, the 3 indicators related to LCA analysis have been compared: Indicator 1 “Use-stage energy performance”, Indicator 2 “Life cycle Global Warming Potential”, and Indicator 3 “Life Cycle Costs”.
2.4. Expert Interviews
The managers of the five BRS have been contacted per online videocall to fully understand the relationship between the BRS and Level(s) and to check availability and aggregability of data. The same interview pattern has been used to ask them how LCA is taken into account, about the impact of the scheme, and the exploitability of results. A brief questionnaire related to Section 3.3 and Section 3.4 of this paper had been sent in advance by email. The conversations took place in May 2021 with Martin Mooij from BREEAM-NL, Nadége Oury from NF HQE, Paula Rivas from VERDE, Levan Ekhvaia from DGNB, and with Pat Barry from HPI. These interviews aimed to test the validity of the MLP approach and gain in-depth knowledge of the BRS, as well as its compliance with Level(s). The stakeholder constellation and their BRS was briefly discussed and confirmed the proposed view. Some recommendations for further improvements were also collected and will be discussed in the final sections.
3. Results
3.1. Quantitative Analysis of the State of the Art of BRS
A quantitative analysis of the relative weight of LCA in the studied BRS has been carried out in Table 4 to effectively assess how and to what extent LCA is taken into account. Other LC tools related to costs or social aspects are less present across the BRS and are not quantified. These can be better seen in Section 3.4 as the effect of including more or fewer stages, impact categories, and building elements. BRS have a range of credits or points for rating items, such as LCA in this case. Rating is sometimes linear (DGNB, VERDE), sometimes stepwise (HPI, BREEAM, and HQE). Positive action is mandatory for DGNB, VERDE, and HPI, but not for HQE and BREEAM. Figures below correspond to the latest versions for new buildings. Values from older versions can be different for rehabilitation works, offices, and other building types. When a BRS is adapted to second countries, figures also vary: the German version of DGNB has higher values, another country’s version of BREEAM rates up or down. Benchmarks are not yet fully integrated into BRS. This was a subject of debate at the interviews: European policies, with the Nordic countries as frontrunners, are proposing to limit values that will influence the BRS. The exchange between actors, rules, and tools is presented and discussed in Section 3.2. Finally, indicators or aspects related to LCA do not follow an identical approach. VERDE and BREEAM focus on the bill of materials, HQE divides the item in several strands, and HPI and DGNB follow an orthodox LCA. The need for harmonisation will be discussed as a stand-alone issue in Section 4.1.
3.2. Multi-Level Perspective (MLP) Study
Figure 1 is a synthetised proposal of the MLP applied to this research. A set of conceptual, technical, and sociological innovations happen in time and scope. Moving from the left-bottom corner to the upper right, we find: initial prototypes or singular best practices in individual buildings, tools or EPDs that are performed by few actors in short cycles and accumulated over time, creating what the MLP conceptualises as a “regime”. The tools become systems and standards; the wider scale turns into an attainable policy framework intended to be adopted as common practice. A wider scope appears, with a longer-term perspective involving strategies. Over time, policies become structural patterns or cultural expressions; strategies transform the landscape (the construction sector, in our case), and a new (ideal) healthy and resilient scenario appears. A very interesting “diagonal” shift (arrows) occurs as wider scope items accelerate, enriching their vertical and horizontal evolution. This expanded view takes a huge leap from the starting point in Table 2, Section 2.2.).
While Figure 1 is open to discussion, it offers a few lessons: the area of research looks at the policies rather than at the BRS, and while rooted in the present wider scope, it sees ahead to discuss patterns and scenarios. Therefore, another standalone discussion will take place around the decarbonisation of the building sector. Additionally, the already announced discussion on the need to harmonise tools, databases, and processes finds its place here. Seen as columns, the scattered data need to aggregate in order for us to grasp their potential. Meso-scaled pioneering positions need a framework to transform the sector. As niches grow in size, they need to engage in strategies to produce regenerative outcomes. Seen as rows, we can observe a process of the “commoning” of the particular phenomena so that they generalise and become the “new” normal. This process seems to happen not only as time passes but also as the scale increases. However, a progress line from the here and now to the furthest and widest does not seem to appear. An array of best practices does not create a structure, nor does aggregating data and standards decarbonise the sector per se, nor are the tools or the tactical positions enough to sustain a promising strategy. As progress happens in a zigzag, this exercise reaches its limits, and another dimension emerges.
Following Geels [69], a 3D approach helps to enrich the above analysis. If in Figure 1 the two-dimensional approach fails to explain a linear progress, the three interrelated conceptual dimensions of STT applied to our subject, as proposed in Figure 2, intend to clarify why: actors were missing. A more accurate term would probably be “agents”. Actors do play a role, but we are analysing the script. While agents do play a role, they also engage in writing the script—for themselves and for other actors. Mutual exchange happens not by chance, nor is it explained solely by the context. Rather, it is a circular interdependency that permeates all processes and better explains the transition.
The proposal on how specifically BRS can leverage the transition to a rolled-out Level(s) framework is described:
- BRS are socio-technical systems for the sustainability assessment of buildings in GBCs;
- Sustainability pioneers within the construction sectors merge under climate change and circular economy policies;
- RE interests in the EU counteract one another;
- Demand for building materials manufactured in the European market increases;
- National sectorial inertias (but also progresses) retain (and also inspire) bigger goals at EU policy level;
- More ambitious and applicable sustainability assessment systems of buildings are the result, such as the Level(s) framework.
This exercise could be rewritten for other cross-boundary processes, as proposed in Figure 1. It is important to bear in mind that actors are agents, rules, and scripts. Perhaps the crucial aspect here is the script; currently, politics, industries, and social influencers exploit “storytelling”. These narratives are so powerful that both actors and systems fall into the script. This will be discussed later in its own standalone discussion. However, it is important to notice that the transition is not at all free of resistances, pressures, and failed attempts. As the purpose of a system is to perpetuate itself, following Anthony Stafford Beer’s “POSIWID“ (the purpose of a system is what it does), the purpose of a regime is to lock path dependencies. Change is precisely brought about by unlocking them. Alternatives are rarely welcomed by regimes. Explanations have been proposed, such as technological channelling, path dependence, and “lock in” and “lock out” [77]. If Path dependency means that choices for present situations are made based on past behaviour, knowledge, and history—in other words, based on the regime—path dependencies serve to explain the barriers and challenges of the STT of the building sector.
The existing regime is locked in the list of path dependencies proposed in Table 5. If they sound similar to typical assumptions, they appear within quotation marks. Others are presented as open questions. They are not independent from one another, but mutually reinforcing. Some assumptions, beliefs, and regime paths are facing powerful alternatives or seem obsolete. Nonetheless, because they are not from the regime, the alternatives do not reinforce one another. Niche construction and empowerment is still needed for the STT to mature, and this is achieved through socio-political work [78]. However, as transparent reporting practices such as Level(s) and BRS are on the rise, the patterns of the regime might change and complete the transition.
Stretching the MLP methodology in this undergoing reconfiguration of the regime, a window of opportunity appears for niches of radical innovation, such as the entry of Level(s), which is accompanied by European-funded projects, such as LIFE levels. In the peripheries of the regime, volunteer-best practices and pioneering actors have gained visibility, either under the focus of European or national sustainability awards, or under the bottom-up claim of local communities. At a wider level, climate awareness, coupled with the injection of recovery funds, might signify a window of opportunity for European policy, understood as the Renovation Wave. New dependencies are being designed there, at the taxonomy with Level(s), meaning that no financing will be ready to refurbish buildings which are not “green”, as defined in the taxonomy. If they do not report being within its thresholds, following the Level(s) reporting, they fail. As BRS are driving the adoption of and compliance with Level(s), and it turns around LCA, the new paths seem clear: perform LCA within a Level(s)-compliant BRS and your building will succeed in the transition to sustainability. Will it? To answer this question, we have mapped it in detail.
3.3. Mapping Procedure
Table 6 shows the results from the detailed quantitative study of the LCA-related indicators. A degree of compliance of the BRS with the steps of Level(s) reporting at the three levels is presented as a percentage. The colour code in the table below helps to visualise data: 100% green, 80–99% yellow, 50–79% orange, and 0–49% red. As can be seen, the BRS are not as fit as expected, nor do they follow homogeneous trends. The results were shown to the BRS managers, and some upcoming improvements are presented in Section 2.4.
The mapping procedure was carried out regarding new construction rating schemes. This has led to a slight confusion with the “at-occupation stage” aspects of Level(s). This is because BRS predominantly address the “at-design” and “post-completion” stages. Moreover, some GBCs (e.g., DGNB) operate separate “Building in Use” BRS which cover the “at-occupation stage” aspects of Level(s), which were not part of this research. Finally, a methodological question arose as to whether the compliance would be consistent for the three levels. Additionally, NF-HQE required a slightly different aggregation method.
The results show that the adoption of LCC is not yet mature, except for DGNB. Indicators 1.1 and 1.2 behave very similarly, which is positive for the consistency of LCA. However, work is to be performed for VERDE, HPI, and NF HQE. Furthermore, Level(s) must provide instructions for level three of the GWP indicator. It should be noted that the second entry level for LCA indicators rates better than the first (conceptual design). This could mean that other sustainability approaches might be more useful at early design stages than LCA, and LCA could make more sense once the project is fully designed, rather than as it is being projected. More meaningful insights appear when the gaps are seen in the whole picture of the Level(s) indicators.
3.4. Gap Analysis
If the mapping procedure shows where and how Level(s) is present at the BRS, complementarily, the gap analysis aims at finding where and how the BRS miss Level(s) and what can they do to reconnect. Doing this would increase conformity, as was presented to the BRS managers. Regarding indicators with a deviation, the following options were recommended accordingly: (a) suggestions concerning further developments of the Level(s) framework; (b) possible conversion of the data submitted in the BRS certification process to be adapted into Level(s) procedures; and (c) adjustments to the BRS to comply with Level(s). Some general recommendations were also identified, including adjusting LC stages (Level(s) suggests scenarios instead, which do not easily define the system boundaries of a building), adjusting reference study periods, or adding abiotic depletion potential for fossil fuels. Table 7 shows results of the gap analysis for all five BRS in 12 analysed indicator categories, all of them divided into Level 1, 2, and 3 degrees of compliance.
The relevant key findings are:
- Deviations appear in particular in the “goal and scope” aspects;
- Degree of compliance is consistent across the three levels;
- “Boundary and scope” aspects have a high degree of compliance;
- Deviations across the three levels are caused predominantly because of “at occupation stage” aspects at Level 2 and Level 3.
3.5. Expert Interviews
Finding relevant quantitative data to support the described research has been met with several barriers:
- The private character of LCA within rating schemes;
- The untraceable variety (free choice) of tools and databases used;
- The variation of approaches, scope, and inclusion criteria of LCA in the last 10 years;
- The scarcity of fully assessed buildings under comparable typologies.
Early in the research process, it was seen as necessary to gain knowledge from direct sources. The conversation with the managers of each BRS was friendly and insightful for all. Summing up the feedback, we could not find data about the real performance of the certified buildings. This was also asked of another key agent, Josefina Lindblom from DG Env, but data from the buildings tested by Level(s) from 2019 to 2020 could not be accessed due to the fact that the relationship with the testers was finished or for privacy reasons. Anyway, some initial figures are provided with the following limitations: while NF HQE numbers are very high (over 60,000 homes certified), no aggregated figures were available; BREEAM provided reference benchmarks of their “excellent”-rated buildings; and HPI provided average rating qualifications, which have been transformed into their own suggested comparable units. VERDE was able to provide real figures from the 2008 to 2015 period, while DGNB facilitated figures from the 2015 to 2017 period. In both cases, averages have been drawn from the data provided. Some figures for offices were also provided but have been left aside in this study. Two significant data sets have been harmonised as much as possible in Table 8 and averaged for new homes: primary energy demand (PED) and global warming potential (GWP), and both were limited to the surface area of the building (yearly, in the case of energy demand).
This is in line with a recent critical literature review on environmental benchmarks for buildings found at the closing of this paper [79]. It proves that rated buildings from the BRS perform better than average buildings. This is not sufficient to draw conclusions but gives a hint to the consistency of LCA-aggregated results, which are used by the taxonomy and the Nordic countries [80].
Concerning the mapping–gap analysis, some insights were identified by the experts. Firstly, not everyone was fully acquainted with the second version published in October 2020. All had been involved in the test phase between the first and second versions and were aware of the improvements. All agreed that many improvements in the second version can be credited to the dialogue between the BRS and the Level(s) development teams at DG Env and JRC. In practical terms, it means that the results presented are not fully updated to the second version. This does not affect the validity of the results. The gaps identified in the analysis were welcomed by the experts, who suggested future improvements within their respective BRS. For indicators 1.2 and 2.4, filling in these gaps means to add impact categories, add result interpretation, adjust cut-off rules, adjust reference study periods, and in the case of BREEAM-NL, adjust life cycle stages. Finally, for indicator 6.1, there is a need for all to adjust discount rates, reported costs, and add scenarios.
The issue of the reference study period remains open. British and Irish cultures favour a 60-year period, but continental Europe marks 50 years for the use-stage of a building and is thus applied in LCA calculations. The first version of Level(s) used 60, but after the test phase, the second version functions with a 50-year study period. This reduction influences final LCA values. Furthermore, the question of making all life cycle stages as well as all impact categories mandatory remains open. While carbon metrics are best known and accepted, and climate mitigation uses GWP and GHG in CO2 eq units as a star indicator, buildings have equally dire impacts on acidification, ozonification, and very clearly on abiotic resource depletion, including minerals, metals, and fossil fuel. In addition, its water footprint is well known but seldom included in LCA. Last, but not least, the GWP of land use and change (LULUC) might be as important as the energy-related GWP. The common understanding is that GWP acts as a spearhead for all the other impacts wherever relevant.
Including all stages is more easily solved. In the detailed mapping and in Table 4, it is clearly identified how all BRS except BREEAM demand all stages for the best rated buildings. The effort to calculate LCA for all stages, as well as to include all impact categories, is high and might not be needed for early design. Once more, the three entry levels of Level(s) make sense. A final issue that arose during the interviews was that related to including all building elements in the LCA calculation, only BREEAM-NL failed to solve this, at least for the best rating. It is commonly agreed that it is not enough to include a few materials with EPD. Even all materials with EPD would not necessarily lower the LCA result. The life cycle of all building materials and elements should be analysed to call it a building LCA. This raised another challenge, namely the insufficient availability of data, which are the very basis of LCA.
The MLP methodology was not known to any of the interviewees. The GBCs, where they are active, are, in fact, key agents in the transition. This was well understood and accepted. Nevertheless, while acknowledging a positive recent evolution, all informed that their national markets offer resistance. They identify themselves as pioneers.
4. Discussion and Future Steps
For wider LCA market penetration, the insufficient consistency of data software and availability of skilled LCA professionals are weak points. Harmonised data availability and transparency in the processing of data within the calculation tool (not necessarily a complex software but simple spreadsheets might be enough) are urgent needs. There are open source and free solutions, but their databases are not that easy to obtain or they are not tailored for buildings [81]. Proprietary tools are well adapted but are not free. Some countries (Netherlands, Germany, France) have national databases, and there is an ongoing discussion regarding whether, for a building sector to provide reliable figures, a national database is necessary. Were this to be the case, it must not hinder aggregation. However, Level(s) does not come with a Europe-wide database. Although for LCA stages A and B this could easily be adjusted with national energy and transport impacts, for stages C and D, national policies vary enormously. The taxonomy establishes “Do No Significant Harm” waste benchmarks, which are impossible to accomplish quickly in some countries. Findings from the MLP teach us to recommend that all these artifacts need to evolve in parallel so that the regime changes.
More concretely, some key manufacturers, namely steel and cement producers, play a crucial role: they are at the same time the heaviest polluters and energy demanders, and the biggest investors in sustainable innovations. If they do not diminish their impact, they might fall outside of the regulations, but they are also prone to greenwashing, to swallowing huge public funds, and they are, inevitably, resource predators. A change in the regime inevitably means a change in their role. However, no more than 75 years ago, reinforced concrete was not a relevant building material. Can it lose relevance again? Are low-carbon materials such as timber and mud a real alternative? Market and scientific studies answering this [82] are, however, outside the scope of this paper. Nonetheless, it can be stated that, as mentioned in the introduction’s brief historical review, vernacular architecture was and may once again be the solution. On the other hand, if in the present regime architecture falls in the realm of RE, a deep regime shift must happen for up-to-date vernacular architecture to be understood as an alternative.
Recently, the regulatory framework has been pushed by the EC through the JRC. The result has been a profound methodological transformation at the product level, from EN 15,804 + A1 to EN 15,804 + A2, and at the building level, with the revision of EN15978 and of Level(s). Will the regulations be effective to deal with the challenges it poses, mainly for the construction industry, but also for the professionals in the sector? Are the standards and tools mature enough to face these challenges? Evidence found in this paper suggests hard work will be required to meet expectations.
While in Europe only 2.5% of the total built area [68] is certified, highly developed and densely built countries, such as Singapore, have 1/3 of their building stock certified (mainly with the BCA Green Mark). However, Europe is leading the way to integrated policies, voluntary schemes, and market value in favour of sustainable buildings and LCA. The success of EPBD policies and Level(s) by introducing LCT in its objectives and indicators paves the way to decarbonising new European buildings [83]. If the path dependencies described in the MLP results are further unlocked, the European building sector might find itself already in a deep transition.
Three other issues deserve a specific discussion:
4.1. Harmonisation of BRS and Data at European Level
If we agree that Level(s), present standards, and norms mark the future methodology for the sustainability assessment of buildings, the evaluation of products and buildings should follow these standards, both at the product level and at the building level. However, its adoption and application still need to be harmonised. As mentioned before, all stages, impact categories, and building elements need to be equally included. If this succeeds, either in BRS or as criteria for GPP, it can support the regulatory evolution of the different national building codes and turn progressively from voluntary to mandatory. Remaining voluntary might weaken the momentum to shift the regime. The need for harmonisation must clarify the inclusion of other relevant issues; crucially, the health and comfort aspect. Initiatives such as the IEQ-Compass [84] or the TAIL scheme [85] attempt to upgrade this issue and further relate IEQ parameters with energy performance and life cycle metrics, following ISO 1772-1, EN 16798-1, and EN 16798-2. Under a scenario of normalised NZEBs, life cycle costing must also optimise IEQ to reach long-term climate targets. While this area of research is not new [86], it remains open for future investigations.
In Level(s), several levels of data quality are allowed and subsequently categorised. Different levels of evaluation are established, whose choice depends on the phase of the project and the objective of the assessment. Categories are based on a quality score averaging between its relevance and its accuracy. The degree of (un)certainty or reliability is provided by the origin of data, mainly local EPDs. Generic default data is less accurate and is penalised with very high load factors to encourage manufacturers to generate their own data. The geographical and technological representativeness of the data implies that data must be localised. However, there is a huge amount of data generated in different contexts (tools, databases, European projects) that is essential to add value, and could be integrated into a European database in the near future, once its quality and adaptability to all regions has been verified. National databases, whether they exist yet or not, need to align with European ones, and BRS are fit to use one or the other. The International Open Data Network for Sustainable Building is managing to convince all data developers and providers, as well as all LCA software providers, that harmonised data is a must.
4.2. Pathways to Building Decarbonisation
According to the WGBC’s “Bringing Embodied Carbon Upfront” Report [2], the world’s total global floor area of buildings is projected to double by 2060, a growth of 230 Bn m2, which is equivalent to the size of New York City every month, mostly in the Global South. There are also equally huge retrofit requirements in the Global North: In Europe, an estimated 97% of the building stock is not efficient enough to comply with the Paris Climate agreement. If business goes as usual, embodied carbon could make up half of total new construction emissions between now and 2050. As the energy performance of buildings improves, the impact share of embodied carbon will increase.
The mentioned study [83] on the balance between operational and embodied carbon shows results based on the LCA of 238 buildings: while there is a reduction trend in LC emissions due to improved operational energy performance, an increase is demonstrated in the relative and absolute contributions of embodied carbon (emissions arising from the manufacturing and processing of building materials), particularly for residential buildings. Some [87] add a dynamic indicator (cumulative radiative forcing and global mean temperature change) to LCA for all the climate scenarios to 2050, within a time function for climate change of 500 years. The main outcome of the comparison between dynamicLCA and LCA is that the results can be greatly different, especially when biogenic carbon is present from low-carbon materials. Their methodology calls for a temporal dimension of the inventory and the impact indicators. This links building science closely with climate science, which will necessarily become a cross-cutting field of research. In this context, basic actions to design new low-carbon buildings and their respective reductions in GHG emissions are identified [82]. Its effect needs to be analysed under a cohesive and harmonised building LCA.
However, these studies are neither known nor demanded by the building sector. Manufacturers are doing EPDs within the EN 15,804. It is worth underlining the exponential evolution in EPDs in the construction sector in the last 10 years. From less than 100 EPDs, developed by three countries, we now see more than 7000 developed by 25 agents/countries. While the EPD might be no more than a strategy to sell their products, baselines are needed for the building to limit its overall value of decarbonisation and other impacts. This can be performed with sectorial or generic EPDs, provided they contain all impact categories. As mentioned in the results, carbon metrics must be the spearhead of all other impacts. Climate change affects not only the atmosphere, but also the land, watersheds, and biodiversity, which are as important, and arguably more crucial, for human life. Any transition needs to understand the relationships between at least air, soil, water, and life, but also the continuity between the individual, society, and the ecosystems. While green may be the colour of chlorophyl, just as important are the red of oxygenated haemoglobin, the brown of humic acid, and the transparency of clean water.
4.3. The Storytelling Flaws of the Green Socio-Technical Transition
The regime of the building sector, in synergy with the energy, financial, and urban facilities and services sectors, ignoring pioneers and volunteers, is profiled by a diffuse value chain, dominated by a few huge construction industries that possess great influence on the policy agenda, and which have gained cultural storytelling hand in hand with the RE business. Overshadowed by these, science and user demand become secondary players. For the regime, green is just a colour, used and abused to hide its grey emissions. In Europe, there are (figures from 2019) about 50.000 companies in the construction sector (buildings and infrastructures), with 12 million employees and a yearly turnover of around EUR 1.5 billion. The top 100 companies’ share of the turnover is one third of the total, while the accumulated turnover of the top 10 reaches EUR 235 billion (15%). Alone, the three top French companies (Eiffage, Bouygues, and Vinci) amass over EUR 100 billion [88]. A critical eye is needed when reading news about their green investments. It would be equally unsustainable for BRS, LCA, EPDs, and the green innovations to lay at the feet of their interests. If green buildings become a privilege for a few, the sector will have failed in its transition.
The financial sector entered into sustainable assets before the mainstream RE did (the niche of the highest standard RE already considered green-certified buildings, and LEED has been a key marketing lever for this, notwithstanding a degree of greenwashing). There has been a huge shift of RE assets to “vulture funds”, which has created a reaction among local governments and society, as well as other handlings that exceed the purpose of this paper, but are part of the landscape. Many European buildings, especially in the city centres, have not undergone integral refurbishment and lack the basic features of current building codes and lifestyles. All these internal changes have fed the surge of the BRS and the demand for sustainable buildings. Materials and buildings passports can boost and track this necessary deep renovation. However, where building is not necessary, the most sustainable m2 is one that is not built, just as the cleanest kWh is one that is not consumed. Green finance must be at the service of protecting life, not buildings.
The European Construction Sector Observatory regularly analyses and carries out comparative assessments on the construction sector in all 27 EU countries and the UK, to provide policymakers and stakeholders with up-to-date information on market conditions and policy developments. Its five priorities are financing and digitalisation, skills and qualifications, resource efficiency (focusing on low-emission construction, recycling and valorisation of construction, and demolition waste, and is thus related to this paper’s focus), the regulatory framework, and international competition. It does not reject green storytelling when placing as much interest in digitalising and going abroad as in resource efficiency and upskilling. The heads of the regime are both policymakers and the CEOs of big companies. Perhaps policymakers need to step down first.
Pioneering processes and results provide a regular drip of extraordinary buildings whose inherent value, after a short marketing “shooting star” effect—or no marketing at all—is either swallowed by the regime or remains anonymous. However, as BRS gain marketing value, the rating leaves less and less space for fakes, and as the climate challenges highlight best practices, more windows of opportunity and increased momentum is attained by truly sustainable buildings. The European Taxonomy Regulation and delegated acts were published in July 2020 to set four overarching conditions that any economic activity (including buildings) must meet in order to qualify as environmentally sustainable [89]. However successful all this appears, if it falls into the green narrative and it can easily be washed away. Pioneers must meet, collaborate, and aggregate knowledge, potential, and results so that the niche they create transforms the regime.
The exogenous context is shaped by climate change mitigation (the decarbonisation of the building sector and stock) and very recently by the pandemic and the mandatory home lockdown. While regulatory pressure on energy efficiency has been growing for 10 years, it was in 2021 that NZEB became compulsory. NZCB are a central concept for national and European decarbonisation goals. In this scenario, Level(s) stands as the cornerstone for the decarbonisation strategy, the circular economy package, and the resilience of the European building stock. If the national building sectors were reluctant to take action, and the overall decarbonisation strategies did not consider buildings as a key issue, it is the very socio-technical landscape that is marking the route for future developments. Decarbonisation cannot be prey to greenwashing or it will fail to pave the way for the other just-as-important impact categories.
5. Conclusions
Approaching the challenges of a complex methodology such as LCA in an equally complex sector such as that of buildings, under the lens of Europe’s complex regulatory framework, and targeting not one single aspect, but all those present, has been a complex quest. Nonetheless, simplifying it by reducing the scope or depth or selecting—by any criteria—one single aspect, neither seemed to fit the size of the impacts of the sector nor the obvious transition it is undergoing.
Quality and harmonised data of construction products are required for LCA to give aggregated and transformative results. These are necessary to comply with current and future legal and voluntary requirements and to foster the decoupling of the building sector from the current consumption of resources and generation of impacts. Data and software providers are asked to collaborate and facilitate access. Upskilled experts are needed.
According to the standard, LCA for buildings must follow a modular approach, reporting the full set of impacts and stages where they occur, so as to avoid a transfer or denial of loads. It needs to include all building elements. All impacts must follow the carbon footprint as being the most known impact, and their relevance for the sector featured. The loss of biodiversity, land occupation, and water usage impacts need urgent attention.
The Level(s) framework, with its due compliance to the Renovation Wave and the taxonomy, is a powerful changemaker, able to deter greenwashing, misleading financing, and obscuring information. The European building sector is attentive to its evolution and the academy is researching on its potential and adoption pathways. Level(s) needs to become mainstream and complete tools, data, benchmarks, and interpretation criteria.
BRS are well equipped connectors between Level(s), the market, public procurement, and society. They are adopting the framework, filling in the gaps within their systems in order to provide, together with the rating, a ”Level(s) compliant” seal. This effort is also driving the harmonisation of data and LCA. Playing a voluntary role might be heavily challenged if mandatory rules appeared.
These BRS are exploiting their national niches at their limited but steadily growing Green Building Councils, which are pioneering their markets as key agents, writing a new script for the building sector. However, they need to expand in scope and to continue evolving. They might be too young to shift the path dependencies of their sectors, making socio-political action key for them to mature and lead the transition of the sector.
The multi-level perspective methodology proves fit to understand and explain the innovation niches, the path dependencies of the regime, and the STT that the European building sector is undergoing towards a sustainable pattern. It must decarbonise, adapt to climate change, and provide healthy indoors and regeneratively built environments. Should it fail, its own unsustainability might lead it to collapse.
Author Contributions
Data curation, B.I.; Methodology, B.I.; Supervision, O.A.-G. and X.O.; Writing—original draft, B.I. All authors have read and agreed to the published version of the manuscript.
Funding
This research was funded by the research project LOCAL-REGEN (PID2019-104871RB-C22), supported by the Spanish Ministry of Science and Innovation (Ministerio de Ciencia e Innovación) – State Research Agency/10.13039/501100011033.
Data Availability Statement
The data that support the findings of this study are available on request from the main author (Izaola B.—[email protected]). The data are not publicly available as to not the compromise of privacy of the research participants and the five BRS institutions present in the research.
Acknowledgments
The work presented in this paper belongs to the research projects LIFE Level(s) (GIE/ES 1000911) project, whose aim is to accelerate the penetration of the Level(s) Framework into markets; and Project LOCAL-REGEN (PID 2019-104871RB-C22), funded by the Ministry of Science and Innovation—State Research Agency/10.13039/501100011033. Moreover, this research work is part of the main author’s (Izaola B.—[email protected]) Doctoral Thesis that aims to investigate on the applicability of LCA to European buildings.
Conflicts of Interest
The authors certify that they have no affiliations with or involvement in any organisation or entity with any financial interest, or non-financial interest, in the subject matter or materials discussed in this manuscript.
Abbreviations
| ADP | Abiotic Depletion Potential |
| AP | Acidification Potential |
| BRS | Building Rating Systems |
| BREEAM | Building Research Establishment Environmental Assessment Methodology |
| CE | Circular Economy |
| CASBEE | Comprehensive Assessment System for Built Environment Efficiency |
| CDW | Construction and Demolition Waste |
| DGNB | Deutsche Gesellschaft für Nachhaltiges Bauen |
| DGBC | Dutch Green Building Council |
| EPBD | Energy Performance of Buildings Directive |
| EPD | Environmental Product Declaration |
| EP | Eutrophization Potential |
| GWP | Global Warming Potential |
| GBC | Green Building Council |
| GBRT | Green Building Rating Tool |
| GPP | Green Public Procurement |
| GHG | Greenhouse Gas |
| HQE | Haute Qualité Environnementale |
| HPI | Home Performance Index |
| IEQ | Indoor Environment Quality |
| JRC | Joint Research Centre |
| LULUC | Land Use and Land Use Change |
| LEED | Leadership in Energy & Environmental Design |
| LCA | Life Cycle Assessment |
| LCC | Life Cycle Costs |
| LCIA | Life Cycle Impact Assessment |
| LCT | Life Cycle Thinking |
| MLP | Multi-Level Perspective |
| NZCB | Nearly Zero-Carbon Buildings |
| NZEB | Nearly Zero-Energy Buildings |
| PE | Primary Energy |
| PED | Primary Energy Demand |
| RE | Real Estate |
| STT | Socio-Technical Transition |
| UNEP | United Nations Environmental Program |
| VERDE | Valoración de Eficiencia de Referencia de Edificios |
References
- European Commission. Circular Economy Principles for Buildings Design. 2020. Available online: https://ec.europa.eu/docsroom/documents/39984 (accessed on 5 April 2021).
- Adams, B.; Richardson, S. Bringing Embodied Carbon Upfront. 2019. Available online: https://www.worldgbc.org/sites/default/files/WorldGBC_Bringing_Embodied_Carbon_Upfront.pdf (accessed on 5 April 2021).
- UNEP. 2020 Global Status Report for Buildings and Construction: Towards a Zero-emission, Efficient and Resilient Buildings and Construction Sect. 2020. Available online: http://globalabc.org/sites/default/files/inline-files/2020%20Buildings%20GSR_FULL%20REPORT.pdf (accessed on 5 April 2021).
- UNEP. 2019 Global Status Report for Buildings and Construction. 2019. Available online: https://globalabc.org/sites/default/files/2020-03/GSR2019.pdf (accessed on 5 April 2021).
- Fernbas. Energy Performance of Buildings Directive. 2019. Available online: https://ec.europa.eu/energy/topics/energy-efficiency/energy-efficient-buildings/energy-performance-buildings-directive_en (accessed on 12 October 2020).
- Paoletti, G.; Pascuas, R.P.; Pernetti, R.; Lollini, R. Nearly Zero Energy Buildings: An Overview of the Main Construction Features across Europe. Buildings 2017, 7, 43. [Google Scholar] [CrossRef]
- Liang, L.; Wen, B.; Musa, S.N.; Onn, C.C.; Ramesh, S.; Yan, J.; Wang, W. Rectify the performance of Green Building Rating Tool (GBRT) in sustainability: Evidence from ISO 21929-1. J. Clean. Prod. 2021, 278, 123378. [Google Scholar] [CrossRef]
- Abergel, T.; Dean, B.; Dulac, J. Towards a Zero-Emission, Efficient, and Resilient Buildings and Construction Sector; GLOBAL STATUS REPORT 2017; UN Environment: Nairobi, Kenya; International Energy Agency: Paris, France, 2017; Available online: https://www.worldgbc.org/sites/default/files/UNEP%20188_GABC_en%20%28web%29.pdf (accessed on 12 October 2020).
- Hu, M.; Milner, D. Visualizing the research of embodied energy and environmental impact research in the building and construction field: A bibliometric analysis. Dev. Built Environ. 2020, 3, 100010. [Google Scholar] [CrossRef]
- CEN. EN 15978:2011. Sustainability of Construction Works—Assessment of Environmental Performance of Buildings—Calculation Method. 2011. Available online: https://standards.cen.eu/dyn/www/f?p=204:110:0::::FSP_PROJECT:31325&cs=16BA443169318FC086C4652D797E50C47 (accessed on 4 November 2020).
- Gálvez-Martos, J.-L.; Styles, D.; Schoenberger, H.; Zeschmar-Lahl, B. Construction and demolition waste best management practice in Europe. Resour. Conserv. Recycl. 2018, 136, 166–178. [Google Scholar] [CrossRef] [Green Version]
- Nguyen, A.T.; Truong, N.S.H.; Rockwood, D.; Le, A.D.T. Studies on sustainable features of vernacular architecture in different regions across the world: A comprehensive synthesis and evaluation. Front. Archit. Res. 2019, 8, 535–548. [Google Scholar] [CrossRef]
- Stender, M. Towards an Architectural Anthropology—What Architects can Learn from Anthropology and vice versa. Archit. Theory Rev. 2017, 21, 27–43. [Google Scholar] [CrossRef]
- Vellinga, M. The noble vernacular. J. Archit. 2013, 18, 570–590. [Google Scholar] [CrossRef]
- Gonsalves, K. The Relationship between Vernacular Architecture and Cultural Environments; Heriot Watt University: Edinburgh, UK, 2020; p. 14. [Google Scholar]
- Fenske, G. Architect, Engineer, and Builder. J. Urban Hist. 2016, 42, 811–821. [Google Scholar] [CrossRef]
- Olukoya, O.A.P.; Atanda, J.O. Assessing the Social Sustainability Indicators in Vernacular Architecture—Application of a Green Building Assessment Approach. Environments 2020, 7, 67. [Google Scholar] [CrossRef]
- Ingarden, K. From Architecture Without Architects to architecture after architects. Tech. Trans. 2019, 2019, 19–30. [Google Scholar] [CrossRef] [Green Version]
- Eurostat. Construction Permit Index Overview. 2019. Available online: https://ec.europa.eu/eurostat/statistics-explained/index.php/Construction_permit_index_overview (accessed on 13 October 2020).
- European Commission. Strengthening the Internal Market for Construction—Executive Summary. 2019. Available online: https://ec.europa.eu/docsroom/documents/33803/attachments/1/translations/ (accessed on 13 October 2020).
- Pauliuk, S.; Heeren, N.; Berrill, P.; Fishman, T.; Nistad, A.; Tu, Q.; Wolfram, P.; Hertwich, E.G. Global scenarios of resource and emission savings from material efficiency in residential buildings and cars. Nat. Commun. 2021, 12, 5097. [Google Scholar] [CrossRef] [PubMed]
- Sesana, M.M.; Salvalai, G. A review on Building Renovation Passport: Potentialities and barriers on current initiatives. Energy Build. 2018, 173, 195–205. [Google Scholar] [CrossRef] [Green Version]
- European Commission. Taking Action on the Total Impact of the Construction Sector; Publications Office, 2019; Available online: https://data.europa.eu/doi/10.2779/458570 (accessed on 12 October 2020).
- Dodd, N.; Cordella, M.; Traverso, M.; Donatello, S. Levels A Common EU Framework of Core Sustainability Indicators for Office and Residential Buildings. 2017. Available online: https://susproc.jrc.ec.europa.eu/product-bureau/sites/default/files/contentype/product_group_documents/1581681499/170816_Levels_EU_framework_of_building_indicators.pdf (accessed on 13 October 2020).
- Dodd, N.; Cordella, M.; Traverso, M.; Donatello, S. Level(s)—A Common EU Framework of Core Sustainability Indicators for Office and Residential Buildings. 2020. Available online: https://susproc.jrc.ec.europa.eu/product-bureau//sites/default/files/2020-10/20201013%20New%20Level(s)%20documentation_1%20Introduction_Publication%20v1-0.pdf (accessed on 19 October 2020).
- BPIE. Whole-Life Carbon: Challenges and Solutions for Highly Efficient and Climate-Neutral Buildings; Buildings Performance Institute Europe: Berlin, Germany, 2021. [Google Scholar]
- Env, D.G. Level(s) European Framework for Sustainable Buildings. 2020. Available online: https://ec.europa.eu/environment/topics/circular-economy/levels_en (accessed on 4 December 2020).
- Polli, G.H.B. A Comparison about European Environmental Sustainability Rating Systems: BREEAM UK, DGNB, LiderA, ITACA and HQE. U. Porto J. Eng. 2020, 6, 2. [Google Scholar] [CrossRef]
- Bernardi, E.; Carlucci, S.; Cornaro, C.; Bohne, R.A. An Analysis of the Most Adopted Rating Systems for Assessing the Environmental Impact of Buildings. Sustainability 2017, 9, 1226. [Google Scholar] [CrossRef] [Green Version]
- Del Rosario, P.; Palumbo, E.; Traverso, M. Environmental Product Declarations as Data Source for the Environmental Assessment of Buildings in the Context of Level(s) and DGNB: How Feasible Is Their Adoption? Sustainability 2021, 13, 6143. [Google Scholar] [CrossRef]
- Reed, R.; Bilos, A.; Wilkinson, S.; Schulte, K.-W. International Comparison of Sustainable Rating Tools. J. Sustain. Real Estate 2009, 1, 1–22. [Google Scholar] [CrossRef]
- Reed, R.; Krajinovic-Bilos, A. An Examination of International Sustainability Rating Tools: An Update. In Proceedings of the 19th PRRES Pacific Rim Real Estate Society Conference, Melbourne, Australia, 13–16 January 2013; p. 23. [Google Scholar]
- Doan, D.T.; Ghaffarianhoseini, A.; Naismith, N.; Zhang, T.; Ghaffarianhoseini, A.; Tookey, J. A critical comparison of green building rating systems. Build. Environ. 2017, 123, 243–260. [Google Scholar] [CrossRef]
- Horner. BRE Assessment of Sustainability Tools. 2004. Available online: https://download.sue-mot.org/envtooleval.pdf (accessed on 4 December 2020).
- WGBC. Green Building Councils and Rating Tools; World Green Building Council, 2020; Available online: https://www.worldgbc.org/rating-tools (accessed on 4 December 2020).
- Reed, R.G.; Krajinovic-Bilos, A.; Reed, M.A.J. Green Building Rating Systems. In Encyclopedia of Sustainable Technologies; Abraham, M.A., Ed.; Elsevier: Oxford, UK, 2017; pp. 99–112. [Google Scholar] [CrossRef]
- Shan, M.; Hwang, B. Green building rating systems: Global reviews of practices and research efforts. Sustain. Cities Soc. 2018, 39, 172–180. [Google Scholar] [CrossRef]
- Cordero, A.S.; Melgar, S.G.; Márquez, J.M.A. Green Building Rating Systems and the New Framework Level(s): A Critical Review of Sustainability Certification within Europe. Energies 2019, 13, 66. [Google Scholar] [CrossRef] [Green Version]
- Erten, D. A Roadmap for Localizing and Harmonising Existing Green Building Rating Tools. Sci. Technol. 2018, 4, 16. [Google Scholar]
- Morrison, H. LEED-Case-Study.pdf. 2014. Available online: https://cwc.ca/wp-content/uploads/2013/11/LEED-Case-Study.pdf (accessed on 12 November 2020).
- Jensen, K.G.; Birgisdottir, H. Guide to Green Building Certifications. 2018. Available online: https://gxn.3xn.com/wp-content/uploads/sites/4/2018/08/Guide-to-Green-Building-Certifications-August-2018-weblow-res.pdf (accessed on 13 October 2020).
- López, C.D.; Carpio, M.; Martín-Morales, M.; Zamorano, M. A comparative analysis of sustainable building assessment methods. Sustain. Cities Soc. 2019, 49, 101611. [Google Scholar] [CrossRef]
- Regulation (EU) 2020/852 of the European Parliament and of the Council of 18 June 2020 on the Establishment of a Framework to Facilitate Sustainable Investment, and Amending Regulation (EU) 2019/2088 (Text with EEA relevance). 2020. Available online: http://data.europa.eu/eli/reg/2020/852/oj/eng (accessed on 4 December 2020).
- Díaz-López, C.; Carpio, M.; Martín-Morales, M.; Zamorano, M. Analysis of the scientific evolution of sustainable building assessment methods. Sustain. Cities Soc. 2019, 49, 101610. [Google Scholar] [CrossRef]
- Hernandez, P.; Oregi, X.; Longo, S.; Cellura, M. Chapter 4—Life-Cycle Assessment of Buildings. In Handbook of Energy Efficiency in Buildings; Asdrubali, F., Desideri, U., Eds.; Butterworth-Heinemann: Oxford, UK, 2019; pp. 207–261. [Google Scholar] [CrossRef]
- Oregi, X.; Hernandez, P.; Gazulla, C.; Isasa, M. Integrating Simplified and Full Life Cycle Approaches in Decision Making for Building Energy Refurbishment: Benefits and Barriers. Buildings 2015, 5, 354. [Google Scholar] [CrossRef] [Green Version]
- Cabeza, L.F.; Boquera, L.; Chàfer, M.; Vérez, D. Embodied energy and embodied carbon of structural building materials: Worldwide progress and barriers through literature map analysis. Energy Build. 2020, 231, 110612. [Google Scholar] [CrossRef]
- Magrini, A.; Lentini, G.; Cuman, S.; Bodrato, A.; Marenco, L. From nearly zero energy buildings (NZEB) to positive energy buildings (PEB): The next challenge—The most recent European trends with some notes on the energy analysis of a forerunner PEB example. Dev. Built Environ. 2020, 3, 100019. [Google Scholar] [CrossRef]
- Pomponi, F.; Hart, J.; Arehart, J.H.; D’Amico, B. Buildings as a Global Carbon Sink? A Reality Check on Feasibility Limits. One Earth 2020, 3, 157–161. [Google Scholar] [CrossRef]
- Gallardo, A.Q. On Life Cycle Assessment in the Built Environment: From Conventional Sustainability to Regeneration and Glocal Architecture. Ph.D. Thesis, Universitat Politècnica de València, Valencia, Spain, 2021. [Google Scholar] [CrossRef]
- Llatas, C.; Fornos, R.A.; Bizcocho, N.; Albalá, I.C.; Falcón, R.; Galeana, I.; García-Martínez, A.; De Cózar, J.C.G.; Alonso, S.L.; Meda, P.; et al. Towards a Life Cycle Sustainability Assessment method for the quantification and reduction of impacts of buildings life cycle. IOP Conf. Ser. Earth Environ. Sci. 2019, 323, 012107. [Google Scholar] [CrossRef] [Green Version]
- Verones, F.; Bare, J.; Bulle, C.; Frischknecht, R.; Hauschild, M.Z.; Hellweg, S.; Henderson, A.; Jolliet, O.; Laurent, A.; Liao, X.; et al. LCIA framework and cross-cutting issues guidance within the UNEP-SETAC Life Cycle Initiative. J. Clean. Prod. 2017, 161, 957–967. [Google Scholar] [CrossRef] [Green Version]
- Wang, H.; Chen, W.; Shi, J. Low carbon transition of global building sector under 2- and 1.5-degree targets. Appl. Energy 2018, 222, 148–157. [Google Scholar] [CrossRef]
- European Commission. EU Construction Sector: In Transition Towards a Circular Economy. 2019. Available online: https://ec.europa.eu/docsroom/documents/34904 (accessed on 13 October 2020).
- Fotiou, T.; de Vita, A.; Capros, P. Economic-Engineering Modelling of the Buildings Sector to Study the Transition towards Deep Decarbonisation in the EU. Energies 2019, 12, 2745. [Google Scholar] [CrossRef] [Green Version]
- NF Habitat HQE. NF Habitat, le repère de confiance et de qualité de votre logement. 2020. Available online: https://www.nf-habitat.fr/certification/ (accessed on 7 January 2021).
- VERDE. GBCe|Certificación VERDE. 2020. Available online: https://gbce.es/certificacion-verde/ (accessed on 7 January 2021).
- DGNB System. DGNB System—Sustainable and Green Buildingn. 2020. Available online: https://www.dgnb-system.de/en/index.php (accessed on 7 January 2021).
- BREEAM NL. English—BREEAM-NL. 2020. Available online: https://www.breeam.nl/english-9 (accessed on 7 January 2021).
- HPI. HPI—Know that your house is a home. 2020. Available online: http://homeperformanceindex.ie/ (accessed on 7 January 2021).
- WGBC. WorldGBC Annual Report 2020.pdf. 2020. Available online: https://bc3-production-us-east-2.s3.us-east-2.amazonaws.com/la75v4pfjuvtm7kl724wn434gk2l?response-content-disposition=inline%3B%20filename%3D%22WorldGBC%20Annual%20Report%202020.pdf%22%3B%20filename%2A%3DUTF-8%27%27WorldGBC%2520Annual%2520Report%25202020.pdf&response-content-type=application%2Fpdf&X-Amz-Algorithm=AWS4-HMAC-SHA256&X-Amz-Credential=AKIAS5PME4CT5QW2PJJU%2F20201213%2Fus-east-2%2Fs3%2Faws4_request&X-Amz-Date=20201213T130622Z&X-Amz-Expires=86400&X-Amz-SignedHeaders=host&X-Amz-Signature=62d54e0e46c2a34b7a86c61ea6637b47f9976c8c624d2f0f99c778747ca50c4b (accessed on 13 December 2020).
- Building Life Project. In #BuildingLife; World Green Building Council, 2020; Available online: https://www.worldgbc.org/buildinglife (accessed on 7 January 2021).
- LIFE Levels Project, Life Level(s). 2019. Available online: https://lifelevels.eu/ (accessed on 7 January 2021).
- Visentin, C.; Trentin, A.W.D.; Braun, A.B.; Thomé, A. Life cycle sustainability assessment: A systematic literature review through the application perspective, indicators, and methodologies. J. Clean. Prod. 2020, 270, 122509. [Google Scholar] [CrossRef]
- Darko, A.; Chan, A.P.C.; Huo, X.; Owusu-Manu, D.-G. A scientometric analysis and visualization of global green building research. Build. Environ. 2019, 149, 501–511. [Google Scholar] [CrossRef]
- Dieterle, M.; Schäfer, P.; Viere, T. Life Cycle Gaps: Interpreting LCA Results with a Circular Economy Mindset. Procedia CIRP 2018, 69, 764–768. [Google Scholar] [CrossRef]
- Hossain, U.; Ng, S.T. Critical consideration of buildings’ environmental impact assessment towards adoption of circular economy: An analytical review. J. Clean. Prod. 2018, 205, 763–780. [Google Scholar] [CrossRef]
- Bionova. The Embodied Carbon Review 2018. 2018. Available online: https://www.oneclicklca.com/wp-content/uploads/2018/12/Embodied_Carbon_Review_2018.pdf (accessed on 12 October 2020).
- Geels, F.W. From sectoral systems of innovation to socio-technical systems: Insights about dynamics and change from sociology and institutional theory. Res. Policy 2004, 33, 897–920. [Google Scholar] [CrossRef]
- Geels, F.W.; Schot, J. Typology of sociotechnical transition pathways. Res. Policy 2007, 36, 399–417. [Google Scholar] [CrossRef]
- Geels, F.W. Socio-technical transitions to sustainability: A review of criticisms and elaborations of the Multi-Level Perspective. Curr. Opin. Environ. Sustain. 2019, 39, 187–201. [Google Scholar] [CrossRef]
- Hamid, A.R.A.; Singh, B.; Jamadi, M.A. Foreign Labour Employment in Construction Project. Int. J. Sci. Res. 2013, 3, 2013. [Google Scholar]
- Rip, A.; Kemp, R. Technological Change. In Human Choice and Climate Change; Vol. 2. Resources and Technology; Steve, R., Malone, E.L., Eds.; Battelle Press: Columbus, OH, USA, 1998; pp. 393–395. [Google Scholar] [CrossRef]
- Rosenbloom, D. Pathways: An emerging concept for the theory and governance of low-carbon transitions. Glob. Environ. Change 2017, 43, 37–50. [Google Scholar] [CrossRef]
- Geels, F.W. Low-carbon transition via system reconfiguration? A socio-technical whole system analysis of passenger mobility in Great Britain (1990–2016). Energy Res. Soc. Sci. 2018, 46, 86–102. [Google Scholar] [CrossRef]
- Kern, F.; Rogge, K.S.; Howlett, M. Policy mixes for sustainability transitions: New approaches and insights through bridging innovation and policy studies. Res. Policy 2019, 48, 103832. [Google Scholar] [CrossRef]
- Berkhout, F. Technological regimes, path dependency and the environment. Glob. Environ. Chang. 2002, 12, 1–4. [Google Scholar] [CrossRef]
- Raven, R.; Kern, F.; Verhees, B.; Smith, A. Niche construction and empowerment through socio-political work. A meta-analysis of six low-carbon technology cases Environ. Innov. Soc. Transit. 2016, 18, 164–180. [Google Scholar] [CrossRef] [Green Version]
- Trigaux, D.; Allacker, K.; Debacker, W. Environmental benchmarks for buildings: A critical literature review. Int. J. Life Cycle Assess. 2021, 26, 1–21. [Google Scholar] [CrossRef]
- Kuittinen, M.; Häkkinen, T. Reduced carbon footprints of buildings: New Finnish standards and assessments. Build. Cities 2020, 1, 1. [Google Scholar] [CrossRef]
- Steubing, B.; de Koning, D.; Haas, A.; Mutel, C.L. The Activity Browser—An open source LCA software building on top of the brightway framework. Softw. Impacts 2020, 3, 100012. [Google Scholar] [CrossRef]
- Orsini, F.; Marrone, P. Approaches for a low-carbon production of building materials: A review. J. Clean. Prod. 2019, 241, 118380. [Google Scholar] [CrossRef]
- Röck, M.; Saade, M.R.M.; Balouktsi, M.; Rasmussen, F.N.; Birgisdottir, H.; Frischknecht, R.; Habert, G.; Lützkendorf, T.; Passer, A. Embodied GHG emissions of buildings—The hidden challenge for effective climate change mitigation. Appl. Energy 2020, 258, 114107. [Google Scholar] [CrossRef]
- Larsen, T.S.; Rohde, L.; Jønsson, K.T.; Rasmussen, B.; Jensen, R.L.; Knudsen, H.N.; Witterseh, T.; Bekö, G. IEQ-Compass—A tool for holistic evaluation of potential indoor environmental quality. Build. Environ. 2020, 172, 106707. [Google Scholar] [CrossRef]
- Tanasa, C.; Dan, D.; Becchio, C.; Corgnati, S.P.; Stoian, V. Cost-optimal and indoor environmental quality assessment for residential buildings towards EU long-term climate targets. Energy Sustain. Dev. 2020, 59, 49–61. [Google Scholar] [CrossRef]
- Wargocki, P.; Wei, W.; Bendžalová, J.; Espigares-Correa, C.; Gerard, C.; Greslou, O.; Rivallain, M.; Sesana, M.M.; Olesen, B.W.; Zirngibl, J.; et al. TAIL, a new scheme for rating indoor environmental quality in offices and hotels undergoing deep energy renovation (EU ALDREN project). Energy Build. 2021, 244, 111029. [Google Scholar] [CrossRef]
- Negishi, K.; Lebert, A.; Almeida, D.; Chevalier, J.; Tiruta-Barna, L. Evaluating climate change pathways through a building’s lifecycle based on Dynamic Life Cycle Assessment. Build. Environ. 2019, 164, 106377. [Google Scholar] [CrossRef]
- Ingling, P.; European Construction Sector Observatory. Internal Market, Industry, Entrepreneurship and SMEs—European Commission. 2020. Available online: https://ec.europa.eu/growth/sectors/construction/observatory_en (accessed on 25 September 2021).
- Taxonomy. EU Taxonomy for Sustainable Activities. 2020. Available online: https://ec.europa.eu/info/business-economy-euro/banking-and-finance/sustainable-finance/eu-taxonomy-sustainable-activities_en (accessed on 25 September 2021).
Figure 1.
Multi-layered backdrop of technological innovation in building LCA, elaborated by the author and adapted from [73].
Figure 1.
Multi-layered backdrop of technological innovation in building LCA, elaborated by the author and adapted from [73].

Figure 2.
Dimensions of socio-technical transitions (STT) from BRS to Level(s). Elaborated by the authors and adapted from [69].
Figure 2.
Dimensions of socio-technical transitions (STT) from BRS to Level(s). Elaborated by the authors and adapted from [69].


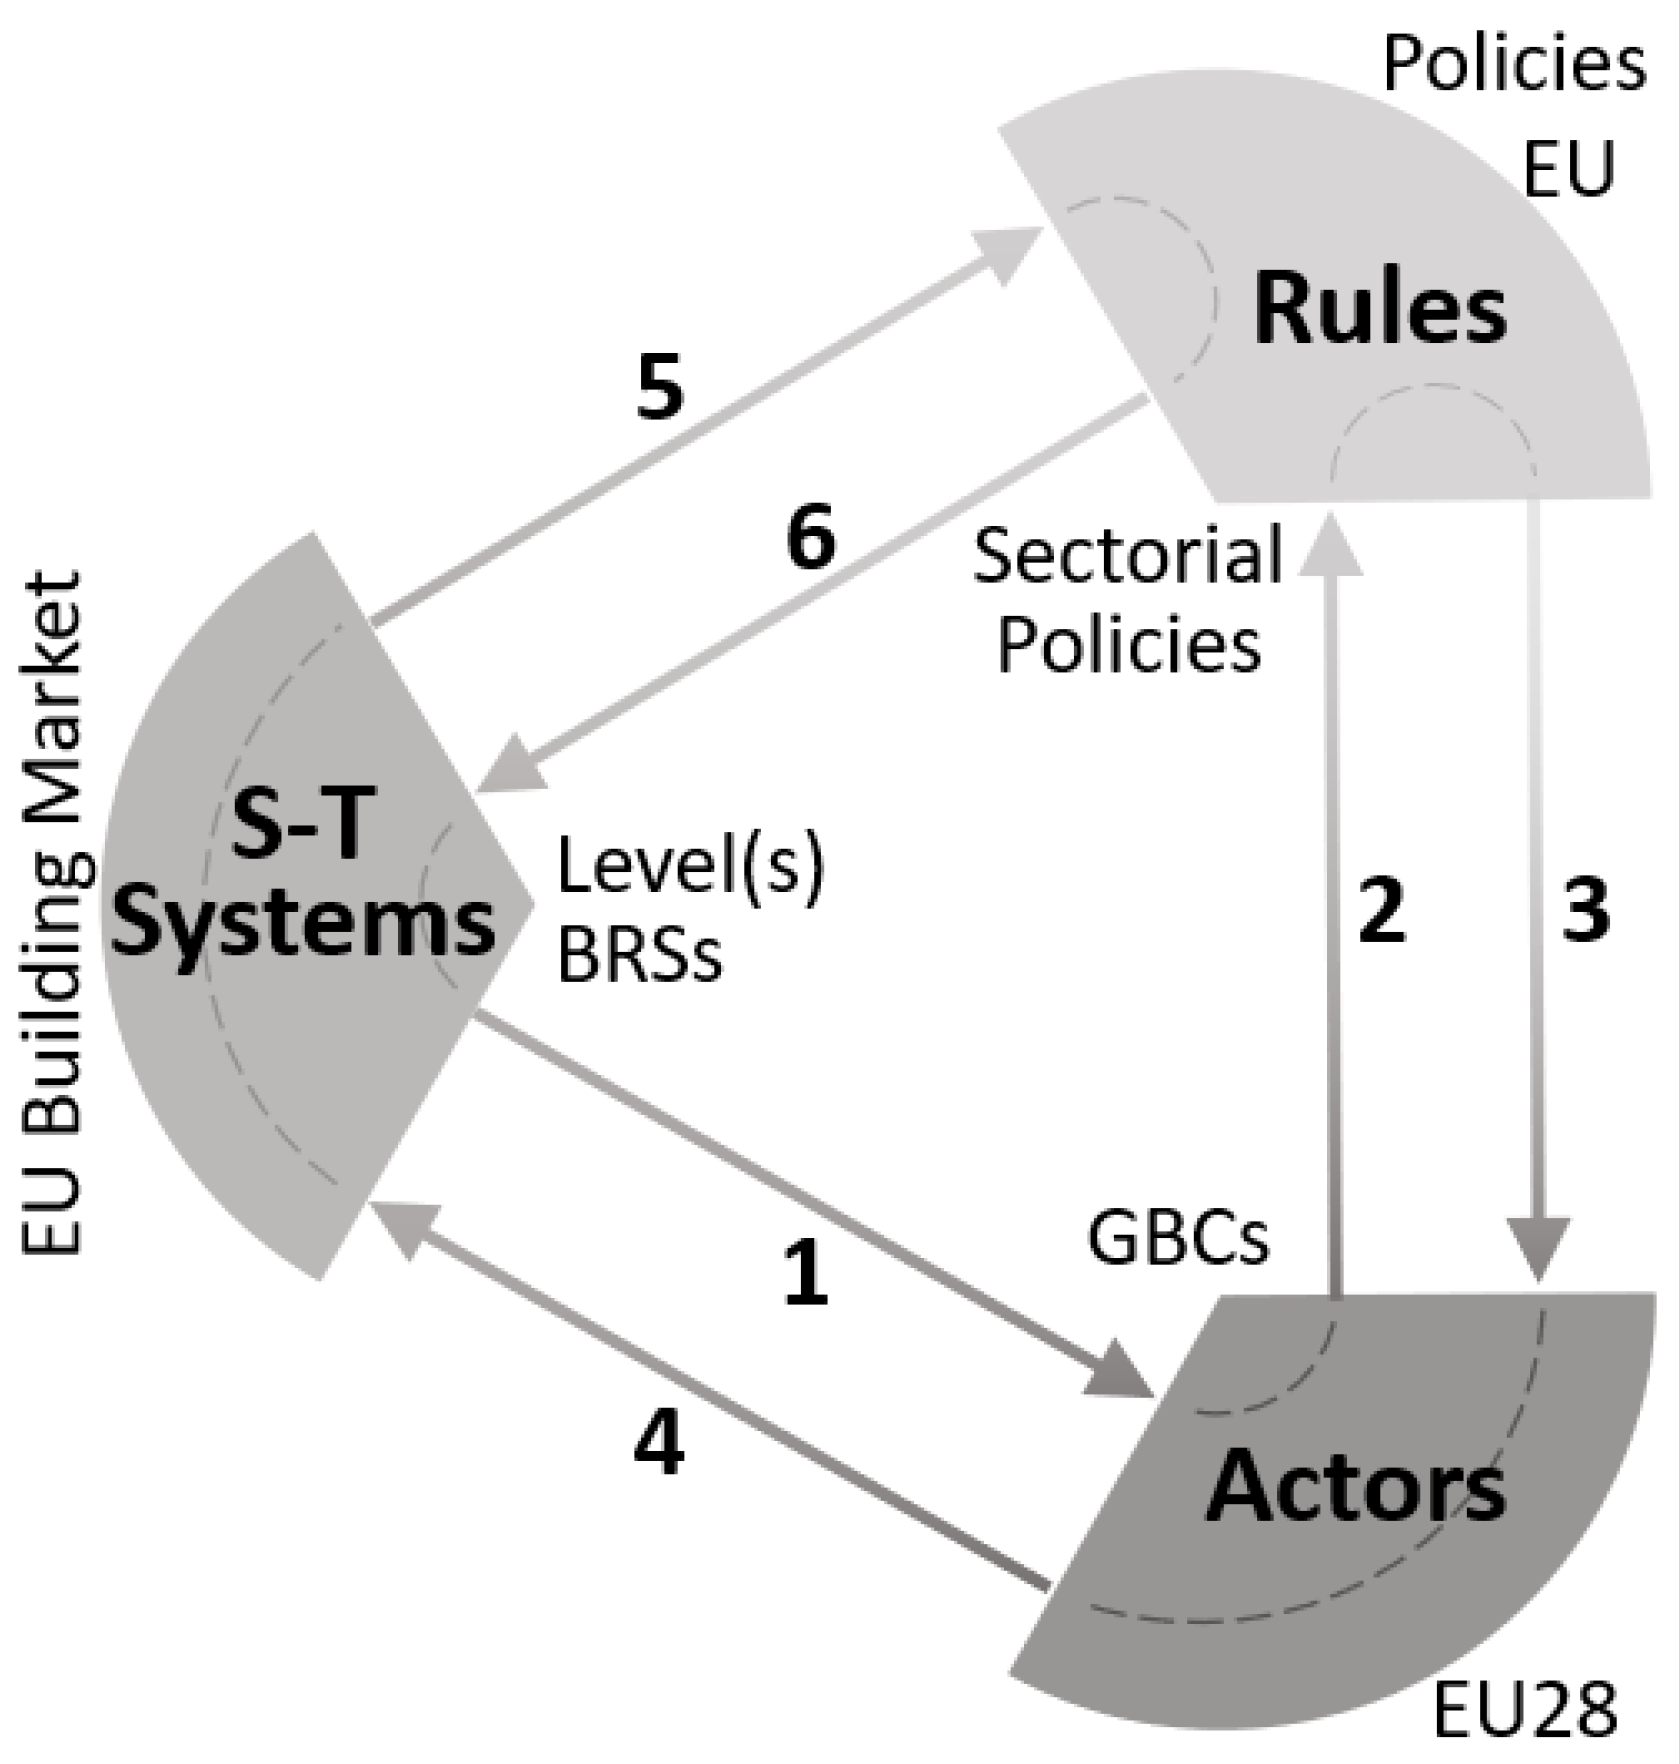
Table 1.
Basic impact metrics of selected BRS. Information provided by the World Green Building Council Member Value Survey 2020 (WGBC, 2020b).
Table 1.
Basic impact metrics of selected BRS. Information provided by the World Green Building Council Member Value Survey 2020 (WGBC, 2020b).
| Country (Association) | BRS (1st Version) | Certified Buildings (October 2020) | Associated Corporate Entities (July–November 2020) | Associated Professionals (July–November 2020) | Consultants (October 2020) | |
|---|---|---|---|---|---|---|
| 1 | France (HQE) | NF Habitat [56] (2013) | N/A * | 91 | 267 | N/A ** |
| 2 | Spain (GBCe) | VERDE [57] (2011) | 132 | 107 | 202 | 192 |
| 3 | Germany (DGNB) | DGNB System [58] (2010) | 6232 | 1266 | 73 | 4820 |
| 4 | The Netherlands (DGBC) | BREEAM-NL [59] (2007) | 317 | 370 | N/A *** | 879 |
| 5 | Ireland (IGBC) | HPI [60] (2016) | 350 | 170 | 30 | 55 |
| TOTALS | 7031 | 2438 | 639 | 6046 |
* Not disaggregated from other NF certifications. ** +1000 not specified. *** Only entities are accepted.
Table 2.
Overall adaptation of MLP to the subject of research.
| Micro-Level | Niche | Life cycle assessment of individual buildings. |
| Meso-Level | Regime | Standardisation and typification of buildings through building rating systems (BRS). |
| Macro-Level | Landscape | Evolution of BRS through the European Level(s) framework |
Table 3.
Awarding system for analysing BRSs degrees of compliance with Level(s) framework.
| Similar | 95–100% degree of compliance (Green) |
| Minor deviation | 80–95% degree of compliance (Yellow) |
| Major deviation | 50–80% degree of compliance (Orange) |
| Missing | 0–50% degree of compliance (Red) |
Table 4.
LCA weights in the BRS.
| BRS: Country (Entity) | Indicator Code/Name | Stages | Impact Categories | Building Elements | LCA Development | Share on Total Points |
|---|---|---|---|---|---|---|
| NF Habitat: France (HQE) | Indicators PE1.4.4, RCE4.1, REM2.4.1, DEC1, and DEC2 | N/A | Related to the indicators | Potentially any | Min | 0% |
| Max | 2.12% | |||||
| VERDE: Spain (GBCe) | RN 11 Impacto de los materiales de construcción | A1, A2, A3 | GWP, ADP | Envelope, inner partitions | Min | 2.80% |
| Plus A4, A5, B4, C3, C4 | GWP, ADP | All | Med | 4.50% | ||
| Plus A4, A5, B4, C3, C4 | +AP, EP, POCP, ODP | Plus 10% reduction | Max | 5.60% | ||
| DGNB-System international 2020 for buildings: Germany (DGNB) | Building life cycle assessment (ENV1.1) | A1, A2, A3 | GWP, ODP, POCP, AP, EP | Foundation + structure, envelope, HVAC | Min | 1% |
| + B2, B4, B6, B7, C3, C4 | Plus PE, WU, ADP | All at design | Med | 4% | ||
| Plus D | All Impacts | Plus CO2 neutral, plus no halo-hydrocarbons | Max | 9.50% | ||
| BREEAM NL: The Netherlands (DGBC) | MAT1: material specification | A1, A2, A3, product-based | GWP | At least three materials | Min | 0.80% |
| At least two more | Environmental impact of materials used is at least 30% lower than reference | Med | 4% | |||
| At least four more | Idem 60% lower | Max | 8% | |||
| HPI: Ireland (IGBC) | EN:7.0 embodied impacts of homes and LCA, plus exemplary points | A1, A2, A3 | GWP | Whole building | Min | 4% |
| Plus A4, A5 | Plus as many of ODP, AP, EP, or POCP as possible | Med | 6% | |||
| + all B + all C | +100% embodied offset | Max | 8% |
Table 5.
Path dependencies in the socio-technological transition of the building sector.
| Economic | Vested interests in the RE market and Urban developments. |
| Sunk investments from the 2008 crises, worsened by the current post-COVID-19 crises, being swallowed by investment funds. | |
| “Sustainability is expensive and does not pay-off”. | |
| Social | Blind beliefs such as the ever-growing RE surplus and sustainable assets becoming even more profitable. |
| Although climate awareness is raising socially demanding adapted buildings and cities, “climate change does not affect us”, and weather events are “normal”. | |
| The “austerity” policies of the 2008–2019 period, and the more homely lifestyle forced by the lockdown, were necessary to remain competitive and safe. | |
| Political | Activism in climate, health, and housing rights remains unheard by politicians. |
| Local administrations and manufacturers pioneering sustainability practices do it for global marketing or greenwashing, and without local citizenship support. | |
| The Green New Deal—does it come to renew the deal with the multi-nationals or to shake the regime foundations? | |
| Sectorial | The EU construction industry is strong, both inside and internationally (although lacking one million skilled workers). |
| The occurrence of Level(s) as a side entry (from the circular economy corner) into the sector raises suspicion from BRS and manufacturers—does it support their interests? |
Table 6.
Overall degree of compliance per BRS on selected indicators and related metrics, per level (awarding system and colour definition from Table 3).
Table 6.
Overall degree of compliance per BRS on selected indicators and related metrics, per level (awarding system and colour definition from Table 3).
| NF HQE | VERDE | DGNB | BREEAM-NL | HPI | ||
|---|---|---|---|---|---|---|
| Indicator | Level of Compliance | Score | ||||
| 1 Use-stage energy performance (kWh·m−2·yr−1) | Level 1 degree of compliance: | 63% | 60% | 90% | 90% | 60% |
| 1. Step-by-step instructions | 83% | 25% | 100% | 100% | 25% | |
| 2. Checklist of design concepts | 92% | 100% | 80% | 80% | 100% | |
| 3. Reporting | 0% | 0% | 100% | 100% | 0% | |
| Level 2 degree of compliance: | 77% | 72% | 89% | 94% | 72% | |
| 1. Step-by-step instructions | 63% | 69% | 85% | 92% | 77% | |
| 2. Comparability of results | 88% | 100% | 100% | 100% | 100% | |
| 3. Optimisation steps | 92% | 100% | 100% | 100% | 67% | |
| 4. Reporting | 0% | 0% | 100% | 100% | 0% | |
| Level 3 degree of compliance: | 86% | 58% | 92% | 58% | 58% | |
| 1. Step-by-step instructions | 92% | 64% | 91% | 55% | 64% | |
| 2. Reporting | 0% | 0% | 100% | 100% | 0% | |
| 2 Life cycle Global Warming Potential (CO2 eq·m−2·yr−1) | Level 1 degree of compliance: | 63% | 29% | 79% | 100% | 14% |
| 1. Step-by-step instructions | 83% | 14% | 100% | 100% | 29% | |
| 2. Checklist of design concepts | 92% | 50% | 67% | 100% | 0% | |
| 3. Reporting | 0% | 0% | 0% | 100% | 0% | |
| Level 2 degree of compliance: | 77% | 38% | 88% | 100% | 56% | |
| 1. Step-by-step instructions | 63% | 38% | 92% | 100% | 69% | |
| 2. Comparability of results | 88% | 0% | 100% | 100% | 0% | |
| 3. Optimisation steps | 92% | 100% | 0% | 100% | 0% | |
| 4. Reporting | 0% | 0% | 100% | 100% | 0% | |
| Level 3 degree of compliance: | No instructions provided | |||||
| 3 Life cycle costs (€·m−2·yr−1) | Level 1 degree of compliance: | 63% | 0% | 100% | 42% | 0% |
| 1. Step-by-step instructions | 56% | 0% | 100% | 33% | 0% | |
| 2. Checklist of design concepts | 71% | 0% | 100% | 60% | 0% | |
| 3. Reporting | 63% | 0% | 100% | 0% | 0% | |
| Level 2 degree of compliance: | 50% | 0% | 94% | 50% | 0% | |
| 1. Step-by-step instructions | 56% | 0% | 100% | 64% | 0% | |
| 2. Comparability of results | 43% | 0% | 100% | 0% | 0% | |
| 3. Optimisation steps | 0% | 0% | 100% | 0% | 0% | |
| 4. Reporting | 50% | 0% | 100% | 0% | 0% | |
| Level 3 degree of compliance: | 44% | 0% | 89% | 0% | 0% | |
| 1. Step-by-step instructions | 56% | 0% | 100% | 0% | 0% | |
| 2. Reporting | 29% | 0% | 100% | 0% | 0% | |
Table 7.
Gap analysis results of BRSs for all Level(s) indicators. Colour code: red (X), disconnected from Level(s) framework; yellow (empty), deviated; green(V), harmonised.
Table 7.
Gap analysis results of BRSs for all Level(s) indicators. Colour code: red (X), disconnected from Level(s) framework; yellow (empty), deviated; green(V), harmonised.
| Green Cells are “Compliant” with Level(s) | NF HQE | VERDE | DGNB | BREEAM-NL | HPI | ||||||||||
|---|---|---|---|---|---|---|---|---|---|---|---|---|---|---|---|
| Entry LevelsIndicators (1st Version) | L1 | L2 | L3 | L1 | L2 | L3 | L1 | L2 | L3 | L1 | L2 | L3 | L1 | L2 | L3 |
| 1. Use-stage energy performance | V | V | X | V | V | V | V | V | V | V | V | V | V | V | X |
| 2. Life cycle GWP | X | X | X | V | X | ||||||||||
| 3. LCA for: bill of materials | V | V | V | V | X | ||||||||||
| 4. LCA for: building and elemental service life planning | V | V | V | X | X | X | V | V | V | V | X | ||||
| 5. LCA for: design for adaptability and refurbishment | V | X | V | V | V | X | X | X | |||||||
| 6. LCA for: design for deconstruction, reuse, and recycling | V | X | X | X | X | ||||||||||
| 7. Construction and demolition waste and materials usage | V | V | V | V | V | V | |||||||||
| 8. LCA for: cradle-to-cradle life cycle assessment. | X | X | X | V | X | ||||||||||
| 9. Use-stage water consumption prediction | V | V | V | V | V | V | V | V | V | X | |||||
| 10. Time out of thermal comfort range | V | V | V | V | V | V | V | V | V | X | |||||
| 11. LCA for: Scenarios for projected future climate condition | X | X | X | X | V | V | X | V | V | V | X | X | X | ||
| 12. Life cycle costs analysis | X | X | X | X | X | X | X | ||||||||
Table 8.
Average PED and GWP per BRS.
| Averages | PED (kWh·m−2·yr−1) | GWP (CO2 eq·m−2·yr−1) |
|---|---|---|
| NF-HQE | N/A | N/A |
| VERDE | 29.22 | 40.49 |
| DGNB | 61.10 | 18.22 |
| BREEAM NL | Between 25 and 40 | Between 15 and 35 |
| HPI | <42 | <300 |
Publisher’s Note: MDPI stays neutral with regard to jurisdictional claims in published maps and institutional affiliations. |
© 2022 by the authors. Licensee MDPI, Basel, Switzerland. This article is an open access article distributed under the terms and conditions of the Creative Commons Attribution (CC BY) license (https://creativecommons.org/licenses/by/4.0/).
Share and Cite
MDPI and ACS Style
Izaola, B.; Akizu-Gardoki, O.; Oregi, X. Life Cycle Analysis Challenges through Building Rating Schemes within the European Framework. Sustainability 2022, 14, 5009. https://doi.org/10.3390/su14095009
AMA Style
Izaola B, Akizu-Gardoki O, Oregi X. Life Cycle Analysis Challenges through Building Rating Schemes within the European Framework. Sustainability. 2022; 14(9):5009. https://doi.org/10.3390/su14095009
Chicago/Turabian StyleIzaola, Borja, Ortzi Akizu-Gardoki, and Xabat Oregi. 2022. "Life Cycle Analysis Challenges through Building Rating Schemes within the European Framework" Sustainability 14, no. 9: 5009. https://doi.org/10.3390/su14095009
Note that from the first issue of 2016, this journal uses article numbers instead of page numbers. See further details here.