Article

Environmental Factors at Different Canopy Heights Had Significant Effects on Leaf Water-Use Efficiency in Cold-Temperate Larch Forest

1
School of Forestry, Northeast Forestry University, Harbin 150040, China
2
Key Laboratory of Sustainable Forest Ecosystem Management-Ministry of Education, Northeast Forestry University, Harbin 150040, China
*
Authors to whom correspondence should be addressed.
Sustainability 2022, 14(9), 5126; https://doi.org/10.3390/su14095126
Submission received: 23 March 2022 / Revised: 15 April 2022 / Accepted: 22 April 2022 / Published: 24 April 2022
(This article belongs to the Special Issue Managing Forest and Plant Resources for Sustainable Development)

Abstract

:
It is of great significance to study short-term water-use efficiency (WUEs) at different canopy heights for accurately evaluating the adaptability of cold-temperate larch (Larix gmelinii) forest to climate change. The stable isotope method combining data of gradient meteorology, photosynthetic properties and leaf structure were used to assess the influence of different canopy heights on short-term water-use efficiency (WUEs) in larch forests in the northern Da Hinggan Mountains. The results show that: (1) The rank of leaf WUEs at different canopy heights was upper canopy > middle canopy > lower canopy. The leaf WUEs in upper canopy was significantly higher than those in the middle and lower canopy (p < 0.01), and no significant difference was found between the middle and lower canopy (p > 0.05). (2) The environmental factors, the photosynthetic characteristics, the specific leaf weight (LMA) and stomatal density (SD) had significant impact (p < 0.05) on leaf WUEs at different canopy heights of larch forest. (3) The results of the weighted random forest analysis show that the main factor affecting WUEs in larch forests at different canopy heights was vapor pressure deficit (VPD), followed by relative humidity (RH) and net photosynthetic rate (Pn), while LMA and SD made relatively small contributions. This indicates that the variation of leaf WUEs at different canopy heights is mainly due to environmental factors. Our results highlight that the difference of environmental factors at different canopy heights should be considered in the future study of leaf WUE. Our results contribute to a better understanding of water utilization strategies and carbohydrate relations in the boreal forest ecosystems, which is of great significance for improving the sustainable management measures and strategies of boreal forest resources.

1. Introduction

In the context of global climate change, the intensity and frequency of drought have been observed to increase, which is expected to lead to water shortages around the world [1]. As an important limiting factor for plant growth [2], water not only affects plant growth rate and species composition, but also plays an important role in plant photosynthesis and other physiological metabolic processes [3]. Moreover, plants are an important part of ecosystems that play an important role in regulating the climate and maintaining the carbon and water balance [4]. Therefore, it is of great importance to understand the impact of water shortage on plant growth adaptability in the context of global climate change.
Water-use efficiency (WUE) is defined as the amount of carbon gained by plants per unit of water lost [5]. WUE not only reflects the intrinsic water consumption mechanisms of plants but also reveals the atmosphere–leaf interactions in the water and carbon cycles and their response mechanisms to environmental factors [6]. Studies on WUE involve different scales from leaf to ecosystem, and there are multiple methods to estimate WUE at different spatiotemporal scales. The eddy covariance method is widely used to analyze total primary productivity (GPP) across the ecosystem [7]. The thermal diffusion method is usually used at the single-plant scale to analyze the transpiration of the stand [8]. On the leaf scale, the traditional research method is the transient water-use efficiency (WUEinst) determined by the gas exchange method. However, this method can only measure the ratio of plant photosynthetic rate to transpiration rate at a certain point in time, which is greatly influenced by environmental changes, and it is difficult to explain the physiological response process that occurs when plants are affected by meteorological factors [9]. In recent years, the development of stable isotope has provided a new method to study the WUE of leaves [10]. Farquhar et al. [11] found a significant positive linear correlation between WUE and its carbon isotope abundance ratio of 13C/12C, which provides the method using the stable carbon isotope ratio (13C) to indicate the plant WUE. The physiological information reflected by the stable isotope method is that the plant WUE changes over a certain period. For example, the 13C of the soluble sugars in leaves that can indicate the response of leaf physiological conditions to environmental changes can be used to derive plant short-term water-use efficiency (WUEs) during their formation time (2–3 days) [12]. Compared with the gas exchange method, the method using WUEs has the advances of needing a smaller sampling amount and not causing harm to plants. Therefore, WUEs can directly reveal the plant response to the current climatic environment.
Currently, a number of studies on plant-leaf WUEs have been conducted by researchers. Bgelein et al. [13] and Zheng et al. [14] found that vapor pressure deficit (VPD) had the greatest effect on plant WUEs in the beech, Douglas-fir and Platycladus orientalis forests. Franks et al. [15] found that the increase in the ratio of intercellular CO2 concentration to ambient CO2 concentration (Ci/Ca) can lead to a decrease in plant stomatal conductivity, improve Rubisco enzyme activity and carboxylation efficiency and consequently increase the net photosynthetic rate, which can significantly affect its WUEs. However, Cao et al. [16] found that leaf structure has the greatest effect on WUEs in poplar forests. Cernusak et al. [17] and Mattii G et al. [18] found that WUEs was significantly influenced by photosynthetic rate (Pn) and the leaf structure of plant leaves. However, there are few studies on the main factors affecting the variability of WUEs in different canopy leaves and their multiple factors. In forest ecosystems, the exponential attenuation of solar radiation flux from the upper to the lower part of the plant canopy leads to differences in microclimatic conditions [19,20], which can lead to differences in leaf structure [21] and photosynthetic properties [22,23,24]. This may cause significant differences in leaf WUEs at different canopy heights. Such differences may have important implications for the accurate assessment of climate change on plant adaptation.
The northern Daxing’an Mountains forest is the only high-latitude cold-temperate deciduous coniferous forest region in China, and the southern margin of the boreal forest in the arctic region, which is the most sensitive region in the content of global climate change [25]. The rapid increase in the average temperature in the perennial permafrost zone of the Daxing’an Mountains by 0.35 °C per decade [26] is expected to affect physiological and biochemical processes, such as water-use efficiency in boreal forests [27,28,29]. Larch forest (Larix gmelinii), as the top community in the Daxing’an Mountain region, covers more than 50% of the entire forest area of the Daxing’an Mountain region [24]. The variation in larch-forest WUE plays an important role in the carbon and water balance of the region [29]. Thus, studying larch WUEs in the northern Daxing’an Mountains is of great importance for predicting the adaptation of larch populations to future climate change.
The larch forest in the northern part of the Daxing’an Mountains was selected in the present research. The WUEs, the meteorological factors, the photosynthetic properties and the leaf structure of larch forests at different canopy heights were accessed to determine the change pattern and difference of WUEs at different canopy heights and the dominant factor among the influencing factors. We addressed the following specific scientific questions: (1) Are there any significant differences in WUEs at different canopy heights? (2) Are environmental factors the main factors affecting the WUEs of different heights?

2. Materials and Methods

2.1. Study Area

This study was conducted in Heilongjiang Mohe Forest Ecosystem Research station, which is located in the Daxing’an Mountains of northeast China (122°06′–122°27′ E, 53°17′–53°30′ N) (Figure 1). The area is in a continuous permafrost zone with a cold-temperate continental monsoon climate [30]. The average annual precipitation is 350–500 mm, mostly concentrating in July and August, with a frost-free period of 80–90 days. The average annual temperature is −4.9 °C, with a minimum temperature of −52.3 °C and a maximum of 33 °C. The zonal vegetation in the area is a bright coniferous forest dominated by larch forest (Larix gmelinii) with scattered camphor pine (Pinus sylvestris var. mongolica) forest and white birch (Betula platyphylla) forest. The forest ecosystem in this area is relatively simple in structure with limited plant species. The zonal soil of the area is brown coniferous forest soil and a sparsity of meadow soil and swampy soil [31], with a soil pH between 4.4 and 5.4 and a soil thickness of approximately 30 cm.

2.2. Micro-Meteorological Conditions Measurement

In 2015, continuous observations of carbon–water–energy–meteorological factors were made on building a flux tower in a cold-temperate larch forest. The radiation range radius of flux tower is 1000 m. The tower was equipped with passively shielded HMP155 probes (Vaisala, Vantaa, Finland) at 20 m, 14 m and 9 m above the ground for continuous observation of air temperature (Ta) and relative humidity (RH), and an NR01 sensor (Hukseflux, Delft, The Netherlands) was used for continuous observation of photosynthetically active radiation (PAR). Meteorological measurements were conducted in 5 min intervals and data were saved as 30min averages by the CR3000 datalogger (Campbell Scientific, Logan, UT, USA).

2.3. Plot Selection and Sample Collection

Three typical larch-forest plots were selected within the radiation range of the flux tower (Table 1), with each plot size of 20 m × 30 m. When selecting plots, we ensured that the differences in slope and slope direction were minimal to eliminate the topographic factor influence on WUE
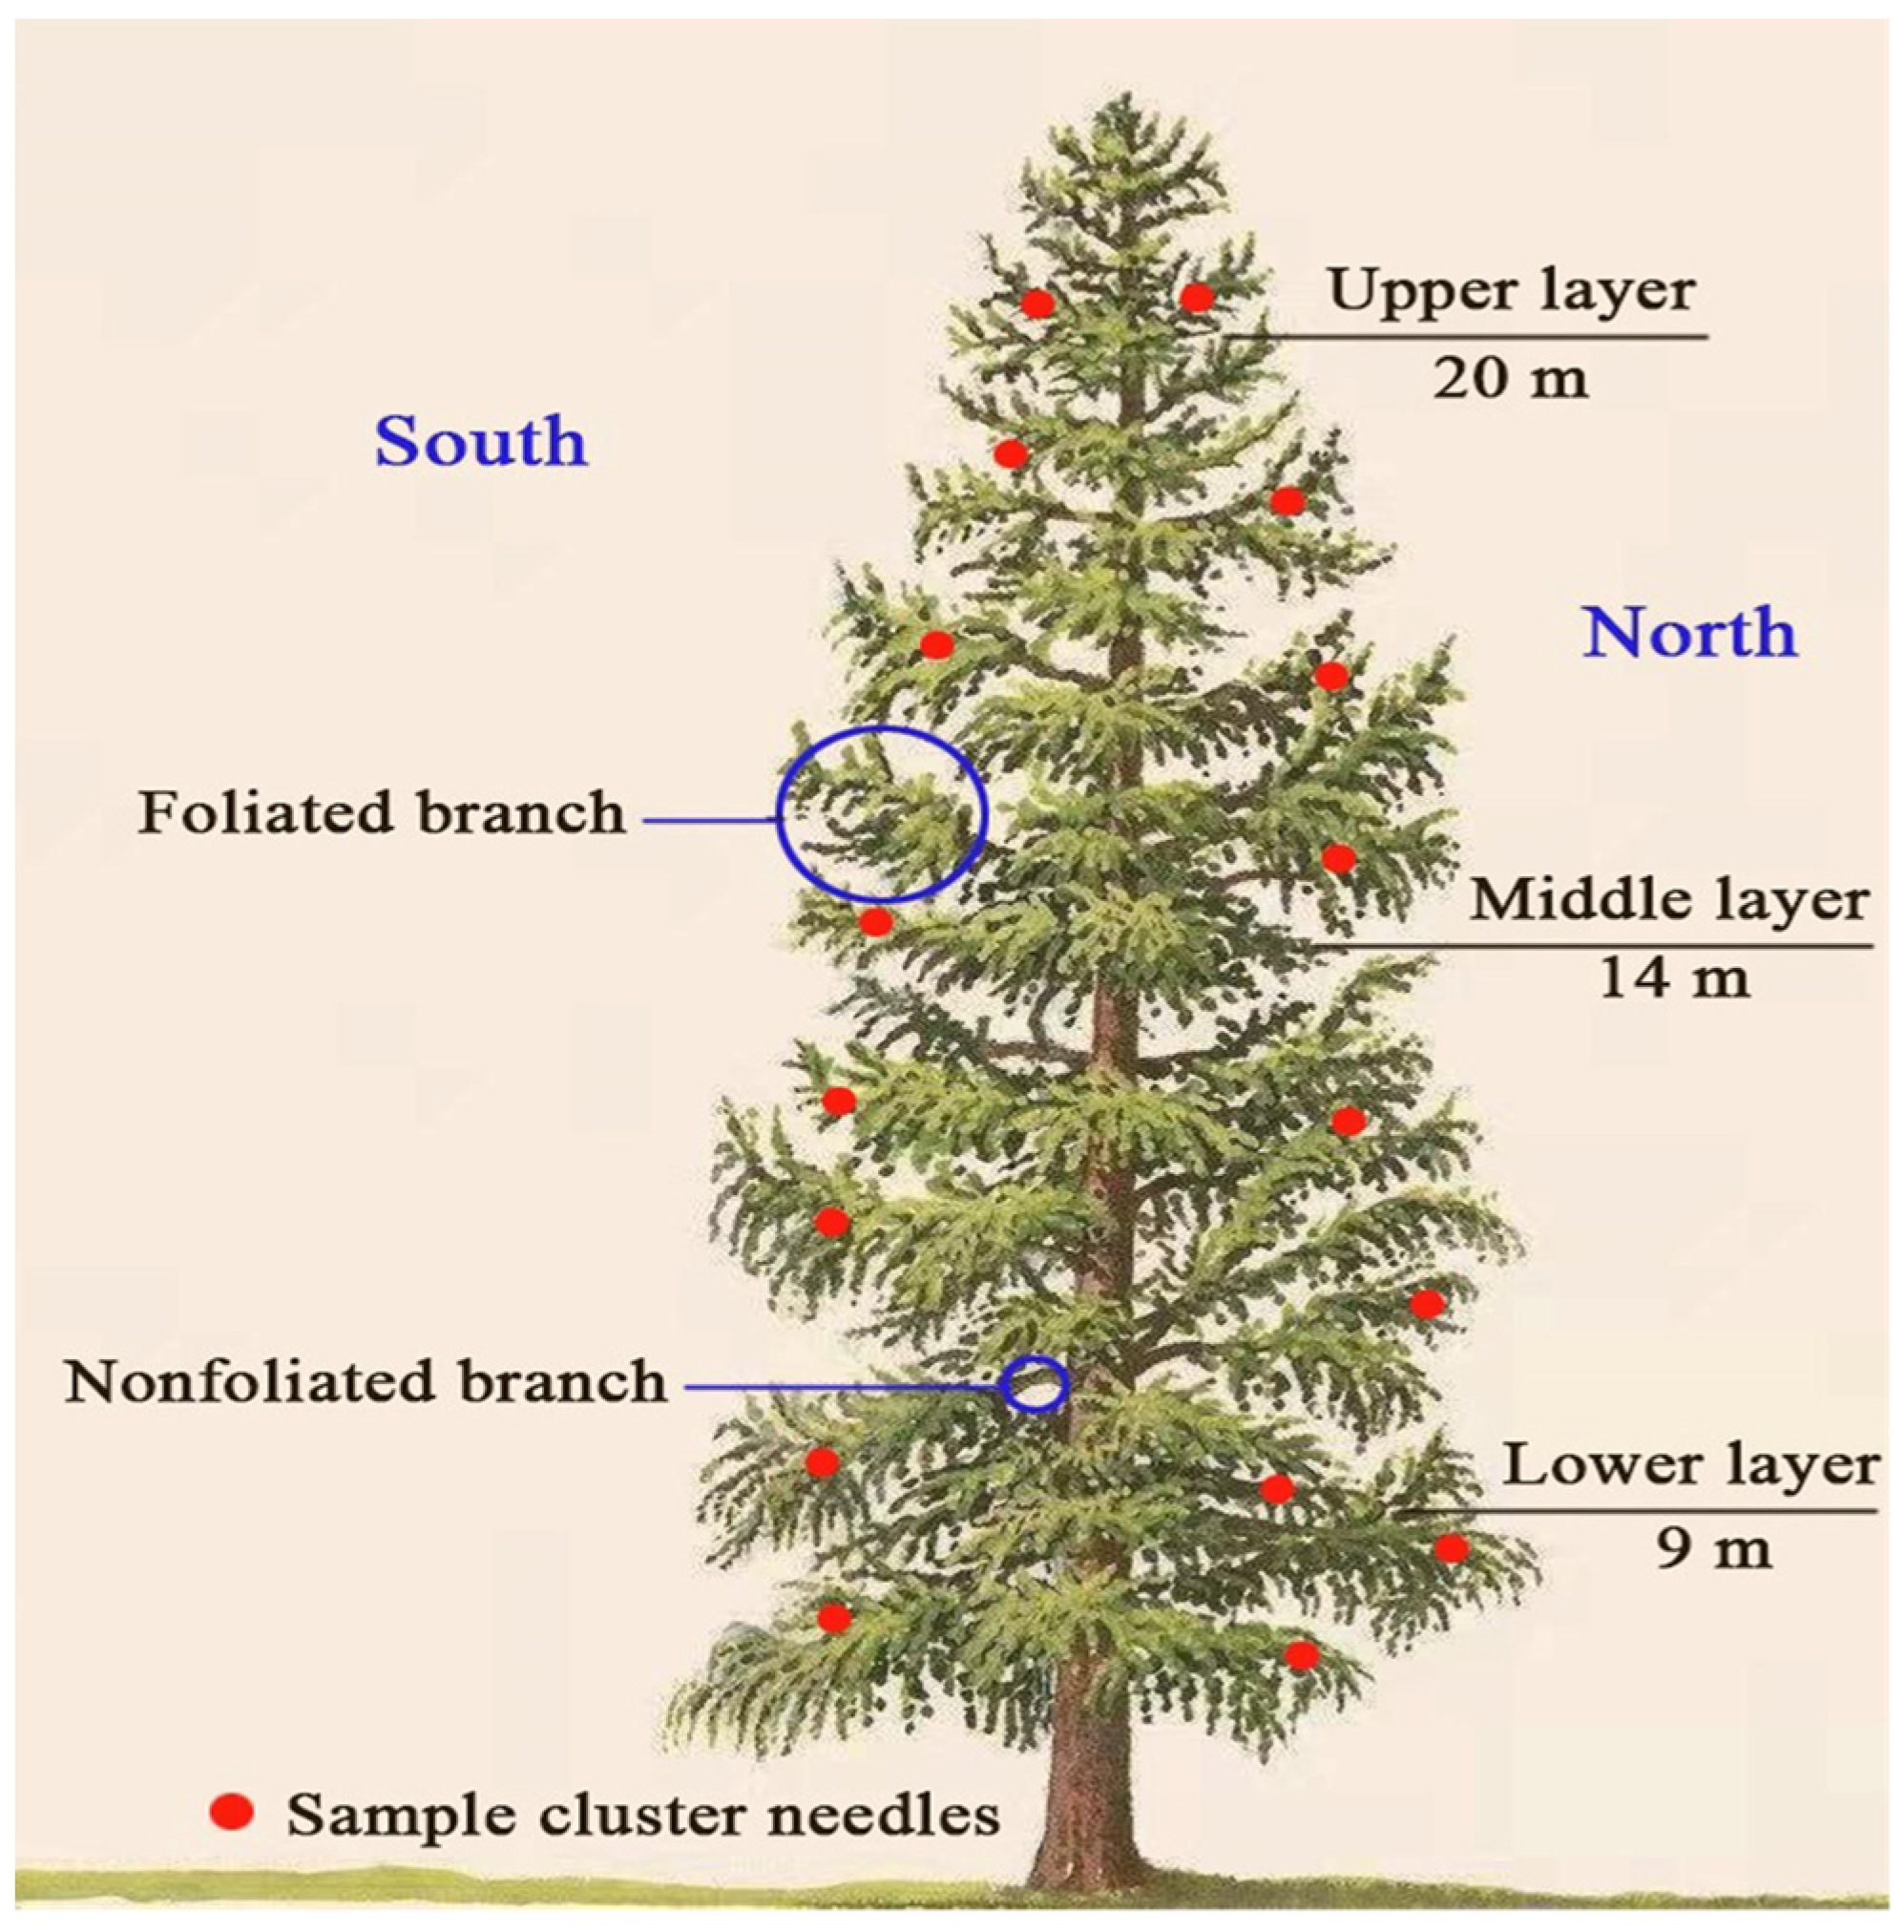
s. The diameter at breast height (DBH) and tree height (H) were measured for each tree whose DBH was greater than 5 cm in each plot, and the average DBH and H for three plots were calculated independently. Then, three sample trees with DBH values respectively similar to the average DBH and H of the three plots were selected to represent the average state of each plot. The canopy of the sample tree was evenly divided into three parts (upper canopy 20 m, middle canopy 14 m and lower canopy 9 m) based on the top-down pseudowheel [32] in the crown, the center part of each canopy was sampled (Figure 2). The analysis of our previous work showed that there were no significant differences in carbon isotopes between negative and anophytic leaves in four directions: the southeast and northwest directions of each canopy, and the needles in the middle part of each canopy represent the average standard for each canopy WUEs.
To ensure that the leaves can reflect the average WUEs for three days, we performed sampling from 18 to 20 August 2019 to meet the requirements that there is no rainfall for three consecutive days before sampling and no rainfall during the three-day sampling period. During sampling, using 20 m high pruning at each canopy (20 m, 14 m and 9 m), we chose three healthy and fully expanded needle clusters located within each segment in the middle of the foliated branches in sunny, semisunny and shaded crowns that were selected. Photosynthetic parameters were determined immediately after the sampling. After measurement, samples were quickly wrapped in tin foil and stored in a liquid nitrogen tank at low temperature for extraction and testing of leaf soluble sugar and leaf structure.
At the same time of each sampling day, atmospheric samples were collected from 20 m, 14 m and 9 m at the larch-forest flux meteorological tower using a gas collect bag and brought back to the laboratory to determine their CO2 concentration (Ca) and stable carbon isotopes (δ13C).

2.4. Photosynthetic Gas Exchange Measurements

A total of six photosynthetic parameters were measured for each canopy of the selected sample tree in the morning and afternoon of the three sampling days, such as photosynthetic rate (Pn), transpiration rate (Tr), stomatal conductance (Gs) and intercellular CO2 concentration (Ci) of the leaves. All photosynthetic parameters were measured using a portable steady-state photosynthesis system (LI−6400, LI-COR, Inc., Lincoln, Lincoln, NE, USA) equipped with a standard LED light source (6400–02B, LI-COR, Inc., Lincoln, NE, USA). The system was calibrated at the beginning and end of the measurements. During the determination, the needles of the leaf chamber seal ring holding the branch position were removed first, and then the front needles of the branch were fully photoinduced by saturated light intensity, and the measurement began when the photosynthetic rate was stabilized. When measuring the optical response curve, the optical quantum flux density (photosynthetic photon flux density, PPFD) gradient is: 2000, 1500, 1200, 800, 400, 200, 150, 100, 50 and 0 μmol m−2s−1. The needle cluster samples were allowed to equilibrate for a minimum of 2 min at each step before the data were logged. All measurements were conducted under ambient conditions with no control except for the CO2 concentration in the chamber (stabilized at 380 ppm), and the flow rate of external air into the chamber is 450 μmol s−1.

2.5. Processing of Leaf Samples

As the carbon in leaf soluble sugar was accumulated over a period of time, the δ13C value of soluble sugar can reflect the average WUE during carbon formation. Soluble sugar was extracted from the leaves in the following steps: 0.05 g of ground sample was mixed with 1 mL of deionized water and 0.1 g of PVPP (cross-linked povidone) and incubated for 60 min at 5 °C. The sample was then incubated at a constant temperature water bath at 100 °C for 3 min, followed by centrifugation for 5 min to obtain the supernatant. The supernatant was then centrifuged for 5 min at 100 °C. Finally, 8 μL of the supernatant was pipetted into a tin capsule, air dried and wrapped at room temperature. The extraction was repeated twice for each leaf sample. The extracted matter was used to determine their δ13C with a stable isotope ratio mass spectrometer.

2.6. Determination of δ13C and WUEs

Extracted leaf soluble sugar of 3–5 mg was taken after drying and sealed into vacuum combustion tubes, and then oxidants and catalysts were added. After the CO2 produced by combustion was crystallized and purified, carbon isotope ratio values were measured using a Flash 2000-Thermo Finnigan ELTA plus XP stable isotope mass spectrometer, which has a measurement accuracy of <±0.15‰. The collected data were then calibrated and standardized for calculation of the WUEs of leaves.
Plant leaf δ13C values were determined using PDB (Pee Dee Belemnite) as the standard, and then calculated according to Equation (1) as follows:
δ13C = [(13C/12C)p − (13C/12C)PDB]/(13C/12C)p) × 1000%
where δ13Cp indicates the thousandth deviation of the sample 13C/12C from the standard sample, with a measurement error of less than 0.05‰; (13C/12C)PDB represents the 13C/12C of the standard substance PDB. The WUEs of plants is expressed as follows [33]:
W U E s = C a ( 1 Φ ) ( 1 δ 13 C a δ 13 C p a b a ) / 1.6 v
where Ca is the atmospheric CO2 pressure (kPa), and δ 13 C p   and δ 13 C a   denote the carbon isotope ratio of soluble sugar and atmospheric CO2 in leaves, respectively. a is the diffusion fractionation factor (4.4‰); b is the carboxylation fractionation factor (28‰); Φ is the ratio of carbon consumed by nocturnal respiration of leaves and respiration of other organs throughout the plant growth period (taken as 0.3) and v (VPD) is the difference between water vapor pressure inside and outside the leaves (kPa) [34,35].
v = ei − ea = 0.611e(17.27T/237.3+T) × (1 − RH)
where ei is the internal vapor pressure of the blade (kPa); ea is the ambient vapor pressure (kPa); T is the atmospheric temperature and RH is the ambient relative humidity.

2.7. Leaf Anatomical Characterization

Five to ten mature leaves were taken at different canopy heights from the sample trees in August, and small pieces of about 1 cm2 were quickly cut in the middle of the leaves and fixed in FAA fixative (alcohol: formalin: glacial acetic acid = 90:5:5) for paraffin filming. Fixed samples were dehydrated in a series of alcohols (70%, 85%, 90% and 95%) and followed by clarification in xylene, then waxed, embedded, sectioned and finally sealed with gum arabic using the red-solid green counterstain method coloration [36]. Photographs were observed under a light microscope [30]. Measurement index includes leaf thickness (LT), epidermis thickness (ET), stomatal length (SL), stomatal width (SW), stomatal density (SD) and guard cell area (GCA), with the mean of 60 measurements for each index [37]. The leaf area (LA) was quickly determined using a scanner (Regent instrument INC, Canada), and the samples were then dried in a constant temperature oven at 60 °C for 48 h until a constant weight was obtained.
The needles for photosynthetic determination were first scanned with a scanner, then opened with Photoshop software; the graphics and blades were tested with the magic rod tool, the pixel value was read with the histogram tool and the leaf area was calculated based on the ratio of pixels and area. The leaves were then dried to 65 °C to constant weight (precision 0.0001 g). Dry weight divided by leaf area is leaf mass per area (LMA).

2.8. Statistical Analyses

Data analysis was performed using IBM SPSS Statistics 21.0 (Armonk, NY, USA). One-way analysis of variance (ANOVA) followed by the LSD test was used to examine the statistical significance of differences in the WUEs of leaves at different canopy heights. The two-way ANOVA test was used to test the statistical significance of leaf WUEs at different canopy heights in relation to the influencing factors of each layer. A weighted random forest [38] analysis was conducted with R core team software to explore the relative importance of variables in affecting the responses of leaf WUEs at different heights to influencing factors. All the figures were drawn with OriginPro 2018 software (OriginLab Corp., Northampton, MA, USA).

3. Results

3.1. WUEs at Different Canopy Heights of Larch Forest

As shown in Table 2, the daily differences in atmospheric δ13C, leaf soluble sugar δ13C and WUEs were small over the 3-day period. The variation of WUEs at different canopy heights of larch forest ranged from 3.89 to 4.34 mmol-mol−1, with WUEs increasing with canopy height. The atmospheric δ13C, leaf soluble sugar δ13C and WUEs in the upper canopy were significantly higher than those in the middle and lower canopy (p < 0.01), while the difference between the middle and lower canopy was not significant (p > 0.05). The variation of atmospheric δ13C and leaf soluble sugar δ13C at different heights of larch forest ranged from −8.97 to −9.26 and −29.07 to −29.95, respectively. Both atmospheric δ13C and leaf soluble sugar δ13C showed the same ranking as WUEs: upper canopy > middle canopy > lower canopy, and that the upper canopy leaf soluble sugar δ13C was significantly higher than those in the middle canopy and lower canopy (p < 0.01). However, the difference between the middle canopy and the lower canopy was not significant (p > 0.05).

3.2. Effect of Meteorological Factors on WUEs at Different Canopy Heights of Larch Forest

As shown in Figure 3, the variation patterns of meteorological factors Ta, VPD and PAR at different heights of the larch forest were upper canopy > middle canopy > lower canopy, while the variation pattern of RH was upper canopy < middle canopy < lower canopy.
Ta fluctuated between 7.29 °C and 22.26 °C, with a large diurnal temperature difference, and the upper canopy Ta was significantly higher than that at the middle or lower canopy (p < 0.05). VPD varied from 0.34 to 0.42 kPa, showing highly significant differences between the upper and lower canopy (p < 0.01), but there were certain fluctuations between the middle and lower canopy. PAR varied from 118.1 to 487.6 umolm−2s−1, with highly significant differences between the different canopies (p < 0.01). RH fluctuated between 47.67 and 99.9%. The maximum RH occurs in the early morning, reaching 99.9%, and during the day mostly above 50%. Note that RH gradually decrease with the rise of the canopy, showing that the upper canopy was significantly lower than the middle canopy and lower canopy (p < 0.05).
The correlation analysis (Table 3) showed that WUEs at different canopy heights were significantly positively correlated with Ta (p < 0.05), highly significantly negatively correlated with RH (p < 0.01), highly significantly positively correlated with VPD (p < 0.01), highly significantly positively correlated with upper and middle PAR (p < 0.01) and significantly positively correlated with lower PAR (p < 0.05). This suggests that the WUEs of larch forest at different canopy heights is largely influenced by meteorological factors at different canopy heights, especially VPD and RH.

3.3. Effect of Photosynthetic Parameters on WUEs at Different Canopy Heights of Larch-Forest Canopy

As shown in Figure 4, the variation of photosynthetic parameters Pn, Tr, Gs and Ci/Ca at different canopy heights of larch forest showed that the upper canopy > the middle canopy > the lower canopy. Pn varied between 6.21 to 8.71 μmol CO2m−2s−1 and showed a highly significant (p < 0.01) difference with the upper canopy and the middle and lower canopy, while the difference between the middle and lower canopy was not significant (p > 0.05). Tr ranged from 1.01 to 1.38 mmol H2Om−2s−1, showing nonsignificant differences between the upper and middle canopy. Gs ranged from 0.07 to 0.17 mol H2Om−2s−1, showing significantly higher differences in the upper canopy than in the middle and lower canopy (p < 0.05). Ci/Ca ranged from 0.63 to 0.75, but the intercanopy differences were not significant (p> 0.05).
Table 4 shows the correlation between WUEs and meteorological factors in different canopy layers of a larch forest. WUEs were highly significantly positively correlated with Pn (p < 0.01) at the different canopies; the upper canopy and middle canopy WUEs were significantly positively correlated with Tr (p < 0.05), while the lower canopy WUEs were not significantly correlated with Tr; different canopy WUEs were highly significantly positively correlated with Gs (p < 0.01) and the middle and lower WUEs were significantly positively correlated with Ci/Ca (p < 0.05), while the upper WUEs were not significantly correlated with Ci/Ca. It can be seen that the trend of WUEs in different canopy layers is influenced by photosynthetic parameters, especially Pn and Gs, while Ci/Ca has relatively less influence on WUEs.

3.4. Effect of Leaf Anatomical Characteristics on WUEs at Different Canopy Heights of Larch Forest

Table 5 shows that the effect of LMA, LT, upper and lower SL and SW and upper and lower GCA of larch-forest leaves at different canopy heights on WUEs was upper canopy > middle canopy > lower canopy, and the ranking of the upper and lower ET and upper and lower SD was upper canopy < middle canopy < lower canopy. LMA ranged from 12.44 ± 1.01 to 30.84 ± 2.05 g/cm−1 and was significantly greater in the upper canopy than in the middle and lower canopy (p < 0.01) but with no significant difference between the middle and lower canopy (p > 0.05). SD ranged from 175 ± 9 mm−2 to 235 ± 11 mm−2 with significant differences between the lower canopy and the upper or middle canopy (p < 0.01) but no significant differences between the upper and middle levels (p > 0.05). The upper and lower GCA were significantly different (p < 0.05), while LT, upper and lower ET and upper and lower SL and SW were not significantly different (p > 0.05). The leaf-specific LMA and WUEs of different canopy heights showed the same trend, with the upper canopy significantly larger than the middle and lower canopy, while the SD and WUEs showed opposite trends, with the lower canopy significantly larger than the middle and upper canopy.
As can be seen from Table 6, WUEs of different canopies were significantly negatively correlated with SD (p < 0.05), significantly positively correlated with LMA (p < 0.05) and not significantly correlated with other structural indicators (p > 0.05) except for the upper ET and SL. Therefore, SD and LMA had a strong influence on WUEs while other indicators had relatively less effect.

3.5. Random Forest Analysis of Leaf WUEs and Influencing Factors at Different Canopy Heights of Larch Forest

To analyze the extent to which each influencing factor contributes to the WUEs of larch forests at different canopy heights, we conducted a weighted random forest analysis of 10 influencing factors that have significant or highly significant effects on WUEs, including meteorological factors, photosynthetic parameters and leaf structure (Figure 5). The analysis showed that all 10 factors contributed to the WUEs of the leaves at different heights but with different degrees. The middle and lower influencing factors have the same rules but are not consistent with the upper canopy. It can also be seen that VPD is the main influencing factor causing the variation of leaf WUEs in each canopy. In addition, RH and Pn also play an important role in the variation of leaf WUEs in each canopy. PAR has a higher influence on leaf WUEs in the upper canopy than in the middle and lower canopy; Ta is an important factor affecting leaf WUEs in the middle and lower canopy, while LMA and SD contribute relatively less to leaf WUEs.

4. Discussion

4.1. WUEs of Larch Forest at Different Canopy Heights

The leaf WUEs at different canopy heights of larch forest in the cold-temperate zone of Daxing’an Mountains was that upper canopy > middle canopy > lower canopy, which was in accord with the results of other studies [39,40]. This ranking can be explained by the fact that the variation of WUEs at different canopy heights depends on the coupling of Pn and Gs [41,42,43]. This study also showed that both leaf Pn and Gs of different canopy heights increased with canopy height, and the magnitude of Pn change was greater than Gs at different canopy heights. It has been found in previous studies that Gs restricts its photosynthesis with increased canopy height by temperature and radiation [44], resulting in the decrease in Pn with increased canopy height [13,45]. However, in this study, the variation pattern of Pn and Gs showed no significant effect of temperature and radiation on Gs at different canopy heights in a larch forest. Larger Gs instead promoted the increase in Pn, which eventually led to the increase in leaf WUEs with the increase in height.
In this study, WUEs at different canopy heights showed highly significant differences between the upper canopy and the middle and lower canopy (p < 0.01) and insignificant differences between the middle canopy and the lower canopy (p > 0.05). This finding was in accord with the results of other studies [46]. Due to the exponential decrease in the light environment with the crease of the canopy height, there are significant differences in duration and intensity of light and the microenvironment of leaves at different canopy heights [47,48]. These differences could lead to the differences in the leaf δ13C values by affecting leaf structure and physiological characteristics at different canopy heights [49,50,51,52], ultimately resulting in significant differences in WUEs at different heights [53,54,55].
Our results further confirm that meteorological factors, photosynthetic factors and leaf structure affect WUEs at different canopy heights of larch forests, but the degree of influence of each factor on WUEs varies.

4.2. Effect of Meteorological Factors on WUEs of Larch Forest at Different Canopy Heights

Our study showed that VPD was the main factor affecting the WUEs of leaves in a larch forest at different canopy heights, which was similar to the results of Zhou et al. [56] and Feng et al. [57]. This can be explained by the fact that the fewer short-term changes in LAI, the relative stability of the ratio of transpiration (Tr) to ET [46] and changes in VPD directly affect changes in Gs that in turn affect WUEs [23]. When VPD increases with the canopy height, Gs and Tr also increased, which causes lower water potential in plant leaf cells and stems. In contrast to the restrictions on carbon absorption rates [47], VPD has a much greater impact on Gs. In this case, the effect of VPD on leaf WUEs at different canopy heights plays a dominant role. However, slightly different from the results of Bgelein et al. [13] and Hu et al. [58], VPD ranked first among the factors affecting WUEs in this study, which may be explained by the fact that greater variation in temperature and humidity at different canopy heights of larch forests of the zonal area caused a more direct effect of VPD on Gs and Pn than on other factors [36]. Therefore, VPD is the dominant factor affecting WUEs in larch forests.
RH was found to be a secondary factor affecting leaf WUEs at different canopy heights of larch forests, which is in accord with the results of Liu et al. [59] and Han Lei et al. [60]. This is because RH is the main determinant of atmospheric water potential and has a significantly negative correlation with VPD, and thus changes in RH directly affect changes in VPD at different heights. RH also strongly determined leaf Gs [61]. On the one hand, high RH leads to a decrease in atmospheric evapotranspiration capacity; on the other hand, low RH can increase Gs [62] that rises when the indirect positive effect exceeds the negative effect. In this study, RH performance at different heights decreased with the increase in canopy height, and RH was contrary to the law of change in VPD and Gs, which also indicates that the change in RH at different canopy heights of larch forests led to changes in VPD and Gs, thus affecting the changes in WUEs at different canopy heights. The contribution of Ta to WUEs at different canopy heights of a larch forest was higher in the middle and lower than in the upper canopy, which is similar to the results of Morecroft et al. [63]. This is because Ta can directly affect Pn and Gs, and thus affect WUEs [64,65]. Ta was significantly different across canopy heights, possibly with this difference [66] resulting in an inconsistent contribution of Ta to the WUE of different layers.
Since changes in the light conditions at different canopy heights lead to the significant variations of light effect on chlorophyll, phototaxis and photosynthesis carboxylase activity of each layer, the composition of plant stable carbon isotopes varies significantly accordingly, and thus affects WUEs [67]. It was shown in a previous study that Pn and Gs increase with PAR within a certain range [68]. In this study, the upper canopy PAR is significantly higher than the middle and lower canopy. Simultaneously, the upper layer Pn and Gs both were significantly higher than in the middle and lower layer, which may be the reason why the contribution of PAR is higher in the upper canopy than in the middle and lower canopy.
Our study suggests that the patterns of VPD, Ta and Ra at different canopy heights are consistent with that of the leaf WUEs at different canopy heights, while RH is the opposite. Comparative analysis showed that VPD and RH contributed the most to WUEs at different canopy heights, implying that under future climate change conditions, cold-temperate zones with higher Ta and lower RH [69] will cause a gradual increase in VPD at different canopy heights, which may lead to a gradual rise in larch-forest WUE.

4.3. Effect of Photosynthetic Factors on WUEs of Larch Forest at Different Canopy Heights

In this study, Pn was found to be an important factor influencing the WUEs of larch-forest leaves at different canopy heights. Moreover, compared with other photosynthetic factors, the contribution rate of Pn to WUEs at different canopy heights is higher, which is consistent with the results of Konate et al. [47] and Zhang et al. [70]. It was explained that this is because the changes in plant Pn and Gs directly affect plant WUE, whereas Tr and Ci/Ca indirectly affect WUEs [71]. In this study, the changes of Pn, Gs, Tr and Ci/Ca increased with canopy, and there are significant differences between the canopies. This indicates that layer Gs is not limited by meteorological factors or the carbon absorption rate of each layer. At the same time, the magnitude of Gs, Tr and Ci/Ca was less than that of Pn [44], which is the reason why Gs and Tr contributed less than Pn in the results of the random forest analysis.
However, the effect of Ci/Ca on larch-forest WUEs at different canopy heights shown in this study was slightly different from the results of Bachofen et al. [72] and Russo et al. [73]. The upper-canopy Ci/Ca importance was lower than those of the lower and middle canopies. One possible explanation for this might be that atmospheric CO2 concentrations were in a relatively stable state at different canopy heights [74], with higher Ci/Ca in the upper canopy than in the lower and middle canopy, resulting in greater stomatal limitation of carbon gain and reduced intercellular CO2 molar fraction (Ci) in the upper canopy than in the lower and middle canopy. Another explanation is that the gradual decrease in Ci photosynthesis is increasingly restricted by Rubisco enzymes in the canopy, which means that the lower-middle canopy is less restricted by Rubisco enzymes than the upper canopy, resulting in a higher Ci/Ca contribution compared with the lower-middle canopy.
The above analysis shows that the pattern of changes in photosynthetic factors Pn, Gs, Tr and Ci/Ca at different canopy heights is consistent with the pattern of the leaf WUEs at different canopy heights. The contribution of Pn to WUEs at different canopy heights is the largest, which means that changes in Pn at different canopy heights in the cold-temperate zone significantly affect the WUE of the larch forest. This means that changes in Pn at different canopy heights in the cold-temperate zone significantly affect the WUE of the larch forest, while factors that influence changes in Pn also affect the WUE of the larch forest.

4.4. Effect of Leaf Structure on WUEs of Larch Forest at Different Canopy Heights

The effect of light limitation at different canopy heights leads to some differences in leaf structure, and leaf structure changes may have a great impact on photosynthetic characteristics of plants, such as light absorption, carbon fixation and water loss [45,75], which in turn affects WUEs.
The results of this study show a significant association of WUEs with LMA and SD at different canopy heights, which is similar to the results of He et al. [76]. This is because leaf structure changes affect the GS of the leaf to a certain extent, which in turn affects the Pn and Tr of the leaf. As canopy height increases, stomatal resistance and cell boundary layer resistance increase, and the amount of CO2 diffused into the leaf is greatly reduced [77]. Thus, low concentrations of intracellular CO2 left leaves to fractionate for 13C, causing the increase of δ13C of the upper leaves [50], eventually affecting the WUEs at different canopy heights. The results of this study also show that LMA and SD had the lowest contribution among the factors to WUEs. This is because of the little variation in short-term leaf structure, although differences in specific leaf weight and stomatal density vary significantly at different canopy heights. Their lowest contribution rate to WUEs can also be explained by the fact that LMA and SD had the lowest effect on WUEs compared with other affecting factors. It can be concluded that in the cold-temperate zone, different canopy heights’ WUEs in larch forests are more influenced by meteorological and photosynthetic factors.

5. Conclusions

In this study, the WUEs of leaves at different canopy heights in the cold-temperate larch forest and its influencing factors were quantified. It was found that WUEs increased with canopy height. Moreover, WUEs in the upper canopy were significantly higher than that in the middle and lower canopy, while the difference of WUEs between the middle and lower canopy was not significant. The trends of Ta, VPD, PAR, Pn, Tr, Gs, Ci/Ca and LMA at different canopy heights were all consistent with the trends of WUEs, which showed a significant or highly significant positive correlation. The trends of RH and SD at different canopy heights were opposite to the trends of WUEs, which showed highly significant or significant negative correlations. From the random forest analysis, it can be concluded that the dominant factor influencing WUEs in each canopy was VPD, followed by RH and Pn, and the influence of LMA and SD is relatively limited. Therefore, in the future, for the water-use efficiency study of the Xingan larch forest, the influence of different canopy-height environmental factors on water-use efficiency should be taken into account. This effect may suggest new thinking for future research on water-use efficiency under climate change scenarios.

Author Contributions

Conceptualization, Z.G., X.M. and T.C.; methodology, Z.G.; software, Z.G.; validation, Z.G., X.M. and T.C.; formal analysis, Z.G.; investigation, Z.G., R.X. and Z.G.; resources, Z.G.; data curation, B.D. and Z.X.; writing—original draft preparation, Z.G.; writing—review and editing, Z.G.; visualization, X.M. and T.C.; supervision, X.M. and T.C.; project administration, X.M.; funding acquisition, X.M. All authors have read and agreed to the published version of the manuscript.

Funding

This research was supported by the National Natural Science Foundation of China (Grant No. 31770488, 31971451).

Institutional Review Board Statement

Not applicable.

Informed Consent Statement

Not applicable.

Data Availability Statement

Not applicable.

Acknowledgments

We acknowledge the financial support from the National Natural Science Foundation of China (Grant No.31770488,31971451). We are sincerely grateful for the efforts of Beixing Duan, Ruihan Xiao, Hong Wei and other colleagues for their help in field and lab studies. Finally, we are grateful to the Mohe Forest Ecological Research Station for providing the place of the field studies.

Conflicts of Interest

The authors declare no conflict of interest.

References

  1. IPCC. Climate Change 2013: The Physical Science Basis. In Contribution of Working Group I to the Fifth 539 Assessment Report of the Intergovernmental Panel on Climate Change; Cambridge University Press: Cambridge, UK; New York, NY, USA, 2013; p. 1535. [Google Scholar]
  2. Nijat, M.; Dai, Y.; Shi, Q.D.; Li, T.; Bayi, X.; Abudureyimu, A. Response of foliar δ13C in Populus euphratica and Tamarix sp. to different groundwater depths in the oasis of desert hinterland. Chin. J. Appl. Ecol. 2020, 31, 1083–1087. [Google Scholar]
  3. Rahman, M.; Islam, M.; Gebrekirstos, A.; Bräuning, A. Trends in tree growth and intrinsic water-use efficiency in the tropics under elevated CO2 and climate change. Trees 2019, 33, 623–640. [Google Scholar] [CrossRef]
  4. Keenan, T.F.; Hollinger, D.Y.; Bohrer, G.; Dragoni, D.; Munger, J.W.; Schmid, H.P.; Richardson, A.D. Increase in forest water-use efficiency as atmospheric carbon dioxide concentrations rise. Nature 2013, 499, 324–327. [Google Scholar] [CrossRef]
  5. Flanagan, L.B.; Wever, L.A.; Carlson, P.J. Seasonal and interannual variation in carbon dioxide exchange and carbon balance in a northern temperate grassland. Glob. Chang. Biol. 2002, 8, 599–615. [Google Scholar] [CrossRef]
  6. Hu, Z.M.; Yu, G.R.; Wang, Q. Progress in ecosystem water utilization efficiency. Ecol. J. 2009, 3, 448–457. [Google Scholar]
  7. Medlyn, B.E.; Kauwe, M.D.; Lin, Y.S.; Knauer, J.; Duursma, R.A.; Williams, C.A.; Arneth, A.; Clement, R.; Isaac, P.; Limousin, J.M.; et al. How do leaf and ecosystem measures of water-use efficiency compare? New Phytol. 2017, 216, 758–770. [Google Scholar] [CrossRef] [Green Version]
  8. Song, L.; Zhu, J.; Li, M.; Zhang, J.; Zheng, X.; Wang, K. Canopy transpiration of pinus sylvestris var. mongolica in a sparse wood grassland in the semiarid sandy region of northeast China. Agric. For. Meteorol. 2018, 250, 192–201. [Google Scholar]
  9. Sensuła, B.M. δ13C and water use efficiency in the glucose of annual pine tree rings as ecological indicators of the forests in the most industrialized part of Poland. Water Air Soil Pollut. 2016, 227, 68. [Google Scholar] [CrossRef] [PubMed] [Green Version]
  10. Guang, H.L. Stable isotope ecology: A new branch of ecology resulted from technology advances. Chin. J. Plant Ecol. 2010, 34, 119. [Google Scholar]
  11. Farquhar, G.D.; O’Leary, M.H.; Berry, J.A. On the relationship between carbon isotope discrimination and the intercellular carbon dioxide concentration in leaves. Funct. Plant Biol. 1982, 9, 121–137. [Google Scholar] [CrossRef]
  12. Zhang, Y.E.; Yu, X.X. Leaf water use efficiency at different heights of cypress canopy in Beijing. J. Appl. Ecol. 2017, 28, 2143–2148. [Google Scholar]
  13. Bgelein, R.; Hassdenteufel, M.; Thomas, F.M.; Werner, W. Comparison of leaf gas exchange and stable isotope signature of water-soluble compounds along canopy gradients of co-occurring Douglas-fir and European beech. Plant Cell Environ. 2012, 35, 1245–1257. [Google Scholar] [CrossRef] [PubMed]
  14. Zheng, P.F.; Yu, X.M.; Jia, G.D. Water use efficiency and its influencing factors of lateral cypress artificial forest in Beijing mountains. J. Appl. Ecol. 2019, 30, 20–27. [Google Scholar]
  15. Franks, P.J.; Adams, M.A.; Amthor, J.S.; Barbour, M.M.; Berry, J.A.; Ellsworth, D.S.; Farquhar, G.D.; Ghannoum, O. Sensitivity of plants to changing atmospheric CO2 concentration: From the geological past to the next century. New Phytol. 2013, 197, 1077–1094. [Google Scholar] [CrossRef] [PubMed]
  16. Cao, X.; Jia, J.B.; Li, H.; Li, M.C.; Luo, J.; Liang, Z.S.; Luo, Z.B. Photosynthesis, water use efficiency and stable carbon isotope composition are associated with anatomical properties of leaf and xylem in six poplar species. Plant Biol. 2012, 14, 612–620. [Google Scholar] [CrossRef] [PubMed]
  17. Cernusak, L.A. Gas exchange and water-use efficiency in plant canopies. Plant Biol. 2020, 22, 52–67. [Google Scholar] [CrossRef]
  18. Mattii, G.; Orlandini, S.; Benites, J.; Pisante, M.; Stagnari, F. Whole plant gas-exchange measurements in grapevine to estimate water-use efficiency. FAO Land Water Bull. 2005, 10, 113–118. [Google Scholar]
  19. Faria, T.; Wilkins, D.; Besford, R.T.; Vaz, M.; Pereira, J.S.; Chaves, M.M. Growth at elevated CO2 leads to down-regulation of photosynthesis and altered response to high temperature in Quercus suber L. seedlings. J. Exp. Bot. 1996, 47, 1755–1761. [Google Scholar] [CrossRef] [Green Version]
  20. Thomas, R.B.; Spal, S.E.; Smith, K.R.; Nippert, J.B. Evidence of recovery of Juniperus virginiana trees from sulfur pollution after the Clean Air Act. Proc. Natl. Acad. Sci. USA 2013, 110, 15319–15324. [Google Scholar] [CrossRef] [Green Version]
  21. Afas, N.A.; Marron, N.; Ceulemans, R. Clonal variation in stomatal characteristics related to biomass production of 12 poplar (Populus) clones in a short rotation coppice culture. Environ. Exp. Bot. 2006, 58, 279–286. [Google Scholar] [CrossRef]
  22. Wu, Y.; Zhong, H.; Li, J.; Xing, J.; Xu, N.; Zou, H. Water use efficiency and photosynthesis of Calamagrostis angustifolia leaves under drought stress through CO2 concentration increase. J. Plant Interact. 2022, 17, 60–74. [Google Scholar] [CrossRef]
  23. Scoffoni, C.; Kunkle, J.; Pasquet-Kok, J.; Vuong, C.; Patel, A.J.; Montgomery, R.A.; Sack, L. Light-induced plasticity in leaf hydraulics, venation, anatomy, and gas exchange in ecologically diverse Hawaiian lobeliads. New Phytol. 2015, 207, 43–58. [Google Scholar] [CrossRef]
  24. England, J.R.; Attiwill, P.M. Changes in leaf morphology and anatomy with tree age and height in the broadleaved evergreen species, Eucalyptus regnans F. Muell. Trees 2006, 20, 79. [Google Scholar] [CrossRef]
  25. Babst, F.; Esper, J.; Parlow, E. Landsat TM/ETM+ and tree-ring based assessment of spatiotemporal patterns of the autumnal moth (Epirrita autumnata) in northernmost Fennoscandia. Remote Sens. Environ. 2010, 114, 637–646. [Google Scholar] [CrossRef]
  26. Xiao, Y.W.; Chun, Y.Z.; Qing, Y.J. Impacts of climate change on forest ecosystems in Northeast China. Adv. Clim. Chang. Res. 2013, 4, 230–241. [Google Scholar] [CrossRef]
  27. Rittenhouse, C.D.; Rissman, A.R. Changes in winter conditions impact forest management in north temperate forests. J. Environ. Manag. 2015, 149, 157–167. [Google Scholar] [CrossRef] [PubMed]
  28. Bonan, G.B. Forests and climate change: Forcings, feedbacks, and the climate benefits of forests. Science 2008, 320, 1444–1449. [Google Scholar] [CrossRef] [Green Version]
  29. Sun, F.H.; Yuan, J.; Lu, S. The change and test of climate in Northeast China over the last 100 years. Clim. Environ. Res. 2006, 11, 101–108. [Google Scholar]
  30. Jiang, Y.L.; Zhou, G.S. Study on carbon balance and global change in larch forests. J. Appl. Ecol. 2001, 12, 481–484. [Google Scholar]
  31. Gao, W.; Yao, Y.; Liang, H.; Song, L.; Sheng, H.; Cai, T.; Gao, D. Emissions of nitrous oxide from continuous permafrost region in the Daxing’an Mountains, Northeast China. Atmos. Environ. 2019, 198, 34–45. [Google Scholar] [CrossRef]
  32. Cluzeau, C.; Goff, N.L.; Ottorini, J.M. Development of primary branches and crown profile of Fraxinus excelsior. Can. J. For. Res. 1994, 24, 2315–2323. [Google Scholar] [CrossRef]
  33. Farquhar, G.D.; Ehleringer, J.R.; Hubick, K.T. Carbon isotope discrimination and photosynthesis. Annu. Rev. Plant Biol. 1989, 40, 503–537. [Google Scholar] [CrossRef]
  34. Flanagan, L.B.; Ehleringer, J.R. Stable isotope composition of stem and leaf water: Applications to the study of plant water use. Funct. Ecol. 1991, 5, 270–277. [Google Scholar] [CrossRef]
  35. Luo, Z.B.; Langenfeld-Heyser, R.; Calfapietra, C.; Polle, A. Influence of free air CO2 enrichment (EUROFACE) and nitrogen fertilisation on the anatomy of juvenile wood of three poplar species after coppicing. Trees 2005, 19, 109–118. [Google Scholar] [CrossRef]
  36. Shi, G.R.; Cai, Q.S. Photosynthetic and anatomic responses of peanut leaves to zinc tress. Biol. Plant. 2009, 53, 391–394. [Google Scholar] [CrossRef]
  37. Dillen, S.Y.; Marron, N.; Koch, B.; Ceulemans, R. Genetic variation of stomatal traits and carbon isotope discrimination in two hybrid poplar families (Populus deltoides ‘S9-2’× P. nigra ‘Ghoy’and P. deltoides ‘S9-2’× P. trichocarpa ‘V24’). Ann. Bot. 2008, 102, 399–407. [Google Scholar] [CrossRef] [PubMed] [Green Version]
  38. Breiman, L. Random forests. Mach. Learn. 2001, 45, 5–32. [Google Scholar] [CrossRef] [Green Version]
  39. Berry, S.C.; Varney, G.T.; Flanagan, L.B. Leaf δ13C in Pinus resinosa trees and understory plants: Variation associated with light and CO2 gradients. Oecologia 1997, 109, 499–506. [Google Scholar] [CrossRef]
  40. Niinemets, U.; Sonninen, E.; Tobias, M. Canopy gradients in leaf intercellular CO2 mole fractions revisited: Inter- actions between leaf irradiance and water stress need consideration. Plant Cell Environ. 2004, 27, 569–583. [Google Scholar] [CrossRef]
  41. Medrano, H.; Tomás, M.; Martorell, S.; Flexas, J.; Hernández, E.; Rosselló, J.; Bota, J. From leaf to whole-plant water use efficiency (WUE) in complex canopies: Limitations of leaf WUE as a selection target. Crop J. 2015, 3, 220–228. [Google Scholar] [CrossRef] [Green Version]
  42. Klein, T.; Shpringer, I.; Fikler, B.; Elbaz, G.; Cohen, S.; Yakir, D. Relationships between stomatal regulation, water-use, and water-use efficiency of two coexisting key Mediterranean tree species. For. Ecol. Manag. 2013, 302, 34–42. [Google Scholar] [CrossRef]
  43. Lawson, T.; Blatt, M.R. Stomatal size, speed, and responsiveness impact on photosynthesis and water use efficiency. Plant Physiol. 2014, 164, 1556–1570. [Google Scholar] [CrossRef] [Green Version]
  44. McDowell, N.G.; Bond, B.J.; Dickman, L.T.; Ryan, M.G.; Whitehead, D. Relationships between Tree Height and Carbon Isotope Discrimination Size and Age Related Changes in Tree Structure and Function; Springer: Dordrecht, The Netherlands, 2011; pp. 255–286. [Google Scholar]
  45. Woodruff, D.R.; McCulloh, K.A.; Warren, J.M.; Meinzer, F.C.; Lachenbruch, B. Impacts of tree height on leaf hydraulic architecture and stomatal control in Douglas-fir. Plant Cell Environ. 2007, 30, 559–569. [Google Scholar] [CrossRef] [PubMed]
  46. Hu, J.; Moore, D.J.; Riveros-Iregui, D.A.; Burns, S.P.; Monson, R.K. Modeling whole-tree carbon assimilation rate using observed transpiration rates and needle sugar carbon isotope ratios. New Phytol. 2010, 185, 1000–1015. [Google Scholar] [CrossRef] [Green Version]
  47. Konate, N.M.; Dreyer, E.; Epron, D. Differences in carbon isotope discrimination and whole-plant transpiration efficiency among nine Australian and Sahelian Acacia species. Ann. For. Sci. 2016, 73, 995–1003. [Google Scholar] [CrossRef] [Green Version]
  48. Warren, C.R.; Adams, M.A. Water availability and branch length determine δ13C in foliage of Pinus pinaster. Tree Physiol. 2000, 20, 637–643. [Google Scholar] [CrossRef]
  49. Samuelson, L.J.; Stokes, T.A. Leaf physiological and morphological responses to shade in grass-stage seedlings and young trees of long leaf pine. Forests 2012, 3, 684–699. [Google Scholar] [CrossRef] [Green Version]
  50. O’leary, M.H.; Madhavan, S.; Paneth, P. Physical and chemical basis of carbon isotope fractionation in plants. Plant Cell Environ. 1992, 15, 1099–1104. [Google Scholar] [CrossRef]
  51. Sensuła, B.; Wilczyński, S.; Opała, M. Tree growth and climate relationship: Dynamics of Scots pine (Pinus sylvestris L.) growing in the near-source region of the combined heat and power plant during the development of the pro-ecological strategy in Poland. Water Air Soil Pollut. 2015, 226, 220. [Google Scholar] [CrossRef] [Green Version]
  52. Cavaleri, M.A.; Oberbauer, S.F.; Clark, D.B.; Clark, D.A.; Ryan, M.G. Height is more important than light in determining leaf morphology in a tropical forest. Ecology 2010, 91, 1730–1739. [Google Scholar] [CrossRef] [PubMed]
  53. Li, J.; Li, X. Response of stomatal conductance of two tree species to vapor pressure deficit in three climate zones. J. Arid Land 2014, 6, 771–781. [Google Scholar] [CrossRef]
  54. Chang, X.; Wang, Z.; Wei, F.; Xiao, P.; Shen, Z.; Lv, X.; Shi, Y. Determining the Contributions of Vegetation and Climate Change to Ecosystem WUE Variation over the Last Two Decades on the Loess Plateau, China. Forests 2021, 12, 1442. [Google Scholar] [CrossRef]
  55. Warren, C.R.; McGrath, J.F.; Adams, M.A. Water availability and carbon isotope discrimination in conifers. Oecologia 2001, 127, 476–486. [Google Scholar] [CrossRef]
  56. Zhou, S.; Yu, B.; Huang, Y.; Wang, G. Daily underlying water use efficiency for AmeriFlux sites. Biogeo Sci. 2015, 120, 887–902. [Google Scholar] [CrossRef] [Green Version]
  57. Feng, C.Y.; Wang, H.S.; Sun, J.X. Temporal changes of vegetation water use efficiency and its influencing factors in Northern China. J. Plant Ecol. 2018, 42, 453. [Google Scholar]
  58. Hu, Y.; Zhao, P.; Zhu, L.; Zhao, X.; Ni, G.; Shen, W. Responses of sap flux and intrinsic water use efficiency to canopy and understory nitrogen addition in a temperate broadleaved deciduous forest. Sci. Total Environ. 2019, 648, 325–336. [Google Scholar] [CrossRef] [PubMed]
  59. Liu, E.K.; Mei, X.R.; Yan, C.R.; Gong, D.Z.; Zhang, Y.Q. Effects of water stress on photosynthetic characteristics, dry matter translocation and WUE in two winter wheat genotypes. Agric. Water Manag. 2016, 167, 75–85. [Google Scholar] [CrossRef]
  60. Han, L.; He, J.; Ye, T.Q. Responses and modeling of canopy stomatal conductance of Platycladus orientalis to environmental factors in Hedong sandy Ningxia land. J. Ecol. 2018, 37, 2862–2868. [Google Scholar]
  61. Kudoyarova, G.R.; Veselov, D.S.; Faizov, R.G.; Veselova, S.V.; Ivanov, E.A.; Farkhutdinov, R.G. Stomata response to changes in temperature and humidity in wheat cultivars grown under contrasting climatic conditions. J. Plant Physiol. 2007, 54, 46–49. [Google Scholar] [CrossRef]
  62. Damour, G.; Simonneau, T.; Cochard, H.; Urban, L. An overview of models of stomatal conductance at the leaf level. Plant Cell Environ. 2010, 33, 1419–1438. [Google Scholar] [CrossRef] [PubMed]
  63. Morecroft, M.D.; Woodward, F.I.; Marris, R.H. Altitudinal Trends in Leaf Nutrient Contents, Leaf Size and| delta 13C of Alchemilla alpina. Funct. Ecol. 1992, 6, 730–740. [Google Scholar] [CrossRef]
  64. Francey, R.J.; Gifford, R.M.; Sharkey, T.D.; Weir, B. Physiological influences on carbon isotope discrimination in huon pine (Lagarostrobos franklinii). Oecologia 1985, 66, 211–218. [Google Scholar] [CrossRef] [PubMed]
  65. Ziegler, H. Stable isotopes in plant physiology and ecology. In Progress in Botany; Behnke, H.D., Lüttge, U., Esser, K., Kadereit, J.W., Runge, M., Eds.; Springer: Berlin/Heidelberg, Germany, 1995; Volume 56, pp. 1–24. [Google Scholar]
  66. Kubien, D.S.; Sage, R.F. The temperature response of photosynthesis in tobacco with reduced amounts of Rubisco. Plant Cell Environ. 2008, 31, 407–418. [Google Scholar] [CrossRef]
  67. Seibt, U.; Rajabi, A.; Griffiths, H.; Berry, J.A. Carbon isotopes and water use efficiency: Sense and sensitivity. Oecologia 2008, 155, 441–454. [Google Scholar] [CrossRef]
  68. Quemada, M.; Gabriel, J.L. Approaches for increasing nitrogen and water use efficiency simultaneously. Glob. Food Secur. 2016, 9, 29–35. [Google Scholar] [CrossRef] [Green Version]
  69. Gago, J.; Douthe, C.; Florez-Sarasa, I.; Escalona, J.M.; Galmes, J.; Fernie, A.R.; Medrano, H. Opportunities for improving leaf water use efficiency under climate change conditions. Plant Sci. 2014, 226, 108–119. [Google Scholar] [CrossRef] [PubMed]
  70. Bögelein, R.; Lehmann, M.M.; Thomas, F.M. Differences in carbon isotope leaf-to-phloem fractionation and mixing patterns along a vertical gradient in mature European beech and Douglas fir. New Phytol. 2019, 222, 1803–1815. [Google Scholar] [CrossRef] [PubMed]
  71. Zhang, M.L.; Wang, J.X.; Li, J.W. Characteristics of photosynthesis and water use efficiency of Robinia pseudoacacia and Platycladus orientalis seedlings under sufficient soil moisture. J. Northwest For. Univ. 2009, 24, 27–32. [Google Scholar]
  72. Bachofen, C.; D’Odorico, P.; Buchmann, N. Light and VPD gradients drive foliar nitrogen partitioning and photosynthesis in the canopy of European beech and silver fir. Oecologia 2020, 192, 323–339. [Google Scholar] [CrossRef] [PubMed]
  73. Russo, G.; Beritognolo, I.; Sabatti, M.; Climent, J.M.; Lauteri, M.; De Angelis, P. Functional relationships between leaves and stem across canopy layers in two contrasting clones of Populus nigra L. Plant Physiol. Biochem. 2018, 133, 22–28. [Google Scholar] [CrossRef]
  74. Condon, A.G.; Richards, R.A.; Rebetzke, G.J.; Farquhar, G.D. Breeding for high water-use efficiency. J. Exp. Bot. 2004, 55, 2447–2460. [Google Scholar] [CrossRef] [PubMed] [Green Version]
  75. Cernusak, L.A.; Marshall, J.D. Responses of foliar δ13C, gas exchange and leaf morphology to reduced hydraulic conductivity in Pinus monticola branches. Tree Physiol. 2001, 21, 1215–1222. [Google Scholar] [CrossRef] [PubMed] [Green Version]
  76. He, C.X. Leaf traits and WUE of tall trees change with tree height. Ecol. J. 2013, 33, 5644. [Google Scholar]
  77. Tanaka-Oda, A.; Kenzo, T.; Koretsune, S.; Sasaki, H.; Fukuda, K. Ontogenetic changes in water-use efficiency (δ13C) and leaf traits differ among tree species growing in a semiarid region of the Loess Plateau, China. For. Ecol. Manag. 2010, 259, 953–957. [Google Scholar] [CrossRef]
Figure 1. Representation of the study site and sampling points.
Sustainability 14 05126 g001
Figure 2. Schematic diagram of the sampling points.
Sustainability 14 05126 g002
Figure 3. (a) Air temperature (Ta), (b) relative humidity (RH), (c) vapor pressure deficit (VPD) and (d) photosynthetically active radiation (PAR)at different heights of the larch-forest canopy. Notes: Capital letters represent significance at different canopies at 0.01 level.
Sustainability 14 05126 g003
Figure 4. (a) Net photosynthetic rate (Pn), (b) transpiration rate (Tr), (c) stomatal conductivity (Gs) and (d) intercellular and atmospheric CO2 concentration ratio (Ci/Ca) change at the different canopy heights of the larch forest. Notes: Capital letters represent significance at different canopies at 0.01 level.
Sustainability 14 05126 g004
Figure 5. Importance score of influencing factor variables at different height canopies of the larch forest.
Sustainability 14 05126 g005
Table 1. Information of larch stand characteristics.
Forest TypeLarch Forest
Stand Age75–90
Canopy Density0.70–0.75
Stand Density (ha−1)1300 ± 135
Mean Tree Height (m)18.64 ± 5.43
Mean DBH (cm)13.78 ± 3.21
Elevation (m)320 ± 6
Slope (°)3 ± 1
Species Composition8L 1B 1P
Understory Species1–9
Notes: Species composition: L-Larix gmelini, B-Betula platyphylla and P-Populus davidiana. Understory species: 1-Rosa multiflora var. Cathayensis, 2-Rhododendron dauricum, 3-Vacciniumvitis-idaea, 4-Rubus clivicola, 5-Vaccinium uliginosum, 6-Saussurea japonica, 7-Pyrola incarnata, 8-Ledum palustre and 9-V. vitis-idaea. Mean ± within-standard deviation (SD).
Table 2. WUEs at the different canopy heights of the larch forest.
DateCanopyδ13C Values of AtmosphereLeaf Soluble Sugar δ13CWUEs
8–18Upper canopy−8.97−29.07 ± 0.17 A4.32 ± 0.06 A
Middle canopy−9.07−29.51 ± 0.23 B4.05 ± 0.21 B
Lower canopy−9.14−29.95 ± 0.22 B3.89 ± 0.19 B
8–19Upper canopy−9.11−29.05 ± 0.25 A4.36 ± 0.10 A
Middle canopy−9.15−29.49 ± 0.28 B4.12 ± 0.24 B
Lower canopy−9.42−29.67 ± 0.19 B4.07 ± 0.17 B
8–20Upper canopy−8.99−29.14 ± 0.09 A4.34 ± 0.07 A
Middle canopy−9.22−29.83 ± 0.23 B3.96 ± 0.21 B
Lower canopy−9.26−29.91 ± 0.20 B3.92 ± 0.18 B
Notes: Stand mean ± within-stand standard deviation (SD); different capital letters in the same column mean significant difference at 0.01 level.
Table 3. Pearson correlation coefficient (r) of WUEs and meteorological factor at different canopy heights of the larch forest.
FactorsTaRHVPDPAR
Upper Canopy WUEs0.683 *−0.832 **0.831 **0.963 **
Middle Canopy WUEs0.827 *−0.741 **0.827 **0.853 **
Lower Canopy WUEs0.643 *−0.740 **0.750 **0.753 *
* Indicates significance at the 0.05 level. ** Indicates significance at the 0.01 level. n = 9. Ta is air temperature, RH is relative humidity, VPD is vapor pressure deficit, PAR is photosynthetically active radiation.
Table 4. Pearson correlation coefficient (r) of WUEs and photosynthetic parameters at different heights canopy of the larch forest.
FactorsPnTrGsCi/Ca
Upper Canopy WUEs0.837 **0.825 *0.819 **0.465
Middle Canopy WUEs0.933 **0.731 *0.745 **0.857 *
Lower Canopy WUEs0.926 **0.4670.751 **0.544 *
* Indicates significance at the 0.05 level. ** Indicates significance at the 0.01 level. n = 9. Pn is net photosynthetic rate, Tr is transpiration rate, Gs is stomatal conductivity and Ci/Ca is intercellular and atmospheric CO2 concentration ratio.
Table 5. Leaf anatomical characteristics at different height canopies of the larch forest.
Leaf Anatomical PropertiesCanopy
UpperMiddleLower
LMA (g/m−2)30.84 ± 2.05 A19.15 ± 1.22 B18.44 ± 1.01 B
LT (μm)364.00 ± 15.06 A352.98 ± 15.47 A345.79 ± 13.05 A
Upper ET (μm)8.76 ± 0.44 A10.24 ± 0.57 A12.93 ± 0.91 A
SD in upper epidermis (mm−2)68 ± 5 B78 ± 6 B94 ± 4 A
SL in upper epidermis (μm)26.89 ± 1.38 A24.93 ± 0.39 A21.69 ± 2.49 A
SW in Upper epidermis (μm)9.65 ± 0.81 A7.89 ± 1.39 A6.85 ± 2.26 A
GCA in upper epidermis (μm−2)538.2 ± 22.52 A419.25 ± 17.02 B363.28 ± 12.51 C
lower ET (μm)7.34 ± 1.48 A8.06 ± 1.44 A9.51 ± 0.17 A
SD in lower epidermis (mm−2)107 ± 3 B110 ± 4 B140 ± 4 A
SL in lower epidermis (μm)33.00 ± 3.14 A29.96 ± 1.14 A27.37 ± 2.68 A
SW in Lower epidermis (μm)12.57 ± 0.48 A10.94 ± 1.71 A8.32 ± 1.75 A
GCA in lower epidermis (μm−2)637.8 ± 21.07 A487.52 ± 19.2 B444.03 ± 21.46 C
Notes: Stand mean ± within-stand standard deviation; different capital letters in the same column meant significant difference at 0.01 level. LMA is leaf mass per unit area, SD is stomatal density, LT is leaf thickness, ET is epidermis thickness, SL is stomatal length, SW is stomata width and GCA is guard cell area. Different capital letters in the same column mean significant difference at 0.05 level.
Table 6. Pearson correlation coefficient (r) of leaf WUEs and leaf structure at different height canopies of the larch forest.
FactorsSDLMALTETSLSWGCA
Upper Canopy WUEs−0.736 *0.725 *0.404−0.705 *0.721 *0.3910.547
Middle Canopy WUEs−0.669 *0.721 *0.462−0.6140.6180.4940.507
Lower Canopy WUEs−0.741 *0.724 *0.319−0.6060.5250.3990.501
* Indicates significance at the 0.05 level. n = 9. LMA is leaf mass per unit area, SD is stomatal density, LT is leaf thickness, ET is epidermis thickness, SL is stomatal length, SW is stomata width and GCA is guard cell area.
Publisher’s Note: MDPI stays neutral with regard to jurisdictional claims in published maps and institutional affiliations.

