Article

An Experimental Demonstration of the Effective Application of Thermal Energy Storage in a Particle-Based CSP System

1
K.A. CARE Energy Research and Innovation Center at Riyadh, Riyadh 11421, Saudi Arabia
2
Mechanical Engineering Department, King Saud University, Riyadh 11421, Saudi Arabia
3
Sustainable Energy Technologies Center, King Saud University, Riyadh 11421, Saudi Arabia
4
Georgia Institute of Technology, School of Mechanical Engineering, 771 Ferst Drive, Atlanta, GA 30332, USA
5
Mechanical Power Engineering Department, Faculty of Engineering, Helwan University, Cairo 11718, Egypt
*
Author to whom correspondence should be addressed.
Sustainability 2022, 14(9), 5316; https://doi.org/10.3390/su14095316
Submission received: 27 March 2022 / Revised: 19 April 2022 / Accepted: 25 April 2022 / Published: 28 April 2022
(This article belongs to the Special Issue Advanced Renewable Energy for Sustainability)

Abstract

:
Tests were performed at the particle-based CSP test facility at King Saud University to demonstrate a viable solution to overcome the limitations of using molten salt as a working medium in power plants. The KSU facility is composed of a heliostat field, particle heating receiver (PHR) at the top of a tower, thermal energy storage (TES) bin, a particle-to-working fluid heat exchanger (PWFHX), power cycle (microturbine), and a particle lift. During pre-commissioning, a substantial portion of the collected solar energy was lost during particle flow through the TES bin. The entrained air is shown to be the primary cause of such heat loss. The results show that the particle temperature at the PHR outlet can reach 720 °C after mitigating the entrained air issue. Additionally, during on-sun testing, a higher temperature of the air exiting the PWFHX than that of the air entering is observed, which indicates the effective solar contribution. Half-hour plant operation through stored energy was demonstrated after heliostat defocusing. Lastly, a sealable TES bin configuration for 1.3 MWe pre-commercial demonstration unit to be built in Saudi Arabia by Saudi Electric Company (SEC) is presented. This design modification has addressed the heat loss, pressure build-up, and contamination issues during TES charging.

1. Introduction

Implementing thermal energy storage (TES) in concentrating solar power (CSP) systems is currently gaining popularity because of its positive economic impacts, which include low levelized cost of energy (LCOE), increased dispatchability, and excellent capacity factor. The use of solid particles as a working and storage medium in CSP systems overcomes issues that have been realized with molten salt such as stability limit, corrosion, the need for heat tracing, and operating temperature [1,2,3,4]. For instance, one variant of particle-based CSP systems is the particle-based power tower system, as shown in Figure 1. Particles are dropped in a form of a curtain in the particle heating receiver (PHR) to intercept the reflected–concentrated sunlight. Then, the irradiated particles are directed to a high-temperature thermal energy storage (HTTES) bin, which feeds a particle-based heat exchanger. The heat exchanger transfers heat from the hot particles coming from the HTTES bin to the power cycle process fluid. Then, the cooled particles are directed to a low-temperature TES (LTTES), which feeds a particle lift (PL). Finally, the PL transfer the cooled particles to the PHR level to complete the particle loop.
The design of TES bins is critical to ensure the 24/7 operation of the power cycle. There are several determinant factors to design a thermally efficient and cost-effective design. These factors are pertaining to material selection and operation of the TES bins. Regarding the TES construction materials, the selected materials should provide acceptable thermal conductivity at high operating temperatures (>1200 °C), have good resistance to erosion (this concern is associated with the bin’s innermost surface), be structurally stable against cyclic heating and the resulting thermal stresses, and be cost-effective. The TES operational consideration requires the careful design of TES bin to prevent any air loops that might augment heat losses during charging and discharging the bin content. The resulting particle flow pattern inside the TES relies on the TES shape (conical or flat bottom), aspect ratio (diameter to height), and characteristics of particles used (shape, diameter, material density, cohesiveness, etc.). The following review gives the state of the art in particle-based thermal energy storage bins.
At King Saud University (KSU), designing and testing of two TES bin variants (cuboid and cylindrical) was conducted [5,6,7,8]. In both sets, readily available masonry materials were used to build both the bins. The main idea was to use a multi-layered bin made of low-thermal-conductivity materials that could provide an efficient and cost-effective alternative to build the TES bins.
  • For the cuboid bin, a three-layered bin was made of firebrick (innermost layer), aerated concrete, and reinforced concrete (outermost layer). With the use of an LPG burner, they were able to simulate the presence of hot solid particles filling the bin (except for the “hydrostatic” pressure, which was neglected at such small scale). The results showed that the aerated concrete suffered cracking at high temperatures (~900 °C). Later, good mechanical behavior was achieved when the bin was built out of four layers: insulating firebrick (innermost layer), perlite concrete, expansion board, and reinforced concrete (outermost layer).
  • For the cylindrical TES bin, the walls were made of insulated firebricks, perlite concrete, an expansion layer, and reinforced concrete. Using coil heaters, a temperature of 700 °C was maintained inside the bin. The heaters were kept running for a prolonged period of time (nearly a week for every test), allowing steady-state conditions to be sustained. The results confirmed that the bin structure remained intact. This demonstrated the main objective of the studies; inexpensive materials can be used to build a high-temperature TES bin.
At Sandia National Laboratories (SNL), experimental and numerical studies were conducted to optimize the geometry of the TES bin for a 1 MWth pilot plant as an exercise to mitigate all potential risks prior to technology commercialization [9,10,11]. The outcomes of these studies can be summarized as:
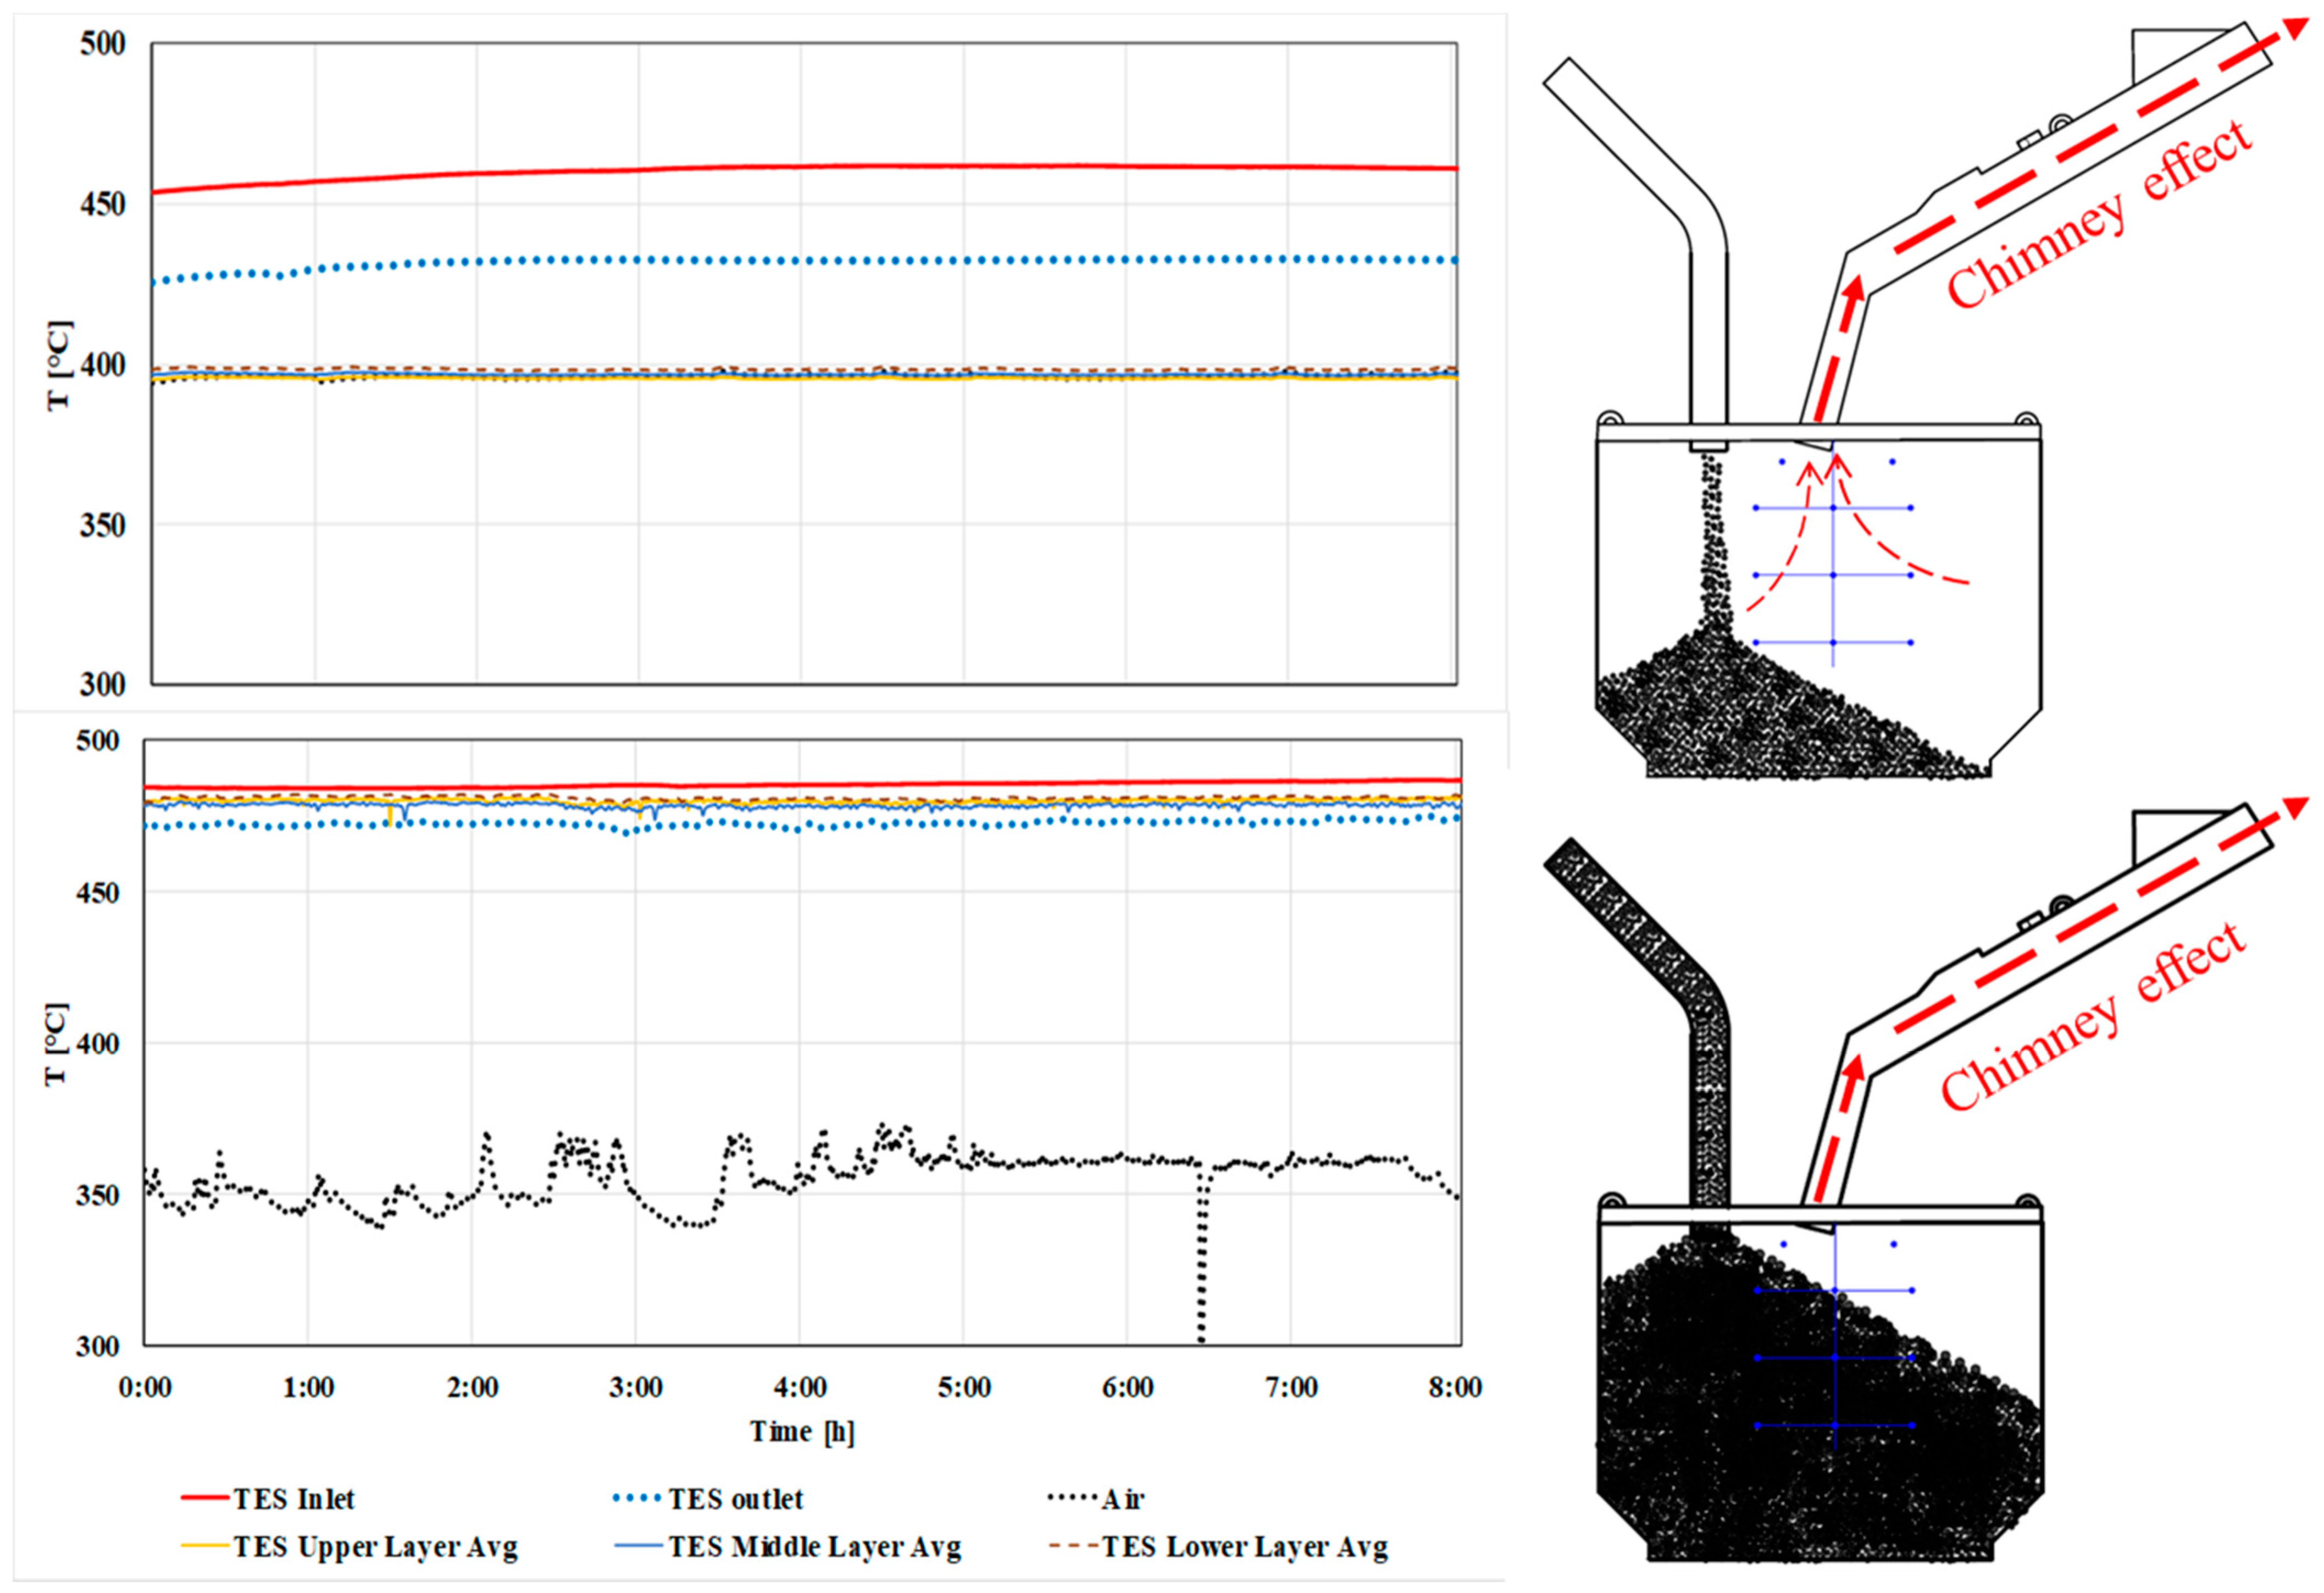
  • A flat-bottom bin whereby a stagnant layer of particles (a conical layer due to the angle of repose) could reduce the conductive heat loss greatly due to the reduced thermal conductivity of a particle bed.
  • Funnel flow provides less friction (erosion) on the bin’s side walls and less heat loss through the walls. Additionally, numerical results showed that the principal stresses are expected to be even less, as the discontinuity between the sloped and vertical walls is obscured.
  • In funnel flow configurations, the relatively colder particles closer to the bin’s wall (near the bin’s center, where active particles flow) did not result in lower discharge temperature. Therefore, funnel flow pattern is preferred over mass flow pattern in terms of particle discharge temperature.
However, during the pre-commissioning of the KSU’s plant (300 kWth), a large temperature drop in the path between the PHR outlet and the heat exchanger inlet (where the bin is located) was observed [12], such that a significant amount of the collected solar energy was lost before reaching the heat exchanger which negatively affected the overall performance of the plant. None of the above literature investigated methods to demonstrate, then mitigate, TES bin’s charging losses. In this paper, a detailed description of effectively harnessing the stored thermal energy from the TES bin is presented. Two scenarios based on the level of particles in the TES bin were studied, and the heat loss during charging for each case was calculated. The charging heat loss was minimized by minimizing/eliminating the amount of entrained air. When the charging loss decreased in the KSU test facility, the temperature of the circulated particles increased. Moreover, system limitations and key recommendations towards efficient energy storage bins are also outlined.

2. Experimental Work

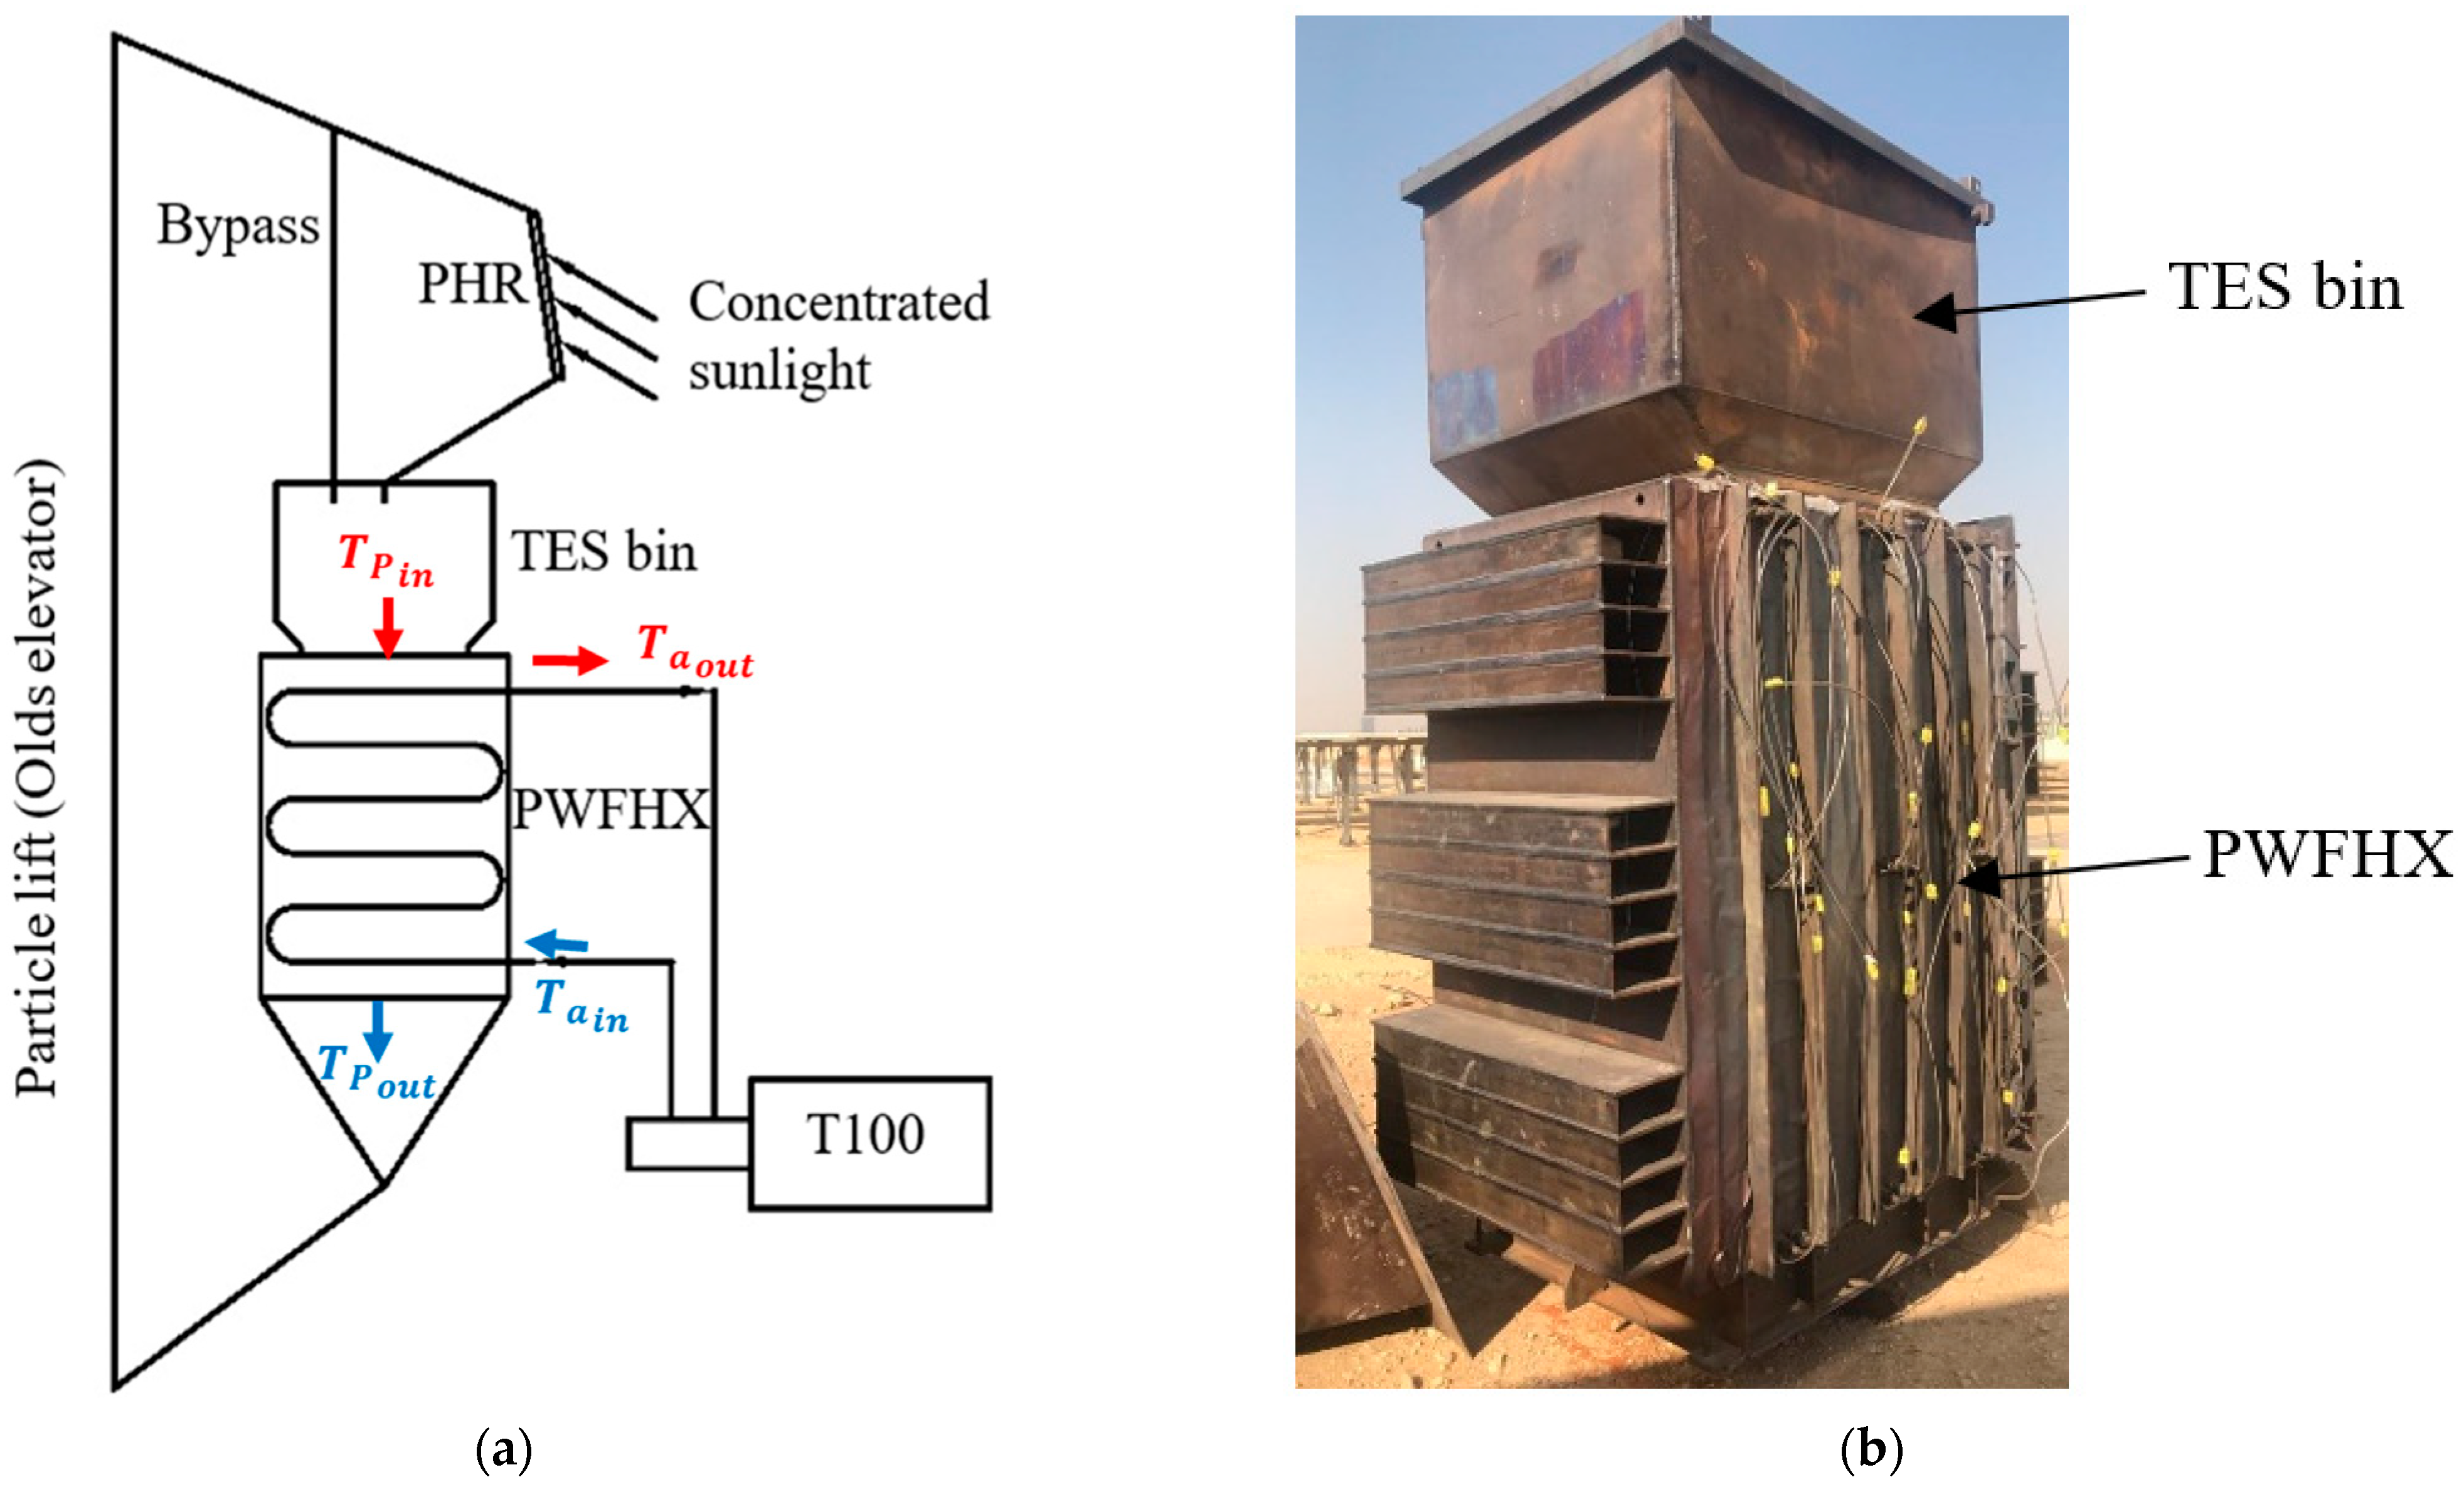
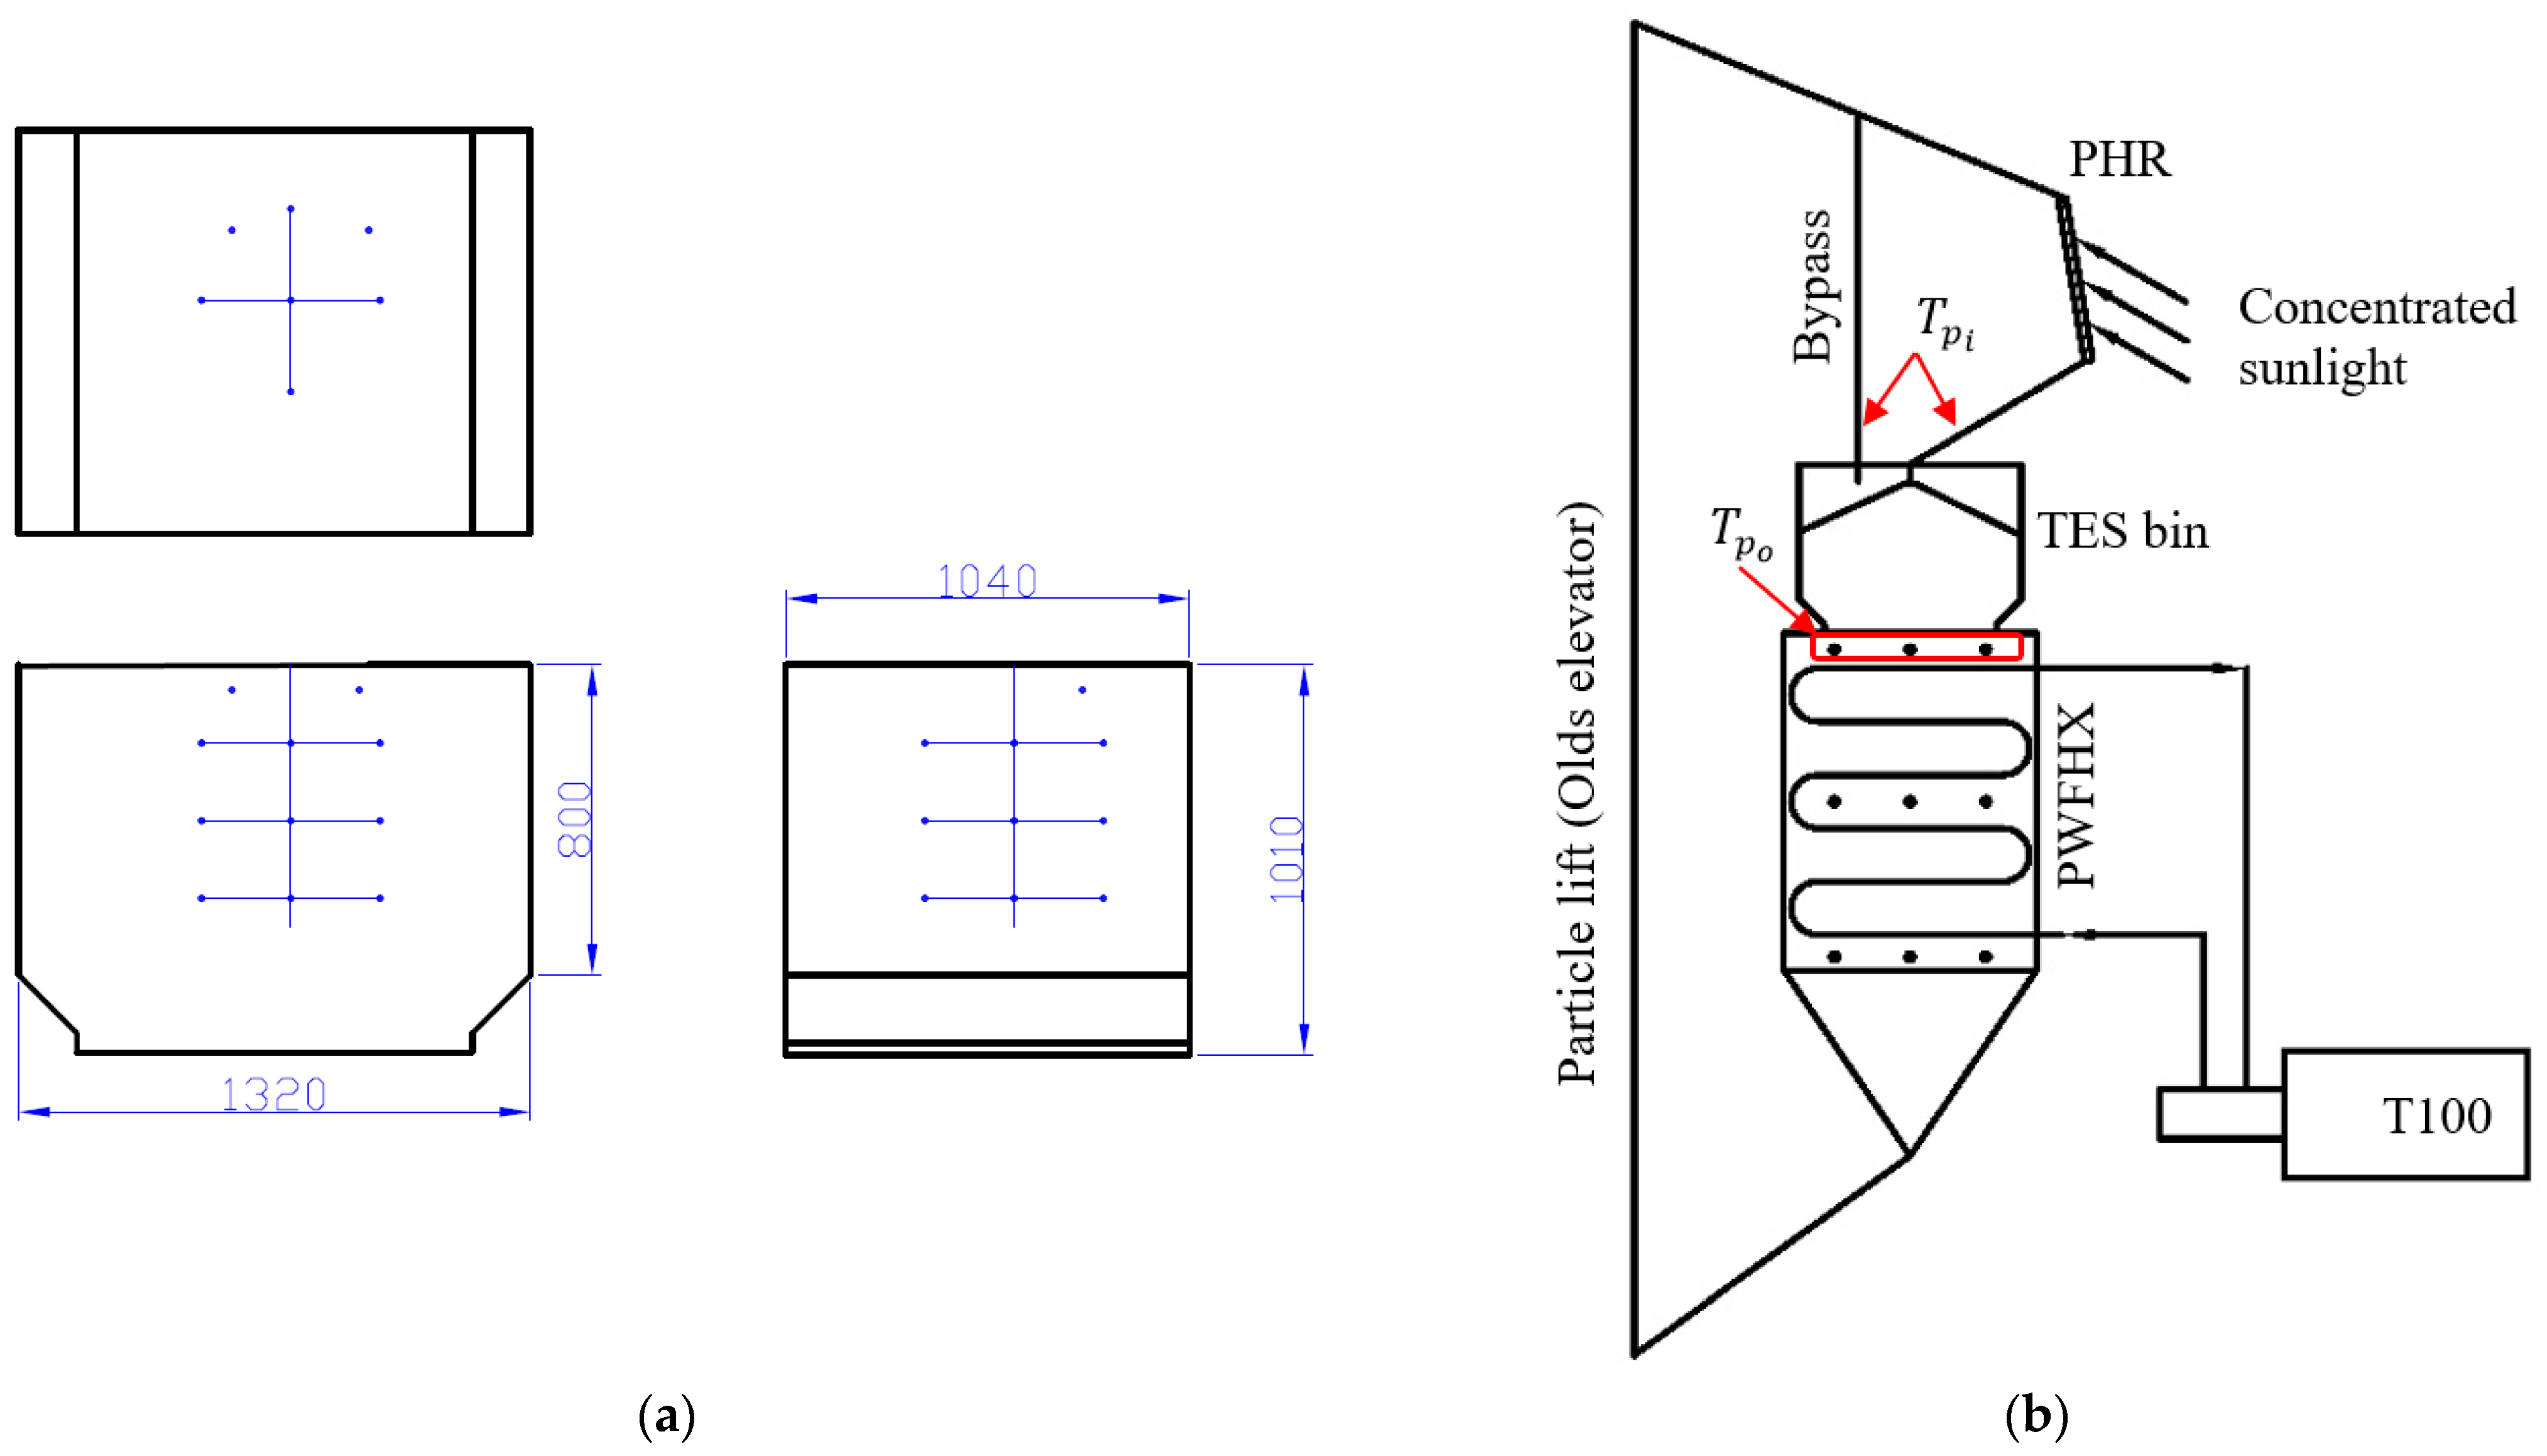
2.1. Description of the Test Facility

The KSU facility consists of heliostat field, particle heating receiver (PHR) at the top of a tower, thermal energy storage (TES) bin, particle-to-working fluid heat exchanger (PWFHX), power cycle (a 100 kWe recuperated microturbine called T100), and a particle lift. The PHR is located just behind an aperture, where particles are released in a form of curtain to absorb the reflected-concentrated sunlight. Once heated, particles are collected in the TES bin (shown in Figure 2a) whose capacity is approximately 1 m3. The TES bin serves two purposes: (1) acts as a buffer to minimize the effect of sudden fluctuations in solar radiation, and (2) feeds the heat exchanger for a short period after shutting down the heliostat field to demonstrate the technical feasibility of power generation from thermal energy storage. After leaving the TES bin, the irradiated particles enter the PWFHX (shown in Figure 2b) and transfer the collected heat to the T100’s air loop. Finally, the cooler particles are lifted back to the PHR level to be heated again by the heliostat field. A detailed description of the KSU’s facility and its operational modes can be found in [13,14,15].
It should be noted that, as Figure 2a shows, the higher the particle temperature entering the PWFHX, the greater the chance of supplying more heat to the turbine’s air (this is referred to as solar contribution). The solar contribution can be directly detected by observing the air temperature leaving the PWFHX, i.e., the higher the air outlet temperature compared to the inlet, the greater the solar contribution.

2.2. Test Procedure

As Figure 2a shows, two particle loops are deployed in the tower; the first runs through the PHR, whereas the second runs through a bypass chute. As will be shown later, this arrangement is essential to operate the facility. It should be noted that the T100 is fully integrated with the PWFHX, i.e., it cannot be run independently of the PWFHX. Moreover, the T100 should only be started when the particles’ average temperature inside the PWFHX reaches a specific value (usually around 300 °C or higher). Thus, a preheating process is compulsory for system operation. To run the system, it must go through startup phases. The first startup phase is to preheat the particles using the heliostat field; afterward, once the particle temperature inside the PWFHX reached 300 °C, the T100 could be started. The second phase is to heat the particles using the T100 only at the end of the day and overnight by circulating the particles through the bypass line. The particles inside the PWFHX are heated by the recuperated air leaving the T100 (air temperature is around 550 °C). The preheating process thus heats the particles inside the PWFHX, the particle lift, and all connection chutes to a fairly high temperature, which prepares the system for the actual on-sun test to achieve the experimental objectives. Once the start-up process is completed, the system is ready for on-sun testing. Therefore, the bypass line helps keeping all system components at high temperature through circulation overnight. This test procedure is unique to this test facility. The TES bin should have enough inventory to run the system overnight, thus keeping the system at high temperature for the next run.
To investigate the TES charging losses, two scenarios were employed based on the particles level in the TES bin: partially filled and full bin. In both scenarios, the two particle loops were deployed. In the first scenario, particles were circulated through the bypass line in which the T100 was used as a heat source, whereas in the second, particles were directed to the PHR to be irradiated by the heliostat field. The number of mirrors was continuously regulated to achieve a constant PHR outlet temperature.

2.3. Instrumentation

To fully assess the performance of the facility, the particle/air temperature were recorded at the inlet/outlet of every component as shown in Figure 3. Temperature, pressure, and flow rate were continuously monitored to fully assess the system’s performance. Temperature is mostly measured using K-Type thermocouples, which were located at several locations, including the PHR inlet and outlet, inside the TES, inside the PWFHX, at the particle elevator bottom hopper, the air piping, and the inlet and outlet of the different components of the T100.
All instruments were wired into a data acquisition unit (Keysight 34,972). The particle flow rate was controlled by the slide gate located at the bottom of the PWFHX; this slide gate can be controlled locally or remotely from the control room. The particle flow rate was measured at the elevator’s outlet using a bucket and a weighing scale.
To monitor particle temperatures inside the TES bin, 15 K-type thermocouples (TCs) were installed along and over the bin. The TCs were distributed into three levels; five TCs were used in every level. As shown in Figure 4a, in every level, the TCs were distributed evenly (over the horizontal plane) inside the bin, constructing a circumference of 0.5 m to acquire the temperature in the north, east, south, west, and center of each level. Since the bin cannot be filled “entirely” with particles (due to the particle’s angle of repose), additional two thermocouples were installed in the dry region at the bin’s top to monitor the air temperature at that region. The particle inlet temperature ( T p i ) was measured using three TCs (locations of the TCs are shown in Figure 4b), while the particle outlet temperature ( T p o ) was measured at the entrance of the PWFHX by nine thermocouples (K-Type) distributed evenly at the upper level of the heat exchanger (highlighted in Figure 4b).

2.4. Particle Properties

The particles used during all tests were CARBOBEAD CP (0.3 mm in diameter). CARBOBEAD CP is an engineered ceramic particle from CARBO Industrial Technologies. The main specs of CARBOBEAD CP are listed in Table 1.
The specific heat of the CARBOBEAD CP particles was measured at SNL by using the differential scanning calorimetry technique [16]. The agglomeration tendency can be defined as the phenomenon in which solid particles start to form lumps under the effect of temperature while subjected to atmospheric pressure. During the commissioning of KSU’s plant, particles such as red sand, CARBOBEAD CP, and white sand were used as working and storage medium. Except of the red sand, the other candidates showed low agglomeration tendency under cyclic heating [17]. The reflectivity of CARBOBEAD CP was measured using ASD FieldSpe3 Portable Spectroradiometer device in the wavelength range from 350 nm–2500 nm. A fixed funnel method was used to measure the angle of repose in which particles are poured from the funnel onto a circular disk. The pouring process continues until a particle pile is formed. Then, using the camera, a picture of the pile was taken, which was then processed using ImageJ to obtain the angle of repose.

3. Experimental Results

During the KSU’s plant pre-commissioning, there was a large temperature drop in the path between the PHR outlet and the PWFHX inlet where the bin was located [12,19]. Figure 5 shows a sample of the recorded data during on-sun operation in which the losses during charging the TES bin were large. The temperatures of the particles at the receiver outlet (red line), PWFHX inlet (or TES outlet, green dotted-line), PWFHX outlet, and receiver inlet are also shown. Additionally, PWFHX air inlet and air outlet temperatures are included in the figure. Several conclusions can be drawn from the data:
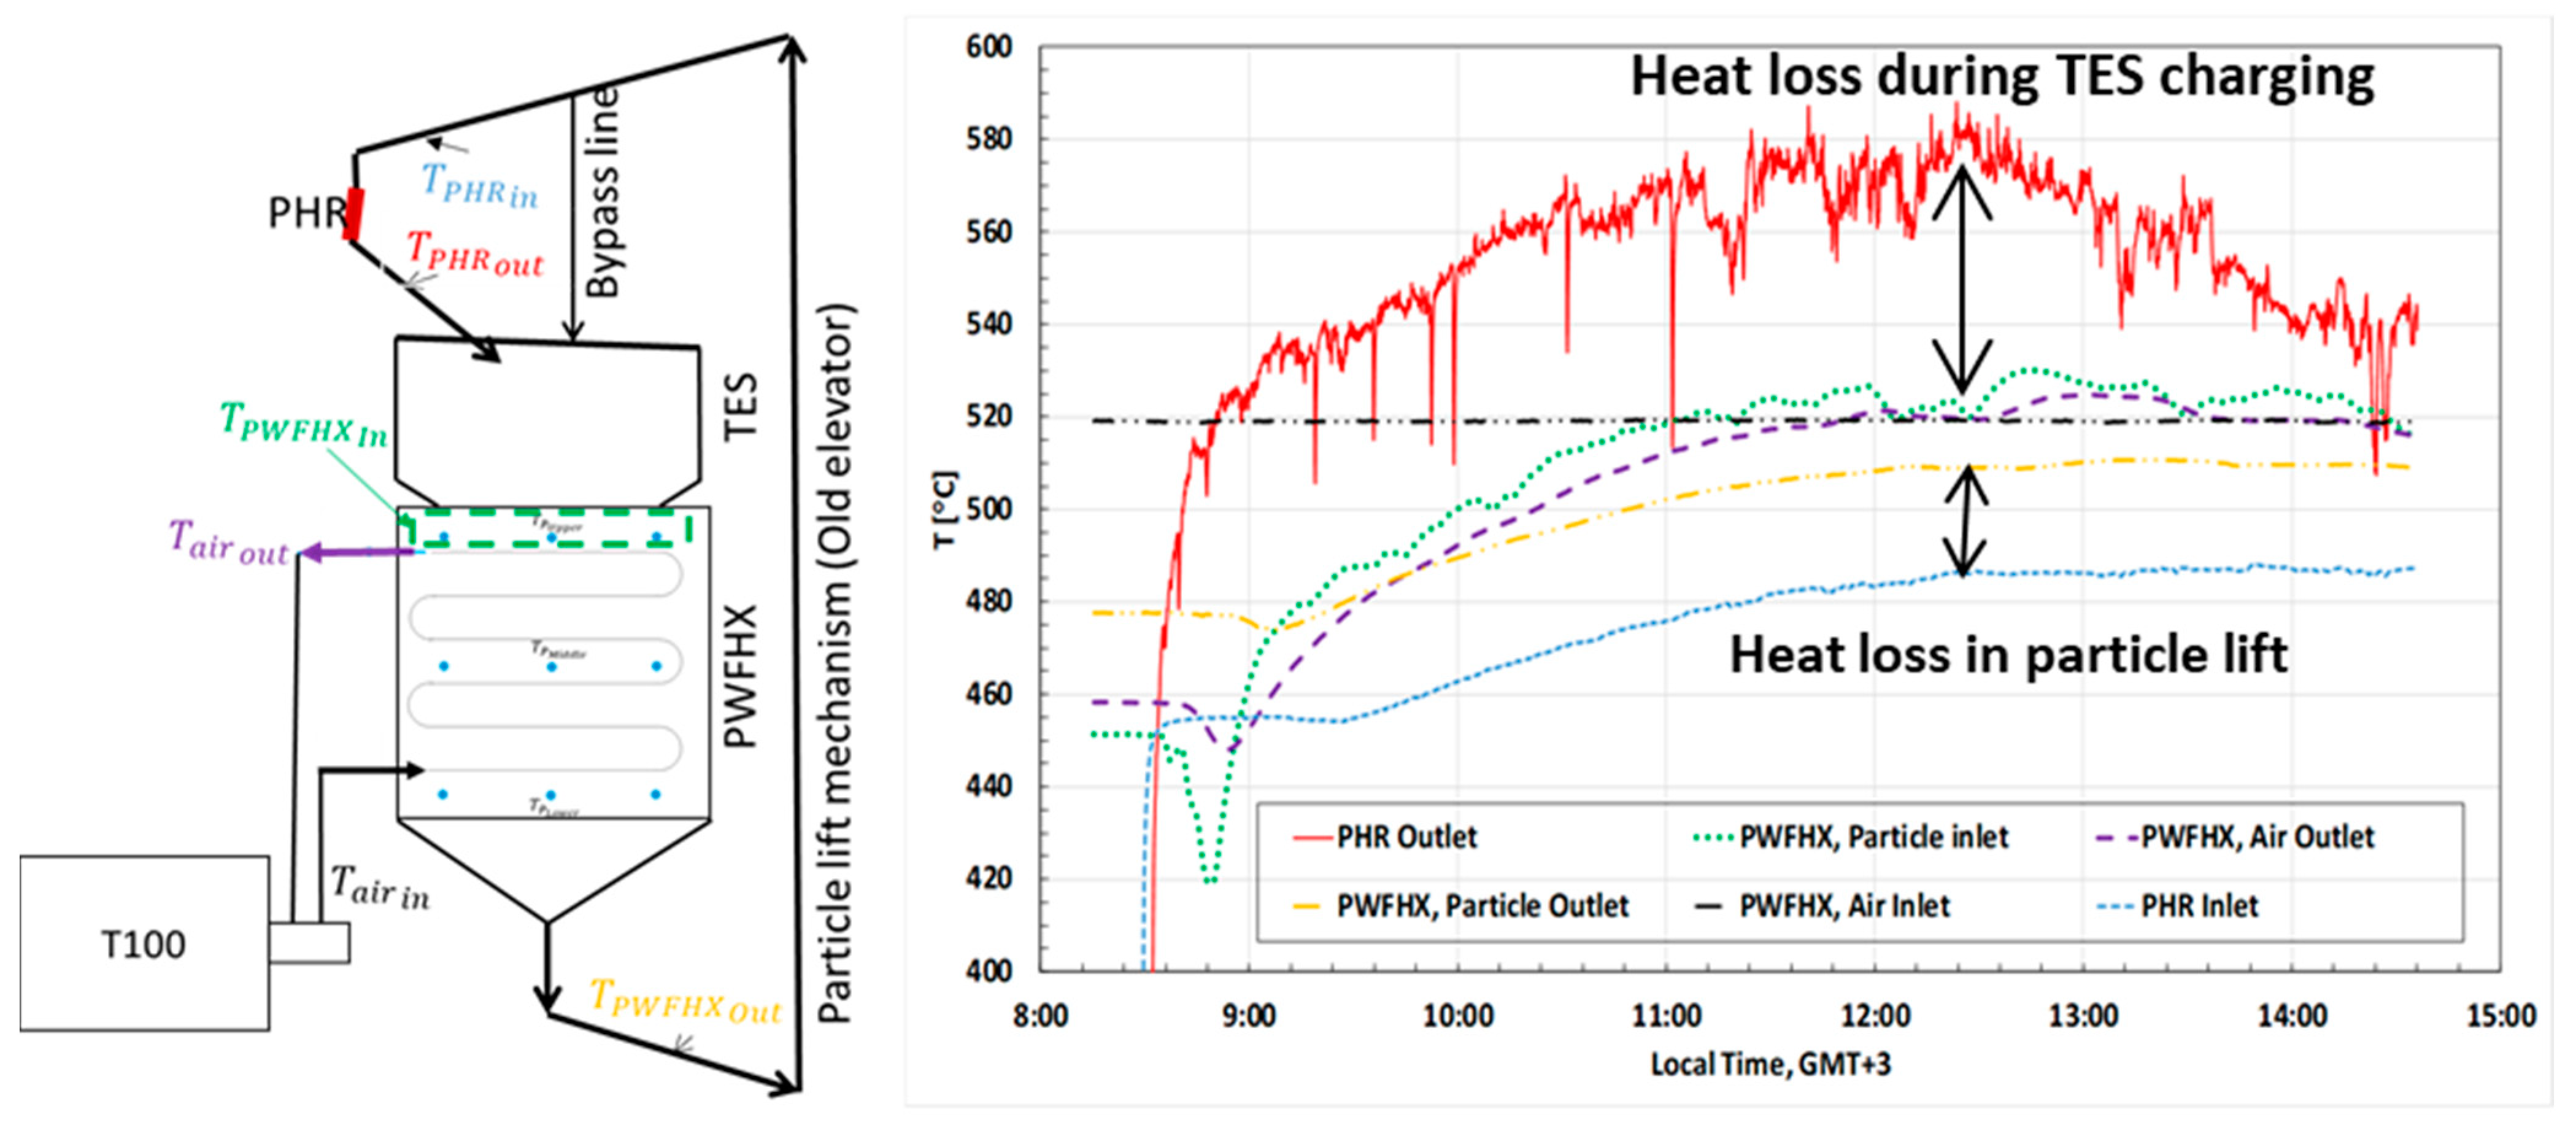
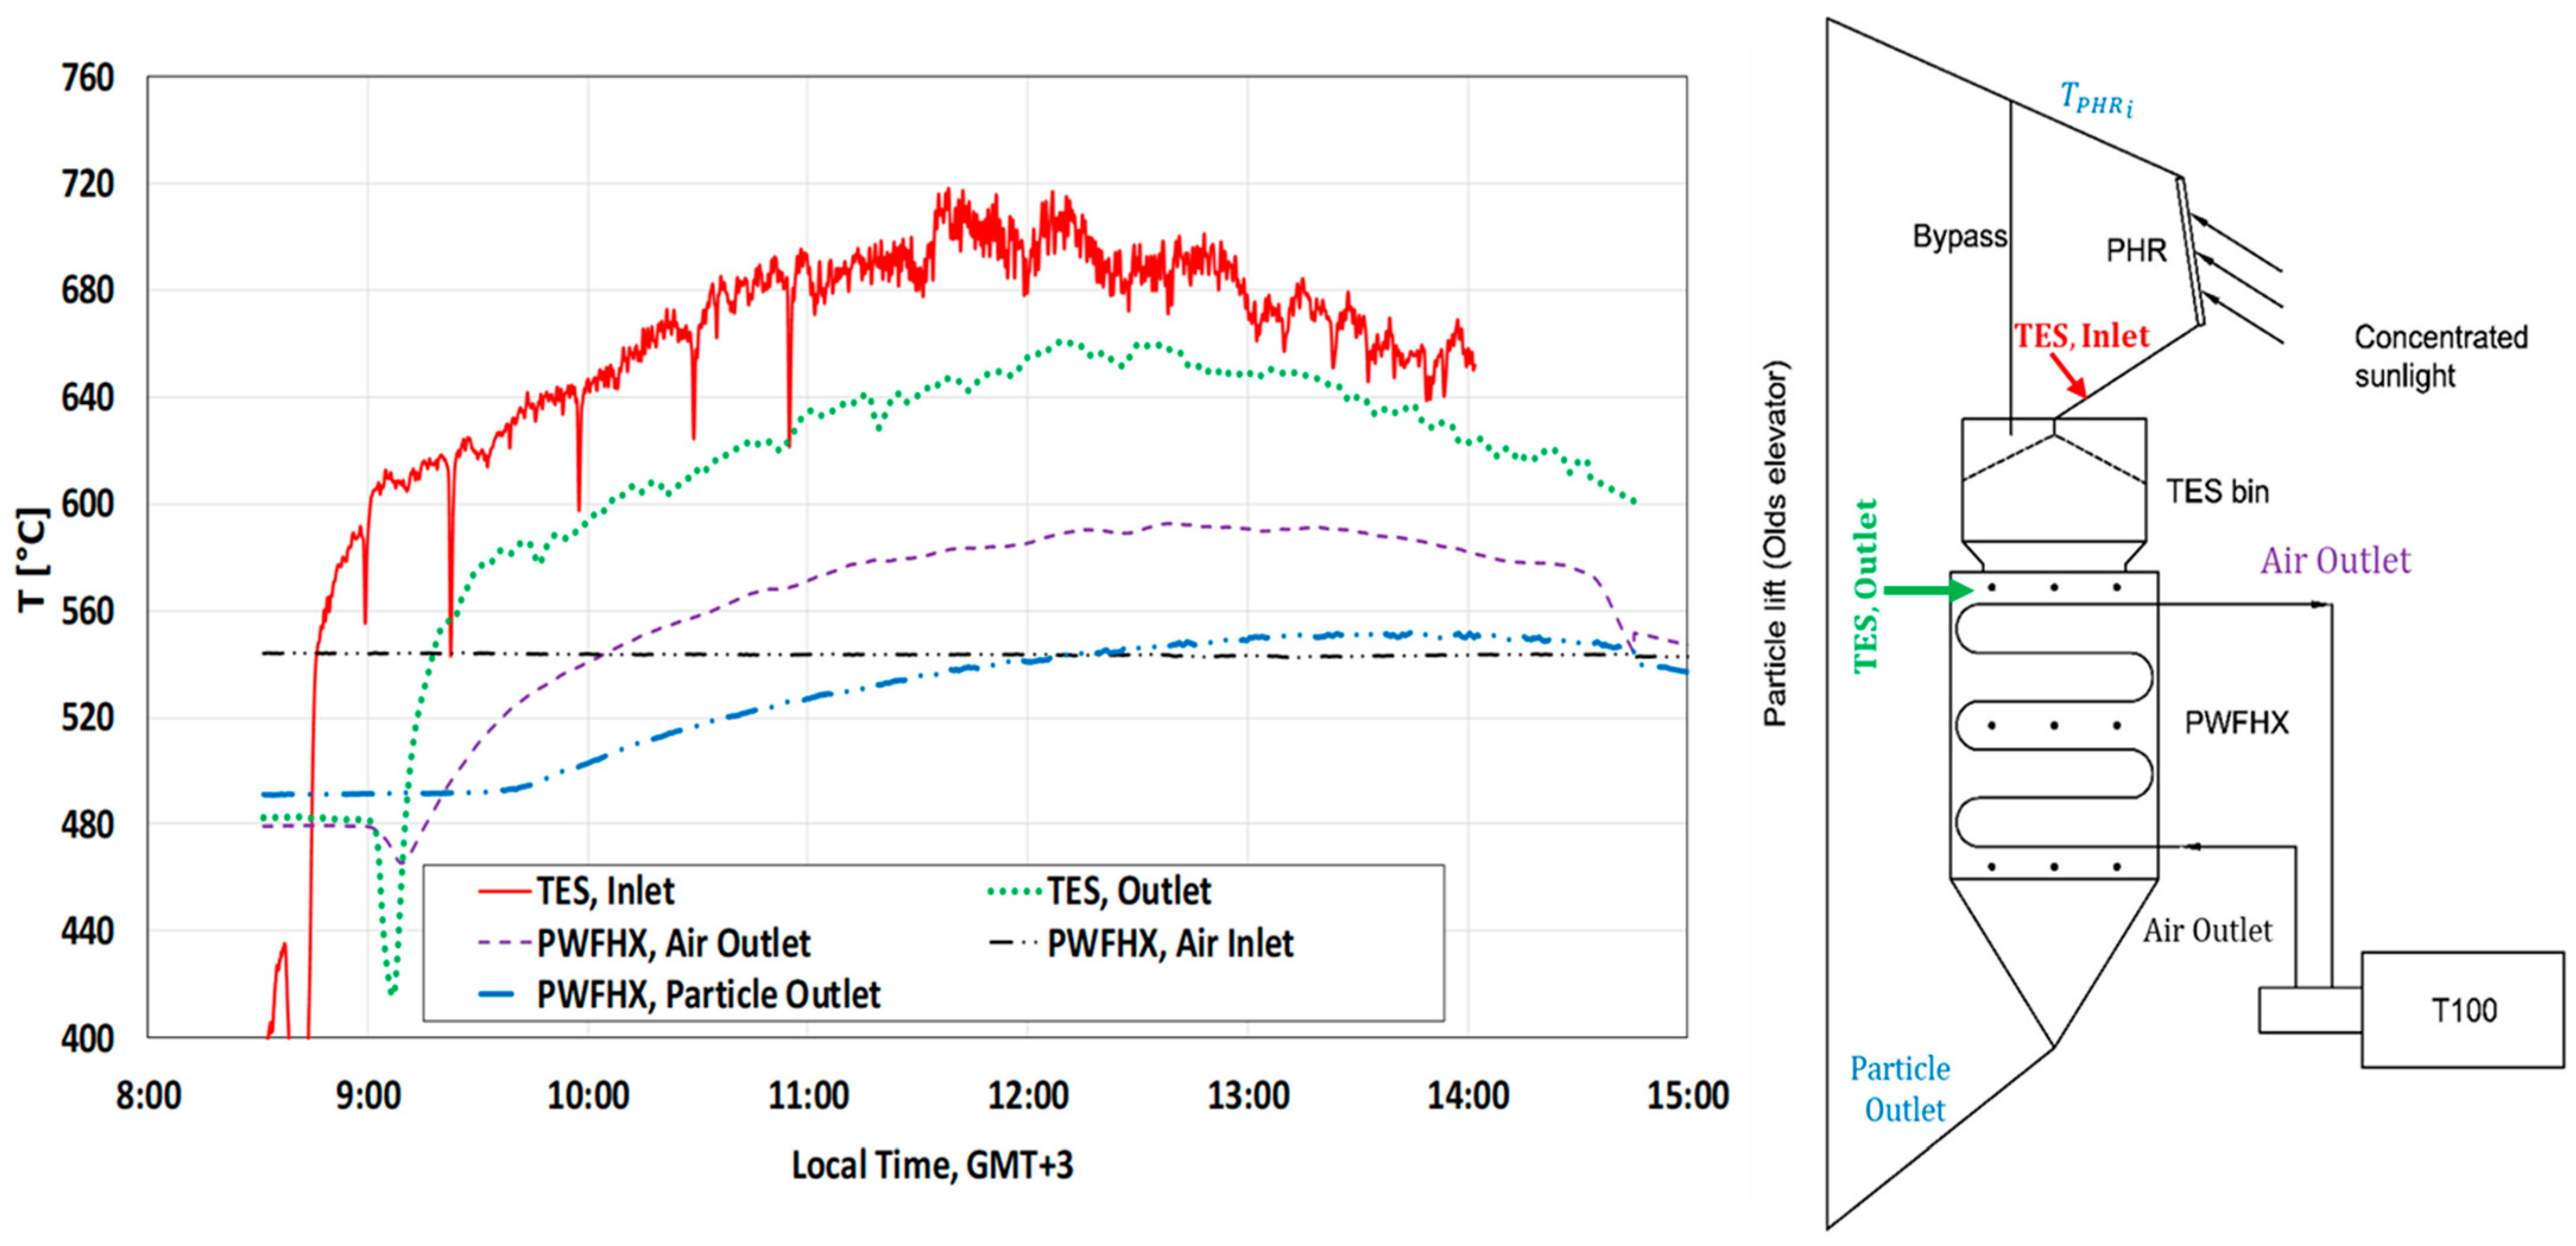
  • Excessive heat loss across the TES bin: the area enclosed between the PHR outlet temperature (red line) and the PWFHX inlet temperature (green-dotted line) gives an indication on the amount of energy lost during charging the TES bin.
  • Significant heat loss across the particle lift: the area enclosed between the PWFHX outlet temperature (yellow chain-line) and the PHR inlet temperature (blue-dotted line) gives an indication on the amount of energy lost during traveling along the particle path. The heat loss is related to the thermal mass of the particle lift. In Sarfraz et al. [20], a new design that reduces heat leakage, is cost-effective, and is easy to maintain is presented in detail.
  • Solar contribution: the area enclosed between the PWFHX air outlet temperature (purple chain-line) and the PWFHX air inlet temperature (black chain-line) represents the amount of energy transferred from the irradiated particles to the turbine’s air. As can be noticed, in the time period between 12:30 and 13:30, only a small fraction of the collected energy was successfully delivered to the turbine’s air. It is evident from the data that the solar contribution could be higher if the PWFHX inlet temperature (green dotted line) approaches the PHR outlet temperature.
A heat loss mitigation strategy is necessary to demonstrate and realize KSU’s facility concept, as shown in Figure 5. In this paper, only the activities related to the losses across the TES bin are addressed. As will be shown later, the charging losses are originated by the amount of entrained air that has been pulled by the particle curtain. Particles while flowing through the PHR pull some air from the PHR surroundings. The entrained air mixes with the irradiated particles while flowing through the particle chute that connects the PHR to the TES bin causing their temperature to decrease. Meanwhile, the bypass line is empty of particles; therefore, the excessive air can leave through the bypass line and promotes the “chimney effect”, as shown in Figure 6. Therefore, a significant amount of the collected thermal energy (as shown in Figure 5) is drifted away by the entrained air. It should be noted that the extent of the entrained air could decrease at high particle temperature [20]. The reduction in the entrained air is a direct consequence of the upward movement of the heated air (stimulated by the air density variation).

3.1. Circulation through the Bypass Line

Figure 7 shows the particle/air temperatures inside the TES bin, while particles are circulated through the bypass duct. It should be noted that particle temperatures were measured at several locations; three thermocouples were placed upstream the bin to acquire the bin’s inlet temperature. The bin’s outlet temperature was measured at the PWFHX particle inlet using nine thermocouples. The temperature along the bin and within its empty region was also recorded as explained earlier. The data shown in Figure 7 represent the two scenarios whereby the bin was partially filled (upper figure) and full (lower figure, particle level is shown) with particles. The temperature values show the arithmetic average of the thermocouple readings at each location. The CARBOBEAD CP angle of repose was used to estimate the particle levels in the figure.
For the partially filled scenario, all TCs measured the air temperature, except those covered with particles at the bin’s exit. The red and blue lines represent the particle temperatures at the inlet and outlet, respectively. Those values are higher than the air temperature inside the bin, since air is constantly displaced through the PHR duct (chimney effect) by the new entrained air. Eventually, such an air loop brings the air temperature inside the bin to a constant value. These conditions relate to the current system. In a commercial system, this effect is unlikely to occur. However, the current setup enables a better understanding of how much heat is lost due to the entrained air.
As can be seen, some of the TCs in the full bin scenario are not covered with particles. These TCs were excluded from the analysis. To reduce/eliminate the amount of entrained air, the bin was filled with particles up to the level shown in Figure 7. By doing so, a plug flow (Beverloo effect) is established upstream the bin, which, in turn, minimizes the opportunity for entrained air to enter the bin.
The area enclosed between the red line (TES inlet temperature) and the blue dotted line (TES outlet temperature) represents the amount of heat loss during passing along the bin. As shown in Figure 7, it is obvious that the charging losses persist even after filling the bin. This is because the bin cannot be “completely” filled with particles. One can observe (for the full bin scenario) that the air temperature (measured by two thermocouples at the dry region) is much lower than that of the particles. It is possible that there is still an open-air loop. As can be seen in Figure 7, the air temperature during the empty bin scenario was constant, and the air loops created remained stable. It should be noted that, as particles are circulated through the bypass line, the particles chute to the PHR is left partially open (can be sealed in the current system), allowing air currents to pass through and escape the bin. The heat loss in all tests was estimated as:
Q ˙ L o s s = m ˙ T T E S i T T E S o c p   d T
where Q ˙ L o s s is the rate heat loss, m ˙ is the mass flow rate, c p is the specific heat (kJ/kg-°C), and T T E S i and T T E S o are the bin’s inlet and outlet temperatures, respectively. The specific heat of CARBOBEAD CP particles can be obtained using the formula listed in Table 1.
The rate of heat lost (shown in Figure 7) while circulating through the partially filled bin was found to be 36.6 kW. This rate was decreased by 55% by having the bin filled with particles. This implies that the air entrained by particle flow and the resulting chimney effect (PHR chute acts as a chimney in this test) can significantly increase the heat loss during the TES charging process.
Table 2 shows the estimated heat loss of particles stream while flowing along the full TES bin. To investigate the effect of particle flow rate on TES losses, several tests were conducted. In Table 2, case number 3 is the one for which results are shown in Figure 7. As Table 2 shows, the TES heat loss remained relatively constant regardless of particle flow rate. In these tests, the recuperated air from the turbine was used as a source of heat. For convenience, the heat supplied by the air is also shown in Table 2.
The EES software (Klein 2021) was used to calculate the propagation of the error of the measured variables x i in the Q ˙ L o s s values as:
U b 2 = i = 1 n ( Y x i U b , x i ) 2
The particle mass flow rate was determined using a weighing bucket, and the error of the weighing scale was ±0.005 g according to the manufacturer’s specifications. The error was taken to be 0.2 °C for the temperature readings from the calibration results. The air flow meter error was 0.001 kg/s according to the manufacturer’s specifications.

3.2. Circulation through the PHR

To demonstrate the advantages of keeping the TES bin full of particles on the performance of the whole system, the two scenarios (empty and used-up bin) were examined while circulating through the PHR. Figure 8 shows the results of those tests. In the first test, the TES bin was partially filled, which allows the entrained to be sucked into the bin, whereas in the second test, the TES bin was filled (used-up) as shown to the right of the figure. It should be noted that, in order to have a constant PHR outlet temperature, the number of heliostats was continuously regulated during the tests. In these tests, the bypass line was kept empty of particles; therefore, excess air can leave through it. It can be seen from the results (shown in Figure 8) that by decreasing the amount of entrained air, the overall temperature in the particle loop is increased. The difference between the particle temperature leaving the PHR and the particle temperature leaving the TES bin is greatly reduced, which implies that the charging losses are significantly reduced (can also be compared with the trend shown in Figure 5). Moreover, the PWFHX inlet, PWFHX outlet, and the PHR inlet temperature are significantly increased. This means that the PHR particle temperature can reach higher values if the whole heliostat field is used. The higher the PHR outlet temperature, the higher the chance to achieve good solar contribution.
In the partially filled scenario, the measured particle temperature at the bin’s outlet experienced unsteady behavior (despite the inlet temperature being steady). In this case, the new entrained air pushes the bin’s air continuously through the bypass line, causing the irradiated particles to lose some of the collected energy. The particles at the bin’s outlet could not reach a steady value due to such behavior. By contrast, the amount of entrained air was greatly reduced in the full bin scenario, allowing particles to experience a steady behavior at the outlet.
Figure 9 shows the temperatures of the particles at several locations within the test facility, as well as the temperatures of air entering and leaving the heat exchanger during the on-sun testing in which the bin was maintained full (used-up) during the test, and all heliostats were used. The test was intended to demonstrate three main objectives: (1) to push the PHR outlet temperature beyond 600 °C, (2) demonstrate solar contribution, and (3) to demonstrate the concept of storing thermal energy during the day for use after defocusing the heliostat field. This last objective is intended to show the advantage of CSP plants over other solar applications in harnessing and storing solar thermal energy to be used during off-sun period. It should be noted that during this test, the TES bin was full of particles. As can be seen in Figure 9, the particle temperature reached ~720 °C around noon. This temperature is much higher than that achieved by molten-salt or direct steam CSP plants. Additionally, it can be seen that, at around 10:00 to 14:45, the temperature of the air leaving the heat exchanger is greater than that entering the heat exchanger, i.e., good solar contribution was achieved. The area enclosed between the air temperature lines (black and purple) gives an indication about the amount of energy added by the sun. Furthermore, at 14:00, the heliostat field was defocused to demonstrate the system’s ability to utilize the particulates’ stored heat during off-sun. It can be seen in Figure 9 that the hot particles at the storage tank kept adding heat to the air exiting the heat exchanger and the solar contribution continued even after defocusing.

4. Conclusions

In the present study, the thermal performance of King Saud University’s particle-based CSP facility in Riyadh, Saudi Arabia, was examined. Among other objectives, the purpose of the facility is to demonstrate the feasibility of operating a particle-based CSP system using thermal energy storage. For that, the test facility is equipped with a small storage tank whose capacity is approximately 1 m3. The tank can feed the heat exchanger for a short period after shutting down the heliostat field. However, a significant portion of the solar energy collected by the PHR is lost while charging the TES bin during plant commissioning. It has been demonstrated that by minimizing/eliminating the amount of entrained air, the charging heat loss can be minimized. The temperature of the circulated particles increased as the charging loss decreased in the current test facility. Therefore, solar energy is more likely to be harnessed effectively. When the particle temperature entering the PWFHX increases, the turbine’s air absorbs more heat while passing through the PWFHX. Further, as shown in the reported results, eliminating the charging heat loss keeps the particle temperature as high as possible to be used after defocusing the heliostat field. As a result, the plant can be operated from the storage for extended periods of time.
However, tests showed that even with used-bin, charging losses persist. To eliminate such losses, entrained air and, consequently, any possible open-air loops must be prevented. This suggest that a sealable TES bin design is more preferable. However, there are several key differences between the KSU’s existing plant and commercial plants. For commercial scale bins, as shown in Figure 10, the TES bin will be empty every morning. The figure shows the conceptual design for the 1.3 MWe pre-commercial plant, which is about to be built in the Kingdom of Saudi Arabia [20]. It should be noted that having the TES bin full of particles is not applicable for a commercial scale; therefore, to de-risk the heat loss while charging the TES bin, a sealable TES bin configuration is needed. As shown in Figure 10, particles from PHR can be directed to an intermediate hopper before flowing into the TES bin. With this configuration, by keeping the intermediate hopper full of particles during the bin charging, entrained air and the resulting air loop can be mitigated. Moreover, just upstream the bin lid, particles will pass through the SiC foam, which will filter the impurities and large-sized particles to enter into the bin. This will add additional resistance in the upward path, which, in turn, reduces the upward air flow. Additionally, the bin is equipped with a weight-operated door. As the particles further flow down the intermediate hopper, they will push open the weighted door and fall into the bin. The weighted door will close itself when all particles have moved into the bin. This will ensure that the bin will open only when the particles are loaded into the intermediate hopper. This configuration would help to prevent hot air from escaping the bin when it is empty, thus keeping the bin as hot as possible for the next run. However, there is a concern regarding the build-up pressure inside a sealed vessel. For that, a relief valve (shown in Figure 10) will be installed at the TES top to regulate the air pressure while charging the bin. Finally, it is worth to mention that a small-scale sealed TES bin is under experimental investigation at KSU. The bin will be tested at ~900 °C. The tests will simulate the real-life operation of TES systems. Simultaneously, the bin’s charging and discharging processes will be simulated (particle inflow is greater than the outflow). The study will provide insights about the nature of such losses and the resulting pressure variation of the air inside the bin.

Author Contributions

Conceptualization, S.A., E.D., H.A.-A. and S.J.; Data curation, N.S.S. and R.S.S.; Formal analysis, S.A., N.S.S., E.D., H.A.-A. and S.J.; Funding acquisition, H.A.-A.; Investigation, S.A., N.S.S., R.S.S., E.D., H.A.-A. and S.J.; Methodology, S.A., N.S.S., R.S.S., E.D., H.A.-A. and S.J.; Project administration, H.A.-A., A.E.-L., Z.A.-S., S.D. and S.J.; Resources, H.A.-A.; Writing—original draft, S.A.; Writing—review and editing, A.A., M.S., H.A.-A., A.E.-L., Z.A.-S., S.D., S.J. and Z.A. All authors have read and agreed to the published version of the manuscript.

Funding

This research was funded by the Deanship of Scientific Research at King Saud University through research group no. RG-1440-087.

Institutional Review Board Statement

Not applicable.

Informed Consent Statement

Not applicable.

Data Availability Statement

Not applicable.

Acknowledgments

The authors extend their appreciation to the Deputyship for Research & Innovation, Ministry of Education in Saudi Arabia for funding this research work through the project number (DRI-KSU-1330). We also appreciate the Deanship of Scientific Research at King Saud University for funding this work through research group No. RG-1440-087.

Conflicts of Interest

The authors declare that they have no known competing financial interest or personal relationships that could have appeared to influence the work reported in this paper.

Abbreviations

CSPConcentrating Solar Power
KSUKing Saud University
LCOELevelized Cost of Energy
PBCSPParticle-Based Concentrated Solar Power
PWFHXParticle-to-Working Fluid Heat Exchanger
PHRParticle Heating Receiver
SECSaudi Electricity Company
SNLSandia National Laboratories
TCThermocouple
TESThermal Energy Storage

References

  1. Martin, J.; Vitko, J. ASCUAS: A Solar Central Receiver Utilizing a Solid Thermal Carrier; SAND828203; Sandia National Laboratories: Livermore, CA, USA, 1982.
  2. Ho, C.K. Advances in central receivers for concentrating solar applications. Sol. Energy 2017, 152, 38–56. [Google Scholar] [CrossRef]
  3. Al-Ansary, H. Prospects for Use of Solar Thermal Energy in High-Temperature Process Heat Applications. In Applied Mechanics and Materials; Trans Tech Publications Ltd.: Freienbach, Switzerland, 2016; Volume 819, pp. 16–20. [Google Scholar]
  4. González-Portillo, L.F.; Albrecht, K.; Ho, C.K. Techno-Economic Optimization of CSP Plants with Free-Falling Particle Receivers. Entropy 2021, 23, 76. [Google Scholar] [CrossRef] [PubMed]
  5. El Leathy, A.; Jeter, S.; Al Ansary, H.; Abdel Khalik, S.; Roop, J.; Golob, M.; Alrished, A.; Al-Suhaibani, Z. Study of heat loss characteristics from a high temperature thermal energy storage system. In Proceedings of the 18th SolarPACES Conference, Marrakech, Morocco, 11–14 September 2012. [Google Scholar]
  6. El Leathy, A.; Jeter, S.; Al Ansary, H.; Abdel Khalik, S.; Roop, J.; Golob, M.; Danish, S.N.; Alrished, A.; Djajadiwinata, E.; Al Suhaibani, Z. Experimental study of heat loss from a thermal energy storage system for use with a high temperature falling particle receiver system. In Proceedings of the 19th SolarPACES Conference, Las Vegas, NV, USA, 17–20 September 2013. [Google Scholar]
  7. El-Leathy, A.; Jeter, S.; Al-Ansary, H.; Abdel-Khalik, S.; Roop, J.; Golob, M.; Danish, S.; Alrished, A.; Djajadiwinata, E.; Al-Suhaibani, Z. Thermal Performance Evaluation of Two Thermal Energy Storage Tank Design Concepts for Use with a Solid Particle Receiver-Based Solar Power Tower. Energies 2014, 7, 8201–8216. [Google Scholar] [CrossRef] [Green Version]
  8. El-Leathy, A.; Jeter, S.; Al-Ansary, H.; Danish, S.N.; Saeed, R.; Abdel-Khalik, S.; Golob, M.; Djajadiwinata, E.; Al-Suhaibani, Z. Thermal performance evaluation of lining materials used in thermal energy storage for a falling particle receiver based CSP system. Sol. Energy 2019, 178, 268–277. [Google Scholar] [CrossRef]
  9. Sment, J.; Albrecht, K.; Christian, J.; Ho, C.K. Optimization of Storage Bin Geometry for High Temperature Particle-Based CSP Systems. In Energy Sustainability; American Society of Mechanical Engineers: New York, NY, USA, 2019; Volume 59094, p. V001T03A008. [Google Scholar]
  10. Sment, J.; Albrecht, K.; Martinez, M.J.; Ho, C.K. Design considerations for a high-temperature particle storage bin. In AIP Conference Proceedings; AIP Publishing LLC.: Melville, NY, USA, 2020; Volume 2303, p. 190029. [Google Scholar]
  11. Sment, J.N.; Martinez, M.J.; Albrecht, K.; Ho, C.K. Testing and Simulations of Spatial and Temporal Temperature Variations in a Particle-Based Thermal Energy Storage Bin. In Energy Sustainability; American Society of Mechanical Engineers: New York, NY, USA, 2020; Volume 83631, p. V001T02A010. [Google Scholar]
  12. Alaqel, S.; Djajadiwinata, E.; Saleh, N.S.; Saeed, R.S.; Alswaiyd, A.; Al-Ansary, H.; El-Leathy, A.; Jeter, S.; Danish, S.; Al-Suhaibani, Z.; et al. On-Sun Experiments on the World’s First Deployed Gas-Turbine Particle-Based Power Tower Facility at King Saud University. In Proceedings of the 26th SolarPACES Conference, Online Event, 28 September–2 October 2020. [Google Scholar]
  13. Al-Ansary, H.; El-Leathy, A.; Jeter, S.; Djajadiwinata, E.; Alaqel, S.; Golob, M.; Nguyen, C.; Saad, R.; Shafiq, T.; Danish, S.; et al. On-sun experiments on a particle heating receiver with red sand as the working medium. In AIP Conference Proceedings; AIP Publishing LLC.: Melville, NY, USA, 2018; Volume 2033, p. 040002. [Google Scholar]
  14. El-Leathy, A.; Al-Ansary, H.; Jeter, S.; Djajadiwinata, E.; Alaqel, S.; Golob, M.; Nguyen, C.; Saad, R.; Shafiq, T.; Danish, S.; et al. Preliminary tests of an integrated gas turbine-solar particle heating and energy storage system. In AIP Conference Proceedings; AIP Publishing LLC.: Melville, NY, USA, 2018; Volume 2033, p. 040013. [Google Scholar]
  15. Alaqel, S.; El-Leathy, A.; Al-Ansary, H.; Djajadiwinata, E.; Saleh, N.; Danish, S.; Saeed, R.; Alswaiyd, A.; Al-Suhaibani, Z.; Jeter, S.; et al. Experimental investigation of the performance of a shell-and-tube particle-to-air heat exchanger. Sol. Energy 2020, 204, 561–568. [Google Scholar] [CrossRef]
  16. Ho, C.K.; Carlson, M.; Albrecht, K.J.; Ma, Z.; Jeter, S.; Nguyen, C.M. Evaluation of Alternative Designs for a High Temperature Particle-to-sCO2 Heat Exchanger. J. Sol. Energy Eng. 2018, 141, 021001. [Google Scholar] [CrossRef]
  17. Saeed, R.S.; Alswaiyd, A.; Al-Ansary, H.; El-Leathy, A.; Jeter, S.; Alaqel, S.; Saleh, N.S.; Djajadiwinata, E.; Al-Suhaibani, Z.; Danish, S.; et al. Effect of the Cyclic Heating (Aging) on the Solar Absorptance and Specific Heat of Particulate Materials. In Proceedings of the 26th SolarPACES Conference, Online Event, 28 September–2 October 2020. [Google Scholar]
  18. Saeed, R.S.; Alswaiyd, A.; Saleh, N.S.; Alaqel, S.; Djajadiwinata, E.; El-Leathy, A.; Danish, S.N.; Al-Ansary, H.; Jeter, S.; Al-Suhaibani, Z.; et al. Characterization of Low-Cost Particulates Used as Energy Storage and Heat-Transfer Medium in Concentrated Solar Power Systems. Materials 2022, 15, 2946. [Google Scholar] [CrossRef] [PubMed]
  19. Saleh, N.S.; Alaqel, S.; Djajadiwinata, E.; Saeed, R.S.; Alswaiyd, A.; Al-Ansary, H.; El-Leathy, A.; Jeter, S.; Danish, S.; Al-Suhaibani, Z.; et al. An Experimental Investigation of Heat Losses during Charging the Thermal Storage Tank in a Particle-Based CSP System. In Proceedings of the 26th SolarPACES Conference, Online Event, 28 September–2 October 2020. [Google Scholar]
  20. Sarfraz, M.; Yeung, R.; Repole, K.; Golob, M.; Jeter, S.; Al-Ansary, H.; El-Leathy, A.; Alaqel, S.; Saleh, N.S.; Saeed, R. Proposed Design and Integration of 1.3 MWe Pre-Commercial Demonstration Particle Heating Receiver Based Concentrating Solar Power Plant. In Energy Sustainability; American Society of Mechanical Engineers: New York, NY, USA, 2021; Volume 84881, p. V001T02A005. [Google Scholar]
Figure 1. Over-all design of a particle-based power tower plant.
Sustainability 14 05316 g001
Figure 2. (a) Schematic diagram of the integrated gas turbine particle-based central receiver tower system; (b) a photograph of a TES bin/PWFHX assembly.
Sustainability 14 05316 g002
Figure 3. Schematic of the hybrid integrated system showing all instrumentation.
Sustainability 14 05316 g003
Figure 4. (a) TES dimensions in m and thermocouples locations inside the TES; (b) locations of the inlet and outlet TCs.
Sustainability 14 05316 g004
Figure 5. Temperatures of the circulating particles at several locations inside the particles loop and temperatures of air entering the PWFHX (PWFHX air inlet) and leaving the PWFHX (PWFHX air outlet) during an on-sun operation.
Sustainability 14 05316 g005
Figure 6. An illustration of the chimney effect originated by the falling particles when charging the empty bin.
Sustainability 14 05316 g006
Figure 7. Steady air/particle temperatures inside the TES bin (upper) partially filled bin, (lower) full bin, particle flow rate was 1.19 kg/s.
Sustainability 14 05316 g007
Figure 8. Particle loop temperature measurements during on-sun testing (upper) TES bin was partially filled and (lower) full of particles.
Sustainability 14 05316 g008
Figure 9. Temperatures of the circulating particles at several locations inside the particle loop and of air entering and leaving the PWFHX during on-sun testing.
Sustainability 14 05316 g009
Figure 10. Design of an airtight TES system for commercial use.
Sustainability 14 05316 g010
Table 1. Main properties of the particulate material used in the KSU facility.
ParticulateCARBOBEAD CP
Chemical composition75% (Al2O3), 11% (SiO2) 9% (Fe2O3), 3% (TiO2), and 2% others
Heat capacity
(kJ/kg-°C)
cp = 0.365   T 0.18 [16]
50 °C ≤ T ≤ 1100 °C
d ¯ p (mm)0.3
Agglomeration tendencyLow, small traces of soft agglomeration appeared at 1200 °C [17]
Absorptance85.25% [17]
Angle of repose29° [18]
Table 2. Charging losses for the case of circulation through the bypass line.
Case m ˙ P  
[ k g / s ]
T T E S i
  [ C ]
T T E S o  
[ C ]
Q ˙ L o s s [ kW ] m ˙ a  
[ k g / s ]
T a i [ C ] T a o  
[ C ]
Q ˙ A i r  
[ k W ]
10.52493.46466.88−14.95 ± 0.260.52543.37461.4046.61 ± 0.23
20.93486.46470.88−15.66 ± 0.390.52543.37462.5045.99 ± 0.23
31.19485.35472.53−16.49 ± 0.500.52543.39463.4245.49 ± 0.23
41.43486.52476.50−15.51 ± 0.590.52543.26467.4043.17 ± 0.23
51.57486.80477.33−16.09 ± 0.650.52543.31466.0843.94 ± 0.23
Publisher’s Note: MDPI stays neutral with regard to jurisdictional claims in published maps and institutional affiliations.

