
Emergency Road Network Determination for Seoul Metropolitan Area


1
Department of Urban Engineering, Hanbat National University, Daejeon 34158, Korea
2
Department of Safety and Disaster Prevention, Seoul Institute of Technology, Seoul 33909, Korea
*
Author to whom correspondence should be addressed.
Sustainability 2022, 14(9), 5422; https://doi.org/10.3390/su14095422
Submission received: 15 March 2022
/
Revised: 18 April 2022
/
Accepted: 27 April 2022
/
Published: 30 April 2022
(This article belongs to the Special Issue Open Innovation and Business Model for Economy Sustainability after the COVID-19 Pandemic)
Abstract
:Recently, with the increased frequency of disasters, the demand for measures to secure the golden hour after disasters has been increasing. Therefore, it is necessary to plan and select road infrastructures for effective disaster response. The purpose of this study was to determine emergency road networks for rapid rescue, paramedical activity, and resource transfer in the event of an earthquake in Seoul (including nearby areas). Decisions were made to select a suitable emergency road network in Seoul based on the collection and management of earthquake-related data, grid-based quantitative evaluation of factors regarding demands during disasters and provision of response resources, link-based importance evaluation and grouping analysis, and results of grid and link evaluations. Analysis was first conducted on 16 types of disaster demands, including building, facility, demographic, and response resource-provision data. An expert survey was conducted, and each factor was weighted and integrated into the grid structure for grid-based analysis. Roads and bridges that could play critical roles in an earthquake were selected and grouped in the road network for link-based analysis. The final emergency road network was chosen based on the quantitative and qualitative results from the second and third stages.
Keywords:
emergency road network; earthquake; grid; risk; exposure; vulnerability; degree centrality1. Introduction
The frequencies of disasters are increasing in urban areas worldwide due to recent climate change and urbanization. In particular, the number of casualties caused by major disasters is steadily increasing, with the number of deaths from natural disasters increasing as well. It is almost impossible to predict disasters and respond to them in advance; therefore, efforts to minimize damage when disasters occur while acknowledging the occurrence of disasters are necessary [1]. During the Tohoku earthquake, which occurred in 2011, the rapid input of emergency vehicles was recognized as being important for securing and delivering rescue and emergency medical services and disaster relief goods [2,3,4].
When such situations occur, the road network provides evacuation routes for rescue, provision of emergency medical services, delivery of disaster prevention goods, and manpower mobilization and plays a role in the evacuation of local residents [5,6,7,8].
Therefore, it is urgent to comprehensively establish plans to protect critical infrastructure and assets in order to respond to disasters. This includes, but is not limited to, the evaluation of infrastructure such as roads and bridges, prioritization, and monitoring. However, despite the importance of the road infrastructure in responding to disasters, there are hardly any objective criteria or methods for determining an emergency road network, making the relevant research an urgent necessity for the local governments of Korea.
This research focused on determining emergency road networks in urban areas reflecting social and economic effects and road network features. This was carried out in consideration of earthquake disasters, and of devising a technical basis to establish strategies to respond to earthquake disasters and reduce their damage in urban areas. Through this, it can be observed that devising measures that consider social and economic situations and road network characteristics is necessary to determine emergency road networks in urban areas.
This research targeted Seoul City and its regions where the population is clustered and economic activities are concentrated. Through this, it elucidated measures for determining emergency road networks for quick rescue, emergency medical services, and disaster resource movement when an earthquake occurs.
2. Emergency Road Network Determination Method
2.1. Definition of Emergency Road Network
Before presenting the emergency road network determination method, we provide definitions of the concepts (meaning, attributes, and functions) associated with emergency road networks based on relevant research and an actual operation case study of an emergency road network.
In the U.S.A., disaster routes that can be utilized to deliver rescue equipment and goods quickly to emergency medical teams in disaster sites, comprising expressways or major arterial roads, are designated in advance and managed [9]. Maintenance and repair are preferentially performed for roads designated as disaster routes in normal situations, and they cannot be used as evacuation routes when disasters occur [9]. In Canada, disaster response routes are designated and operated. The disaster response routes not only act as access routes to deliver rescue equipment and goods quickly to transferring emergency medical teams in disaster sites but also play roles in rescuing injured and isolated people [10]. In Japan, emergency routes are operated, being defined as roads to transport emergency goods and manpower smoothly and immediately after disasters occur. The emergency routes are classified into three categories according to the Disaster Prevention Base Facility hierarchy and are set to have 1–3 lanes considering major arterial road-centered connectivity between disaster prevention base facilities [11]. In Korea, diverse research has been conducted on the institutionalization and adoption of the roads used upon disaster occurrence [12]. However, the roads have not been designated or operated through institutionalization.
As described above, the countries that adopt and operate emergency road networks classify the roles of roads upon disaster occurrence, designate the roads in advance, and manage them. Specifically, the roads used to respond to disasters are classified as access routes for emergency vehicles or evacuation routes for citizens and are designated in advance and managed. This implies that efficient operation is possible only if roads required for emergency purposes are selected carefully, rather than indiscreetly choosing disaster roads connected with disaster prevention base facilities. In this research, we drew danger areas corresponding to cases of earthquakes in cities and developed an emergency road determination method to input disaster resources into the danger areas effectively. Based on foreign operation cases, the meaning, attributes, and functions of emergency road networks were defined as follows in line with the purpose of this research.
The emergency road network was defined as consisting of the roads managed and operated by Seoul City for quick transfer of disaster resources to disaster sites when a mid-sized or larger earthquake occurs. According to the earthquake record history of the target region, earthquakes of magnitude VII–IV occurred between 22 June and 25 June 1518; thus, setting earthquakes of magnitude 6.0 was judged to be valid [13].
According to Katsumoto [14], earthquake sizes and significant damage scopes can be divided into the following three categories: a significant earthquake damage radius (r) of 2–5 km in the case of earthquakes of magnitude 5.2, r = 6–13 km in the case of earthquakes of magnitude 6, and r = 40–50 km in the case of earthquakes of magnitude 7.0. Here, the significant earthquake radius, which is the damage scope, was based on a propagation ratio of 1% and more of wooden houses considering the past earthquake cases in Japan. Given that most buildings in Seoul City are reinforced concrete structures, the above values were judged to be very conservative. The interpretation scope for emergency road network designation was set by targeting parts of suburban areas, including Seoul City.
Seoul City has dimensions of 37 km (W) × 28 km (L), and damage was forecasted to be limited to certain areas when an earthquake of magnitude 6.0 occurs. When an earthquake with a 10 km damage radius and an earthquake magnitude of 2.5 occurs, such as the Yeongdeungpo earthquake in 2004, as well as an earthquake of magnitude 6.0, such as the Namhansanseong Fortress and the Chugaryeong Fault Zone in 1518, it can be observed that the earthquake damage is limited to a part of Seoul (Figure 1).
The functions and roles of emergency road networks are defined as quick rescue and emergency medical service activities in the earthquake damage areas. In countries that experience large-scale earthquakes of magnitude 7.0 and above, such as Japan, connectivity between the disaster prevention base facilities (multiple local government buildings, fire stations, medical facilities, and shelters) is important. However, in areas in which mid-sized earthquakes are expected, such as Korea, the transfer of firefighters to earthquake damage areas and the transfer of victims to medical facilities are prioritized. However, this study was conducted on the premise that the road network within the target area was not damaged by a seismic wave. In an actual disaster situation, there is a possibility that the road network may also be damaged, so additional research considering this will be necessary in the future.
2.2. Methodology
To develop the emergency road network determination method, we reviewed research cases considering attributes and functions similar to those of the emergency road network defined in this study. For instance, Do and Noh [15] suggested an emergency evacuation road determination method by assuming unspecific disasters. They proposed first- and second-phase urban emergency road selection methods based on road network connectivity (degree centrality), closeness centrality, and travel pattern analysis by assuming unspecific disasters.
Zou et al. [16] studied the evacuation routes of nuclear accidents using a mathematical model of network diagrams and evacuation optimization routes. The following factors were considered to select the optimal emergency road network: road traffic capacity and other external factors that may affect emergency evacuation were taken into account in the time weighting factor for each road.
Shahparvari and Abbasi [17] proposed a stochastic modeling approach as an evacuation decision support system to determine the vehicle, schedule, and route required under the uncertainty of the evacuation population, time window, and bushfire propagation. The proposed model also considers road availability and disruption. Greedy solution methods have been developed to cope with the complex nature of vehicle routing problems. Furthermore, the effectiveness of the proposed solution was evaluated against genetic algorithms designed on various sets of numerical examples.
Kim and Do [18] selected an emergency road network to respond to earthquakes centered on major arterial roads in Daejeon City, Korea. They took into account the factors of earthquake occurrence, exposure, vulnerability, resilience/responsiveness, reducibility, and accessibility.
Later, Mohaymany and Nikoo [19] presented an optimal model to determine large-scale disaster response route (DRR) networks to minimize damage after an earthquake. To this end, they developed a multi-purpose nonlinear probability programing model including connectivity between network origin–destinations (ODs), network vulnerability, and network length. The DRR was designed such that emergency vehicles could quickly access the traffic network within 72 h after an earthquake [19]. Nikoo et al. [20] researched road network optimization for quick evacuation of emergency vehicles when an earthquake occurs. To solve this problem, they used network vulnerability as a major performance indicator. The performance indicator took into account length, travel time, and the number of routes. To identify optimal routes for emergency vehicles, they employed three determined objective functions. Further, Edrissi et al. [21] adopted an emergency response reliability indicator to take into account resource inventories and movement time safety upon earthquake occurrence. The indicator revealed that the deaths resulting from disasters can be reduced considerably if disaster resources are secured, while emphasizing the effects on the number of deaths in cities.
The research mentioned thus far has considered the connectivity, robustness, and vulnerability of road networks in order to select emergency road networks. However, it is important to evaluate risk factor information and to classify and assess diverse information according to earthquakes when selecting emergency road networks. Here, the risk factor is the most important factor that affects the risk caused by a disaster. Risk factors directly cause all damage to the city and additionally affect other factors. Thus, social and economic factors, such as how much damage will be caused by various risk factors, how many people will be exposed to the risk factors, how vulnerable people and facilities will be to disasters, how well the response and restoration systems are equipped, and possible roles, should be taken into account in terms of evaluation factors [22].
Diverse research has also been conducted considering social and economic effects to evaluate potential risks related to disasters. For example, Crucitti and Tesfamariam [23] developed a seismic risk index assessment tool. The assessment tool uses a Bayesian belief network (BBN) that takes into account geological, engineering, economic, social, political, and cultural factors. The subjective probability of the BBN was determined by analytical hierarchy process (AHP) analysis, and a case study of 11 Canadian cities was conducted to explain the applicability of the model. Barbat et al. [24] researched a seismic vulnerability and risk assessment method considering actual seismic risks and social and economic influences in Barcelona, Spain. They suggested using physical exposure to earthquakes, social and economic influences, and the indicators related to the lack of resilience of urban areas. Zhou et al. [25] developed a new seismic disaster risk index (SDRI) model based on entropy weights to assess and compare the seismic disaster risks of cities more effectively. In the process of deriving the SDRI, if the entropy weight is defined based on information entropy theory, the authors mentioned that a more objective and scientific model can be obtained based on the SDRI model. In addition, Peduzzi et al. [26] presented a model of factors affecting human life loss due to global-level natural disasters such as droughts, floods, typhoons, and earthquakes between 1980 and 2000 as a disaster preparedness index (DRI). Further, Simpson and Katirai [27] reviewed the problems of measuring the DRI and resiliency index and presented a process constructing the indicator and index. All of these researchers defined social, cultural, economic, and engineering factors such as risk, exposure, vulnerability, and responsiveness and assessed the risk of seismic disasters.
In the present study, we developed a method of determining emergency road networks considering the seismic disaster risk index (SDRI) and network features (centrality and travel pattern) in the targeted areas. The factors used to develop the SDRI were classified as risk, exposure, vulnerability, and responsiveness. We segmented these 4 major factors into components corresponding to urban seismic disaster risks to obtain 16 detailed indicators.
To calculate the quantified weight of each detailed indicator, we performed analytical hierarchy process (AHP) analysis and attempted to obtain the comprehensive SDRIs of the target areas by applying the weight to each detailed factor. We performed the analysis by classifying the road network features of the target areas into centrality and travel pattern analysis. We used network theory-based closeness centrality and degree centrality and selected roads having outstanding accessibility in disaster situations. By performing travel pattern analysis considering the case of major bridges in the road network being blocked, we identified bridges essential for emergency road network selection. We determined an emergency road network with comprehensive consideration of the SDRI and road network feature analysis results. Figure 2 summarizes the process employed in this study.
3. Review of Relevant Theories
3.1. SDRI
To select the detailed indicators, we applied the validity, data availability and quality, quantitativeness, objectivity, understandability, and directness criteria suggested by Rossi and Gilmartin [28]. For a detailed description of the analysis indicators, see Section 4.1 and Table 1. This section describes the overall components of the SDRI.
Among the four factors, the risk factor (RI), which indicates the risk of an earthquake, and the soft soil layer () affected by the seismic vibration (), which may indicate the secondary damage in the target area, were selected as detailed factors.
Although the amount of damage caused by the seismic vibration associated with an earthquake is huge, this amount may increase depending on the ground and structure types. The detailed factors corresponding to the exposure factor () were the population (), traffic volume (), bridges (), and tunnels () exposed to the earthquake.
The specific factors related to the vulnerability factor () were the status of the seismic resistance design (), level of deterioration (), number of stories (), and disaster vulnerability ratio () of the area of interest. Lastly, the detailed factors corresponding to the responsiveness factor () were associated with emergency facility (), resource, and accessibility aspects. Considering the resource aspect, the accommodation population () of seismic shelters and number of firefighters () were selected as detailed factors. Finally, considering the accessibility aspect, bus rapid transit (BRT) routes (), where emergency evacuation is possible in emergency situations, and heavy vehicle-only roads (), were selected as detailed factors
Because the factors selected for the analysis had different units, they could not be compared by simply summing them up (Table 1). To address the differences in the factor value sizes and units, we performed standardization using Equation (1):
where is the value of detailed indicator j of unscaled factor I is the scaled value of , is the mean of indicator , is the standard deviation of indicator , with and .
To obtain the SDRI, we calculated the weight of each detailed factor via AHP analysis. Finally, the SDRI could be calculated as shown in Equations (2)–(6) by applying the standardized value and weight:
3.2. Network Analysis
An intersection in the road network is expressed as a node, and the road is expressed as a link. At a real intersection (node), signals generally exist, and the road capacity is limited. By focusing on roads with primary functions within the network and considering that adequate control does not exist upon accident occurrence, the amount of damage will increase due to secondary disasters, such as traffic congestion and secondary accidents. Accidents due to secondary disasters will spread through the linkage several times, with the destructive power to undermine the whole network system and potentially cause more damage than the primary disaster.
In this research, we performed road network analysis from a functional perspective through centrality analysis considering the link attributes prior to the determination of emergency road networks, checked the major node type distribution, and selected nodes with significant influences. For the centrality analysis, the degree centrality and closeness centrality indicators were used.
The degree centrality was used to measure how many connections the nodes have, and it indicates the number of links connected to the nodes. Unlike a binary network, in which the number of links connected to the node of interest is treated as the degree centrality, a weighted network calculates the degree centrality strength by setting the strengths indicating the relations between nodes as weights through comparison of links [29]. We regarded the number of lanes connected to one node () as the degree centrality and calculated the degree centrality () of the node of interest by setting the capacity of each lane (), indicating the link features as weights (Equation (7)):
Meanwhile, the closeness centrality () was used to assess the closeness with nodes within the road network, and it indicates how close the node of interest is to the center ([24]). Specifically, the closeness centrality shows how closely one node is connected to other nodes and was measured by using the distance () function between two nodes (Equation (8)):
Information about the road capacity and number of lanes required to calculate the centrality indicator was based on the road network attribute values for demand analysis provided by the Korea Transportation Database (KTDB).
3.3. Traffic Assignment through Simulation
If some roads in a route are blocked due to a disaster, drivers on the existing O/D select new routes. Specifically, if the road affected by a disaster is a link with many connections within the network, movability and accessibility sharply decrease, which negatively affects the entire network.
If a link is lost or blocked within the network due to a disaster, a more important link is chosen by assessing the damage amount of the blocked road affecting the entire road network in the emergency road network selection process by examining the travel patterns of drivers and travel time changes due the changes in the traffic system, and by estimating social costs. To this end, we performed analysis using TransCAD S/W [30]. The traffic assignment was based on the user equilibrium model.
4. Emergency Road Network Determination
4.1. Quantitative Evaluation Based on SDRI
To determine the emergency road network, we selected major factors and considered the social and economic effects of earthquakes. We also systematically chose indicators suitable for the four major factors of risk, exposure, vulnerability, and responsiveness (Table 1).
First, in this study, soft soil layer and seismic vibration were selected as detailed factors for evaluating risk factors. Using the survey results of about 11,518 sites in the studied area, the soft soil layer indicators were classified into three grades of hard (less than 0.2), normal (0.2 to 0.6), and soft (more than 0.6) soil based on the predominant period of the soil layer. In addition, the seismic vibration indicators used the previous research results calculated in consideration of the earthquake reproduction cycle and the earthquake zone coefficient [31]. In the previous study, the earthquake return period was selected as an index for the distribution of acceleration at 100, 500, and 1000 years of the earthquake return period suggested by Korea’s earthquake resistance design standards and the ratio of vulnerable ground to earthquakes. Seismic zone factors were presented in the seismic-resistant design research standards published in 1999 and are currently widely applied to road bridge design standards. As a result of the analysis, seismic vibration factors were found to be high in the order of Yeongdeungpo-gu, Songpa-gu, Mapo-gu, and Gwangjin-gu. In this study, the existing research results calculated for each district were applied on the grid, and these were classified into five grades. Please refer to the existing research results for the detailed analysis results of the index [31]. For the seismic vibration indicator, we used existing research results selected by each autonomous county in Seoul considering the seismic return period and seismic district coefficient.
The exposure factor reflects the exposure degree of the population, road facilities (bridges and underground roadways), and road traffic to earthquakes. The exposure corresponds to the size of a city, and thus the population, road facilities, and traffic volume were set as indicators to analyze the exposure. The population is a key indicator among seismic risk factors. The population data provided by Seoul City were used to set the population indicator of exposure. Since the statistical data are provided in units of administrative districts, the data provided in units of 436 administrative districts were reflected on the grid. Then, gradation was performed by dividing the data into five grades. If there is a lot of traffic on the road network when a seismic disaster occurs, traffic may be exposed to damage caused by the seismic disaster. Therefore, in this study, the traffic volume of the road network was calculated using the traffic volume survey data of 135 points surveyed by the Seoul Metropolitan Government. Traffic volume data were classified into five grades after reflecting traffic volume data on the road network passing through the grid. Road facility factors may increase damage caused by a seismic disaster if road facilities are installed at the relevant points. Therefore, in this study, road facilities were divided into ground and underground facilities and classified into two grades according to whether facilities on the grid were installed.
The vulnerability factors in this research were the degree of resistance of buildings against earthquakes and the disaster vulnerability ratio. Analysis was performed considering the status of the seismic resistance design of disaster-vulnerable buildings with evacuation capabilities lower than the general number of people, number of building floors, and building age. According to statistics provided by the Seoul Metropolitan Government, there were about 616,134 buildings in Seoul. First, in order to perform the grading of the seismic-resistant design index of the buildings, the seismic-resistant design of the buildings was analyzed. As a result of the analysis, it was found that the seismic-resistant design was not reflected (or unidentified) in 520,000 buildings, which account for about 84% of the 616,134 buildings. In this study, it was judged that the vulnerability of the area was high if the seismic-resistant design was not considered in the building. Therefore, grading was performed by dividing the number of buildings that did not consider the seismic-resistant design that existed within the range of the grid into five grades. The higher the common age of buildings, the more vulnerable they are to seismic waves. Therefore, after calculating the average number of service years of buildings existing within the range of the corresponding grid, classification was performed by dividing them into five grades. The average number of stories of buildings was found to be 3.28 stories, relatively vulnerable to earthquakes. Therefore, after calculating the average number of floors of buildings existing within the range of the corresponding grid, classification was performed by dividing them into five grades. It can be seen that the higher the ratio of the disaster vulnerability, the greater the vulnerability in the event of a seismic disaster. Therefore, data on the population of the vulnerable (children, elderly, etc.) and the population of the vulnerable (children, elderly, etc.) by administrative dong in Seoul were acquired in order to perform the grading of the factors of the disaster vulnerability. The ratio of the disaster vulnerability calculated for each administrative dong was applied to the grid, and the rating was performed by dividing it into five grades.
The responsiveness factor reflects the abilities to respond to and perform restoration following disasters in the area of interest. We considered hospitals, firefighting facilities, the arrival time of disaster resources, the number of people accommodated in shelters, BRT routes, and heavy vehicle routes as items to evaluate responsiveness, including the provision of rescue and emergency medical services, upon disaster occurrence.
First, service area analysis was performed to calculate the arrival time of fire resources. Using the service area analysis function of ArcGIS S/W, the arrival time from the fire station and the emergency medical institution in the target area was calculated. As a result of the analysis, it was found that most of the services were within 5 min, some parts of downtown Seoul were more than 10 min, and the outskirts of Seoul were more than 10 min. Therefore, the arrival area was divided into three grades for each service area, and gradation was performed by reflecting this on the grid. The factors for the shelter accommodation available were graded based on whether the total shelter capacity of the district was exceeded. If the number of firefighters in the area is sufficient, a disaster response can be made relatively quickly. Therefore, in order to calculate the number of firefighters, the number of firefighters per 10,000 population in the district was calculated and applied to the grid.
The following is a description of the accessibility factor. The existing bus-only lanes (about 400 km) and heavy vehicle routes (about 860 km) are equipped with infrastructure to help operate emergency vehicles in the event of a seismic disaster. If an emergency road network is established around the routes, it is believed that a response in the event of a seismic disaster will be made quickly. Therefore, this was reflected on the grid by dividing the corresponding routes into those applied and those not applied on the road network.
We analyzed 16 basic factors for emergency road network determination and performed grading for the detailed risk, exposure, vulnerability, and responsiveness. Simultaneously, we reconstructed a 300 m × 300 m grid for Seoul City to draw the SDRI in a certain area (m2). Following reconstruction, we used the areas corresponding to 7079 grids as the analysis target area in this research. The reason that we constructed a 300 m × 300 mis that the mean link length in the Seoul traffic network database (DB) is 300 m. This was judged to be suitable considering the connection with the network analysis results, which is the next step.
The sources of the major data used for the analysis were Seoul City, Statistics Korea, the Statistical Geographic Information Service, and the Ministry of Environment Environmental Geographic Information Service, and all data were from 2019. The data used for the grid-based analysis were employed for geocoding by utilizing Arc GIS S/W. All data were tallied based on the 300 m × 300 m grid that was finally obtained.
To obtain the indicator weights corresponding to the selected factors in this research, we performed AHP analysis. We conducted a questionnaire survey targeting 33 experts and police offices with experience in research in the field. We calculated the relative weights between factors through pairwise comparison using a nine-point scale and finally obtained a comprehensive weight for each indicator. We verified whether the evaluation items evaluated by the respondents were logical and consistent using Equations (9) and (10) [32,33,34]. As a result of verification, we judged that the evaluation items were rational only if the consistency ratio (CR) was 10% or less [35]:
where is the principal eigenvalue of the judgement matrix and is its order.
where is the random (consistency) index for matrices of order .
Among the 33 participants in the questionnaire survey, we calculated the weight between factors using the results of 26 respondents who responded rationally. Finally, we calculated the weight by factor for emergency road network determination, as shown in Table 2. First, as a result of analyzing the factors of Level 1, it was found that risk (0.29), vulnerability (0.26), responsive (0.26), and exposure (0.24) were considered important in that order. Next, the relative importance of Level 2 factors corresponding to Level 1 factors was examined. Looking at the importance priority of Level 1 factors, first, seismic vibration (0.59) and soft soil layer (0.41) were shown in that order in the risk factors. In terms of the vulnerability factors, population (0.35), road infrastructure (0.34), and traffic (0.31) appeared in that order. In the response factors, disaster vulnerability (0.60) and building type (0.40) appeared in that order. Finally, the exposure factors appeared in the order of accessibility (0.39), resources (0.33), and emergency facilities (0.28).
Finally, the experts recognized the risk as the most important factor in selecting emergency roads. They actually recognized the importance in the order of vulnerability, responsiveness, and exposure. The meanings of the calculated factors are as follows. A higher risk score indicates a higher earthquake occurrence probability and greater exposure to the earthquake. A higher vulnerability score indicates increased earthquake vulnerability. Comprehensively, as the disaster demand score increases, the disaster risk increases. A higher responsiveness score indicates greater responsiveness to an earthquake. As the responsiveness score increases, there is greater resilience.
To classify the SDRI selected considering the four factor features into five grades, we applied natural breaks. The natural breaks (Jenks) method involves classifying the points that can be naturally classified based on the frequency distribution graph of the data. Grouping is conducted by maximizing the homogeneity within the group and heterogeneity between groups. There is an advantage that the boundary of the optimal grade section can be set depending on the number of desired grades by minimizing the sum of the squared deviations from the natural breaks (Jenks) average of ratings [36].
The SDRI by grid on major factors was classified into five steps from very low (grade 1) to very high (grade 5), and Figure 3 shows the results. The risk is high around the Han River, Songpa, Seongdong, Gyeongheung, and Geumcheon. Exposure is high in Mapo, Yeongdeungpo, Seocho, Gangnam, Songpa, and the suburban area. Vulnerability is low throughout Seoul, and responsiveness is high, except in some suburban areas of Seoul.
The SDRI was drawn by integrating all 16 factors. In the area in which the grid color is dark, the disaster demand is high and response resources are strongly demanded. Emergency roads should be built centered on the dark grid area. Among the 7079 grids, 811 (11.5%) grids correspond to grade 5 (very high). The corresponding grid region of interest has a high disaster demand and the supply of response resources is relatively high. The regions of interest were around the Han River, Eunpyeong, Gangseo, Mapo, Guro, Geumcheon, Seocho, and Songpa.
4.2. Network Analysis
Many underground structures, including tunnels and underpasses, also exist. Because it is not desirable to use all roads (including road facilities such as bridges and tunnels) when responding to earthquakes, it is rational to evaluate the importance of roads methodically and to determine how many roads are needed as emergency roads. This section presents an analysis of road importance through network theory-based analysis. We employed the degree centrality and closeness centrality indicators, which are widely used in network analysis. In this way, we examined the distributions of major nodes in the network and nodes with great influences.
We used the traffic theme map GIS data of KTDB as the basic network data for the analysis. We selected the points at which roads intersected or road attributes changed as nodes and constructed data links according to road type.
According to the node closeness, the structural features of the network can be identified. Because the node with the highest closeness centrality has the shortest linkage distances (time) to all other nodes within the network, it can be used as baseline data for selecting locations of major disaster prevention base facilities such as fire stations, medical institutions, and shelters.
We identified the structural features of the network depending on the degree centrality distribution and closeness to nodes within the network and analyzed the influences of these factors. Larger values indicate sections with huge functional roles in major traffic network selection. That is, road sections having many alternative routes, numerous close nodes, many lanes, and large capacities have higher priorities in the emergency road network selection process.
As the road along which those nodes are located has a large traffic volume with maximum accommodation capabilities, the traffic volume can be distributed to the surrounding regions through rescue, making the functional role of the road highly important in emergency road network selection. Figure 4 shows the degree centrality values, where the indicator values of the nodes located along the major arterial roads in Seoul are large.
4.3. Travel Pattern and Travel Time Changes Due to Bridge Blocking
The passenger O/D travel volume data provided by the KTDB and the network between regions nationwide were used as basic data to analyze the travel patterns of the traffic volume in Seoul. The data from 2018 were used, as this year is the most recent year whose data are typically employed for travel pattern prediction. The O/D in 2018 was estimated using the O/Ds in 2017 and 2020 through interpolation, and Trans CAD S/W, which is software for predicting traffic demands to assess traffic travel patterns, was employed.
We performed pre-calibration of the road network in Seoul City to enhance the reliability of the results before conducting the full travel pattern analysis. We utilized this process to minimize the traffic volume difference (error rate) of the traffic volume predicted in the road network for interpretational traffic volume and travel pattern analysis of actual roads. We performed analysis with an error rate of less than 30% by comparing the observed and forecasted traffic volumes via calibration. We selected 52 calibration target points: 43 points centered on the Han River Bridge and 9 points on the beltway around Seoul.
According to the traffic pattern analysis in the case in which all bridges in the target region were blocked, extreme traffic congestion was caused on most roads, to the extent that emergency road determination was impossible. When an earthquake with a magnitude of less than 6.0 occurs, blockage of all bridges on the Han River may make the initial response difficult by causing paralysis of the road network.
Given that all bridges on the Han River have seismic-resistant designs, it is necessary to select some bridges to play key roles and include them in the emergency road network. By comprehensively considering the grid-based analysis results and road/traffic factors, we selected bridges on the Han River required for emergency road operations.
The aspects considered were the SDRI grade, linkage with BRT routes, number of lanes both ways, design speed, design capacity, and traffic volume data (Table 3). Figure 5 shows the 10 selected bridges (Nos. 2, 4, 5, 7, 9, 12, 15, 17, 20, and 23). Usage of a road as an emergency road in this research does not mean that the travel of general vehicles is blocked. As traffic congestion is predicted to be lower than the simulation results, we judged the selection of the above 10 bridges to be reasonable.
To examine the travel pattern and travel time changes due to bridge blocking, we analyzed three scenarios: the current situation (scenario 1), a case in which 23 bridges crossing the Han River were blocked (scenario 2), and a case in which 13 bridges of the 23 bridges were blocked (scenario 3). The cumulative travel time in scenario 2 was 20,021 h, representing a four-fold increase compared to that in scenario 1, and the traffic volume was concentrated in the suburban area of Seoul City(Figure 6).
Meanwhile, the cumulative travel time in scenario 3 was 5571 h, and the traffic volume was concentrated on 10 bridges. However, this travel time was only 110% of the normal time, so no extreme traffic jam was caused in Seoul City. Therefore, it is reasonable to select an emergency road network including the 10 bridges selected in Table 3.
4.4. Emergency Road Network Determination
We designed the emergency road network considering the results of the SDRI-based quantitative analysis, road network-based analysis, and qualitative decision-making process and focused on the following aspects. First, emergency evacuation for the area in which major damage occurs around the epicenter in part or all of Seoul should be possible using the emergency road network. Second, the existing traffic network in Seoul should be utilized maximally to minimize the traffic flow disturbance of general vehicles and enable emergency vehicles to carry out evacuation. Third, the disaster demand and response resource supplies should be considered in an integrated manner.
Lastly, there is a possibility of causing a serious adverse effect on the whole road network due to the determination of the first lane as a rescue/emergency medical service vehicle-only road. Therefore, we determined routes playing pivotal roles in the road network, such as BRT routes, major arterial roads, and expressways, except for secondary arterial roads with fewer than three lanes in each direction.
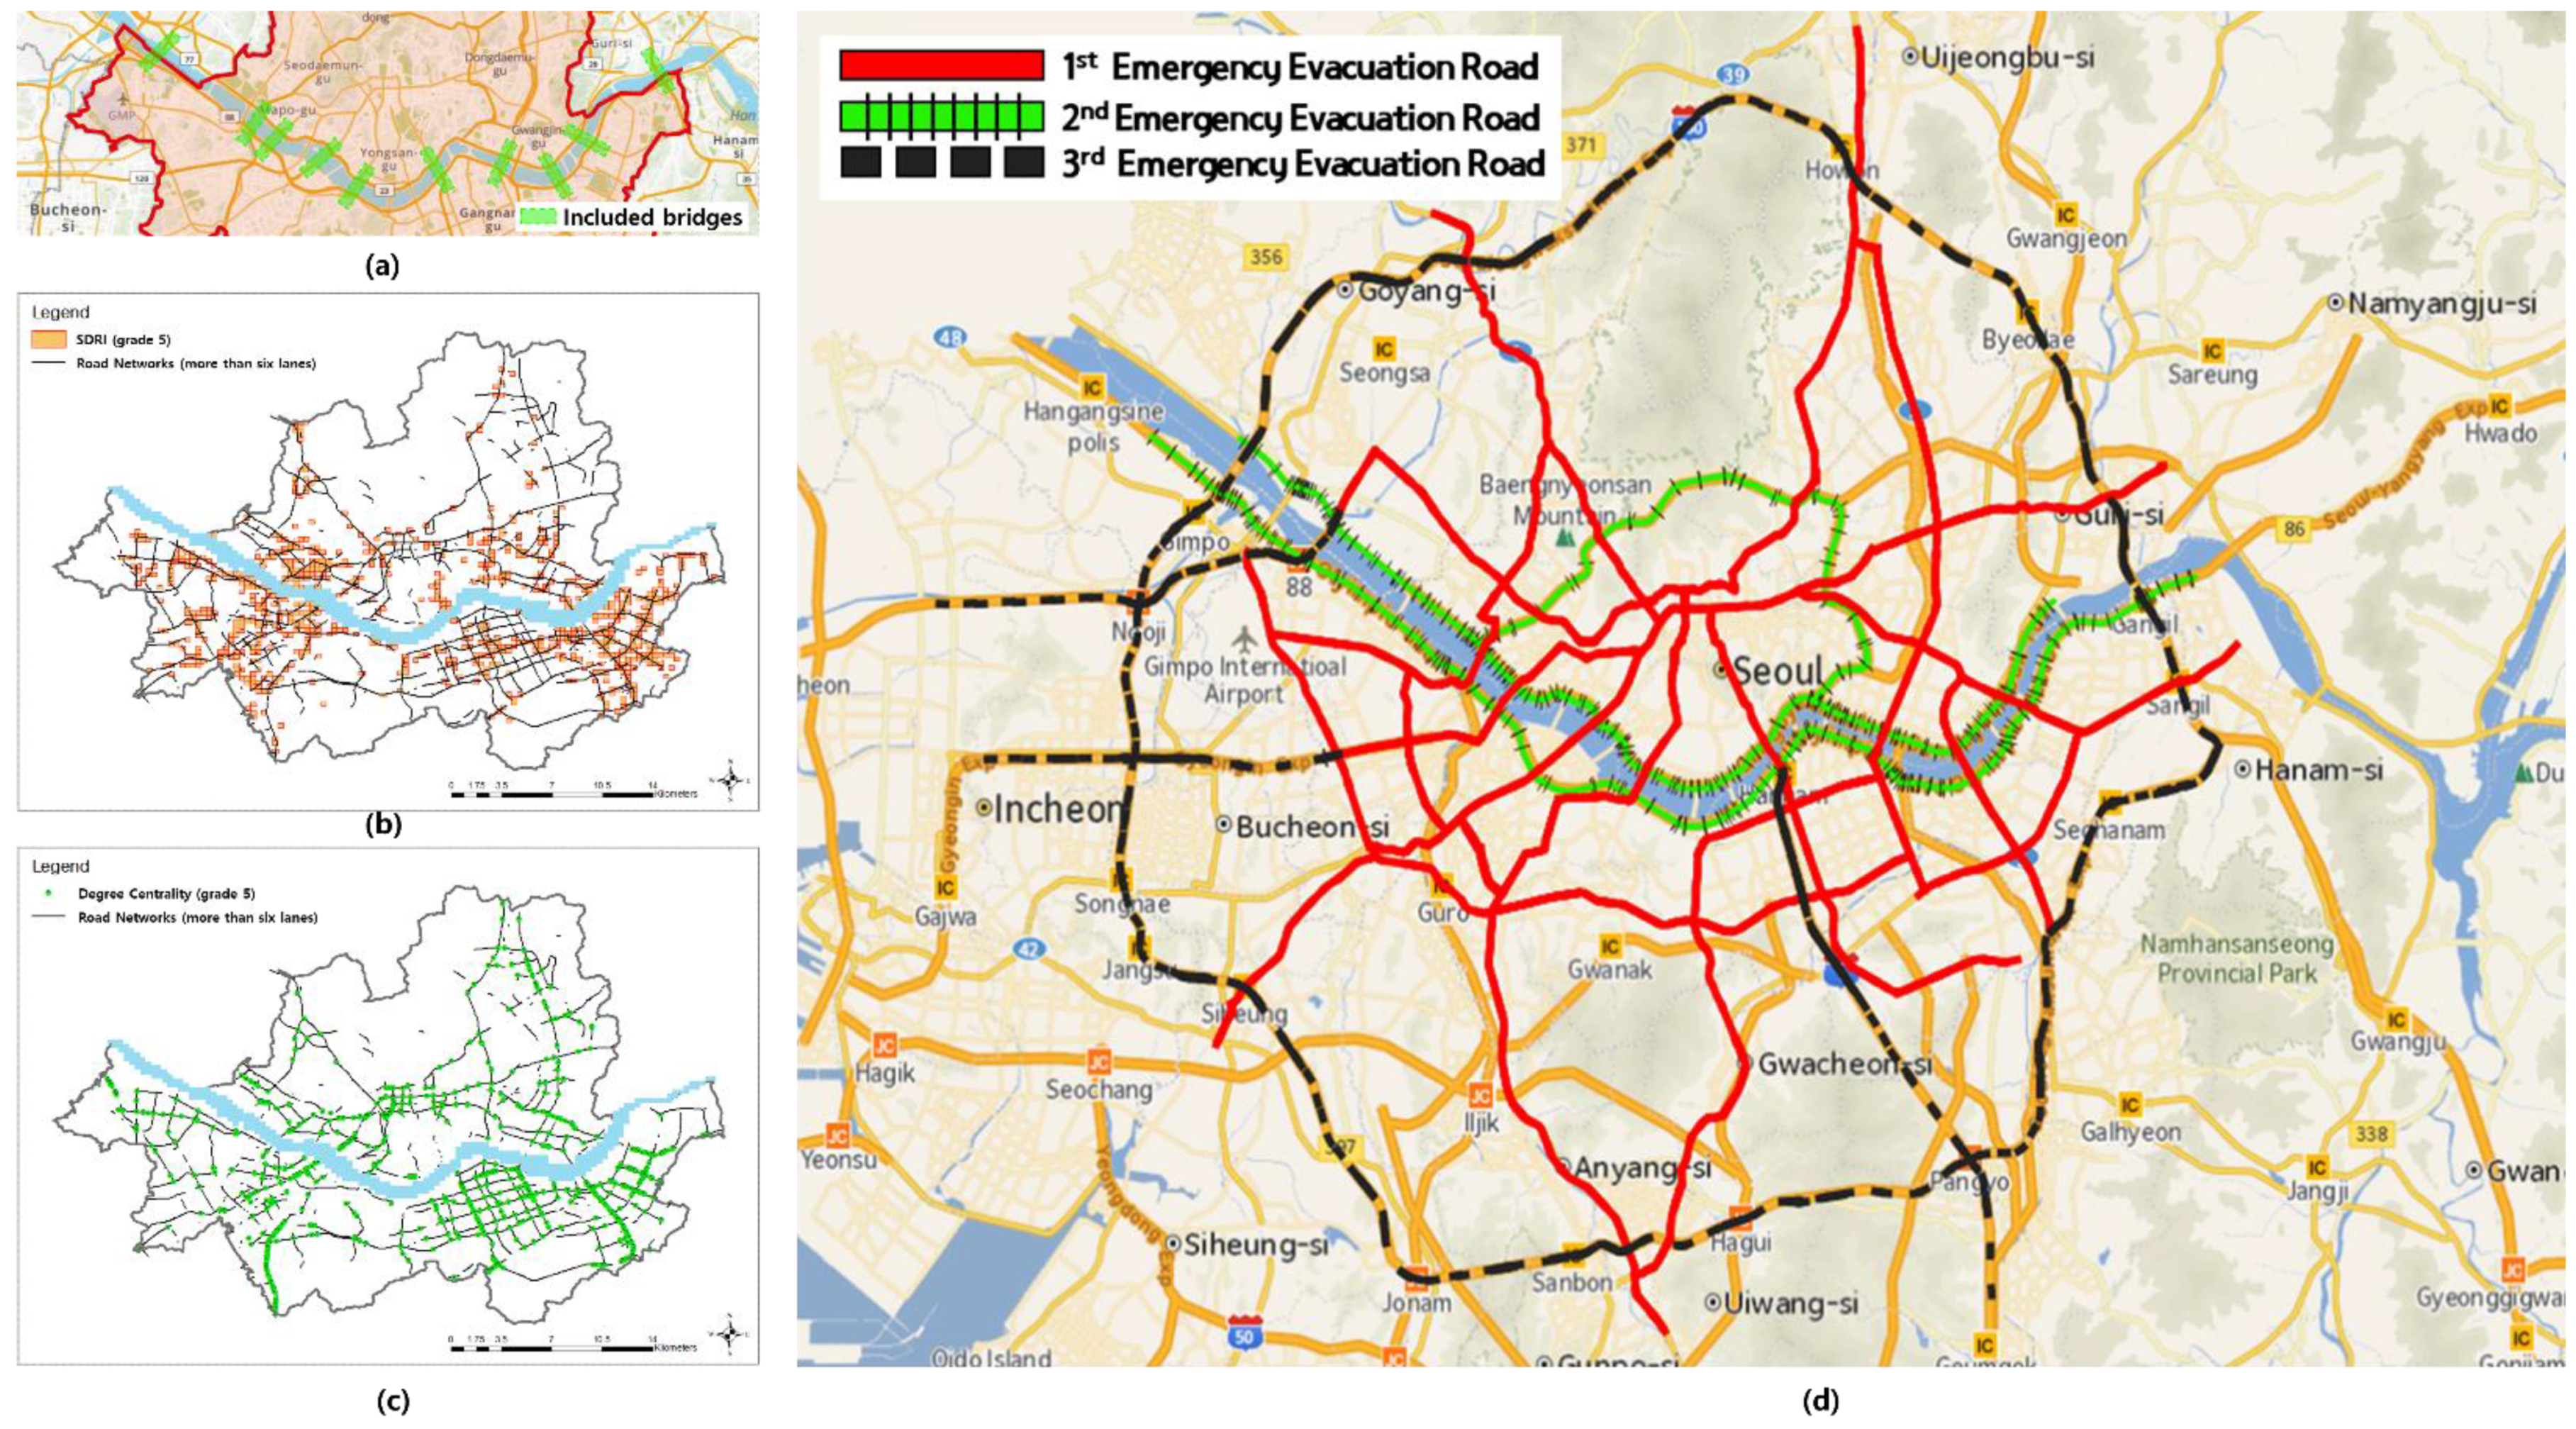
The following aspects were considered in the determined emergency road network along with the abovementioned emergency road network determination factors: ① connectivity of the blocked sections between BRT routes, ② connectivity to beltways, ③ connectivity with the SDRI corresponding to grade 5 (Figure 7b), ④ connectivity with the closeness centrality indicator corresponding to grade 5 (Figure 7c), and ⑤ ease of ripple effect according to bridge blocking. In the qualitative decision-making process for the final emergency road network selection, we deleted some routes along which emergency roads were clustered in the same area and added some routes where linkage was necessary. In this way, we determined the final emergency road network.
Figure 7d shows the final emergency road network. The first-phase emergency road network is centered on major arterial roads, including BRT routes. The second-phase emergency road network is centered on Seoul Naebu Expressway, Gangbyeon Expressway, and Olympic Expressway. The third-phase emergency road network is centered on Seoul Ring Expressway and some connection roads. The third-phase network is not managed by Seoul City but rather was determined considering connectivity to the first- and second-phase emergency road networks and outside regions.
5. Conclusions and Future Research
We clearly defined the concept of an emergency road network, including its meaning, attributes, and functions, in this research. Specifically, we defined an emergency road as a road managed and operated by Seoul City for the quick transfer of disaster resources to disaster sites when a 5.0–6.0-magnitude earthquake occurs.
We set the target areas for emergency road network design as Seoul City and the surrounding regions and set the target roads as BRT routes, expressways, urban highways, major arterial roads, and secondary arterial roads. We designed the emergency road network in this research to minimize the traffic flow disturbance of general vehicles using the BRT routes as much as possible from a transportation functional perspective.
We collected and analyzed data corresponding to 16 disaster demand factors (risk, exposure, and vulnerability) including information about buildings, facilities, and the population as well as response resources (responsiveness). We determined the weights (importance) of these factors based on the SDRI of disaster demand and response resource supply factors and created an integrated grid. As a result of the weights (importance) of these factors obtained through AHP analysis, experts recognized responsiveness as the most important factor in selecting emergency roads. By evaluating and grouping roads (links) considering travel patterns, we selected roads and bridges that will play key roles when an earthquake occurs. Given that bridges along the Han River are designed to have seismic resistance, 10 Han River bridges on which emergency road operation is required were identified by comprehensively considering the grid-based analysis results and road/traffic factors. We presented a final emergency road network plan based on the quantitative results mentioned above to determine an emergency road network and the qualitative decision-making process. As existing studies focused on designating the national emergency road network, this study is judged to make a great contribution in that it proposes a methodology for designating the emergency road network by local governments. In order for the local government to use it in the future, legislation for the designation of emergency road networks should be preempted. In addition, it is deemed necessary to install operating facilities and develop operating manuals for emergency road networks for efficient operation and management of emergency road networks.
However, this research has some limitations, which are as follows. First, the target scope was set to be Seoul and the surrounding regions. It is essential to consider connectivity to adjacent cities and counties if the connectivity and extendibility of the future emergency road network are considered, because Seoul City is very close to Gyeonggi-do. Consequently, additional analysis is necessary considering the data and road network in Gyeonggi, which is close to Seoul. Further, seismic damage situations were not diversely considered. Additional review of seismic occurrence locations, earthquake strengths, and damage of city facilities is needed. Follow-up research considering diverse scenarios in terms of earthquake size, occurrence location, and damage of road facilities is also necessary. In addition, another limitation is that this study was conducted on the premise that the road network was not damaged during an earthquake. Therefore, in future studies, research on the establishment of alternative roads, while taking into consideration damage to the road network, is necessary.
Finally, realistic seismic damage must be presented through the development of a seismic damage prediction system operated by advanced seismic prevention countries and cities for more realistic analysis.
Author Contributions
Conceptualization, M.D., J.C. and S.C.; methodology, M.D.; software, S.C.; validation, S.C.; formal analysis, M.D.; investigation, S.C.; resources, J.C.; data curation, S.C. and J.C.; writing—original draft preparation, S.C.; writing—review and editing, M.D.; visualization, S.C.; supervision, M.D.; project administration, M.D. All authors have read and agreed to the published version of the manuscript.
Funding
This research received no external funding.
Institutional Review Board Statement
Not applicable.
Informed Consent Statement
Not applicable.
Data Availability Statement
Not applicable.
Acknowledgments
The views and opinions expressed in this article are those of the individual authors.
Conflicts of Interest
The authors declare no conflict of interest.
References
- Alsnih, R.; Stopher, P.R. Review of procedures associated with devising emergency evacuation plans. Transp. Res. Rec. 2004, 1865, 89–97. [Google Scholar] [CrossRef] [Green Version]
- Lee, J. Study on the Disaster Prevention Road Network System through the Japan Case. Int. J. Highw. Eng. 2013, 15, 5–8. [Google Scholar]
- Mimura, N.; Yasuhara, K.; Kawagoe, S.; Yokoki, H.; Kazama, S. Damage from the Great East Japan Earthquake and Tsunami—A quick report. Mitig. Adapt. Strateg. Glob. Chang. 2011, 16, 803–818. [Google Scholar] [CrossRef] [Green Version]
- Norio, O.; Ye, T.; Kajitani, Y.; Shi, P.; Tatano, H. The 2011 eastern Japan great earthquake disaster: Overview and comments. Int. J. Disaster Risk Sci. 2011, 2, 34–42. [Google Scholar] [CrossRef] [Green Version]
- E Costa, C.A.B.; Oliveira, C.S.; Vieira, V. Prioritization of bridges and tunnels in earthquake risk mitigation using multicriteria decision analysis: Application to Lisbon. Omega 2008, 36, 442–450. [Google Scholar]
- Yücel, E.; Salman, F.S.; Arsik, I. Improving post-disaster road network accessibility by strengthening links against failures. Eur. J. Oper. Res. 2018, 269, 406–422. [Google Scholar] [CrossRef]
- Do, M.; Jung, H. Enhancing road network resilience by considering the performance loss and asset value. Sustainability 2018, 10, 4188. [Google Scholar] [CrossRef] [Green Version]
- Liu, H.; Chen, H.; Hong, R.; Liu, H.; You, W. Mapping knowledge structure and research trends of emergency evacuation studies. Saf. Sci. 2020, 121, 348–361. [Google Scholar] [CrossRef]
- Matherly, D.; Langdon, N.; Wolshon, B.; Murray-Tuite, P.; Renne, J.; Thomas, R.; Reinhardt, K. A Guide to Regional Transportation Planning for Disasters, Emergencies and Significant Events; Transportation Research Board: Washington, DC, USA, 2014. [Google Scholar]
- British Columbia. Disaster Response Transportation Planning Guide for Road Transportation. 2018. Available online: https://www2.gov.bc.ca/gov/content/transportation/transportation-infrastructure/engineering-standards-guidelines/traffic-engineering-safety/disaster-response-transporation (accessed on 6 March 2021).
- MLIT (Ministry of Land, Infrastructure, Transport and Tourism). MLIT Work Plan. 2007. Available online: http://www.bousai.go.jp/kaigirep/chuobou/20/pdf/kokudo.pdf (accessed on 6 March 2021). (In Japanese).
- Chung, Y.; Lee, J.; Lee, H.; Ahn, H.; Park, T. A Preliminary Study on Selection Criteria of Disaster Operation Routes Considering Disaster Types and Roadway Characteristics; The Korea Transport Institute: Sejong, Korea, 2015; pp. 1–208. [Google Scholar]
- Meteorological Agency. History of earthquakes on the Korean Peninsula; Meteorological Agency: Seoul, Korea, 2019. (In Korean) [Google Scholar]
- Kastumoto, M. Seismic intensity IV range, seismic magnitude, and seismic intensity and acceleration correspondence. Q. J. Seismol. 1971, 36, 89–96. (In Japaneses) [Google Scholar]
- Do, M.; Noh, Y. Comparative analysis of informational evacuation guidance by lane-based routing. Int. J. Urban Sci. 2016, 20, 60–76. [Google Scholar] [CrossRef]
- Zou, Y.; Zou, S.; Niu, C. The optimization of emergency evacuation from nuclear accidents in China. Sustainability 2018, 10, 2737. [Google Scholar] [CrossRef] [Green Version]
- Shahparvari, S.; Abbasi, B. Robust stochastic vehicle routing and scheduling for bushfire emergency evacuation: An Australian case study. Transp. Res. Part A Policy Pract. 2017, 104, 32–49. [Google Scholar] [CrossRef]
- Kim, J.; Do., M. Risk and Resiliency Analysis for Selecting Emergency Road Network in the Event of a Disaster. Int. J. Highw. Eng. 2019, 21, 149–159. (In Korean) [Google Scholar] [CrossRef]
- Mohaymany, A.S.; Nikoo, N. Designing Large-Scale Disaster Response Routes Network in Mitigating Earthquake Risk Using a Multi-Objective Stochastic Approach. KSCE J. Civ. Eng. 2020, 24, 3050–3063. [Google Scholar] [CrossRef]
- Nikoo, N.; Babaei, M.; Mohaymany, A.S. Emergency transportation network design problem: Identification and evaluation of disaster response routes. Int. J. Disaster Risk Reduct. 2018, 27, 7–20. [Google Scholar] [CrossRef]
- Edrissi, A.; Nourinejad, M.; Roorda, M.J. Transportation network reliability in emergency response. Transp. Res. Part E Logist. Transp. Rev. 2015, 80, 56–73. [Google Scholar] [CrossRef]
- Yoon, D.K.; Kang, J.E.; Brody, S.D. A measurement of community disaster resilience in Korea. J. Environ. Plan. Manag. 2016, 59, 436–460. [Google Scholar] [CrossRef]
- Crucitti, G.; Tesfamariam, S. Earthquake disaster risk index for Canadian cities using Bayesian belief networks. Georisk Assess. Manag. Risk Eng. Syst. Geohazards 2012, 6, 128–140. [Google Scholar]
- Barbat, A.H.; Carreño, M.L.; Pujades, L.G.; Lantada, N.; Cardona, O.D.; Marulanda, M.C. Seismic vulnerability and risk evaluation methods for urban areas. A review with application to a pilot area. Struct. Infrastruct. Eng. 2010, 6, 17–38. [Google Scholar] [CrossRef]
- Zhou, L.; Wang, W.; Ma, R. Application of method of entropy proportion to urban earthquake disaster risk index. J. Earthq. Eng. Eng. Vib. 2010, 30, 93–97. [Google Scholar]
- Peduzzi, P.; Dao, H.; Herold, C.; Mouton, F. Assessing global exposure and vulnerability towards natural hazards: The Disaster Risk Index. Nat. Hazards Earth Syst. Sci. 2009, 9, 1149–1159. [Google Scholar] [CrossRef]
- Simpson, D.M.; Katirai, M. Indicator Issues and Proposed Framework for a Disaster Preparedness Index (DPi); University of Louisville: Louisville, KY, USA, 2006; pp. 1–47. [Google Scholar]
- Rossi, R.J.; Gilmartin, K.J. Social indicators of youth development and educational performance: A programmatic statement. Soc. Indic. Res. 1980, 7, 157–191. [Google Scholar] [CrossRef]
- Crucitti, P.; Latora, V.; Porta, S. Centrality in networks of urban streets. Chaos Interdiscip. J. Nonlinear Sci. 2006, 16, 015113. [Google Scholar] [CrossRef] [PubMed]
- Caliper Corporation. TransCAD, version 6.0r2; User’s Guide; Caliper Corporation: Newton, MA, USA, 2012. [Google Scholar]
- Park, J. An Assessment of Seismic Disaster Risk for the Seoul Metropolitan City. Master Thesis, University of Seoul, Seoul, Korea, 2012. (In Korean). [Google Scholar]
- Misran, M.F.R.; Roslin, E.N.; Mohd Nur, N. AHP-consensus judgement on transitional decision-making: With a discussion on the relation towards open innovation. J. Open Innov. Technol. Mark. Complex. 2020, 6, 63. [Google Scholar] [CrossRef]
- Park, J.; Kim, E.; Shin, K. Developing an evaluation framework for selecting optimal medical devices. J. Open Innov. Technol. Mark. Complex. 2019, 5, 64. [Google Scholar] [CrossRef] [Green Version]
- Aguarón, J.; Moreno-Jiménez, J.M. The geometric consistency index: Approximated thresholds. Eur. J. Oper. Res. 2003, 147, 137–145. [Google Scholar] [CrossRef]
- Raharjo, H.; Endah, D. Evaluating relationship of consistency ratio and number of alternatives on rank reversal in the AHP. Qual. Eng. 2006, 18, 39–46. [Google Scholar] [CrossRef]
- Chen, J.; Yang, S.; Li, H.; Zhang, B.; Lv, J. Research on geographical environment unit division based on the method of natural breaks (Jenks). Int. Arch. Photogramm. Remote Sens. Spat. Inf. Sci. 2013, 3, 47–50. [Google Scholar] [CrossRef] [Green Version]
Figure 1.
Target area.

Figure 2.
Flow of the present study.

Figure 3.
Results of grid analysis of the (a) risk, (b) exposure, (c) vulnerability, (d) responsiveness, and (e) total scores.
Figure 3.
Results of grid analysis of the (a) risk, (b) exposure, (c) vulnerability, (d) responsiveness, and (e) total scores.
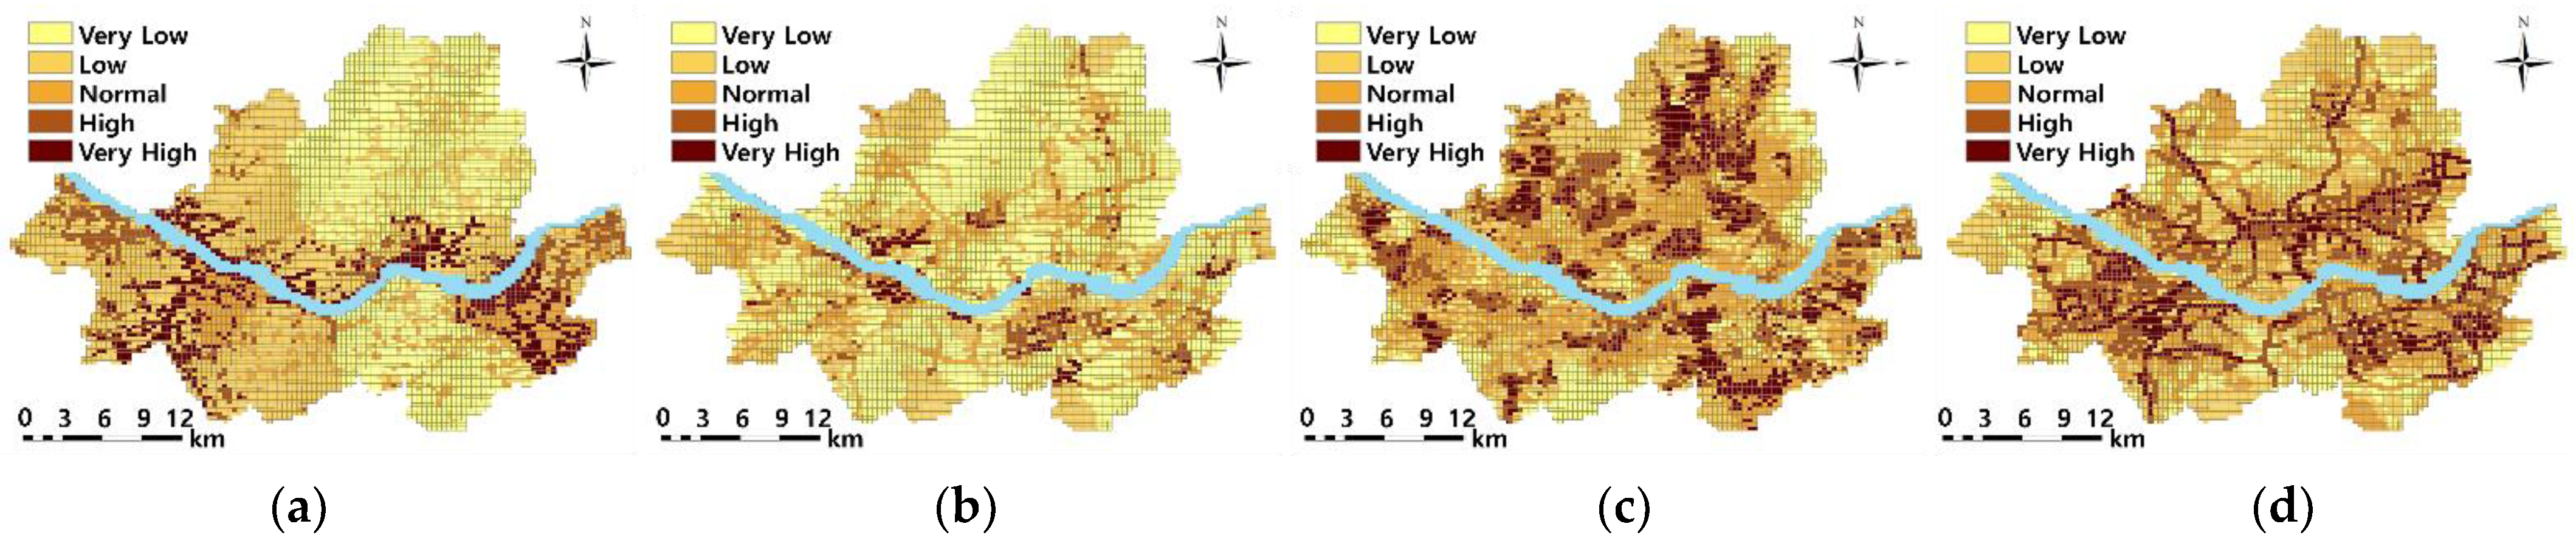
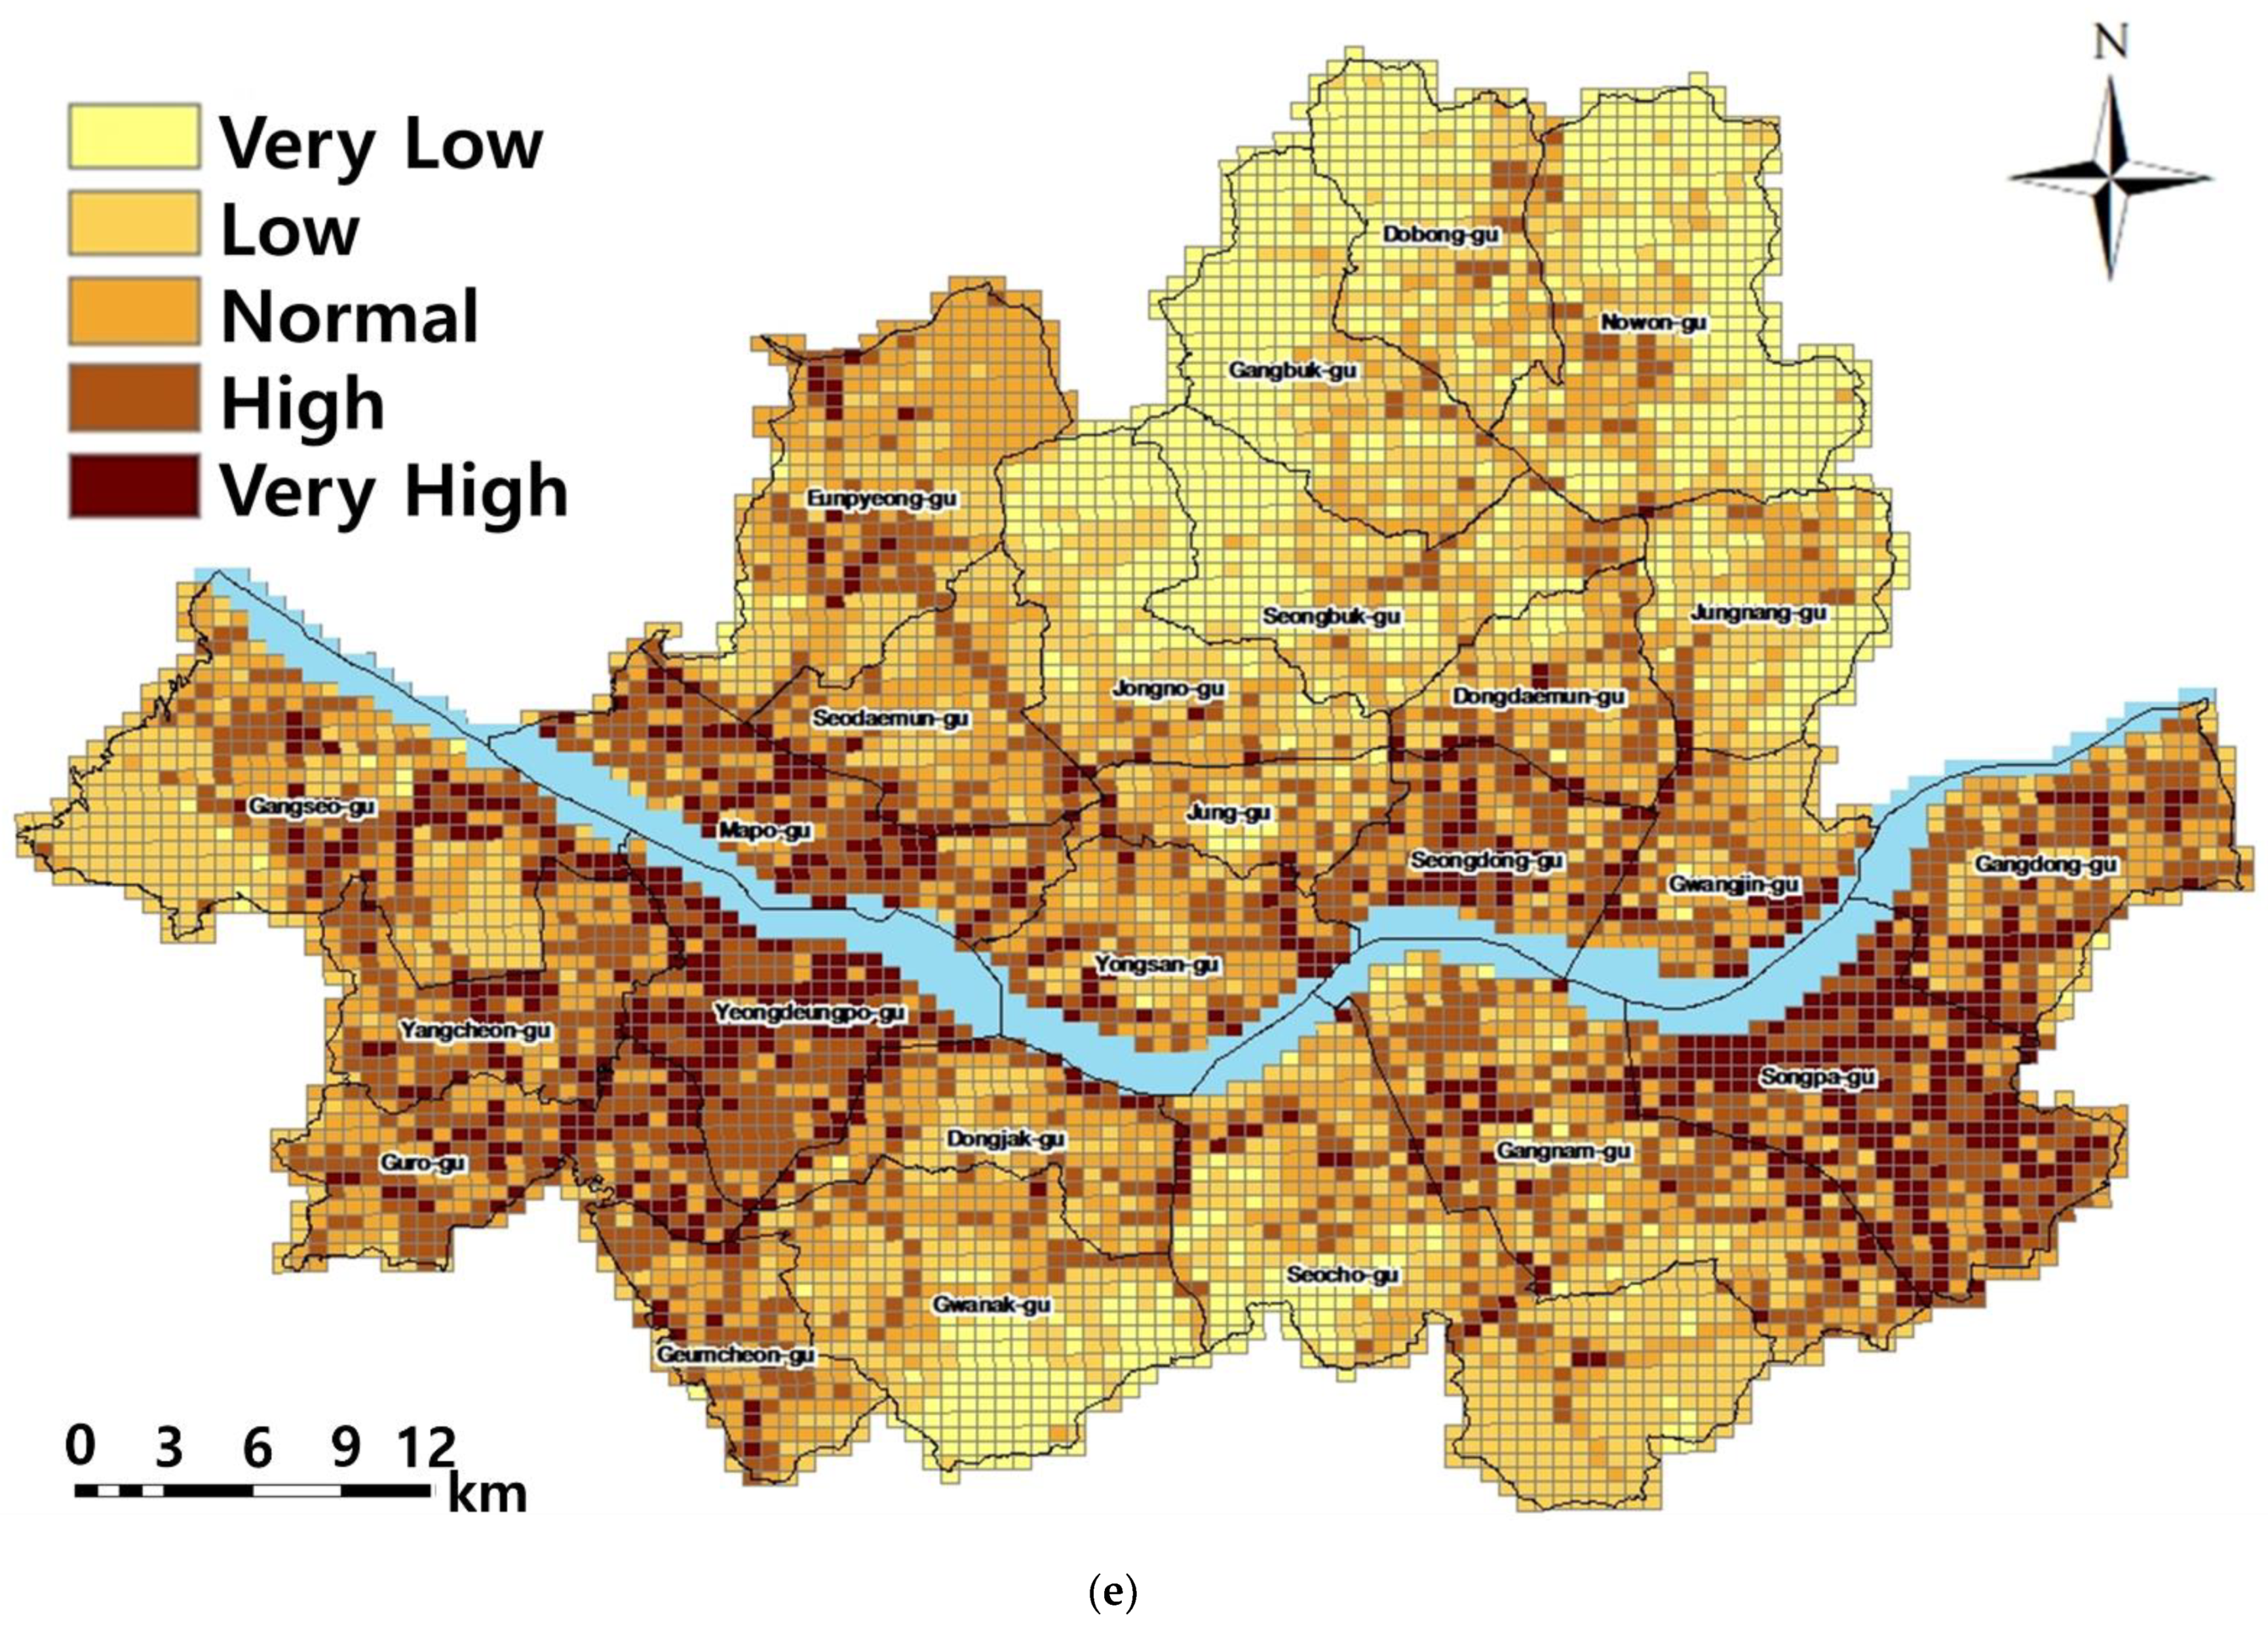
Figure 4.
Degree centrality analysis results.

Figure 5.
Bridges for emergency road operation.
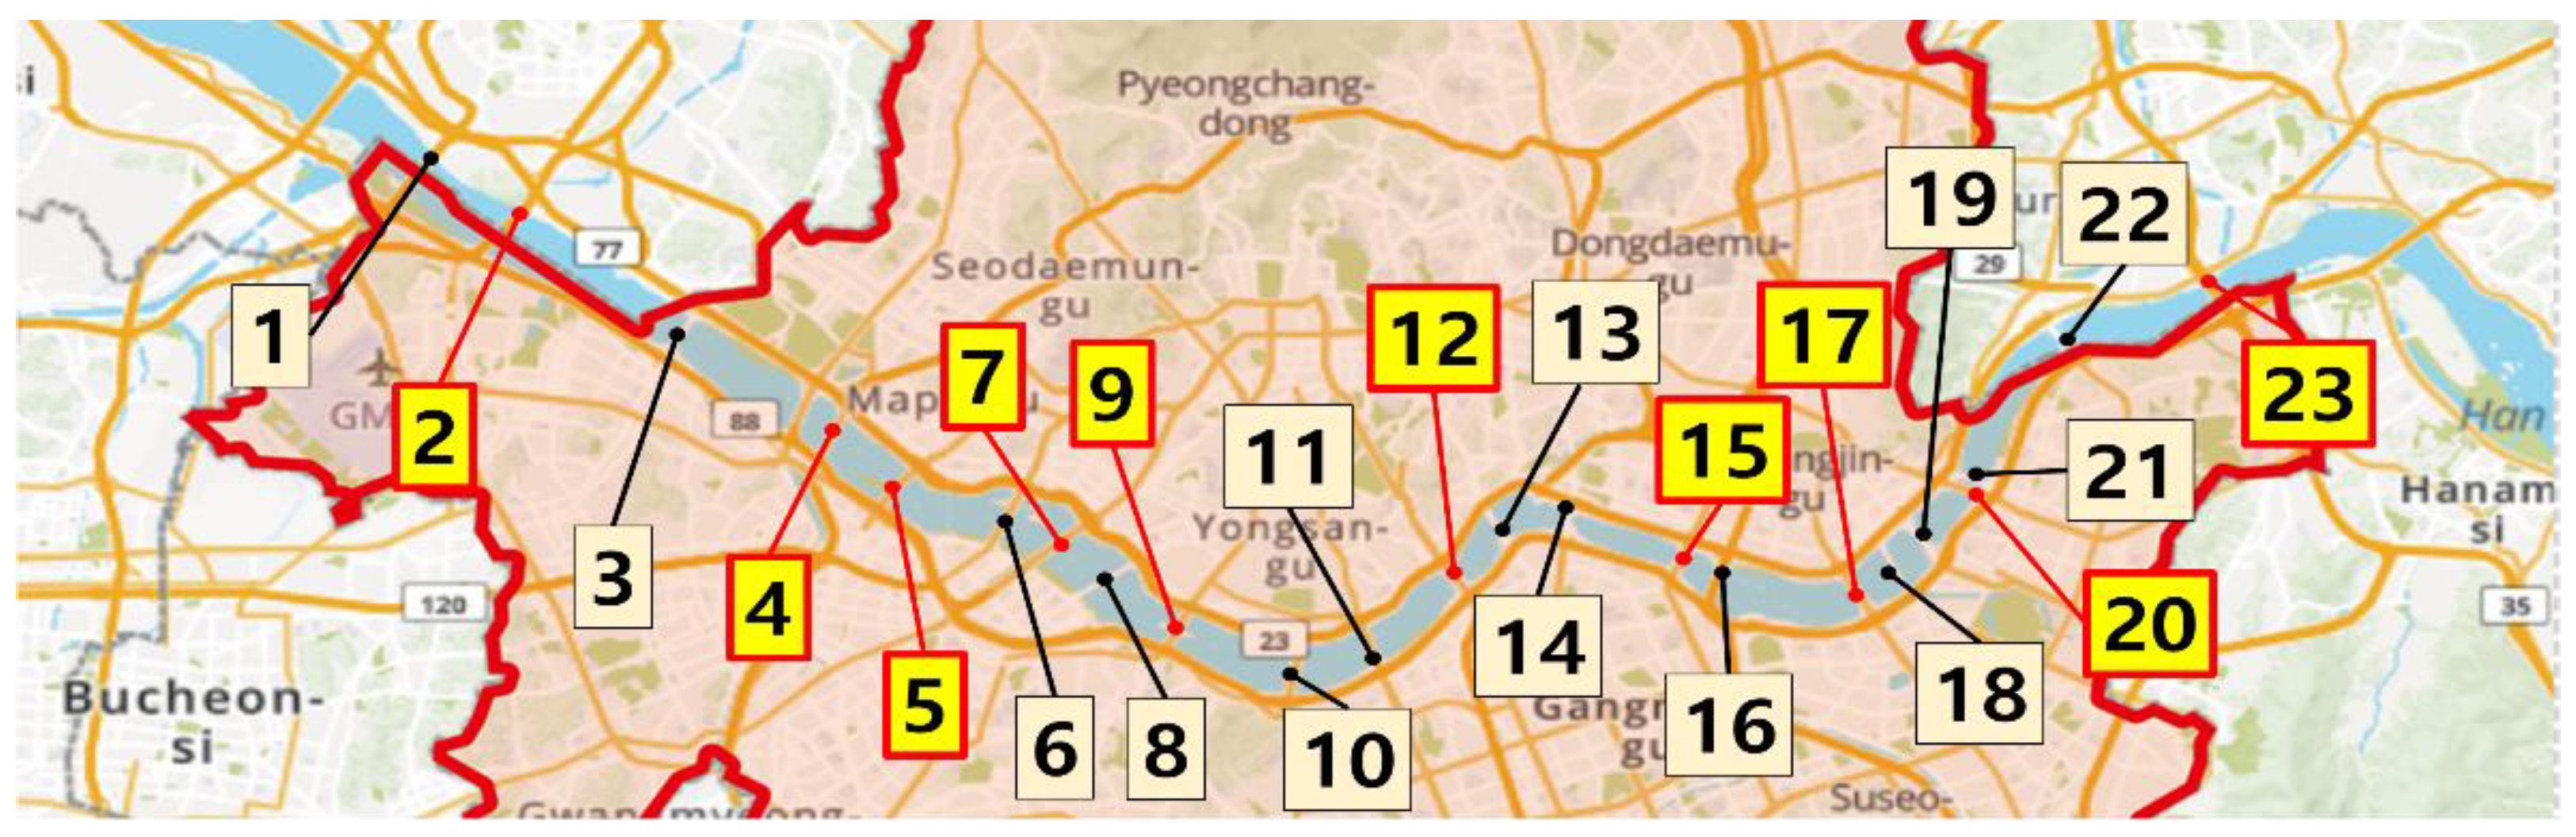
Figure 6.
Results of travel pattern analysis of (a) scenario 2–scenario 1 and (b) scenario 3–scenario 1.
Figure 6.
Results of travel pattern analysis of (a) scenario 2–scenario 1 and (b) scenario 3–scenario 1.

Figure 7.
Decision-making process for (a) bridges for emergency road operation, (b) SDRI, (c) degree centrality, and (d) results.
Figure 7.
Decision-making process for (a) bridges for emergency road operation, (b) SDRI, (c) degree centrality, and (d) results.

Table 1.
Data statistics.
| Item | Data Type | Units | Statistics | Grade | |||||
|---|---|---|---|---|---|---|---|---|---|
| No. of Data | Avg. | SD | Min. | Max. | Ratings | Remarks | |||
| Point | Scores | 11,518 | 0.20 | 0.13 | 0.00 | 1.25 | 3rd | Hard/medium/soft layer | |
| Polygon | Scores | 25 | 1.06 | 0.39 | 0.11 | 1.67 | 5th | Statistical methods | |
| Polygon | Population/hr | 424 | 25,814 | 12,993 | 4426 | 113,520 | 5th | Statistical methods | |
| Link | veh/day | - | 79,220 | 49,037 | 12,055 | 254,555 | 5th | Statistical methods | |
| Point | Ea | 382 | - | - | - | - | 2nd | Existence/No existence | |
| Ea | 145 | - | - | - | - | 2nd | |||
| Point | Ea | 616,134 | - | - | - | - | 5th | Statistical methods | |
| Service years | 30.08 | 15.73 | 1.00 | 120.00 | 5th | Statistical methods | |||
| No. of stories | 3.28 | 3.12 | 1.00 | 69.00 | 3rd | Low/middle/high -rise building | |||
| Polygon | % | 424 | 0.24 | 0.06 | 0.05 | 0.85 | 5th | Statistical methods | |
| Polygon | - | - | - | - | - | - | 3rd | Within X min from the facility (X: 5 min, 10 min, 15 min) | |
| - | - | - | - | - | - | 3rd | |||
| Population | 1515 | 7672 | 36,476 | - | 1184,848 | 2nd | Enough/Not enough | ||
| No. of firefighters/10,000 population | 25 | 7.99 | 2.98 | 4.64 | 18.47 | 3rd | Statistical methods | ||
| Links | km | 416 | - | - | - | - | 2nd | Existence/No existence | |
| 860 | - | - | - | - | 2nd | ||||
Table 2.
AHP analysis result.
| Level 1 | Level 2 | Level 3 | W | |||
|---|---|---|---|---|---|---|
| Items | Items | Items | ||||
| Risk | 29% | Soft soil layer | 41% | - | - | 11.8% |
| Seismic vibration | 59% | - | - | 17.2% | ||
| Exposure | 21% | Population | 35% | - | - | 7.4% |
| Traffic volume | 31% | - | - | 6.6% | ||
| Road infrastructure | 34% | 54% | 3.8% | |||
| 46% | 3.3% | |||||
| Vulnerability | 26% | Building type | 40% | 32% | 3.4% | |
| 27% | 2.8% | |||||
| 41% | 4.2% | |||||
| Disaster vulnerability | 60% | - | - | 15.5% | ||
| Responsive | 24% | Emergency facilities | 28% | 50% | 3.4% | |
| 50% | 3.4% | |||||
| Resources | 33% | 45% | 3.6% | |||
| 55% | 4.3% | |||||
| Accessibility | 39% | 50% | 4.7% | |||
| 50% | 4.7% | |||||
Table 3.
Decision making analysis for bridge blocking.
| No | No. of Lanes | Design Speed (km/h) | Capacity Per Lane | Traffic Volume (Veh/Day) | Connectivity to BRT | SDRI Grade | Result |
|---|---|---|---|---|---|---|---|
| 1 | 6 | 81 | 1420 | 60,785 | - | - | - |
| 2 | 6 | 115 | 2028 | 87,941 | - | 5 | O |
| 3 | 6 | 79 | 1341 | 71,255 | - | 4 | - |
| 4 | 6 | 79 | 1341 | 114,510 | O | 4 | O |
| 5 | 8 | 79 | 1341 | 91,414 | O | 5 | O |
| 6 | 6 | 79 | 1341 | 62,408 | - | 5 | - |
| 7 | 10 | 81 | 1420 | 110,278 | O | 5 | O |
| 8 | 4 | 81 | 1420 | 45,578 | - | 5 | - |
| 9 | 8 | 81 | 1420 | 105,839 | O | 5 | O |
| 10 | 6 | 81 | 1420 | 70,861 | - | 4 | - |
| 11 | 6 | 71 | 1242 | 85,226 | - | 4 | - |
| 12 | 12 | 81 | 1420 | 174,855 | O | 5 | O |
| 13 | 4 | 81 | 1420 | 74,585 | - | 4 | - |
| 14 | 8 | 79 | 1341 | 121,275 | - | 4 | - |
| 15 | 6 | 79 | 1341 | 102,786 | O | 5 | O |
| 16 | 6 | 98 | 2182 | 82,964 | - | 4 | - |
| 17 | 8 | 81 | 1420 | 96,457 | O | 5 | O |
| 18 | 1 | 67 | 1100 | 4750 | - | 4 | - |
| 19 | 6 | 81 | 1420 | 62,065 | - | 5 | - |
| 20 | 6 | 79 | 1341 | 70,795 | O | 5 | O |
| 21 | 2 | 56 | 873 | 12,380 | - | 4 | - |
| 22 | 6 | 81 | 1420 | 66,883 | - | 4 | - |
| 23 | 8 | 115 | 2028 | 101,875 | - | - | O |
Publisher’s Note: MDPI stays neutral with regard to jurisdictional claims in published maps and institutional affiliations. |
© 2022 by the authors. Licensee MDPI, Basel, Switzerland. This article is an open access article distributed under the terms and conditions of the Creative Commons Attribution (CC BY) license (https://creativecommons.org/licenses/by/4.0/).
Share and Cite
MDPI and ACS Style
Choi, S.; Chae, J.; Do, M. Emergency Road Network Determination for Seoul Metropolitan Area. Sustainability 2022, 14, 5422. https://doi.org/10.3390/su14095422
AMA Style
Choi S, Chae J, Do M. Emergency Road Network Determination for Seoul Metropolitan Area. Sustainability. 2022; 14(9):5422. https://doi.org/10.3390/su14095422
Chicago/Turabian StyleChoi, Seunghyun, Jonggil Chae, and Myungsik Do. 2022. "Emergency Road Network Determination for Seoul Metropolitan Area" Sustainability 14, no. 9: 5422. https://doi.org/10.3390/su14095422
Note that from the first issue of 2016, this journal uses article numbers instead of page numbers. See further details here.