1. Introduction
The COVID-19 virus has spread to almost every country in the world. Today, many countries on different continents still suffer from this virus. During the last week of August 2022, more than 4.5 million new cases of COVID-19 were registered, and one million deaths from COVID-19 were recorded during the most recent reporting year. Thus, COVID-19 could be called the “tragic milestone” that has caused a permanent negative impact on a country’s sustainability. The constant outbreaks of the pandemic have harmed the world’s economy for more than one year. The growth rate of the world GDP fell due to the coronavirus outbreak—staying stable around 3% until 2019 but then falling to a negative value in 2020. Many sectors of the economy such as the investment sector were affected, and there was also a sharp increase in unemployment. For example, 30 million people in the USA became unemployed within a few months of the beginning of the coronavirus outbreak. A distinctive feature of the 2020–2021 pandemic was that it, in combination with other factors, created economic policy uncertainty, a decrease in household spending, the emergence of a significant number of risks of geopolitical risks, and price policy uncertainty.
The socio–economic development of countries and regions under the conditions of global integration is increasingly being influenced by complex processes. For factors that cause the volatility of various markets—such as a pandemic or a threat to public health—an exceptional feature is that changes in multiple spheres of social life have cause-and-effect relationships. Considering the three factors of economic, financial–budgetary and political–institutional spheres, then with the unconditional complexity of the relations between them, it is possible to single out a specific set of explicit and implicit variables that characterize part of the interrelationships between them under the conditions of the COVID-19 pandemic [
1,
2,
3].
The authors set out to determine the cause-and-effect relationships between the economic, financial–budgetary, and political–institutional spheres to numerically measure their transformations during the coronavirus pandemic.
Authors from different countries investigated the multidirectional impact of the COVID-19 pandemic on the social and economic development of territorial units. Many social issues have been raised due to the long-term effect of the uncertainty surrounding the coronavirus pandemic [
4,
5,
6,
7,
8,
9,
10,
11,
12,
13,
14,
15,
16,
17,
18,
19,
20,
21,
22,
23]. An important topic was raised in one study [
24] regarding the creation of gender-sensitive policies to counter the negative impact of the pandemic. The authors highlighted that women are vulnerable not only to the direct effect of the pandemic on their lives, but also to indirect socio–economic consequences such as economic insecurity and increased caregiving burdens for family members. Such vulnerability is even greater for women already live in emergency situations. Valuable for the scientific community is a study [
25] in which the authors assessed the impact of the coronavirus disease on a country’s poverty level and food security in different regions of the world. The authors tried to consider the complex relationships between the crisis state of the economy, household incomes and the cost of living for the vulnerable population. Key elements of their calculations were the impact on the level of labor supply, the effects of social distancing, changes in demand for services involving communication, increased logistics costs in food and other supply chains and reduced savings and investment. Simulation calculations have shown that the global recession caused by COVID-19 is much deeper than the financial crisis of 2008–2009. For developing countries, this is a problem that has significant negative consequences. The authors used secondary data from various sources regarding a developing country’s COVID-19 pandemic and security challenges. In [
26], an analysis based on the example of the United States showed that more than one in five representatives of this country aged 65 and older lived in regions where there is simultaneously a high level of coronavirus infection and increased risks for local economic security. The authors emphasized that a population support strategy should consider social aspects, namely, the features of the lives of the elderly segment, since social security is the basis of economic security for the elderly. Unfortunately, such provision is often insufficient, and the situation only worsens under crisis conditions. The authors of [
27] investigated the main aspects of the crisis caused by the spread of COVID-19 in the real sector of the economy to ensure economic security, identifying the most influential factors and aspects of the crisis to provide economic security by using the method of hierarchical ordering.
The authors of [
28] raised the question of how an individual’s security can add value to the state as an analytical and normative framework. At the same time, their opinion, the pandemic demonstrated that traditional measures that should ensure national security are not a guarantee of society’s current and future stability. From a human security perspective, COVID-19 has exposed the structural inequalities and contradictions that underly the security norms in many regions. The authors proposed to study the experience of security and insecurity through the factors of gender and socio–economic disparities. In [
29] the authors assessed the price response, performance and term volatility of European investment funds during the outbreak of the COVID-19 pandemic. They concluded that while most investment funds showed a strained performance, social entrepreneurship funds proved resilient to the negative impacts of the pandemic. The authors explained the general stability of these funds by their investments’ niche because they provide innovative solutions for solving social problems. Thus, it could be concluded that social problems and issues remain relevant under any conditions and threats at the world level and individual regions. In [
30], researchers noted that the COVID-19 pandemic had a disproportionate negative impact on socially-vulnerable sections of society. This trend is characteristic of the whole world, regardless of a country’s level of development. Inequalities and related social determinants that affect groups are directly linked to adverse health outcomes for vulnerable populations during a pandemic. Thus, this work also emphasized the social nature of the financial and economic problems of the pandemic. The connection between the level of healthcare development and its ability to combat epidemics through the concept of green energy were investigated in [
31]. Tangential to the research of the authors’ who studied a country’s security, the resistance of a country to the influence of various factors and determinants of sustainability were investigated in the works [
32,
33,
34,
35,
36,
37,
38,
39,
40].
The scientific literature includes works that analyzed the factors that make countries and regions vulnerable to COVID-19, as well as works that examined the resulting impact of the coronavirus pandemic on various areas of human life [
8,
41,
42]. Scientists have formed a methodological basis for evaluating trends in the functioning of the labor market in the conditions of existing threats to the health care system. It was concluded that the pandemic affected the market of professional and technical medical workers. At the same time, the list and volume of educational services provided by vocational education institutions must meet the needs at the regional level under the conditions of the pandemic. The authors tested the hypothesis of a connection between quarantine due to the COVID-19 pandemic consequences and environmental problems, the state of the health of the population and the rate of economic growth. Thus, many works have examined the connection between the pandemic and functioning problems in the socio–economic sphere.
The institutional and political features of COVID-19 are widely disclosed in combination with the interaction of this sphere with the economic and financial spheres. The authors of [
43] considered the institutional rights of citizens during the pandemic and the exchange of economic and institutional spheres. The authors of [
44] investigated the impact of COVID-19 on the economic development of countries and regions, considering specific industries. However, the authors were unable to establish how the pandemic provoked financial and budgetary losses and which regulatory interventions should be implemented to reduce these consequences. Another publication [
45] analyzed the advantages and disadvantages of state policy under the conditions of COVID-19 and assessed the social losses from the point of view of the most critical medical and social parameters—quality and length of life. However, the systematic assessment of the effectiveness of state policy and the determining parameters of this effectiveness in countering the spread of the negative consequences of the pandemic on these parameters has not been carried out. The work reported in [
46] is interesting in that it pays attention to the market of medical services in the context of the COVID-19 pandemic in terms of legal doctrine and institutional and political aspects. However, it does not consider the economic and financial determinants of these changes.
The analysis of the scientific literature has verified, on the one hand, the increase in the number of empirical studies on selected issues and, on the other hand, the lack of a systematic understanding of convergent relationships between economic, financial–budgetary, and institutional–political determinants that determine national security.
2. Materials and Methods
This research aims to investigate the relationship between social and economic determinants. Additionally, the goal is to analyze the impact of social and economic determinants on the resistance to the impact of the COVID-19 pandemic. The authors chose 59 countries from 2017 through 2020 to determine the cause-and-effect relationships between the economic, financial–budgetary and political–institutional spheres. The list of research countries includes Australia, Austria, Belgium, Bosnia and Herzegovina, Brazil, Canada, Switzerland, Chile, China, Cyprus, Czech Republic, Germany, Denmark, Spain, Estonia, Ethiopia, Finland, France, United Kingdom, Georgia, Greece, Honduras, Croatia, Hungary, Indonesia, India, Ireland, Iceland, Israel, Italy, Japan, Kazakhstan, Lithuania, Luxembourg, Latvia, Moldova, North Macedonia, Malta, Montenegro, Malaysia, Nigeria, Netherlands, Norway, Panama, Peru, Philippines, Poland, Portugal, Romania, Russian Federation, Serbia, Slovak Republic, Slovenia, Sweden, Thailand, Turkey, Tanzania, Ukraine and the United States. The information base of the study was the sites statista.com, theglobaleconomy.com, ec.europa.eu.
The economic development of a country can be formalized through the dynamics of the increase in the total volume of production, which can be expressed in exports (econ_exp) and imports of goods and services (econ_import); GDP growth (econ_gdp); gross national income per capita (econ_gni)—due to the quantity or quality of labor resources in the form of the number of employed persons and the unemployment rate; % (econ_unemp)—in indicators of the standard of living of the population; the inflation rate (econ_infl); the number of personal remittances received (econ_pers); gross savings (econ_grossav); and household consumption (econ_household). Some categories have the effect of multicollinearity, for example, the number of employed persons and unemployed. Thus, only one is accepted for the study.
Seven determinants of budgetary and financial development were used: (bank capital to assets ratio (fin_bankcap); banking system z-scores (fin_banksyst); bank nonperforming loans to total gross loans (fin_banknon); commercial bank branches (fin_combank); total reserves (fin_totres); general government debt (fin_debt); and capital investments (fin_invest). The authors include the most significant factors that are determined based on the theory of financial and budgetary processes of a country. A two-stage selection of factors was used to exclude the subjective assessment of the role of individual factors and their multicollinearity. The chosen indicators cover the state of the general government sector. All indicators were checked for their availability and the coincidence of accounting periods.
A country’s political and institutional development can be formalized through a set of factors that reflect peoples’ political views, the population’s perception and trust in Government, the level of democratization of society, the activities and transparency of the Government, etc. To assess the state of political and institutional development, this study included indicators reflecting political stability (pol_stabil), government efficiency index (pol_gov), corruption perception index (pol_cpi), the numerical value of democratic efficiency (pol_dpn), property rights index (pol_ipri), voice and accountability (pol_voice) and political stability. Some aspects of political and institutional life are reflected in several indexes, for example, the level of democratization of a country is measured using the Democracy Index and V-Dem index. These indexes contain different methods of calculating the general level of democratization of a society. Each index consists of similar factors: how free and transparent the elections in the country were; indicators of the rule of law; the degree of participation of citizens in decision-making through local authorities; equal access to resources for all citizens; and the interests of the majority rather than a narrow circle of interested persons. Only the Index of Democracy is included in this study to avoid the effect of multicollinearity due to the similarity calculation.
Multidimensionality of each variable is necessary for a systematic field study because only a general overview could give a concrete result. For example, when studying a country’s economic growth, there may be a high percentage of exports and imports of goods and services, even though inflation indicators will show high dynamics—a negative economic phenomenon. Similarly, there may be high government efficiency within society’s institutional and political life, but the corruption perception index may indicate the opposite. That is, the search for dependencies between two spheres by aggregating data and calculating integral indices will not provide detailed information about the relationship of individual variables from different data sets. Therefore, the authors use canonical analysis to find the definition of cause-and-effect relationships, making it possible to consider individual determinants of the development of both data sets. The general idea of canonical analysis is presented in Formula (1), which contains a stochastic hypothesis about the existence of a relationship between two linear combinations:
where
—set of variables corresponding to economic development;
—set of variables corresponding to the political and institutional development of the respective country;
—calculated weighting factors depending on the degree of correlation of indicators
,
where
—matrix of the mutual correlation of nine variables of economic development by dimension 9 × 9;
—matrix of the mutual correlation of six variables of political and institutional development by dimension 6 × 6;
—matrix of the mutual correlation of nine variables of economic development and six variables of political and institutional development (6 × 9);
,
—corresponding inverse matrices to
3. Results
The results of the canonical analysis to investigate cause-and-effect relationships for economic and political–institutional determinants before the COVID-19 pandemic in 2017 are presented in
Table 1.
The analysis of
Table 1 confirms the strong connection between the economic and political–institutional development of the countries of the world; the obtained canonical correlation is equal to 0.9284 (going to one), the value of the Pearson test is (
) and the significance level is lower than the critical threshold of 0.05. The value of the excess set responsible for political and institutional development is 66.86%. Economic development indicators explain the variability of political sphere indicators by 66.86%. Conversely, indicators of political and institutional development explain the variability of indicators of economic development of the countries of the world in 2017 by 32.97%. For further research, it is necessary to determine the number of statistically significant roots. The results of the analysis are presented in
Table 2.
The analysis in
Table 2 confirms that the first, second and third canonical roots meet the significance criteria (according to the value of the Pearson test with the corresponding degrees of freedom and
p < 0.05). However, the sample size does not allow all three canonical roots to be included in the study. Therefore, only the first statistically significant root will be involved in further calculations. One of the tasks is to determine the correlation of each studied variable with the corresponding canonical ones. The authors constructed tables of loadings on canonical factors (
Table 3), where the first canonical root has the most significant factor capacity.
The analysis in
Table 3 shows that among both sets of indicators, some demonstrate a weak, medium, and strong correlation. Among indicators of economic development, GNI per capita and the inflation index show a strong intergroup connection. Among the political and institutional indicators are the index of the perception of corruption, the index of a country’s democracy, the indicator of the ability of citizens to choose the government, political stability and efficiency of the government. The analysis of excess variance allows us to conclude that when studying the components of the political and institutional state of the country, 100% of the variance will be explained by all canonical roots, and for the economic component, 72.73% of the variance will be explained. If only the first canonical root is considered, then it explains 71.44% of the political and institutional state of the country and 21.28% of the economic component.
The next step of the canonical analysis is the determination of the weighting coefficients for the canonical regression model of the variables of the left and right sets (4), which are presented in
Table 4.
The larger the value of the coefficient in the model (4), the more significant the contribution of the corresponding variable. The sign of the weight coefficient indicates the connection between the change of a specific factor and the general value of the latent variable. A positive value indicates a simultaneous increase in the indicator and the canonical root. Therefore, the indicators of export and import of goods and services, as well as GNI per capita, have the most significant influence on the development of the economic sector, while the level of the export of goods has an inverse relationship—its increase will reduce the value of the canonical root. GDP growth and the level of household consumption have the most negligible impact. Regarding political and institutional development, the most significant influence is exerted by the Corruption Perceptions Index—a quantitative indicator of the democratization of a society and the efficiency of the government. In contrast, all three indicators directly influence the canonical root. If the value of the weights is positive, then when the factor increases, the root value will increase proportionally. If the value is negative, then as the value of the root increases, it decreases. For example, an increase in the indicators of inflation, personal remittances, gross savings, unemployment and exports of goods and services will contribute to a decrease in the value of the corresponding root—which corresponds to economic development. The rest of the indicators will, in contrast, increase. If the set of indicators corresponding to be political and institutional development are considered, then only voice and accountability have a negative impact. A scatter diagram was constructed to check the presence of a linear relationship between the canonical roots (
Figure 1).
The analysis of the scatter diagram of the canonical values for the first roots (
Figure 1; the horizontal axis is the component of political and institutional development and the vertical axis is the economic component) is characteristic of linear dependence with the absence of anomalous emissions. For the second canonical root, there is no linear dependence. Therefore, there is a close connection between the political–institutional and economic development of a country, and these variables significantly influence each other. In continuation of this work, a study was conducted between the economic and political–institutional spheres in 2018, 2019 and 2020 to investigate their transformation (
Table 5).
The analysis of
Table 5 shows that there are no significant transformations in the chain of “political–institutional–economic” determinants under the influence of the pandemic. The excess of the political–institutional sphere, that is, by what percent of the economic sphere’s indicators explain the political sphere’s variability, varies between 65–69%—with an abnormally large value in 2019. In 2020, this value decreased below previous levels. This situation is similar to the redundancy of the economic sphere (30–37%), which had an abnormally large value in 2019 and decreased sharply under the influence of the pandemic. In the chain of “political–institutional–economic” determinants, the economic indicators are the cause of the changes in political–institutional indicators. The critical parameters of the economic sphere are exports of goods and services, imports of goods and services and GNI per capita. Of these parameters, GNI per capita and inflation have the most substantial connection with political and institutional determinants. In the political and institutional sphere, the key indicators are government effectiveness, political stability, the democratic performance numeric, the Corruption Perceptions Index, voice, and accountability. Of these indicators, the Corruption Perceptions Index, democratic performance numeric and Property Rights Index have the most significant influence on economic determinants.
The results of applying a similar methodology to find relationships and cause-and-effect relationships between financial–budgetary and political–institutional determinants in 2017, 2018, 2019 and 2020 are presented in
Table 6. The analysis of
Table 6 shows that there are no significant transformations in the chain of “political–institutional—financial–budgetary” determinants under the influence of the pandemic. The excess of the political–institutional sphere varies between 29–34%, with the tendency to decrease. In 2020 this value decreased more significantly by 1.7%. The excess of the financial and budgetary sphere is 23–27%, an abnormally large value in 2019 but returned to its 2018 level under the influence of the pandemic. In the chain of “political–institutional—financial–budgetary” determinants, the financial–budgetary indicators are the cause of the changes in political–institutional indicators. The critical parameter of the financial and budgetary sphere is total reserves in the researched period, but all other indicators are key in different years of the analyzed period. The most substantial connection with political and institutional determinants is also total reserves, bank nonperforming loans to total gross loans and capital investments. In the political and institutional sphere, voice and accountability, political stability, the democratic performance numeric and the Corruption Perceptions Index are the key indicators; voice and accountability and the democratic performance numeric have the most significant influence on financial and budgetary determinants. The results of applying a similar methodology to find relationships and cause-and-effect relationships between financial–budgetary and economic determinants in 2017, 2018, 2019 and 2020 are presented in
Table 7.
The analysis of
Table 7 shows that there are no significant transformations in the chain of “economic–financial and budgetary” determinants under the influence of the pandemic. The excess of the economic sphere varies within 30–35%, with a tendency to decrease. The excess of the financial and budgetary sphere (37–41%) is an abnormally high value in 2018. In the chain of “economic–financial and budgetary” determinants, economic indicators are the cause of the changes in financial and budgetary indicators. Commercial bank branches and capital investments are the critical parameters of the financial and budgetary sphere and simultaneously have the most substantial connection with economic spheres. In the economic sphere, the key indicators were the exports of goods and services, the imports of goods and services and gross savings, while GDP growth and unemployment rate significantly influence financial and budgetary determinants.
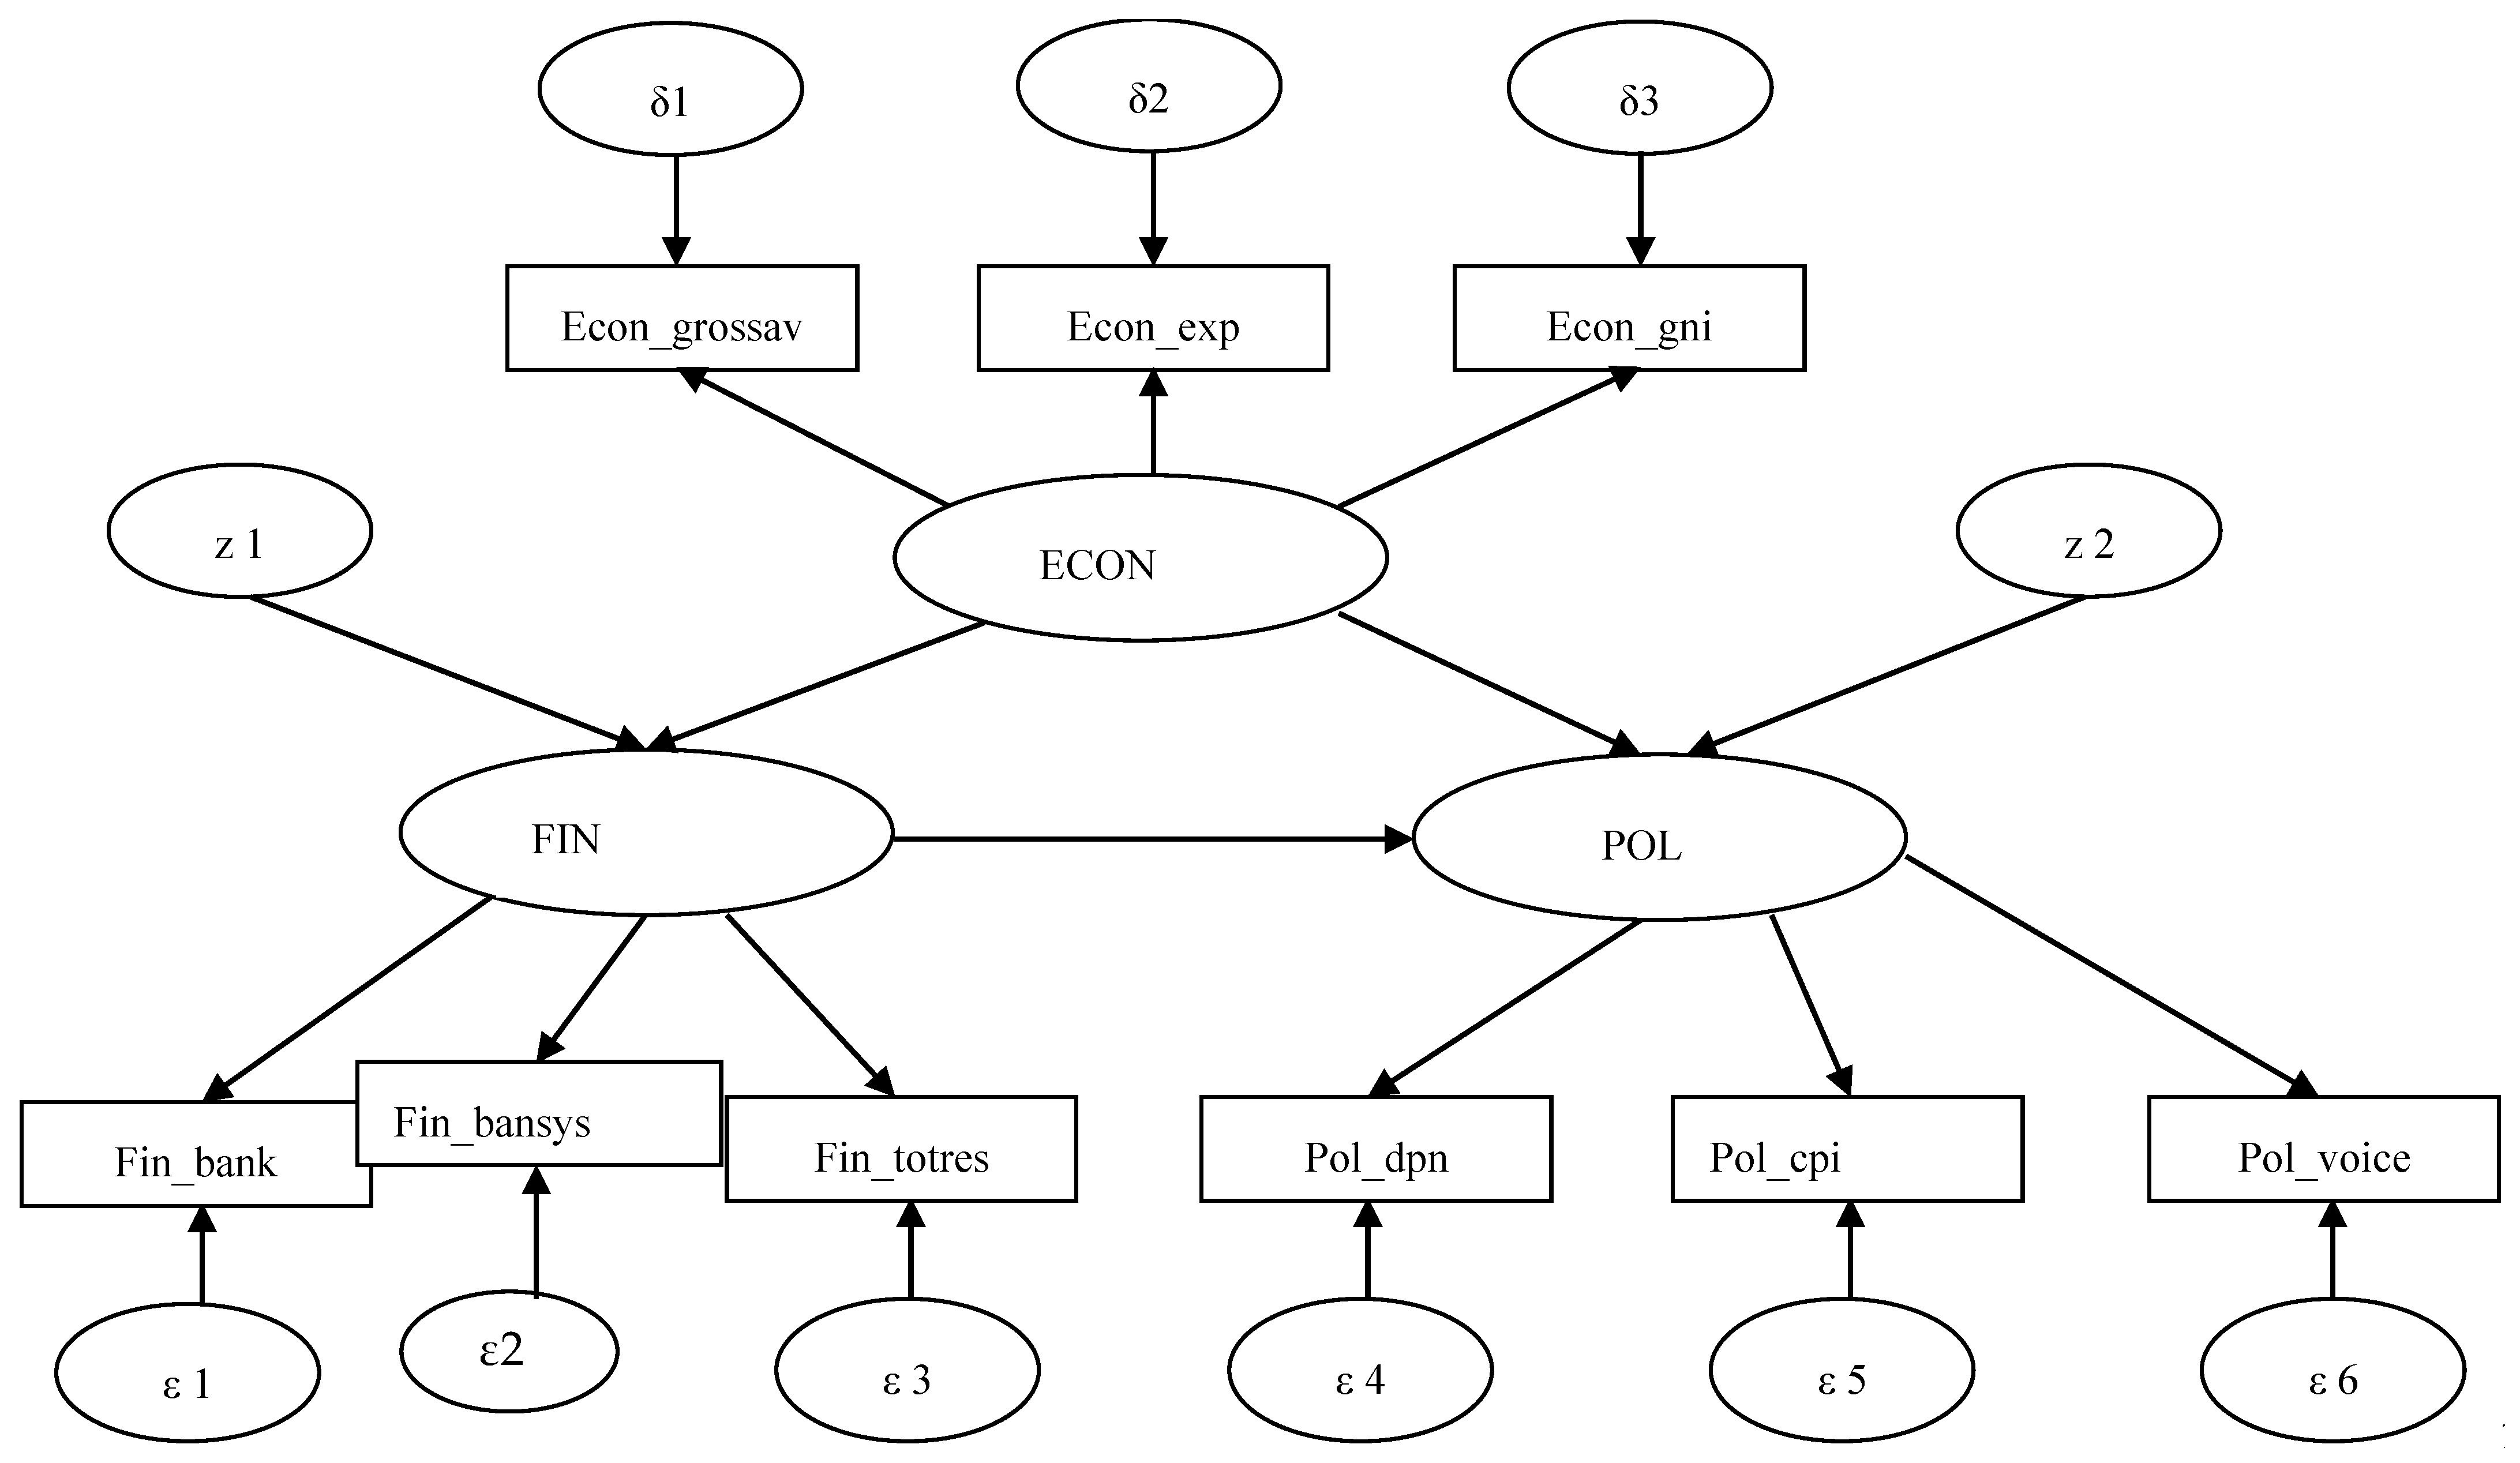
The analysis of indicators showing a high intergroup connection and those strongly influencing the latent variable to which they refer highlights the indicators in each group. Among the indicators of the economic sphere are exports of goods and services imports of goods and services, gross savings and GNI per capita. Among financial and budgetary indicators are total reserves, bank nonperforming loans to total gross loans, general government debt and capital investments. Among political and institutional indicators are voice and accountability, political stability, the democratic performance numeric and the Corruption Perceptions Index. By sorting through various combinations of normalized values of the above factors, the best set of variables was determined, and a scheme of simultaneous structural equations was constructed (5),
Figure 2.
where
—unknown coefficients; and
,
—model errors and free coefficients of the corresponding equations of the system of structural equations.
With these three groups of indicators—economic (Econ), financial-–budgetary (Fin) and political–institutional (Pol) spheres—which are considered latent characteristic of a complex system, the fundamental connections between them are difficult. However, there is a specific a set of explicit and implicit variables that can characterize most of these relationships. The preconducted canonical analysis makes it possible to determine the cause-and-effect relationships of these subsystems. Therefore, the economic sphere is defined as an exogenous variable and the political–institutional and financial–budgetary as an endogenous variable, that is, as consequences. Using the STATISTICA application program package, namely, the Linear-NonLinear Models/Structural Equation Modeling module, the system of Equation (5) was solved, and the result (6) was obtained:
The analysis of the results shows that the state of the economic sphere is characterized by an increase of 1% with a rise in gross savings by 0.21%, the export of goods and services by 0.37% and the gross national product. The regression equations of system (6) demonstrate that the gross national product is the most suitable for characterizing the economic sphere, but the export of goods and services and gross savings also have a sufficient influence. The fourth, fifth and sixth equations of system (6) characterize the state of the financial and budgetary sphere: an increase of 1% corresponds to a decrease of 1.7% in total reserves; a reduction of 1.2% in the Z-score of the banking system; and an increase in nonperforming bank loans by 1% The seventh equation indicates a direct relationship between the numerical democratic characteristic and the state of the political development of the state, namely, 1 to 2.2. The corruption perception index directly affects the state of political and institutional development of a country, and a 1% increase in the quality of the political sphere corresponds to a 2.3% increase in the coefficient, which characterizes the ability of citizens to participate in the free choice of a country’s leadership and the availability of free mass media. The tenth and eleventh equations of system (6) describe the relationships between the economic (Econ), financial–budgetary (Fin) and political–institutional spheres (Pol). A deterioration of the economy by 0.14% will cause a shift in the financial sphere by 1%. However, economic growth by 0.44% and financial growth by 0.76% will correspond to the strengthening of the political and institutional sphere by 1%.
In this study, we assessed the built model’s quality. The significance level (p-value) was considered for most coefficients at a level less than 0.05. The amount of redundant data is zero. The main summary statistics indicate the sufficient quality of the model: the disagreement function takes a value of 1.057; the maximum value of the cosine of the residuals is zero, which indicates the successful completion of the iterative process; the maximum absolute value of the gradient is 0.003; the ICSF and ICS criteria are equal to zero, indicating that the built model is resistant to multiplication by a constant scale factor; the value of the Pearson criterion is 61.3, which is greater than the corresponding critical value at 24 degrees of freedom of 36.4; the level of significance does not exceed the critical value of 0.05; and the root of the average standardized residuals is 0.095, which also indicates the sufficient quality of the constructed model.
4. Discussion
COVID-19 has become a potent modern threat to the national security of the world’s countries. Various aspects of the negative impact of the pandemic are highlighted in the scientific literature in 2021–2022. The outbreak of this pandemic tested not only the strength of a country’s medical systems, but also the unity of the functioning of all systems for ensuring the effective and stable development of a country’s spheres—economic, financial–budgetary and political–institutional. According to studies [
25,
26,
27,
28,
29,
30,
31,
32,
33,
34,
35,
36,
37], most countries overall potential, degree of readiness and speed of adjustment to functioning in updated realities are decisive. An understanding of the interaction of the elements of these three central systems will make it possible to develop effective specialized state programs for post-pandemic support of the population and territories, which should be accompanied by acceptable targets of economic, financial–budgetary and institutional–political interventions.
One of the goals of this study was to identify a deviation in the quantitative value of the interrelationships of the economic, financial–budgetary and political–institutional spheres under the influence of the pandemic. While some of these changes took place, many were insignificant. For example, among the indicators of the redundancy of the economic sphere concerning the political–institutional sphere, before the pandemic, there was a tendency to increase in 2017–2019 (32.97–36.85) and decrease in 2020 to 30.49. For these two years, no significant changes were record in the financial–budgetary sphere, the political–institutional sphere or the economic sphere. The excess values correspond to either the previous trend or the average value. Thus, the study results indicate a close relationship between the three researched spheres, with the financial–budgetary and economic spheres causing changes in the political–institutional and the economic spheres with the financial–budgetary sphere. With effective interventions for these components, which are decisive in a particular function of forecasting, it is possible to predict a variable value for another component with accurate calculations with a high probability. An essential conclusion of this study is that researchers should pay attention to the fact that the influence of risk factors does not significantly change the relationships between individual parameters of the groups.
In addition, the canonical analysis helped to identify which areas can be considered exogenous (economic) and endogenous (political–institutional and financial–budgetary) for the next stage—modeling with structural equations, which helped formalize quantitatively the relationships between economic, financial–budgetary and political–institutional spheres. Many laws and measurements were obtained, for example, that a 0.14% deterioration in the state of the economy will cause a shift in the financial sphere by 1%. However, economic growth by 0.44% and financial growth by 0.76% correspond to a strengthening of the political and institutional sphere by 1%. Future research should focus on this task, with the determination of the multitude of consequences of the multichannel diffusion of decisions made in various areas of a country’s development.
5. Conclusions
The authors empirically determined that the indicators of the development of a country are linked: a change in one indicator will cause a change in the other indicators. However, in the case of significant failures, under the influence of the risk of substantial changes, such connections do not change. This was verified using the examples of the prepandemic and pandemic period in several countries of the world. The results of the research are of practical importance because the identification of such regularities allows further investigation into the quantitative relationships between the financial–budgetary, economic and political–institutional spheres for modeling complete changes in a country’s development in risk-free eras of development and those that are under the influence of risk due to exogenous risks such as pandemics.
The authors concluded that the indicators of economic development explain almost 70% of the changes in the trends of indicators of the political sphere in prepandemic times. At the same time, political and institutional factors did not have such a strong influence on the economic sphere in the period before the pandemic. Intergroup relationships between indicators of economic development were investigated, among which the strongest relationship was found for GNI and the inflation index. For political and institutional factors, a greater number of dependencies were found for the index of the perception of corruption, the index of democracy, the indicator of the possibility of choosing the government, political stability and government efficiency. The calculations made it possible to conclude that a country’s export and import indicators and GNI per capita have the most significant influence on the development of the economic sector. During the pandemic, there were no significant transformations in the chain of “political–institutional–economic” determinants. In 2019, the indicators of the economic sphere were abnormally high in explaining the variability of the political–institutional sphere. In 2020, this connection decreased to a level lower than in 2017. The analysis of interdependencies showed that in the chain of “political–institutional–economic” determinants, economic factors lead to transformations in political–institutional ones. Similar to the calculations in the chain of “political–institutional—financial–budgetary” determinants, it is the financial–budgetary factors that cause the changes in the state of the political sphere. The condition of the economic sphere improved by 1%, with an increase in gross savings by 0.21% and exports by 0.4%. The regression analysis showed a significant influence on GNI. Positive developments in the financial and budgetary sphere lead to a percentage decrease in total reserves, a reduction in the assessment of the banking system and an increase in nonperforming bank loans. Of the critical dependencies that were discovered, it is worthwhile to mention the dependence between the index of the perception of corruption and the state of political and institutional development. The increase in the political sphere quality is facilitated by the growth of the ratio of the citizens’ ability to participate in elections and the amount of free mass media. A deterioration of the economy by 0.14% causes a shift in the financial sphere by 1%. However, economic growth of 0.44% and financial growth of 0.76% strengthen the political and institutional sphere by 1%. The identified interdependencies make it possible in the future to forecast the state of various spheres of a country’s life that determine its sustainable development and to adjust the movement of determinants of territorial unit stability with the alignment of components that are decisive for the strength of others.

 ,
, 

