1. Introduction
Sustainable development (SD) is a complex and broad concept entailing different social, economic and environmental aspects. Due to its complexity and different perspectives on how this goal could be pursued as well as which actions are more indicated for its implementation, a large debate involving politicians, scientists and technicians is still ongoing, and no definitive responses are currently achieved.
The United Nations (UN) World Commission on Environment and Development, first delivered the definition of SD [
1]. The SD is thus identified as “a development that meets the needs of the present without compromising the ability of future generations to meet their own needs”. Accordingly, two main concepts can be derived from this statement: the first is at the center of SD, which entails the needs of human beings; the second highlights the critical aspect of the capacity of the environment to encompass such needs.
Since its first definition, the UN introduced the 17 sustainable development goals (SDGs) to be achieved by 2030 [
2]. The UN 17 SDGs clearly indicate what physiological and social requirements of humans must be met (i.e., health protection, water and energy, end of poverty and hunger, etc.). This comes along with the action to be pursued for protecting the environment (e.g., preservation and restoration of terrestrial ecosystems, oceans and marine resources).
All this highlights that SD includes certain components that are more dependent on the cultural perspective, perception of social groups (e.g., perception of the potential impact on human health and environmental consequences due to emissions) and some aspects that are more objective (e.g., depletion of resources, amount of emission) [
3,
4,
5]. The former aspects can differ based on the diversity of the contexts in which they are analyzed and are generally not numerically quantifiable. The latter is more deterministic and generally also numerically quantified.
Among the different activities followed at the technosphere level, the one concerning waste management (WM) has been one of the most investigated for its effects on the environment. WM in EU countries was and remains considered a strategic sector for the implementation of relevant activities related to SD and circular economy [
6]. This is also clearly stated by the EU legislation related to the sector [
7], which strongly suggests the use of waste as a source of secondary raw materials to be exploited in industrial activities to replace both other raw materials and fossil fuels. Replacing raw materials with waste pursues the prevention of natural resource depletion, which is one of the main pillars of SD, in general, and of environmental sustainability [
1], in particular.
One of the most diffused approaches for evaluating environmental impact is the life cycle assessment (LCA) that is largely exploited in the WM sector as demonstrated by several studies in this field, e.g., Di Maria and Micale [
8] for the Italian and Maalouf et al. [
9] for the Lebanese contexts. Similarly, other studies adopting LCA for assessing the environmental impact of MW are those of Yay [
10] for the Turkish, Bovea et al. [
11] for the Spanish and Weitz et al. [
12] for the USA contexts.
In addition to the methodological and scientific correctness, these studies reported quite different results mainly due to the different contexts (e.g., energy mix, resource consumed, technologies adopted in the industrial process and pollution control systems) in which they were implemented and the different assumptions made. These differences can be noted in the amount of kgCO
2eq avoided up to −370 kgCO
2eq/tonne waste [
8,
9] and/or emitted, up to 900 kgCO
2eq/tonne waste [
11], and in the amount of CFC-11eq and SO
2eq avoided. These findings indicate that the context in which the same process, system and/or technology is implemented can influence the calculation of the net amounts of emissions and/or materials consumed, leading to opposite results. In other words, the only balance of the emitted and avoided emissions is not able to give an absolute assessment of the intrinsic environmental sustainability of the specific system, process and/or technology but only provides an assessment that is related, relative, to the specific context. This means that there is a lack of a reference system and a baseline for assessing the absolute intrinsic environmental sustainability.
Given the above considerations, Di Maria et al. [
13] claimed in a previous study that to be considered environmentally sustainable, all the activities performed at the technosphere level must also be sustainable from an ecosphere perspective. In addition, the ecosphere includes all the ecosystems that are present in the environment, including the ones modified by humans (i.e., technosphere) [
14].
According to the findings reported in previous studies, thermodynamics can be exploited for analyzing both the processes occurring in the ecosphere [
15,
16] and in the technosphere levels [
17,
18].
More specifically, two thermodynamic functions can be exploited for this issue. These functions include “entropy”, which indicates the reduced properties of materials and energy usefully exploitable [
19,
20], and “exergy”, which indicates the capability of a system to return work [
21].
Different from purely physical systems, living systems evolve toward more ordered systems. Ludovisi [
15] adopted the specific entropy (SE) function (i.e., entropy to exergy ratio) for assessing the development tendency and the health status of living systems. In this context, systems minimizing SE are those able to maximize the storage of exergy with minimum entropy increase. In other words, systems that, in their evolution, minimize the SE are those able to make the most efficient use of the exergy flows exploited, also in compliance with the Darwinian principle of “survival of the fittest” [
16].
By using the same principle, the fittest system (e.g., chemical, mechanical, thermal) can be defined as the one able to return the maximum amount of exergy exploitable at the technosphere level at the minimum entropy increase. In this context, specific entropy-based indicators were developed by Di Maria et al. [
13], and preliminary applied to soma processes (i.e., anaerobic digestion, composting and incineration) as well as facilities largely adopted in WM for assessing their intrinsic sustainability. The novelty proposed in the present study consisted of the application of the model proposed by Di Maria et al. [
13] for assessing the intrinsic sustainability of the different EU27 MS waste management systems (i.e., anaerobic digestion, composting, incineration, landfill and recycling). The results were discussed and compared with the ones reported in other studies exploiting exergy as an indicator of their efficiency. The methodology proposed aims to support and build on existing adopted and validated methodologies for environmental sustainability assessment.
2. Materials and Methods
The methodology adopted in the present study was previously described in the work of Di Maria et al. [
13] and briefly presented in the following sections.
2.1. The Entropy-Based Indicators
The entropy generated by ecologic systems can be represented by their respiration activity, whereas the exergy can be associated with their biomass content [
15]. The ratio between the entropy generated and the exergy (i.e., respiration/biomass) is the SE of the ecologic system. Moreover, it was found that the fittest ecologic systems show lower SE values.
Concerning the technosphere, SE can be described as the ratio of the entropy generated and the amount of exergy that returns to the technosphere by the specific process, system and/or technology considered.
Accordingly, the specific entropy per amount of exergy gained (SEEG) Equation (1) has been proposed and defined as the net entropy to the net exergy ratio [
13].
The SSEG has been adopted for assessing the intrinsic sustainability of the WM systems of the EU27 MS based on the percentage use of the main processes and technologies currently adopted: anaerobic digestion, composting, incineration, landfill and recycling.
Figure 1 demonstrates the boundaries of the analyzed system for the calculation of SEEG. The SEEG is defined as the ratio of net exergy (
Ex) (kJ) and entropy (
S) (kJ/K) associated with all flows exiting (
Exout,
Sout) and entering (
Exin,
Sin) each process (Equation (1)).
Tref was considered to be 298 K whenever mentioned, according to standard circumstances.
Systems that return less exergy than the ones received are characterized by SEEG < 0 (i.e., Exin > Exout). This can also mean that the system destroys exergy also in the sense of its ability to make any useful use of inlet exergy at the technosphere level. For WM, such systems can be represented by those storing the waste and its exergy content (e.g., the landfill).
The analysis of the different processes and technologies considered in this study was performed by a black box approach. This implies that all the vessels and devices required for the functioning of each process and technology, as well as the associated generation and treatment of rejects and waste, were included within the system’s limits (
Figure 1). The main intake flows include waste, process air, energy, heat and fuel, depending on the process. The following main outlet flows were taken into account: combustion gases, exhaust air, electricity, heat, organic fertilizer, recyclable materials, slags and ashes, waste gases and wastewater. Therefore, the approach adopted in this study was gate-to-gate. Waste collection and transport were not considered in the scope of this study.
Finally, only the mass of waste that could be efficiently processed was included in the following computations. Therefore, contaminants and/or other incompatible materials were considered to be eliminated prior to waste processing (i.e., not included in the boundaries of the system).
2.2. Entropy and Exergy Calculation
Exergy (Ex) (kJ) for inlet and outlet streams were calculated according to Equations (2) and (3). The calculation of entropy (S) (kJ/K) related to heat flow was performed according to Equation (4). Both these calculations were performed according to the following approach:
- -
The mass streams (kg), enthalpy of formation
(kJ/kg) and the standard entropy (
S0) (kJ/kg K) were calculated considering the reactant and the products of stochiometric combustion of combustible elements [
22]. Hence
(kJ) and
S0 (kJ/K) were obtained by multiplying the mass (kg) by the specific values of
and
S0, respectively.
- -
For the heat streams (kJ), the Carnot cycle efficiency (ηca) Equation (3) and the thermodynamic definition of entropy Equation (4) were used. The temperature Ta (K) was assumed as ambient, i.e., 298 K, whereas T1 (K) is the temperature of the heat released into the environment.
- -
For the electricity (kJ), a Carnot efficiency ηca = 1 and S0 = 0 (kJ/K) was assumed.
The empirical or chemical formula was used to estimate the number of products produced by stoichiometric combustion. The primary chemical component’s oxidation products were C = CO
2, H = H
2O, S = SO
2, P = P
2O
5 and K = K
2O. If necessary, the well-known thermodynamic correlations were used to derive the thermodynamic functions for gaseous compounds [
23].
The standard molar entropy
S0 (J/mol K) was estimated as the sum of the standard entropies for each i-th element in the empirical/chemical formula [
22].
2.3. Waste Treatment Processes and Technologies
2.3.1. Anaerobic Digestion, Composting and Incineration
Average operating conditions for composting, anaerobic digestion and incineration were derived from direct observations, literature reviews and official reports. Full-scale incineration facilities can recover both heat and electricity at different ratios depending on the specific context and needs of the end users. Moreover, according to previous studies [
24], the average total net efficiency, given by the sum of the electrical (η
el) and the thermal (η
th) ones, was about 85% [
13]. Electrical efficiency for full-scale facilities ranged from around 11% to 30%, depending on the size of the facility and the energy recovery method. The amount of auxiliary fuel consumed by incinerators was assumed to be about 100 kJ/tonne of waste incinerated. The fuel type was assumed to be natural gas. The consumption of other materials (e.g., chemicals) for the operation of the facility was disregarded in this study.
For anaerobic digestion, biogas production per tonne of waste treated was considered to be about 150 Nm
3/tonne of waste with a methane content of around 55%
v/
v [
25]. In this study, the remaining 45%
v/
v was assumed to be only CO
2. This assumption is acceptable since the other compounds of the biogas have a concentration generally <1%
v/
v. The biogas was assumed to be exploited for energy recovery in gas engines. The total efficiency of gas engines was assumed to be η
el + η
th = 75 (%). Based on the average values of full-scale facilities, the electrical efficiency of gas engines ranged from 30% to about 40%. The digestate returned by the process was previously treated in a solid/liquid separator. Liquid fractions were handled in a wastewater treatment plant (WWTP). Solid fractions were successively treated by post-composting. Similar operating parameters were considered for both waste composting and post-composting of the digestate’s solid fraction. The main assumptions and parameters considered for the incineration, anaerobic digestion and composting of 1 tonne of waste processed were retrieved from Di Maria et al. [
13]. The empirical formula of the waste was retrieved from the data reported in the literature.
For incinerated waste, slags and ashes, the ultimate compositions reported by Ding et al. [
26], Frey et al. [
27] and Zhai [
28] were considered. The empirical formula for the waste composted and treated in anaerobic digestion was determined by the data reported by Hanc et al. [
29] and Di Maria et al. [
25].
2.3.2. Treatment for Recycling and Landfill
Landfilled waste undergoes several less or more spontaneous processes while modifying relatively its composition and mass. These main processes are represented by both aerobic and anaerobic biological degradation of biodegradable components of the waste, producing mainly gaseous compounds leaving the waste mass. Furthermore, the percolation of water, mainly due to rainfalls, through the waste body generates heavily polluted wastewater (i.e., leachate), which must be appositely treated before its discharge into the environment. Concerning the first aspect, a large part of the degradation process occurs under anaerobic conditions leading to the production of a landfill gas, a gas rich in methane (>45%
v/
v) and carbon dioxide that can also be exploited for energy recovery purposes. This degradation process lasts for several years, >30, and does not significantly influence the mass of the disposed waste. In fact, the biodegradable waste compounds (i.e., volatile solids) interested in such degradation are less than 10% of the biodegradable materials [
30]. At present, biodegradable materials contained in landfilled waste in the EU are less than 60% [
31]. Concerning the second aspect, in the long term, the amount of water entering the landfill bulk practically corresponds to the amount of water leaving the landfill both as a leachate and evaporation process. Furthermore, even if the leachate is a heavily polluted wastewater, the concentration of pollutants represents less than 1%
w/
w of the whole leachate mass. For this reason, the contribution of pollutant compounds to the Ex and S of the leachate is minimal and can be disregarded. Finally, from a SE perspective, the landfill will necessarily return an SEEG < 0 because such a facility is not aimed to make any useful exploitation of the inlet waste exergy. Therefore, a landfill cannot be properly considered a waste treatment facility because it operates like a perpetual waste storage system. Therefore, the whole Ex (kJ) and the S (kJ/K) of the inlet waste in the calculation of SEEG were not considered in this study. Only the ones associated with the gas emitted due to waste degradation were taken into account.
Table 1 demonstrates the main parameters adopted for the calculation of landfilling and recycling of the other main waste components. The composition of waste landfilled was assumed to be the same for waste incinerated. The volume of landfill gas and its relative composition were retrieved from Di Maria and Micale [
8]. The average amount of landfill gas collected and transferred to the gas engines was expected to be 50% [
32]. The remaining portion was assumed to be leaked into the atmosphere from the landfill surface.
The same features reported for the AD were assumed for the energy recovery from landfill gas with the exception of its composition, which was retrieved from Di Maria et al. [
30]. Landfill gas leaked through the landfill surface, and energy and exhaust gases from the gas engines were the only outlet mass streams considered for such a facility.
The only relevant difference among the recycling treatments was the amount of energy and fuels consumed, considering to be the same both the amount and the chemical composition of waste materials entering and exiting the recycling treatment systems. The data relating to these systems were retrieved from Di Maria and Micale [
8]. In order to simplify the calculations, all the fuels needed by the recycling processes were assumed to be natural gas. Finally, the plastic waste was assumed to be HDPE, with chemical formula C
2H
6, the glass chemical formula was assumed to be SiO
2, and the paper and cardboard average chemical formula assumed was C
14.4H
2.41O [
33]. Rejects from the pretreatment of waste for its recycling were not considered since they are not addressable to the specific treatment and or the adopted technology.
3. Results and Discussion
3.1. Specific Entropy per Amount of Exergy Gained
Table 2 demonstrates the average values calculated for SEEG, ∆Ex (MJ) and ∆S (kJ/K) for each tonne of waste treated and/or recycled for the considered processes. The result shows that the amount of electricity, compared to the amount of heat recovered by the different processes (i.e., AD, incineration and landfilling), did not significantly affect the values of SEEG. For this reason, only average values were reported. As expected (see
Section 2.3.2), the calculation of the entropy-based indicator for landfill, including the Ex
in (kJ) of the waste, resulted in negative values of SEEG = −0.0740. For this reason, the SEEG reported in
Table 2 was the one calculated without considering the Ex
in (kJ) and S
in(kJ/K) of the disposed waste.
The high values of SEEG reported for the incineration were mainly caused by the high increase in entropy generated by the combustion processes that transform solids into gaseous compounds. This is also coupled with the associated high entropy and low exergy content of the exhaust gases. These represent about 80% of the mass of waste entering the facility. Hence, even if the composition and the exergy of the waste entering both the landfill and the incineration were assumed to be the same, the amount of entropy generated by the last process is about 20 times higher than the one generated by the former.
Similar reasons caused a higher value of SEEG for AD compared to composting. Moreover, in this case, the main reason was the significantly higher generation of entropy, about six times higher, caused by AD. Given that the amount of exergy of the waste entering the recycling processes is the same as the amount of exergy returned by the recyclable materials, the only differences occurring for SEEG are presented by the exergy and entropy variations due to the energy needs of the different recycling processes (i.e., electricity and fuels). The SEEG values for all the recycling processes were very close and practically about 0.009.
Based on this evidence and excluding the landfill process, the incineration process resulted in lower intrinsic sustainability compared to the other processes considered. Composting performed the best and was characterized by a higher level of intrinsic sustainability.
Differently, the negative value of SEEG detected for landfilling, including the Exin (kJ) of the waste, indicated that this option seems to be a non-sense operation and/or treatment both at technosphere and ecosphere levels. In fact, the simple storage of waste materials and the associated exergy content without any successive useful exploitation appears to be in contrast with natural processes. Therefore, a more comprehensive analysis of the intrinsic sustainability of the landfill from an SEEG perspective requires taking into consideration other transformation and degradation processes. This can involve the non-biodegradable components of the waste but can last for a very long period compared to human perspectives. Therefore, the landfill could be considered as a possible way to restore geological reservoirs of different raw materials and chemicals exploitable in different forms and ways in the ecosphere and technosphere but only after very long periods.
Nevertheless, the investigation of these possible phenomena is not included in the scope of the present study and is not relevant if considered from the temporal perspective of humans. For this reason, the amount of waste managed by the landfilling process can be considered as exergy, not exploited and hence independent from its values. It is also considered the worst option from the SEEG perspective.
3.2. Assessing the Intrinsic Sustainability of Different EU27 Waste Management Systems
The SEEG values associated with the various tested treatments are largely consistent with the vision set by EU waste management legislation [
7]. The “waste hierarchy” is one of the main pillars of this legislation, defining the main goals and actions to be pursued in waste management by member states, comprising, in a hierarchical order, prevention, reuse, recycling, recovery (including energy) and disposal. The optimal use of waste material for replacing and/or reducing the use of other raw materials is at the heart of the waste hierarchy. After waste prevention, the higher levels of the hierarchy are the preparation for reuse/reuse and recycling. Both treatments aim to return the waste components/material for their exploitation into industrial processes without any substantial modification of both the exergy and the entropy of the reusable and/or recyclable materials. Consequently, these treatments were characterized by the lowest SEEG (i.e., higher intrinsic sustainability). According to the EU legislation, the organic fraction of the waste can be considered for recycling if properly processed and transformed into an organic fertilizer exploitable in agriculture for replacing other mineral and chemical fertilizers. Both composting and AD are indicated by the EU legislation as suitable processes for this aim. However, the values of SEEG suggest that composting was characterized by higher intrinsic sustainability compared to AD. By moving to the lower level of the hierarchy, the recovery operation coupled with the energy recovery option followed by the incineration. These results are consistent with the corresponding values of the SEEG presented in
Table 2. Finally, landfilling, which represents the typical and most worldwide diffused disposal operation, is positioned at the lowest level of the hierarchy. Therefore, the detected values for the correspondent SEEG (i.e., the highest value) were coherent with the position assigned by the EU legislation for landfilling process in the waste hierarchy.
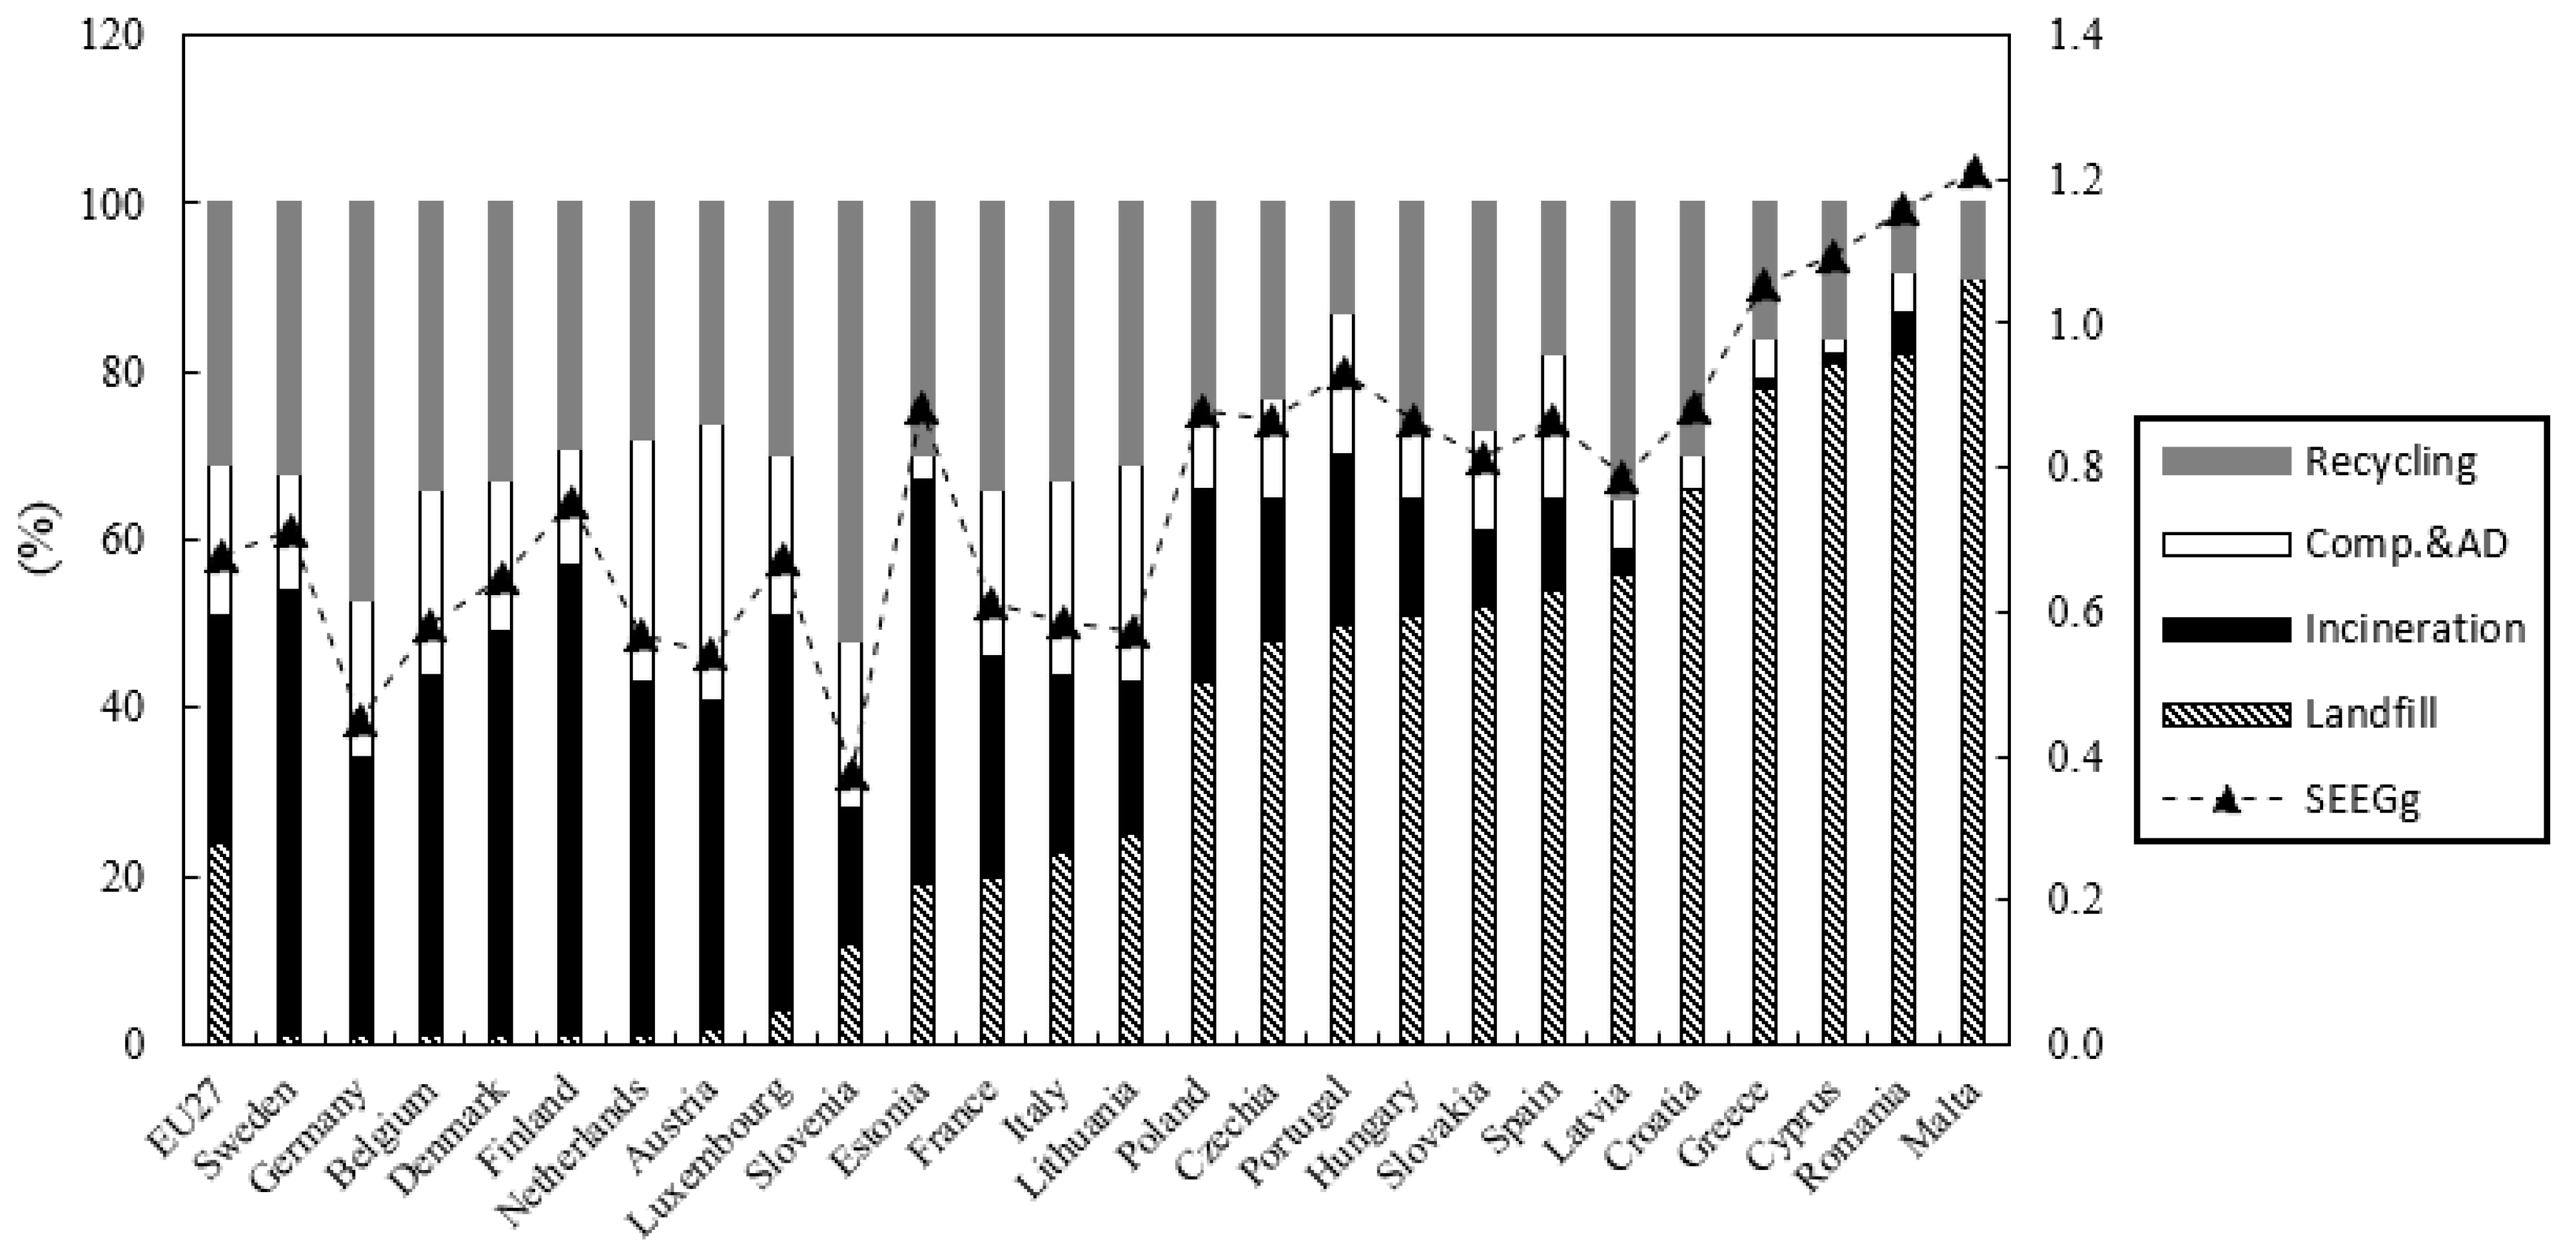
Figure 2 demonstrates the level of municipal waste management implementation for the 27 MS for 2019 [
31], based on percentages of waste treated or disposed of by the following main systems: landfilling, incineration, composting and AD, and recycling. Given the absence of specific information, composting and AD were assumed to be equally exploited in all the MS. Furthermore, according to the EU27 legislation, the position of the MS on the abscises axis was established based on the percentage of waste landfilled being the first MS with the lowest percentage of waste landfilled. In this perspective, the most efficient MS are represented by Sweden, Germany, Belgium, Denmark, Finland and Netherlands, all characterized by exploitation of landfill not higher than 1%. Austria and Luxembourg represented 2% and 4%, respectively, followed by all the other MS with a percentage of waste landfilled from 12% (i.e., Slovenia) and Malta up to 91%.
In general, the MS adopting less landfilling was characterized by higher exploitation of incineration. However, these MS were not necessarily characterized by a higher percentage of waste recycled and treated by composting and/or AD. Therefore, a global
SEEG (
SEEGg) (
Figure 2) representing a single tonne of waste managed was calculated per each MS by multiplying the percentage of each waste treatment/disposal exploited to the correspondent value of
SEEG as reported in
Table 2 (Equation (5)).
Legend: i = 1, landfill; i = 2, incineration; i = 3, compost and AD; i = 4, recycling.
Based on SEEGg, the ranking of the MS varied significantly. On average, the EU27 waste management was characterized by a SEEGg of 0.678. The MS characterized by high intrinsic sustainability, i.e., lower SEEGg was attributed to those with larger use of compost and AD and recycling, whereas the large use of incineration contributed to an increase in the SEEGg. Consequently, MS, such as Slovenia and Germany, with recycling and compost and AD percentages of 72% and 67%, respectively, resulted in lower SEEGg of 0.376 and 0.452, respectively. In general, a SEEGg under the EU27 average was achieved by MS having a total percentage of waste landfilled and incinerated of <50%. For example, for MS characterized by a SEEGg < 0.6, ranging from about 0.543 to 0.587, a landfilling and incineration percentage < 45% was reported (i.e., Italy, France, Lithuania and Netherlands).
Considering the average SEEGg as a reference value for the EU27, the level of intrinsic sustainability of waste management was used to rank the different MS as follows:
- -
Low intrinsic sustainability, SEEGg ≥ 0.67;
- -
Good intrinsic sustainability, 0.55 ≤ SEEGg < 0.67;
- -
High intrinsic sustainability, SEEGg < 0.55.
3.3. Discussion
Regarding incineration, in a previous LCA analysis on incineration and anaerobic digestion, Di Maria and Micale [
34] showed reduced emissions in terms of kgCO
2eq, kgSO
2eq, kgPO
4eq and photochemical ozone formation (kgC
2H
4eq). Similarly, the findings of Sonesson et al. [
35] showed that anaerobic digestion had a lower impact on human toxicity (kg1,4-DBeq). Blengini [
36] observed the same environmental impacts as Di Maria and Micale [
34] but only considered the composting process. In terms of energy recovered, incineration outperforms AD, with recovered energy per tonne of waste treated ranging from around 390 kWh/tonne to 830 kWh/tonne. The same results were reported for AD, which varied between 150 and 430 kWh/tonne [
37].
This evidence supports that the analyses based only on some of the inputs and outputs (e.g., only energy, mass and emission) are not adequate for giving a comprehensive assessment of the intrinsic sustainability of the systems. Furthermore, as for the case of kgCO2eq, these results were strongly influenced by the energy mix exploited in the specific context. Differently, the SEEG allows a comparison among the different systems starting from the same baseline, leaving aside all the specific aspects characterizing the context in which the previous studies were carried out.
The use of energy and exergy analysis for the different activities at the technosphere level was addressed in previous studies. For example, a study conducted by Ertesvag and Mielnik [
38] in Norway showed that public and household sectors destroy about 80% of the exergy exploited due to the high presence of irreversibility. In fact, in these sectors, the exploitation of electricity and fuels, both characterized by high exergy and low entropy content, was for building climatization and lighting. This caused high exergy destruction with a contemporary high entropy production. Concerning the industrial sector, the same authors reported an exergy degradation significantly lower, ranging from 40% to 70%. Mechanical work, chemical production and forest were indicated as the most efficient sectors with an exergy degradation not higher than 50%. In fact, all these sectors exploit a large portion of the inlet exergy to produce mainly materials and goods generally characterized by exergy and low entropy contents.
Strictly related to the above findings were the ones observed by Ozdogan and Arikol [
39] in a Turkish context and Chen and Chen [
40] in a Chinese context. In this case, the extractive and agricultural sectors were found to have exergy efficiency of 95.2% and 44.0%, respectively.
In summary, also these studies demonstrate that the exploitation of the inlet exergy, mainly for the production of energy and/or light, is characterized by a lower exergy efficiency. This means that the exergy content of the inlet materials/fuels is strongly degraded, together with a large production of entropy. At the current level of technological development, the conversion in electricity of the exergy of fuels is quite limited, lower than 60% and generally around 30%/40%, whereas the conversion in heat, even if it occurs at higher efficiency, it generates high entropy increase.
Concerning the MW, incineration facilities are characterized by electrical efficiency significantly lower than the conventional power plants, generally ranging from 20% to 30%. This also suggests that the energy recovery from non-reusable and/or non-recyclable waste could be achieved with higher intrinsic sustainability by the production of solid recovered fuels, which are able to replace other fossil fuels in the industrial sector. In fact, from an SEEG perspective, facilities and treatments related to the production of fuels from waste perform similarly to recycling, which returns to the technosphere the largest portion of the materials and exergy of the processed waste.
In addition, the findings of this study also strongly suggest the exploitation of fuels from waste into industrial processes aimed at the production of materials (e.g., concrete) rather than energy.
Finally, even if not specifically analyzed in the present study, the energy production sector is also characterized as one of the most pollutant sectors [
41].
4. Conclusions
Environmental sustainability assessment results mainly focused on the depletion of resources and on the quantity and quality of emissions generated at the technosphere level. The substantial effect of local and cultural perspectives on these elements can introduce some bias emphasizing the need for approaches able to return a more objective evaluation of the system’s intrinsic potential to be environmentally sustainable in comparison to others.
According to ecologic systems, the fittest system was characterized by the best utilization and storage of exergy in the technosphere, as in the ecosphere, resulting in a reduced increase in entropy. This concept was mathematically expressed by ecologists by entropy-based indicators, which results able to allow a base lane comparison among different systems.
The application of this approach to the waste management (WM) sector facilitated the assessment of intrinsic environmental sustainability of several processes and technologies independently from potential influences arising from local conditions and/or perceptions.
The main conclusions of this study can be summarized as follows: (1) the entropy-based indicator adopted in this study confirmed the coherence of the EU legislation in the implementation of an environmentally sustainable WM; (2) recycling operations, including the composting of the organic fraction, were characterized by higher intrinsic sustainability due to their ability in returning to the technosphere the largest fraction of inlet exergy at lower entropy increase as well as being the worst option in WM; and (3) main results showed that landfilling was also an inefficient operation from an entropy-based indicator perspective. Concerning this last aspect, landfilling operation is not oriented to make any useful exploitation of the exergy of the disposed waste, at least from a temporal perspective of human beings. A possible positive role of landfill for the technosphere and ecosphere could be represented by their contribution to the restoration of geological reservoirs of raw materials. This aspect cannot be addressed at the current level of knowledge.
Based on the current state of technological development and on the main findings achieved, the following recommendation for the WM sector can be drawn for pursuing environmental sustainability:
- -
Reuse, recycling and composting are preferred over other options;
- -
Solid fuel production is preferred for not reusable, recyclable and compostable waste compared to incineration and landfilling;
- -
The exploitation of solid fuel from waste in the energy production sector has to be avoided;
- -
Incineration has to be adopted for treating waste not suitable for the above-mentioned options;
- -
Disposal in landfill should be adopted only for waste that is not suitable for all the above-mentioned options.
Nevertheless, the most diffused approaches for the assessment of environmental sustainability are currently based on the quantification of the net emissions and resource consumption associated with the analyzed systems in relation to the specific context. At the current level of development, the proposed methodology is not able to return such information in a clear way, and this can represent a serious obstacle to its practical exploitation. Furthermore, another important piece of information necessary for enabling decision makers in making their decision is the effect that the variation in some parameters can have on the environmental performances of the considered system, i.e., on the value of the calculated indicators. This requirement can be satisfied by the evaluation of the uncertainty associated with the average value of such a calculated indicator.
For the above-mentioned reasons, further research is needed to better understand the suggested models and indicators’ potential to produce relevant and reliable information on the sustainability of processes, projects and plans implemented at the technosphere level. In particular, this requires improved (1) integration of entropy-based indicators with other methodologies for assessing environmental sustainability and impact, (2) application of entropy-based indicators beyond waste management, (3) development of new indicators for better fitting other specific processes and (4) uncertainty analysis.


