
Performance Measurement Systems in Continuous Improvement Environments: Obstacles to Their Effectiveness


Department of Production and Systems, Algoritmi Centre, University of Minho, 4800-058 Guimarães, Portugal
*
Author to whom correspondence should be addressed.
Sustainability 2023, 15(1), 867; https://doi.org/10.3390/su15010867
Submission received: 2 November 2022
/
Revised: 20 December 2022
/
Accepted: 29 December 2022
/
Published: 3 January 2023
(This article belongs to the Special Issue Towards Lean Production in Industry 4.0)
Abstract
:The implementation of an effective performance measurement system (PMS) is essential in organizations seeking continuous improvement and sustainability, especially in the context of Industry 4.0. However, a number of barriers/obstacles hampers this effectiveness. For example, the inclusion of performance indicators without practical use, or presenting absurd results, are frequent in the industry, leading people to distrust and devalue such systems. The main research question in this study is: What are the main obstacles to effective performance measurement systems in organizations? These obstacles will be identified and categorized, and some conditions required to eliminate/mitigate them will be explored. A systematic literature review is carried out, according to the PRISMA methodology, to identify the most frequent factors referred to as obstacles to PMS effectiveness, due to their negative influence on the implementation, use or maintenance of these systems. This review resulted in the identification of 175 obstacles that were then classified into 19 types of obstacles divided into 6 categories, whose definition was inspired by the 6M approach usually associated with Ishikawa diagrams. Then, the relationships between the obstacles are explored and investigated in order to identify interdependencies that may further influence the effectiveness of the PMS. Solutions and methodologies that can help mitigate/eliminate their impact on PMS effectiveness are also identified.
1. Introduction
Performance measurement and monitoring are fundamental factors for continuous improvement, management and sustainability in organizations. Regarding the continuous improvement effort, the collection and analysis of data, including performance data, on the current state of a production unit, allow the starting point for improvement to be described and represented, and enable the analyst to identify where the focus should be placed [1]. As organizations enter what is considered the fourth industrial revolution, the so-called Industry 4.0 (I4.0), the collection and processing of data become easier and more necessary, allowing better control and monitoring of performance [2]. The I4.0 represents an interesting opportunity to integrate and manage data, although different barriers and challenges arise from this digital transformation [3]. In fact, the generation and availability of large amounts of data, which is characteristic of I4.0 environments (big data), can quickly become a problem, as it tends to hinder the selection/obtainment of really useful information, namely key performance indicators (KPI), which are paramount elements of a PMS.
Performance measurement has been the focus of many organizations with the purpose of identifying the segments of industrial systems that need and should be improved. This interest on the part of the organizations is due to a growing market competition that requires them to continuously improve [4]. Continuous improvement, an important principle associated with Lean Thinking [5] as well as with other excellence models [6], can be described as a continued involvement of everyone in the organization in finding, targeting and eliminating waste [7]. As a way to maintain and improve their competitiveness, the organizations must focus on the continuous improvement of their processes in order to reduce their costs through the elimination of waste. When organizations are able to eliminate waste, namely defects, waits, overproduction, inventory, motion, transportation and overprocessing, they are able to produce the same outputs with less inputs [8]. I4.0 provides benefits for Lean Manufacturing, creating a new level of visibility and access to real-time performance data at various levels of operations [9]. The advantage of I4.0 in production is the fact that data about everything is available in real time, allowing a reduction in the duration of the decision-making process [10].
Performance data are a vital type of data to drive and manage performance improvement. However, the effective use and maintenance of a PMS is not straightforward and this can pose considerable challenges to organizations. According to Neely et al. [11], a PMS is a group of metrics used to quantify the effectiveness and efficiency of actions. Regarding the creation and implementation of a PMS, Bititci [12] jointly defines them as the process of (i) defining the targets, (ii) developing a set of performance metrics, and (iii) collecting, analyzing, reporting, interpreting and acting on performance data. Even though several models of PMSs are known, their implementation, use and maintenance continue to fail. The problem, which therefore leads to the real challenge for researchers/practitioners, seems to be the lack of an adequate approach to implement performance measures, integrate them in the organizational culture and use them for continuous improvement [13]. As, according to McCunn [14], 70% of the performance measurement projects fail, it is extremely important to identify why a PMS fails and what the obstacles are to PMS effectiveness. In this line of thought, the research question in this study is: What are the main obstacles to effective performance measurement systems in organizations? Only then can these failure modes be eliminated, or at least their impact can be mitigated, in order to improve the chances of success of a PMS. In order to eliminate or mitigate the impact of those obstacles, methodologies should be developed and integrated in a framework that, when followed, allows an effective development, implementation, use and maintenance of a PMS.
This paper is organized according to the following sections: Methods, Results, Discussion and Conclusion. In the Methods section are described the methods used to identify and classify the obstacles to the effectiveness of a PMS. In the Results section, the obstacles found are presented and classified, and then, in the Discussion section, their influence and cause–effect relationships are discussed. The last section provides the conclusion of the present study and provides directions for future research on the subject.
2. Methods
In order to determine the main obstacles to the effectiveness of a PMS, a systematic literature review (SLR) was performed. This SLR followed the methodology PRISMA (Preferred Reporting Items for Systematic reviews and Meta-Analysis) [15]. This methodology is characterized by a four-phase flow diagram: identification, screening, eligibility and included publications [15]. For the identification phase, a search was executed for scientific articles and book chapters on the Scopus and Web of Science databases. The search was made with the following restrictions: “performance measurement” in the keywords, publications cited in five or more articles and from the knowledge areas of Engineering, Management, Business, Social Sciences and Computer Science. This search resulted in the identification of 1787 publications from Scopus and 1728 from Web of Science databases.
The PRISMA methodology followed is described in Figure 1. After duplicates were removed, 2808 publications remained. Then, to identify the relevant publications, the title and keywords were analyzed. In this analysis, the publications that were not focused on a PMS were identified, and this resulted in the removal of 2550 publications. Of the remaining 258 publications, 176 were removed after analysis of the abstracts, due to their lack of connection to the PMS subject. Lastly, the 82 remaining publications were analyzed in detail, and the ones that referred to barriers, obstacles or difficulties in implementing and maintaining a PMS were selected, resulting in a final list of 31 publications to be considered for the analysis of the obstacles to PMS effectiveness.
The obstacles to PMS effectiveness described in the 31 publications were listed and then classified into categories. The method for defining these categories was inspired by the 6M approach (Method, Materials, Machines, Measurement, Man and Mother nature), typically used in the development/analysis of Ishikawa diagrams. On this basis, the following six categories of obstacles were defined:
- System (Method): related with the methods used to implement and maintain the PMS;
- Data (Material): problems related with data and information management;
- People (Man): issues related with the utilization of the PMS by people;
- Technology (Machines): related with the resources and tools needed to implement and maintain the PMS;
- Indicators (Measurement): problems related with performance measures and indicators;
- Culture (Mother Nature): issues related with the culture of the organization.
Because within each category several obstacles with different names but similar meanings were observed, it was necessary to create the concept of type of obstacle, intended to aggregate them under a single designation. Thus, a set of types of obstacles was created for each category.
3. Results
The conducted literature review identified 175 mentions of obstacles to the effectiveness of a PMS. Then, those obstacles were classified according to the proposed categories (Section 2), resulting in the distribution represented in Figure 2.
In Figure 2, one can observe that three categories, namely System, Indicators and People, represent almost 70% of the identified obstacles. In addition to this classification by category, as explained in Section 2, the obstacles were aggregated, according to their meaning, into types of obstacles. To accommodate the 175 obstacles found, all designations were semantically analyzed and grouped, resulting in the definition 19 types of obstacles.
As a way of presenting the categories and types of obstacles visually and in a simplified manner, an Ishikawa (fishbone) diagram was used, allowing the analysis of the relationship between the problem and its possible causes [16]. Figure 3 depicts the Ishikawa diagram for the problem “Failures in the implementation, use and maintenance of PMS”. In the main spines are represented the six categories, while the 19 types of obstacles identified are represented in the secondary spines. In front of each category and type of obstacle is the frequency with which it is referred to in the literature.
It can be seen in Figure 3 that the Indicators category, despite including only three types of obstacles, is the second most mentioned (43 mentions), close to the System category, which occupies the first place (46 mentions), but which is composed of six types of obstacles. There is thus a greater dispersion of mentions in the case of the System category. On the other hand, the lower dispersion of mentions in the Indicators category makes one of its types of obstacles the most mentioned of all (inappropriate indicators, with 35 mentions). Figure 4 shows the types of obstacles, in descending order of the frequency with which they are mentioned in the literature.
In the first five positions, only the System category occurs twice, although its accumulated number of mentions (30) is lower than that of the most mentioned type of obstacle: inappropriate indicators. In general terms, it can be seen that slightly more than 30% of the types of obstacles correspond to 62% of the total number of mentions. The findings concerning the likely links between the types of obstacles to PMS effectiveness, as well as possible conditions required to eliminate or mitigate their impact, are discussed in the next section.
4. Discussion
This section presents, for each of the identified categories and for each type of obstacle, the obstacles identified in the literature review. It also attempts to identify how a type of obstacle can emerge and how different types of obstacles can influence each other.
4.1. System
Within the System category, six types of obstacles were identified (Figure 3):
- 1.
- Lack of connection to the strategy: This can be an obstacle to the effective functioning of a PMS and can originate in three ways:
- a.
- b.
- c.
- 2.
- Lack of use for improvement: Not using the PMS for continuous improvement makes it useless; it should be used as a support tool for the daily management of the organization [22]. The PMS alone will not translate into automatic improvements; it only allows identifying where improvements can and should be made [20,27]. If it does not have an effective improvement process associated with it, it will become irrelevant to the people in the organization [28,29,30,31].
- 3.
- Issues on target definitions: This factor arises from the difficulty in defining targets and comparing performance with them [32]. Failure to define targets will impact people’s motivation and the ability of the PMS to be used for the continuous improvement of the organization. This failure may occur when targets are not based on stakeholder interests, process boundaries and process improvement resources [29]. It may also occur if there is not a correct deployment of objectives from the top level of the organization to the level where the real improvement activities reside [29].
- 4.
- Unclear system: vagueness in the performance measurement system can lead to a different use of the PMS from what was intended, dooming it to failure. This lack of clarity can arise in several aspects of the PMS:
- a.
- Failure to define measurement frequency: performance measurement occurs too often or too rarely [23];
- b.
- c.
- Failures in the definition of the PMS: the system has not yet reached the maturity (full definition) required to be implemented [22,33] and there may be failures in the definition of operational performance, in relating performance to the process, in defining the boundaries of the process [13]. There may also be vagueness related to the hierarchical structure and its deployment in the PMS [25,31,33,34] causing uncertainty of responsibility on performance measurement [35]. One of the causes mentioned is the direct use of another existing PMS model [14] which results in a PMS that is not adjusted to the organization [19].
- 5.
- Communication system: Communication of performance measurement to employees plays an important role in involving employees in the PMS and maintaining its relevance. It is essential to ensure good communication between those who report and those who use the metrics [36]. This communication fails when it is not clear, simple, periodic and formal [19]. In order to be simpler, it must be visual [31]. Equally acting as an obstacle to the implementation and maintenance of a PMS is the fact that new processes and their impacts are not explained to employees [35], which can lead to a lack of commitment and lack of awareness.
- 6.
- Complexity: The more complex a system is, the more difficult it is to manage, the more resources and effort it takes to maintain it [14]. The complexity can also make it more difficult to communicate the system and its processes to employees, making their involvement more difficult.
4.2. Indicators
Within the Indicators category, three types of obstacles were identified (Figure 3):
- 1.
- Inappropriate indicators: Performance indicators can be one of the factors that hinder the implementation, use and maintenance of a PMS, being pointed out as main reasons:
- a.
- b.
- c.
- Outdated indicators: historical indicators with dated and irrelevant information [39];
- d.
- Indicators that promote wrong behavior: indicators that promote wrong performance, indicators of courtesy instead of indicators of performance, indicators of behavior instead of indicators of achievement, and indicators that encourage competition rather than teamwork [37];
- e.
- f.
- g.
- h.
- 2.
- 3.
4.3. People
Within the People category, four types of obstacles were identified (Figure 3):
- 1.
- False expectations: the expectations created by people regarding the PMS can represent an obstacle to maintaining it because they can be disappointed [42]. The organization will not improve just because the PMS has been implemented. An effective improvement process must be associated with it. If only performance is measured and nothing is achieved to improve it, the PMS can be abandoned, as it will not respond to false expectations of automatic improvement.
- 2.
- Lack of resources or capacity: for an effective implementation and maintenance of a PMS, it is essential that employees are educated and trained, with all the necessary skills, to understand and use the PMS correctly. The lack of training or understanding of the PMS represents an obstacle to its implementation and maintenance [14,21], [28,38,41,43] as it can lead to an incorrect use of the PMS, leading to its distortion and consequent abandonment.
- 3.
- Employee Commitment/Involvement: this involvement can fail when there is fear of performance measurement [13], which can result in increased resistance to the implementation and use of the PMS [20,39] and/or manipulation of the performance data [24,44]. Failure to motivate employees to use the PMS means that there is no commitment to change [34], and if the PMS is not relevant to people [19,30] resistance to its use increases [22,38], condemning it to failure. Conflicts and friction between employees may also arise as a result of performance measurement [35].
- 4.
- Lack of indicator understanding: the non-understanding of performance indicators by employees may result from indicators that are not relevant to people [24], lack of training of employees to use the PMS [19] or high complexity in communicating information [35]. This can lead to a misuse of performance indicators through an incorrect interpretation of the meaning of the indicators [13]. Poor understanding of indicators can also lead to increase the resistance to use them [26,31].
4.4. Culture
Within the Culture category, three types of obstacles were identified (Figure 3):
- 1.
- Blame culture: using a PMS as a tool to coerce employees is referred thirteen times. Using performance measurement as a way of control and to put pressure on employees will create a blame culture [13,14,28,33,35,42], that will make the employees feel threatened [27,30,31,40,45]. This is one of the causes for the resistance of the employees to the PMS and for their lack of involvement in these practices [31]. In organizations with a blame culture, the PMS will not be used as tool to enable continuous improvement, and it may become a tool for punishing errors [19].
- 2.
- Lack of commitment from top management: the lack of commitment from top management with the PMS [14,20,21,31,34,41], or the fact that it is considered a low priority [19,22] can convey the message to other employees that the PMS is not important. Additionally, a wrong comprehension or utilization of information by the top management [13,38] can pass the message to the rest of the organization that the top management is not fully committed to the PMS.
- 3.
4.5. Technology
Within the Culture category, two types of obstacles were identified (Figure 3):
- 1.
- Inadequate IT tools: the lack of adequate IT tools represents an obstacle to the implementation and maintenance of a PMS [33,35,36] because it can lead to increased difficulty in collecting, analyzing and presenting data. This difficulty causes an increase in the time and resources required to implement and maintain the PMS.
- 2.
- Time and resources required: the time and resources required to implement and maintain a PMS can represent an important obstacle to its effectiveness [17,20,45]. Required resources can be underestimated by top management causing a lack of resources allocated to the PMS [14,34]. The organization may be limited in terms of the costs and resources it can allocate to the PMS [21,22,24,39,41,42,43]. Due to the lack of resources allocated to the PMS, this can be seen as a burden for the organization because it removes employees from their real responsibilities [42].
4.6. Data
As for the Data category, just one type of obstacle was identified:
- 1.
- Difficulty in collecting, analyzing and presenting data: can occur for the following reasons:
- a.
- b.
- c.
- d.
In Figure 5, it is possible to identify the 19 types of obstacles and the interactions between them. Each circle represents one type of obstacle: in red are the obstacles from the category Culture, in blue from System, in green from Technology, in light blue from Data, in yellow from People and in dark blue from Indicators. The arrows express the probable cause–effect relationships between different obstacles. It is possible to observe, for example, that eight of these obstacles can be a cause for the lack of employee involvement.
5. Conclusions
This study was centered on the research question “What are the main obstacles to effective performance measurement systems in organizations?”. The identification of those obstacles allows the establishment of the basis for future work that aims to explore how to create conditions to eliminate/mitigate them, allowing to implement, use and maintain a PMS effectively.
In the systematic literature review conducted, 175 references of obstacles to PMS effectiveness were identified. Those 175 referred obstacles were grouped, according to their similar meaning, into 19 types of obstacles. They were also classified into six different categories, namely: System, Indicators, People, Culture, Technology and Data. The identification of the types of obstacles to the effectiveness of a PMS should be the starting point to the process of eliminating or at least mitigating their impact.
As discussed previously, the relation between the obstacles identified can be complex. The failure of a PMS can result from one or from the combination of several of the obstacles identified. Accordingly, in order to maximize the odds of achieving an effective PMS, methodologies and techniques that eliminate or at least mitigate the impact of the obstacles must be developed and used.
I4.0 can help mitigate some of the obstacles to the effectiveness of a PMS, especially those related with the collection, analysis and reporting of data, through the digital transformation that enables an automatized real-time collection, analysis and reporting of data. On the other hand, for an organization to be able to move toward I4.0, an effective PMS already implemented is required, since performance measurement makes it possible to create the visibility required in a matured I4.0 organization.
The first requirement to implement a PMS is related with the organizational culture. The culture of the organization is the foundation for the implementation and continuous use of a PMS. The organization must have a culture of respect for people and continuous improvement instead of a culture of punishment, and there must be commitment from the top management to performance measurement and improvement. These cultural characteristics are also mentioned by Amaro [46] as requirements for a sustainable Lean implementation, where behaviors of learning, improvement, adaptability, innovation, striving for new challenges, being open-minded and not blaming others are essential. Moreover, as way for motivating and encouraging improvement, a robust reward system must be in place. This reward system must issue rewards when targets are achieved and indicate when they are not. The reward system can have a financial component, but most important is to recognize where and when improvement is being achieved and where and when it is failing.
It is essential that the system is robust and well-defined. When developing and defining a PMS, one must be sure that the organization’s strategy deployment is robust. One way of keeping all organizations aligned with the strategy is through the use of Hoshin Kanri, a process for strategy deployment. If the PMS is properly linked with the organizational strategy, it is easier to define what is essential to measure and what are the goals. It also allows keeping the PMS simple, only measuring what matters to the organization.
The deployment of both indicators and targets through the different levels of the organization is essential to involve and motivate all the employees. The PMS should be made a tool to help people with their work instead of being an extra task or bureaucracy.
The performance indicators should be appropriate to all the stakeholders; for that, the recommendations of the ISO 22400:2014 can be followed, an international standard related with key performance indicators for manufacturing operations management. The set of indicators should be balanced and the influences that each one has on another should be explicit and well documented as way to avoid problems with concurrent indicators.
The collection, analysis and reporting of data can be managed by the use of appropriate IT tools. That will depend on the complexity of the system and the amount of data that needs to be managed. In some cases, a set of automated and interconnected spreadsheets, with dashboards, can be the appropriate tool.
As further investigation on this subject, recommendations that emerge as ways to eliminate or mitigate the obstacles to PMS effectiveness should be made. Those recommendations must be associated with methodologies and techniques that can be grouped and integrated in a model, resulting in a step-by-step guide that makes it possible to implement, use and maintain a PMS successfully.
The main limitations of this study are the size and type of sample used in the systematic literature review. The number of publications is limited to only 31 from where 175 references of the obstacles are drawn. Moreover, the type of sample did not take into account publications cited less than five times. This could have kept valid publications on this subject out of this study, as may have been the case with newer publications that may have not reached five citations at the time when the systematic literature review was performed.
Author Contributions
Conceptualization, F.C., J.D.-C. and R.M.S.; methodology, F.C., J.D.-C. and R.M.S.; validation, F.C., J.D.-C. and R.M.S.; formal analysis, F.C.; investigation, F.C.; data curation, F.C.; writing—original draft preparation, F.C.; writing—review and editing, F.C., J.D.-C. and R.M.S.; supervision, J.D.-C. and R.M.S. All authors have read and agreed to the published version of the manuscript.
Funding
This research received no external funding.
Data Availability Statement
Not applicable.
Acknowledgments
This work has been supported by FCT—Fundação para a Ciência e Tecnologia within the R&D Units Project Scope: UIDB/00319/2020.
Conflicts of Interest
The authors declare no conflict of interest.
References
- Imai, M. Gemba Kaizen, 2nd ed.; McGraw-Hill: New York, NY, USA, 1997. [Google Scholar]
- Shin, W.S.; Dahlgaard, J.J.; Dahlgaard-Park, S.M.; Kim, M.G. A Quality Scorecard for the era of Industry 4.0. Total Qual. Manag. Bus. Excell. 2018, 29, 959–976. [Google Scholar] [CrossRef]
- Ante, G.; Facchini, F.; Mossa, G.; Digiesi, S. Developing a key performance indicators tree for lean and smart production systems. IFAC-PapersOnLine 2018, 51, 13–18. [Google Scholar] [CrossRef]
- Muhammad, U.; Ferrer, B.R.; Mohammed, W.M.; Lastra, J.L.M. An approach for implementing key performance indicators of a discrete manufacturing simulator based on the ISO 22400 standard. In Proceedings of the 2018 IEEE Industrial Cyber-Physical Systems (ICPS), Saint Petersburg, Russia, 15–18 May 2018; pp. 629–636. [Google Scholar] [CrossRef]
- Womack, J.; Jones, D. Lean Thinking: Banish Waste and Create Wealth in Your Corporation; Simon & Schuster: New York, NY, USA, 1996. [Google Scholar]
- Dinis-Carvalho, J.; Macedo, H. Toyota Inspired Excellence Models. IFIP Adv. Inf. Commun. Technol. 2021, 610, 235–246. [Google Scholar] [CrossRef]
- Gupta, S.; Jain, S.K. A literature review of lean manufacturing. Int. J. Manag. Sci. Eng. Manag. 2013, 8, 241–249. [Google Scholar] [CrossRef]
- Kaplan, R.S.; Norton, D.P. The Balanced Scorecard Translating Strategy into Action; Harvard Business School Press: Boston, MA, USA, 1996. [Google Scholar]
- Rossi, A.H.G.; Marcondes, G.B.; Pontes, J.; Leitão, P.; Treinta, F.T.; De Resende, L.M.M.; Mosconi, E.; Yoshino, R.T. Lean Tools in the Context of Industry 4.0: Literature Review, Implementation and Trends. Sustainability 2022, 14, 12295. [Google Scholar] [CrossRef]
- Nagy, J.; Oláh, J.; Erdei, E.; Máté, D.; Popp, J. The Role and Impact of Industry 4.0 and the Internet of Things on the Business Strategy of the Value Chain—The Case of Hungary. Sustainability 2018, 10, 3491. [Google Scholar] [CrossRef] [Green Version]
- Neely, A.; Gregory, M.; Platts, K. Performance measurement system design: A literature review and research agenda. Int. J. Oper. Prod. Manag. 1995, 15, 80–116. [Google Scholar] [CrossRef]
- Bititci, U.S. Managing Business Performance; Wiley: New York, NY, USA, 2015. [Google Scholar]
- Zairi, M. Measuring Performance for Business Results; Springer Science & Business Media: Berlin/Heidelberg, Germany, 1994. [Google Scholar]
- McCunn, P. The Balanced Scorecard...the Eleventh Commandment. Manag. Account. 1998, 76, 34–36. Available online: https://www.proquest.com/trade-journals/balanced-scorecard-eleventh-commandment/docview/195676560/se-2?accountid=39260 (accessed on 31 May 2022).
- Moher, D.; Liberati, A.; Tetzlaff, J.; Altman, D.G.; Group, T.P. Preferred Reporting Items for Systematic Reviews and Meta-Analyses: The PRISMA Statement. PLoS Med. 2009, 6, 2–3. [Google Scholar] [CrossRef] [Green Version]
- Liliana, L. A new model of Ishikawa diagram for quality assessment. In IOP Conference Series: Materials Science and Engineering; IOP Publishing: Bristol, UK, 2016; Volume 161. [Google Scholar] [CrossRef]
- Bourne, M.; Neely, A.; Platts, K.; Mills, J. The success and failure of performance measurement initiatives: Perceptions of participating managers. Int. J. Oper. Prod. Manag. 2002, 22, 1288–1310. [Google Scholar] [CrossRef] [Green Version]
- Watts, T.; McNair-Connolly, C.J. New performance measurement and management control systems. J. Appl. Account. Res. 2012, 13, 226–241. [Google Scholar] [CrossRef] [Green Version]
- Franco, M.; Bourne, M. Factors that play a role in ‘managing through measures. Manag. Decis. 2003, 41, 698–710. [Google Scholar] [CrossRef]
- Bourne, M. Handbook of Performance Measurement; GEE Publishing: London, UK, 2004. [Google Scholar]
- Charan, P.; Shankar, R.; Baisya, R.K. Modelling the barriers of supply chain performance measurement system implementation in the Indian automobile supply chain. Int. J. Logist. Syst. Manag. 2009, 5, 614–630. [Google Scholar] [CrossRef]
- de Waal, A.A.; Counet, H. Lessons learned from performance management systems implementations. Int. J. Product. Perform. Manag. 2009, 58, 367–390. [Google Scholar] [CrossRef]
- Franceschini, F.; Galetto, M.; Maisano, D. Management by Measurement: Designing Key Indicators and Performance Measurement Systems; SpingerScience & Business Media: Berlin/Heidelberg, Germany, 2007. [Google Scholar]
- Ghalayini, A.M.; Noble, J.S. The changing basis of performance measurement. Int. J. Oper. Prod. Manag. 1996, 16, 63–80. [Google Scholar] [CrossRef]
- Dixon, J.R.; Nanni, A.J.; Vollmann, T.E. The New Performance Challenge; Dow Jones-Irwin: New York, NY, USA, 1990. [Google Scholar]
- Hatten, K.J.; Rosenthal, S.R. Why-and How-to Systematize Performance Measurement. J. Organ. Excell. 2001, 20, 59–73. [Google Scholar] [CrossRef]
- Bourne, M.; Neely, A.; Mills, J.; Platts, K. Why some performance measurement initiatives fail: Lessons from the change management literature. Int. J. Bus. Perform. Manag. 2003, 5, 245–269. [Google Scholar] [CrossRef]
- Kennerley, M.; Neely, A. A framework of the factors affecting the evolution of performance measurement systems. Int. J. Oper. Prod. Manag. 2002, 22, 1222–1245. [Google Scholar] [CrossRef] [Green Version]
- Schneiderman, A.M. Why balanced scorecards fail. J. Strateg. Perform. Meas. 1999, 2, 6–11. [Google Scholar]
- Neely, A.; Bourne, M. Why Measurement Initiatives Fail. Meas. Bus. Excell. 2000, 4, 3–7. [Google Scholar] [CrossRef]
- Meekings, A. Unlocking the potential of performance measurement: A practical implementation guide. Public Money Manag. 1995, 15, 5–12. [Google Scholar] [CrossRef]
- Giovannoni, E.; Maraghini, M.P. The challenges of integrated performance measurement systems: Integrating mechanisms for integrated measures. Account. Audit. Account. J. 2013, 26, 978–1008. [Google Scholar] [CrossRef]
- Bititci, U.; Garengo, P.; Dörfler, V.; Nudurupati, S. Performance Measurement: Challenges for Tomorrow. Int. J. Manag. Rev. 2012, 14, 305–327. [Google Scholar] [CrossRef] [Green Version]
- Townley, B.; Cooper, D.J.; Oakes, L. Performance Measures and the Rationalization of Organizations. Organ. Stud. 2003, 24, 1045–1071. [Google Scholar] [CrossRef]
- Okwir, S.; Nudurupati, S.S.; Ginieis, M.; Angelis, J. Performance measurement and management systems: A perspective from complexity theory. Int. J. Manag. Rev. 2018, 20, 731–754. [Google Scholar] [CrossRef] [Green Version]
- Lohman, C.; Fortuin, L.; Wouters, M. Designing a performance measurement system: A case study. Eur. J. Oper. Res. 2004, 156, 267–286. [Google Scholar] [CrossRef]
- Brown, M.G. Keeping Score: Using the Right Metrics to Drive World-Class Performance; CRC Press: Boca Raton, FL, USA, 1996. [Google Scholar]
- Radu-Alexandru, Ș.; Mihaela, H. Performance Management Systems—Proposing and Testing a Conceptual Model. Stud. Bus. Econ. 2019, 14, 231–244. [Google Scholar] [CrossRef] [Green Version]
- Nudurupati, S.S.; Bititci, U.S.; Kumar, V.; Chan, F.T.S. State of the art literature review on performance measurement. Comput. Ind. Eng. 2011, 60, 279–290. [Google Scholar] [CrossRef] [Green Version]
- Wouters, M.; Wilderom, C. Developing performance-measurement systems as enabling formalization: A longitudinal field study of a logistics department. Account. Organ. Soc. 2008, 33, 488–516. [Google Scholar] [CrossRef]
- Sousa, S.D.; Aspinwall, E.M.; Rodrigues, A.G. Performance measures in English small and medium enterprises: Survey results. Benchmarking Int. J. 2006, 13, 120–134. [Google Scholar] [CrossRef]
- Gabris, G.T. Recognizing Management Technique Dysfunctions: How Management Tools Often Create More Problems than They Solve. Public Product. Rev. 1986, 10, 3–19. [Google Scholar] [CrossRef]
- da Costa, M.L.R.; de Souza Giani, E.G.; Galdamez, E.V.C. Vision of the balanced Scorecard in micro, small and medium enterprises. Sist. Gestão 2019, 14, 131–141. [Google Scholar] [CrossRef]
- Simons, R. Control in an Age of Empowerment; Harvard Business Review Press: Boston, MA, USA, 1995. [Google Scholar]
- Bourne, M. Researching performance measurement system implementation: The dynamics of success and failure. Prod. Plan. Control 2005, 16, 101–113. [Google Scholar] [CrossRef]
- Amaro, P. The Integration of Lean Thinking in the Culture of Portuguese Organizations: Enablers and Inhibitors; University of Minho: Braga, Portugal, 2022. [Google Scholar]
Figure 1.
PRISMA methodology followed.

Figure 2.
Distribution of obstacles by category.

Figure 3.
Ishikawa diagram with the obstacles to PMS effectiveness.
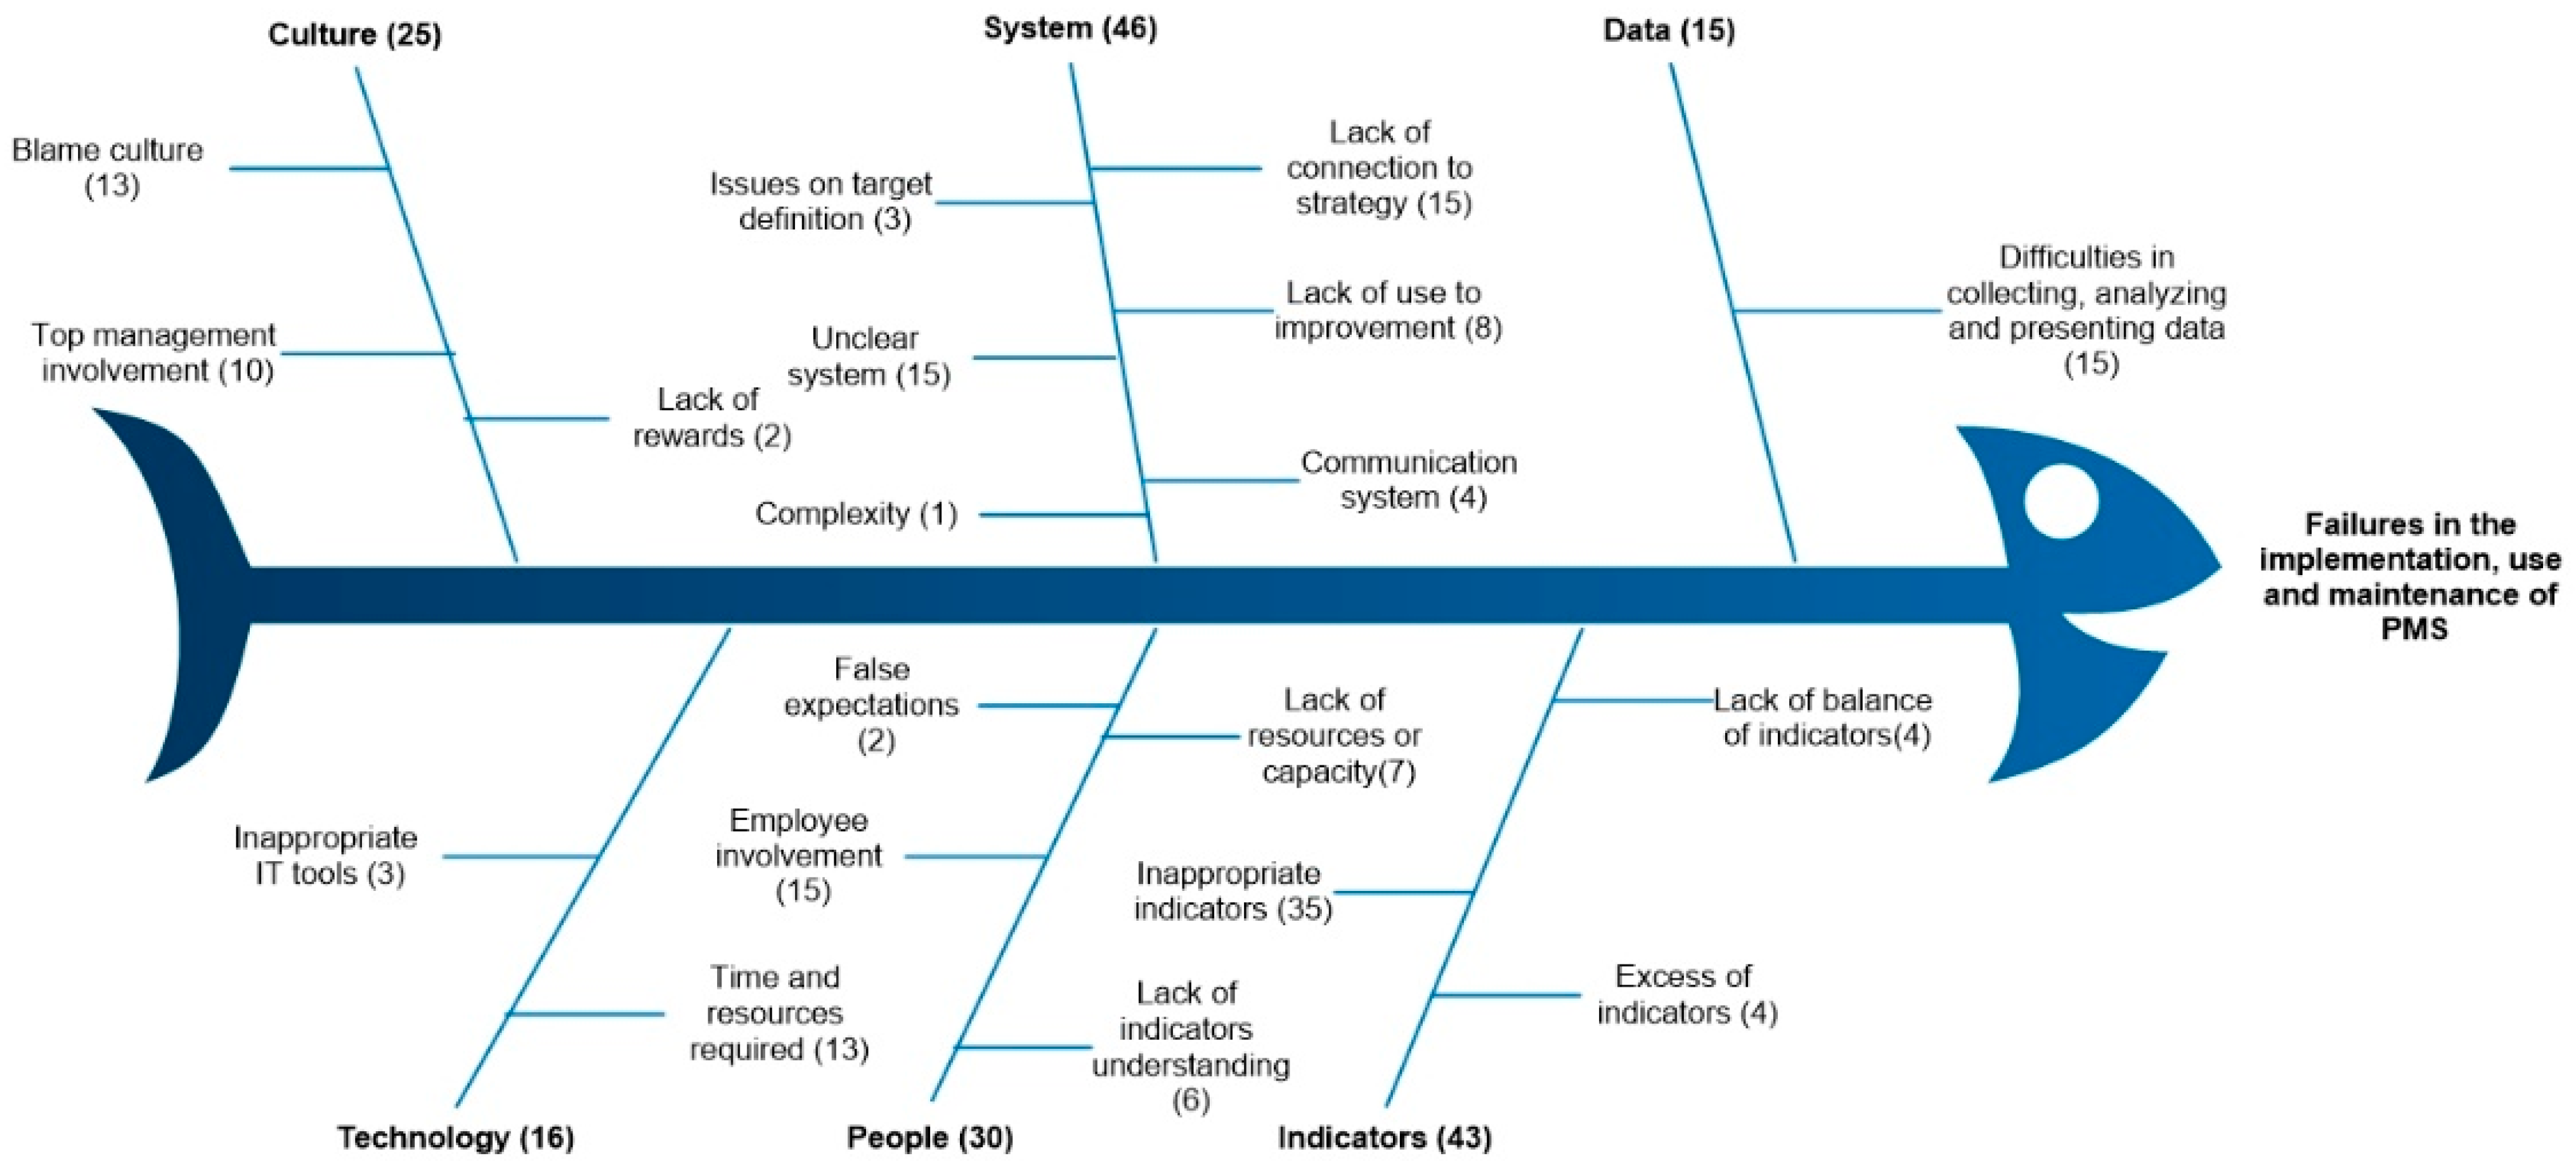
Figure 4.
Types of obstacles and the frequency they are referred to in the literature.

Figure 5.
Interaction between the types of obstacles.

Disclaimer/Publisher’s Note: The statements, opinions and data contained in all publications are solely those of the individual author(s) and contributor(s) and not of MDPI and/or the editor(s). MDPI and/or the editor(s) disclaim responsibility for any injury to people or property resulting from any ideas, methods, instructions or products referred to in the content. |
© 2023 by the authors. Licensee MDPI, Basel, Switzerland. This article is an open access article distributed under the terms and conditions of the Creative Commons Attribution (CC BY) license (https://creativecommons.org/licenses/by/4.0/).
Share and Cite
MDPI and ACS Style
Cunha, F.; Dinis-Carvalho, J.; Sousa, R.M. Performance Measurement Systems in Continuous Improvement Environments: Obstacles to Their Effectiveness. Sustainability 2023, 15, 867. https://doi.org/10.3390/su15010867
AMA Style
Cunha F, Dinis-Carvalho J, Sousa RM. Performance Measurement Systems in Continuous Improvement Environments: Obstacles to Their Effectiveness. Sustainability. 2023; 15(1):867. https://doi.org/10.3390/su15010867
Chicago/Turabian StyleCunha, Flávio, José Dinis-Carvalho, and Rui M. Sousa. 2023. "Performance Measurement Systems in Continuous Improvement Environments: Obstacles to Their Effectiveness" Sustainability 15, no. 1: 867. https://doi.org/10.3390/su15010867
Note that from the first issue of 2016, this journal uses article numbers instead of page numbers. See further details here.