
Assessment of Soil Pollution with Presumably Contaminating Elements in Moscow Recreational Areas Using Instrumental Neutron Activation Analysis
 , , , , and
Abstract
:1. Introduction
- (i)
- To obtain more information concerning the geochemistry of investigated top soil layers regarding both major, rock-forming elements as well as some incompatible and low miscible trace elements in order to infer the origin of mineral components of the considered soils;
- (ii)
- To evidence any similarities or dissimilarities existing between the first two layers of the top soil, i.e., 0–5 cm and 5–20 cm, and to quantify their contamination degree.
2. Materials and Methods
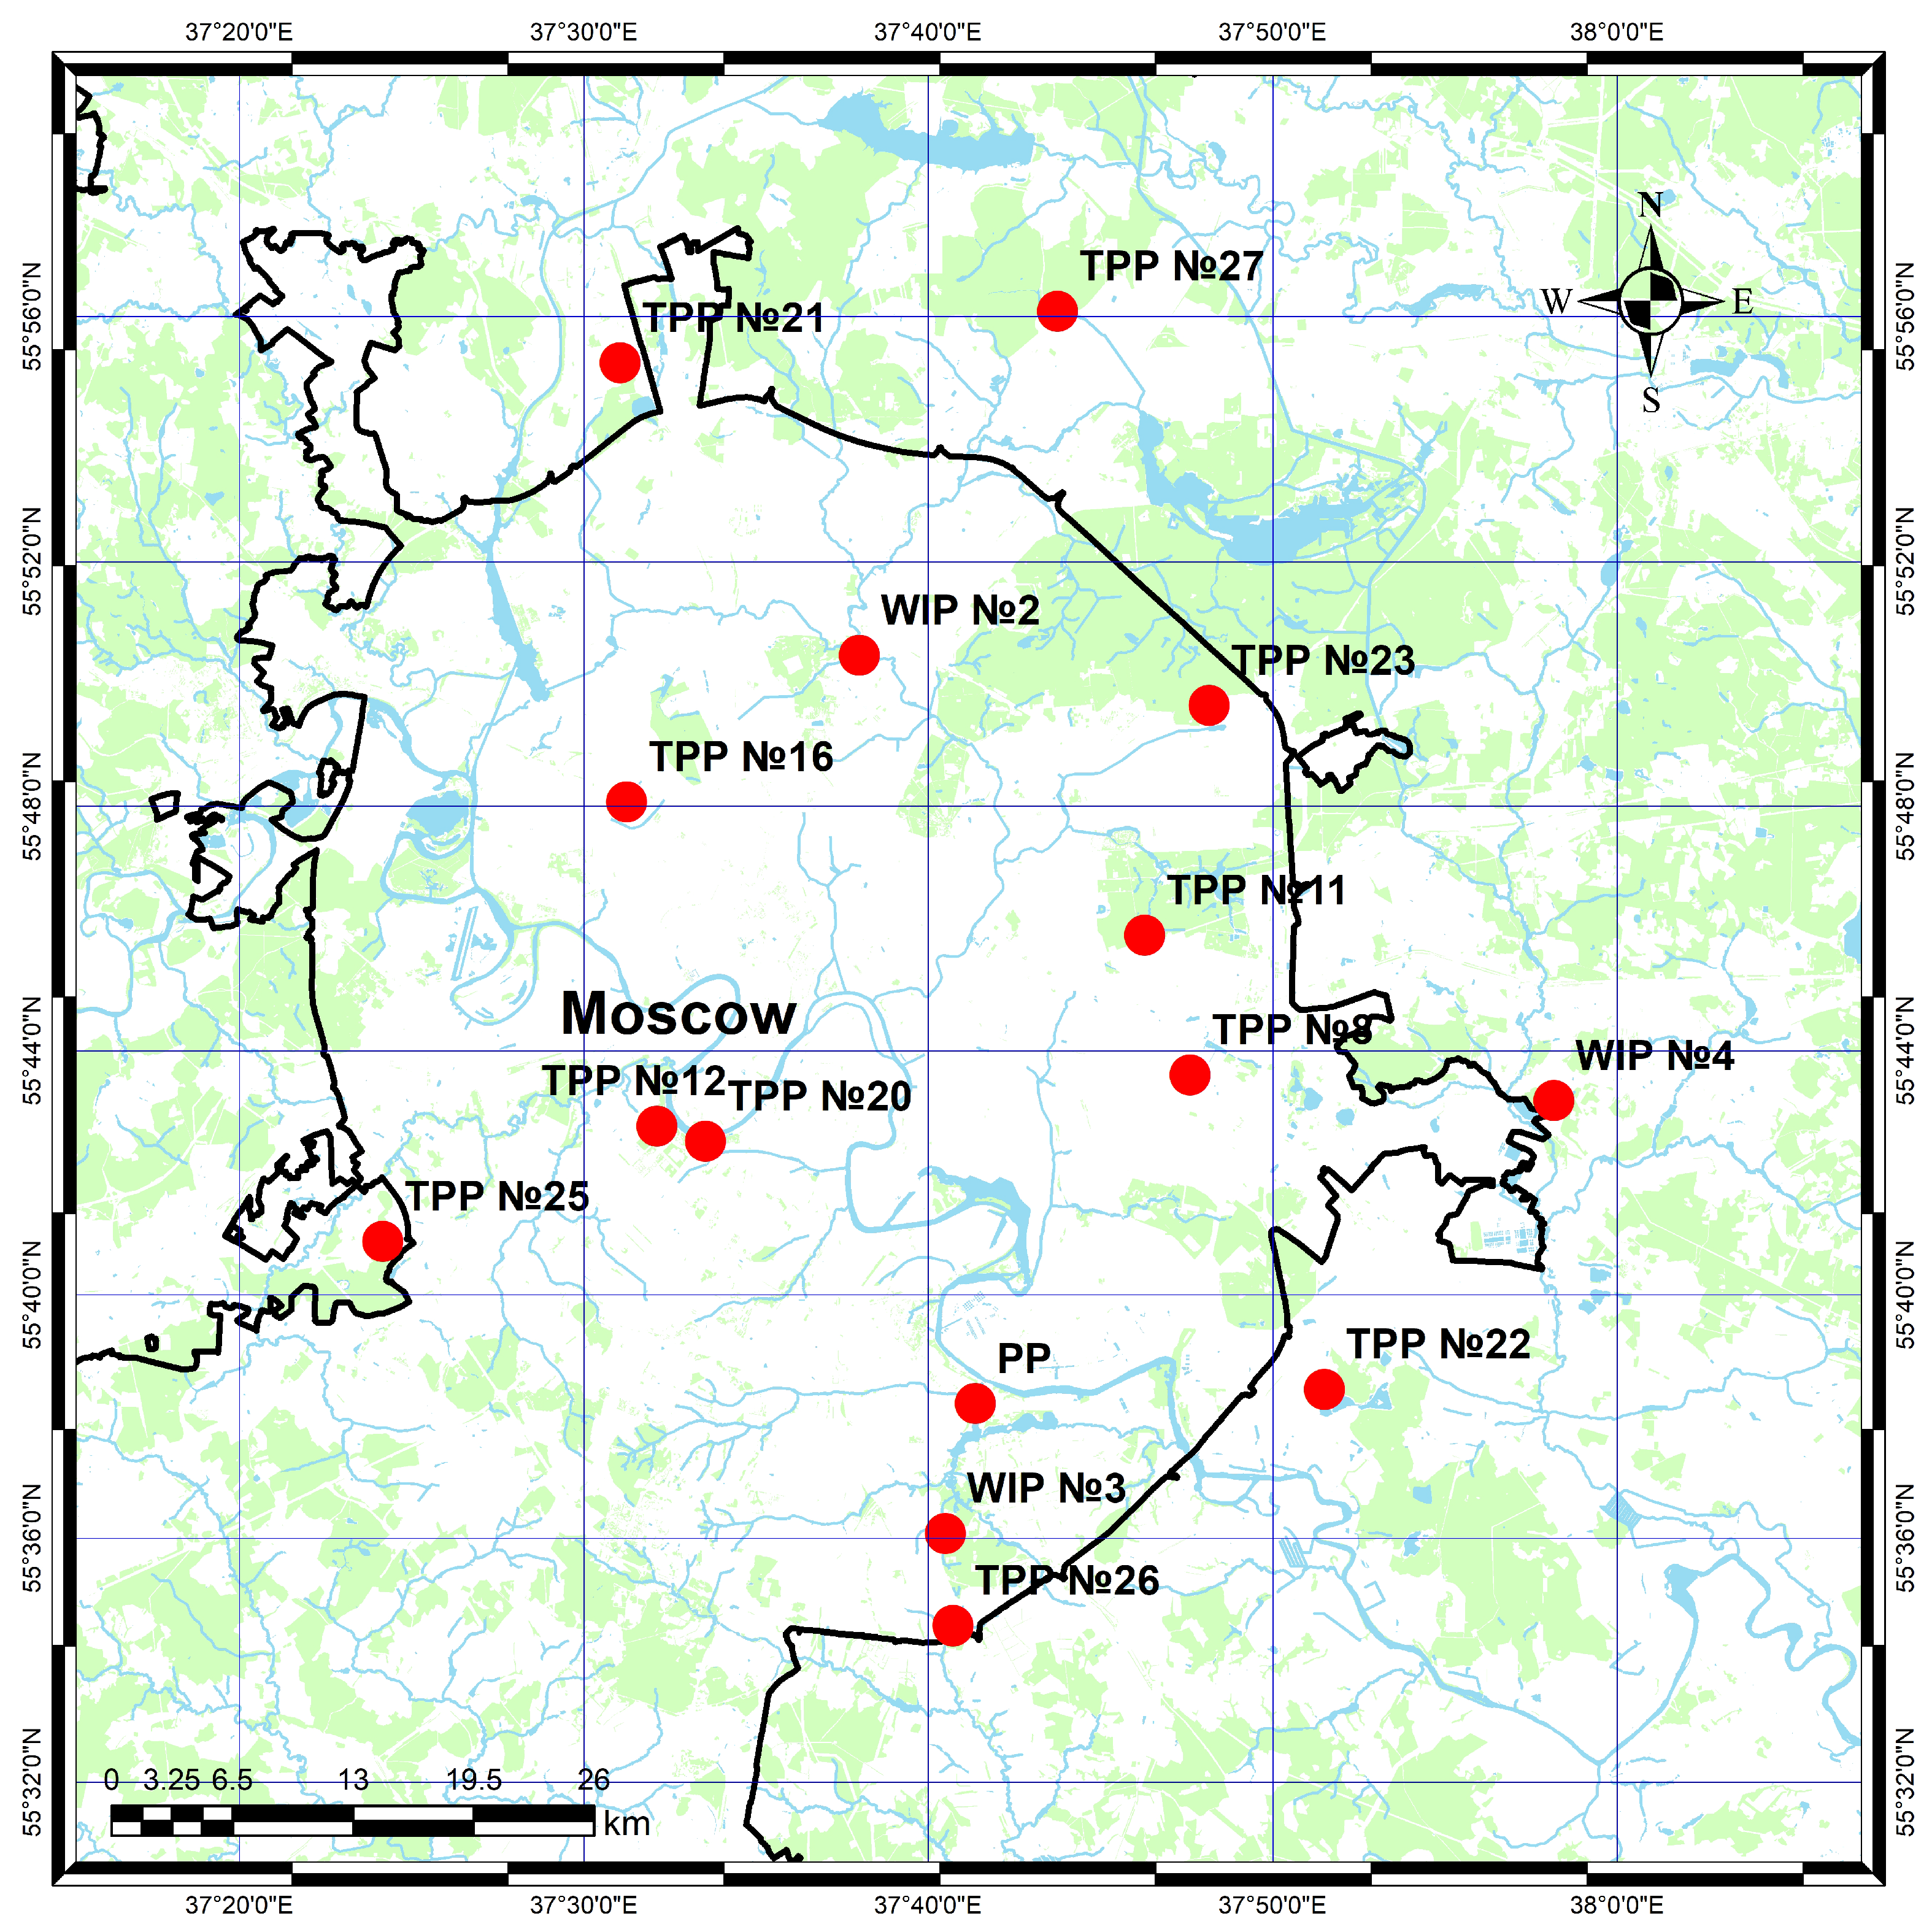
2.1. Sampling
2.2. Determination of the Soil Samples’ Elemental Composition
2.3. Ecological Indices
2.4. Statistic Data Analysis
3. Results and Discussion
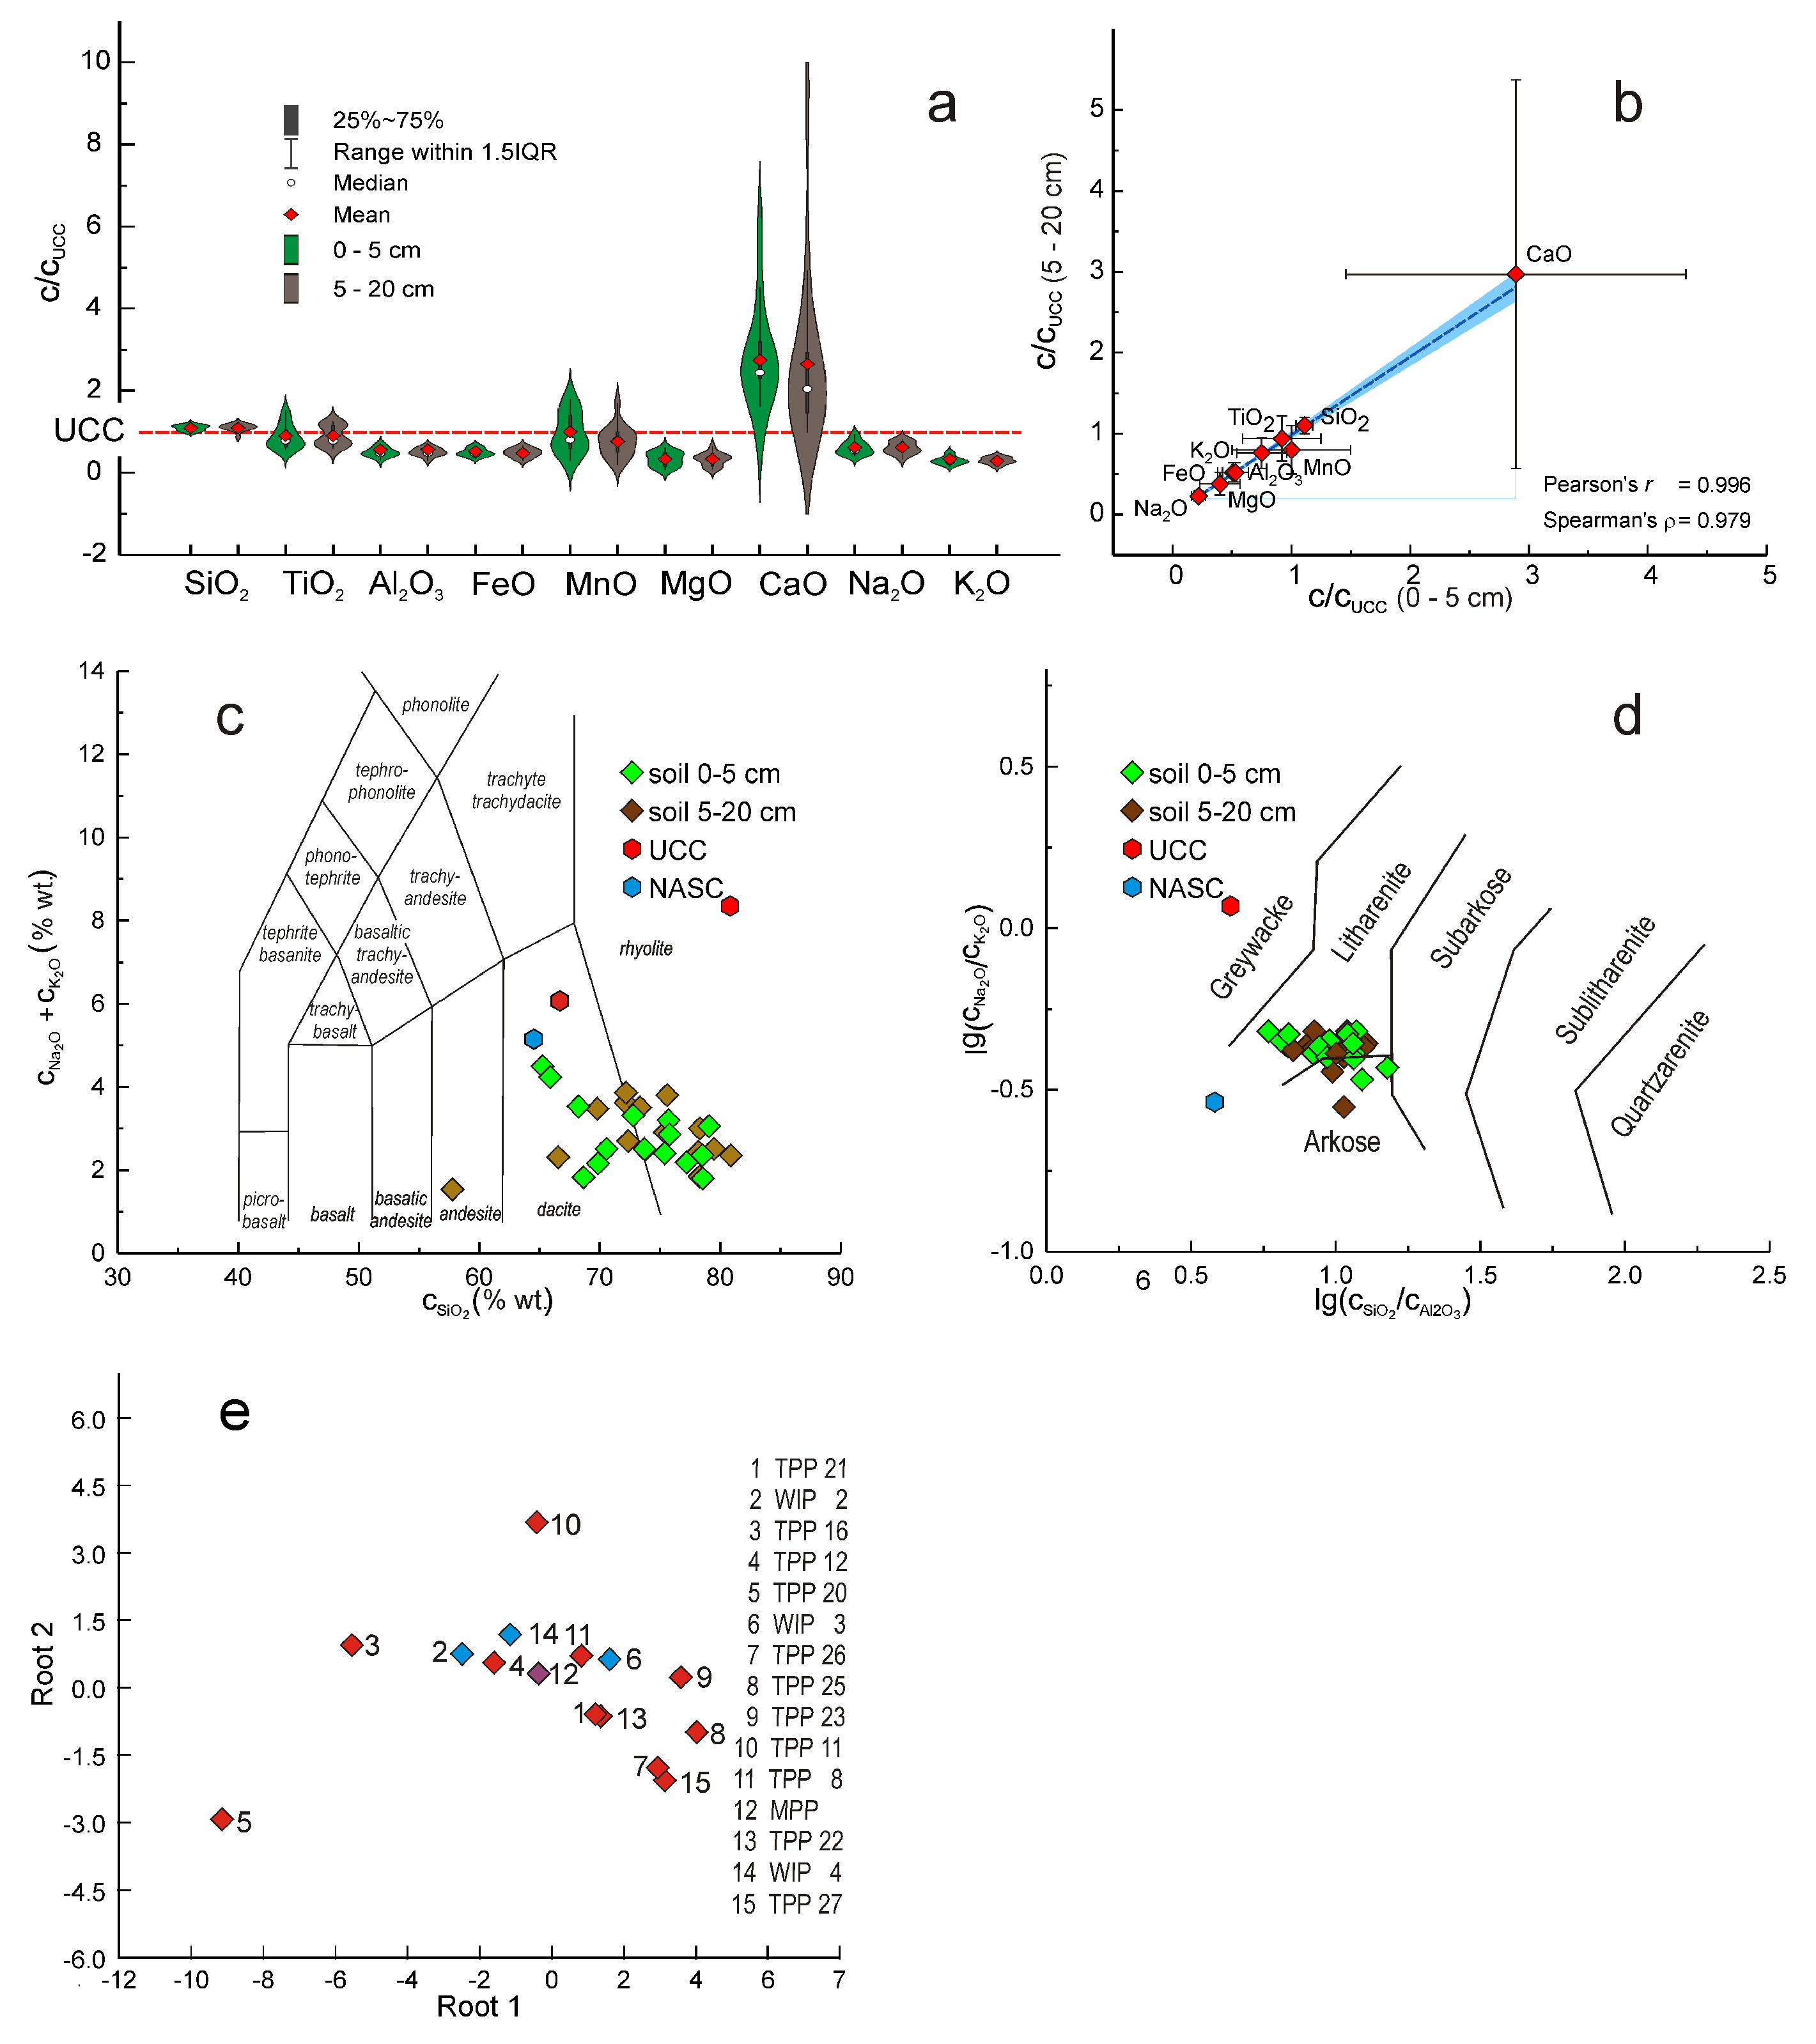
3.1. Major Elements
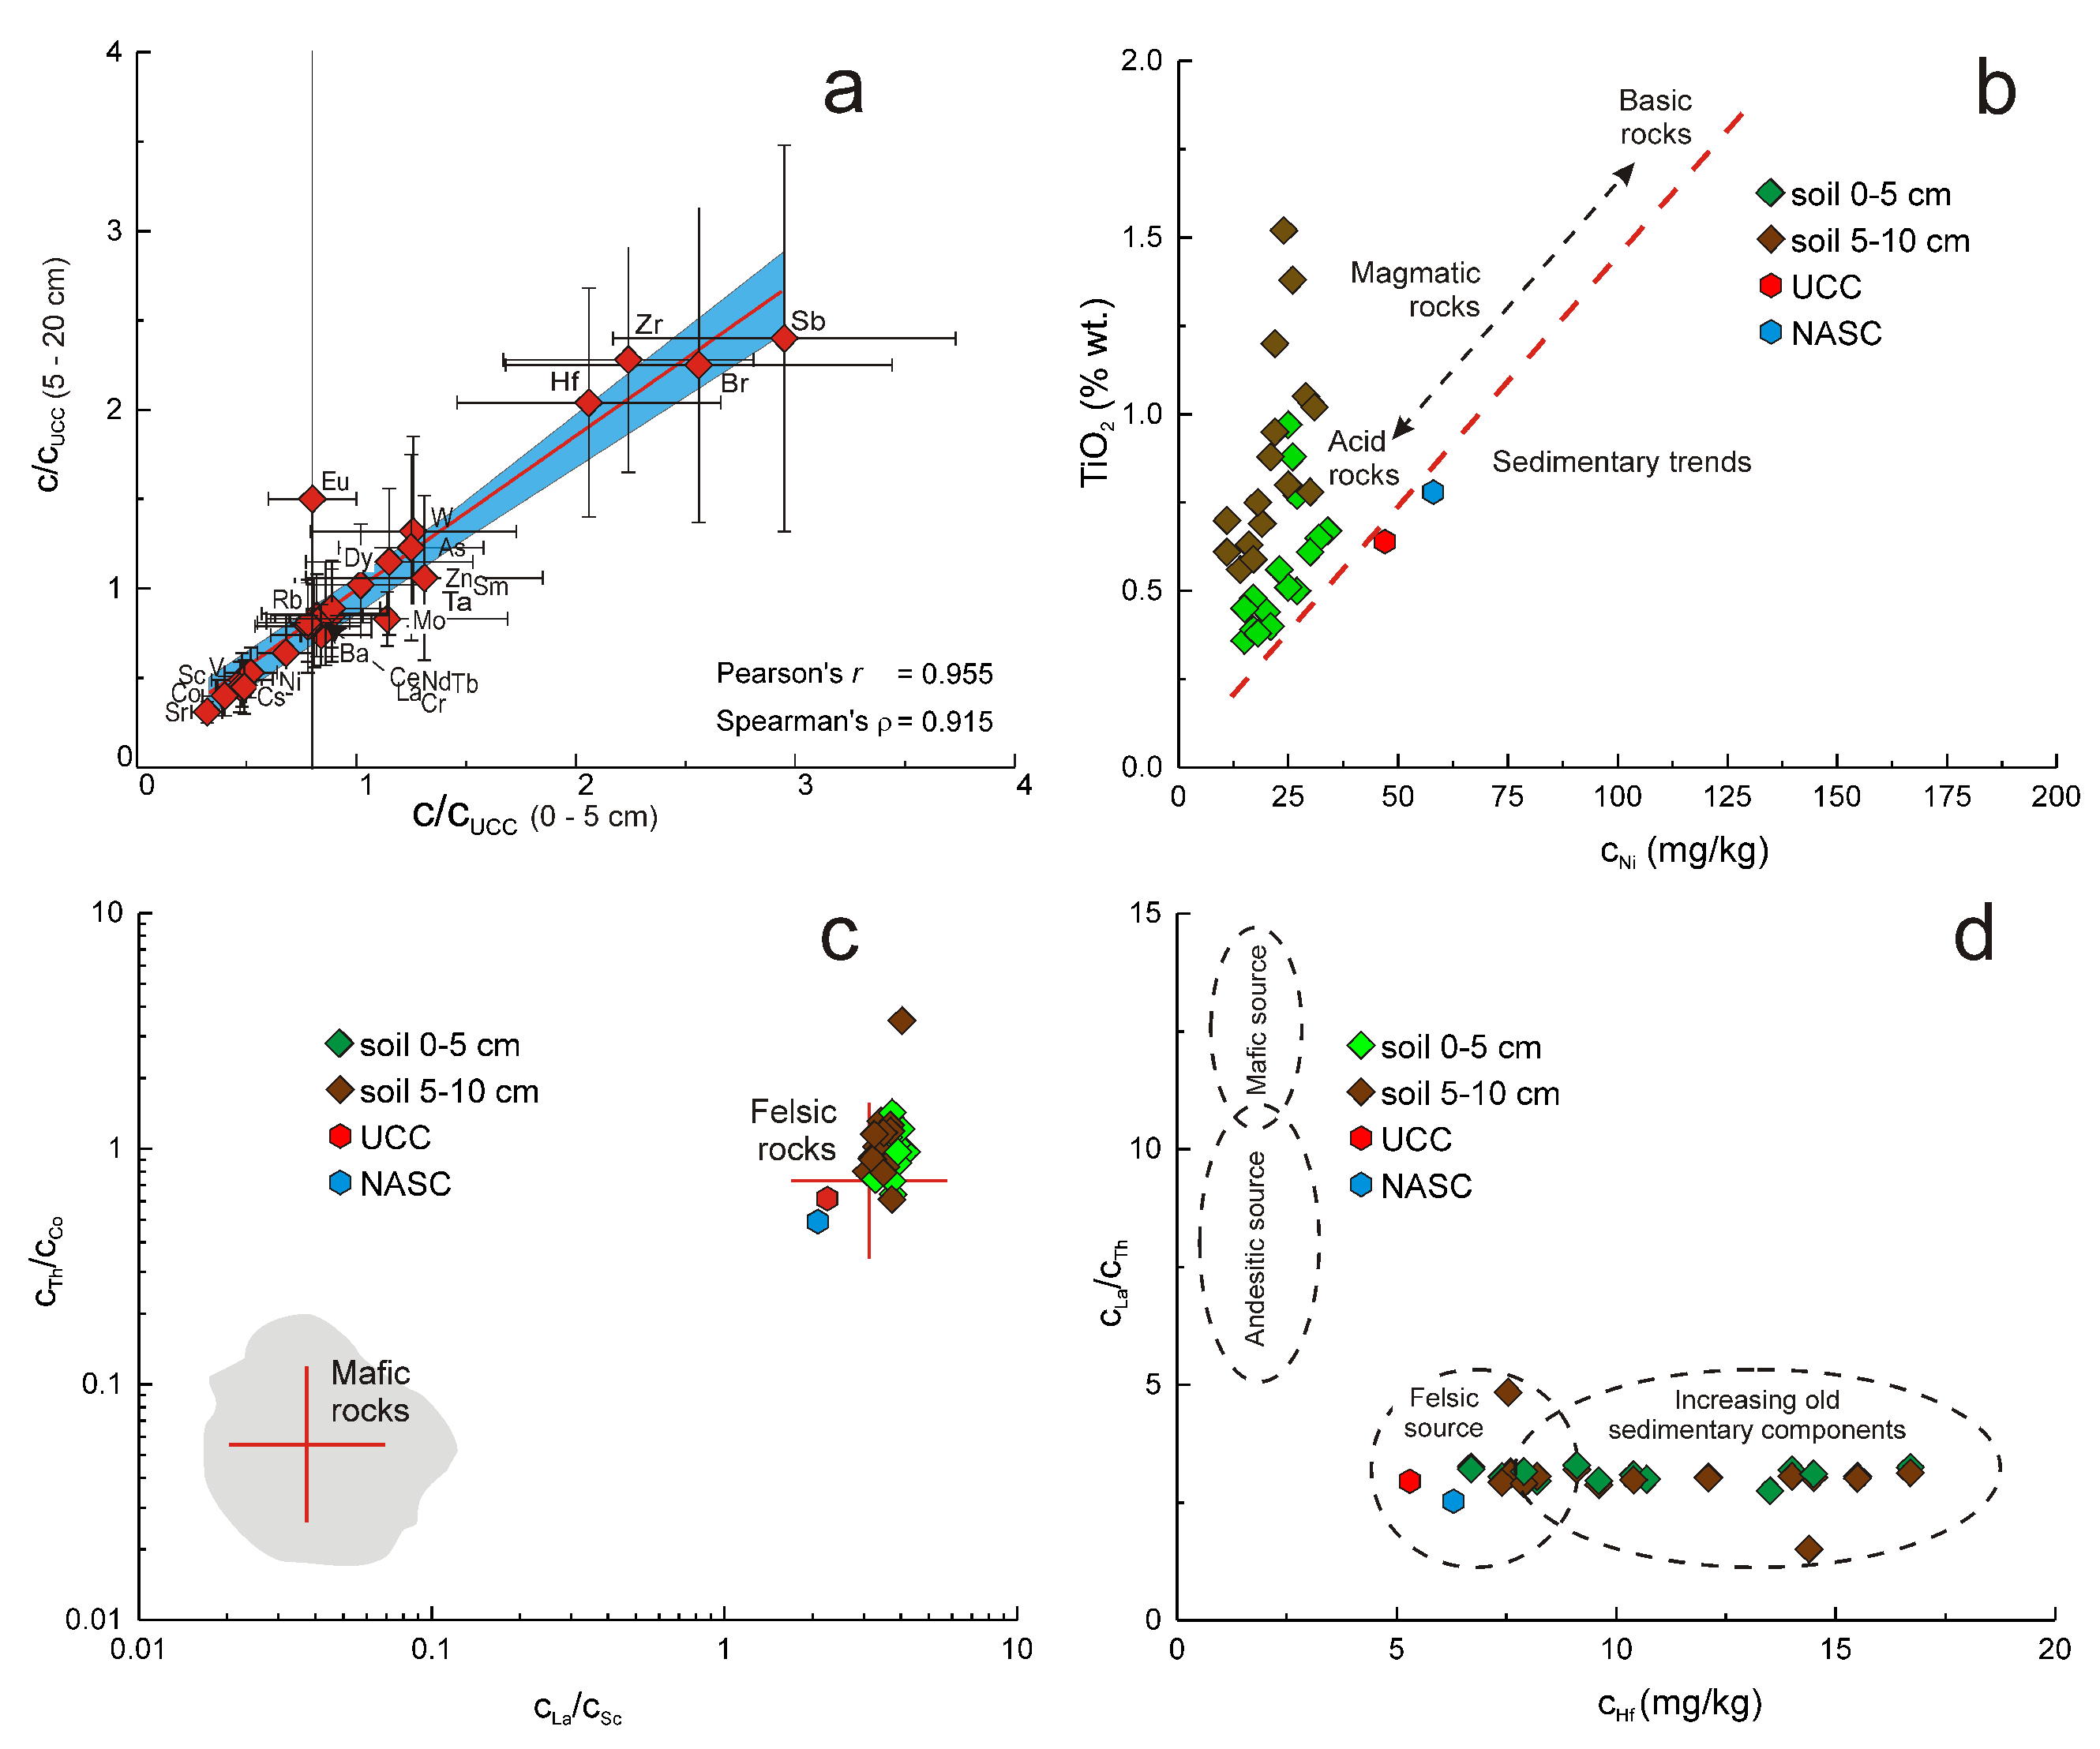
3.2. Trace Elements
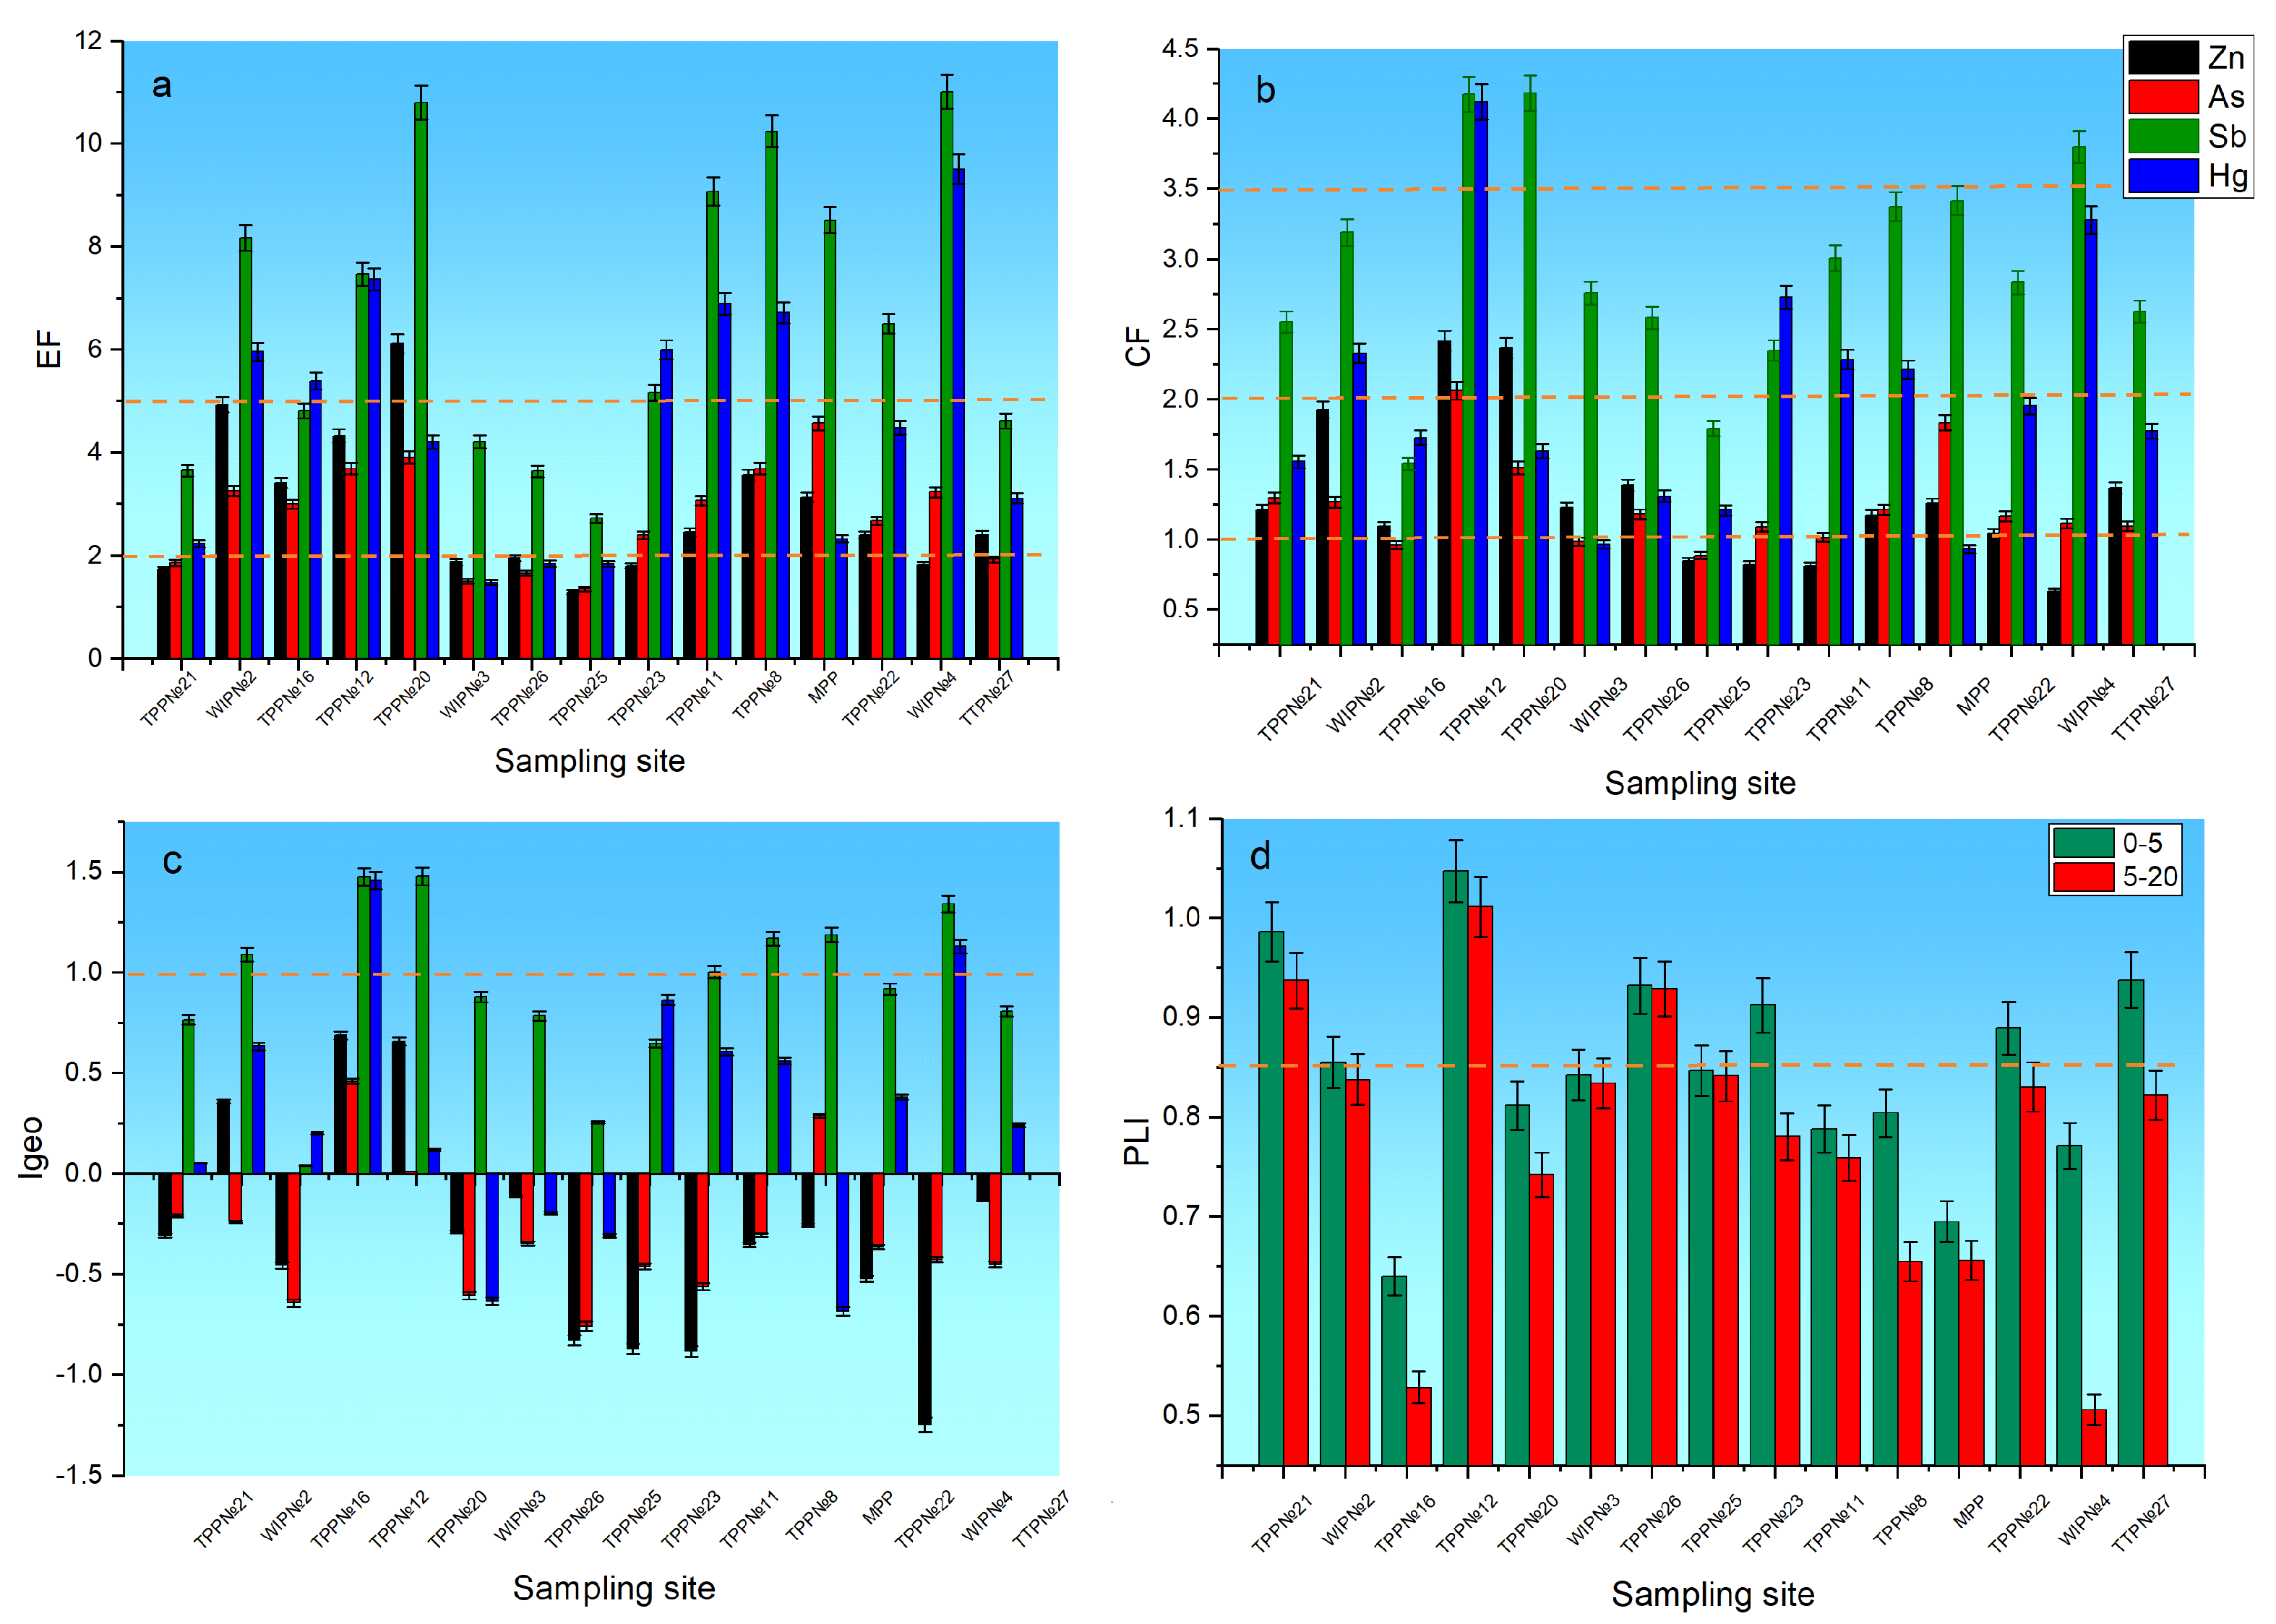
3.3. Ecological Status Quo
4. Conclusions
Supplementary Materials
Author Contributions
Funding
Institutional Review Board Statement
Informed Consent Statement
Acknowledgments
Conflicts of Interest
Abbreviations
| CF | Contamination Factor |
| EF | Enrichment Factor |
| Geoa-accumulation Index | |
| INAA | Instrumental Neutron Activation Analysis |
| MPP | Moscow Polymetallic Plant |
| NASC | North American Shale Composite |
| NIST | National Institute of Standard and Technology |
| PCE | Presumably Contaminating Element |
| PLI | Pollution Load Index |
| SRM | Standard Reference Material |
| TPP | ThermoPower Plant |
| UCC | Upper Continental Crust |
| WIP | Waste Incineration Plant |
References
- Jiménez-Ballesta, R.; De Soto-García, I.S.; García-Navarro, F.J.; García-Giménez, R. Recognizing the Importance of an Urban Soil in an Open-Air City Museum: An Opportunity in the City of Madrid, Spain. Land 2022, 11, 2310. [Google Scholar] [CrossRef]
- Sager, M. Urban soils and road dust—civilization effects and metal pollution—A review. Environments 2020, 7, 98. [Google Scholar] [CrossRef]
- Saddique, U.; Muhammad, S.; Tariq, M.; Zhang, H.; Arif, M.; Jadoon, I.A.K.; Khattak, N.U. Potentially toxic elements in soil of the Khyber Pakhtunkhwa province and Tribal areas, Pakistan: Evaluation for human and ecological risk assessment. Environ. Geochem. Health 2018, 40, 2177–2190. [Google Scholar] [CrossRef] [PubMed]
- Wei, B.; Yang, L. A review of heavy metal contaminations in urban soils, urban road dusts and agricultural soils from China. Microchem. J. 2010, 94, 99–107. [Google Scholar] [CrossRef]
- Modabberi, S.; Tashakor, M.; Sharifi Soltani, N.; Hursthouse, A.S. Potentially toxic elements in urban soils: Source apportionment and contamination assessment. Environ. Monit. Assess. 2018, 190, 1–18. [Google Scholar] [CrossRef] [PubMed]
- Manta, D.S.; Angelone, M.; Bellanca, A.; Neri, R.; Sprovieri, M. Heavy metals in urban soils: A case study from the city of Palermo (Sicily), Italy. Sci. Total Environ. 2002, 300, 229–243. [Google Scholar] [CrossRef]
- Sezgin, N.; Balkaya, N.; Sahmurova, A.; Aysal, N. Assessment of heavy metal contamination in urban soil (Tuzla District, Istanbul, Turkey). Desalin. Water Treat. 2019, 172, 167–176. [Google Scholar] [CrossRef]
- Kosheleva, N.; Tsykhman, A. Pollution of Moscow soils with potentially toxic elements: Analysis of long-term monitoring data. In Proceedings of the 22nd EGU General Assembly, Online, 4–8 May 2020. [Google Scholar] [CrossRef]
- Qing, X.; Yutong, Z.; Shenggao, L. Assessment of heavy metal pollution and human health risk in urban soils of steel industrial city (Anshan), Liaoning, Northeast China. Ecotoxicol. Environ. Saf. 2015, 120, 377–385. [Google Scholar] [CrossRef]
- Li, G.; Sun, G.X.; Ren, Y.; Luo, X.S.; Zhu, Y.G. Urban soil and human health: A review. Eur. J. Soil Sci. 2018, 69, 196–215. [Google Scholar] [CrossRef]
- Liu, J.; Liu, Y.J.; Liu, Y.; Liu, Z.; Zhang, A.N. Quantitative contributions of the major sources of heavy metals in soils to ecosystem and human health risks: A case study of Yulin, China. Ecotoxicol. Environ. Saf. 2018, 164, 261–269. [Google Scholar] [CrossRef]
- Adimalla, N. Heavy metals contamination in urban surface soils of Medak province, India, and its risk assessment and spatial distribution. Environ. Geochem. Health 2019, 42, 59–75. [Google Scholar] [CrossRef] [PubMed]
- Kosheleva, N.E.; Vlasov, D.V.; Korlyakov, I.D.; Kasimov, N.S. Contamination of urban soils with heavy metals in Moscow as affected by building development. Sci. Total. Environ. 2018, 636, 854–863. [Google Scholar] [CrossRef] [PubMed]
- Seleznev, A.A.; Yarmoshenko, I.V.; Malinovsky, G.P. Urban geochemical changes and pollution with potentially harmful elements in seven Russian cities. Sci. Rep. 2020, 10, 1668. [Google Scholar] [CrossRef]
- Rudnick, R.L.; Gao, S. Composition of the Continental Crust. In Treatise on Geochemistry; Elsevier Inc.: Amsterdam, The Netherlands, 2003; Volume 3–9, pp. 1–64. ISBN 9780080548074. [Google Scholar]
- Kosheleva, N.E.; Tsykhman, A.G. Spatial-temporal trends and factors of soil cover pollution in Moscow. RUDN J. Ecol. Life Saf. 2018, 26, 207–236. [Google Scholar] [CrossRef]
- Nagornyi, M.A.; Nikolaev, V.G. The quasiplatform sediments of the East European Platform. Russ. J. Earth Sci. 2005, 7, ES5001. [Google Scholar] [CrossRef]
- Prokofyeva, T.V.; Martynenko, I.A.; Ivannikov, F.A. Classification of Moscow soils and parent materials and its possible inclusion in the classification system of Russian soils. Eurasian Soil Sci. 2011, 44, 561–571. [Google Scholar] [CrossRef]
- Frontasyeva, M.V. Neutron activation analysis in the life sciences. Phys. Part. Nucl. 2011, 42, 332–378. [Google Scholar] [CrossRef]
- GOST—Gossudarstvenyi Standard 17.4.4.02-84 Nature Protection. Soils. Methods for Sampling and Preparation of Soil for Chemical, Bacteriological, Helmintological Analysis. Available online: https://docs.cntd.ru/document/1200005920 (accessed on 24 January 2023). (In Russian).
- Abdusamadzoda, D.; Abdushukurov, D.A.; Zinicovscaia, I.; Duliu, O.G.; Vergel, K.N. Assessment of the ecological and geochemical conditions in surface sediments of the Varzob river, Tajikistan. Microchem. J. 2020, 158, 105173. [Google Scholar] [CrossRef]
- Kowalska, J.B.; Mazurek, R.; Gąsiorek, M.; Zaleski, T. Pollution indices as useful tools for the comprehensive evaluation of the degree of soil contamination–A review. Environ. Geochem. Health 2018, 40, 2395–2420. [Google Scholar] [CrossRef]
- Chen, L.; Zhang, H.; Ding, M.; Devlin, A.T.; Wang, P.; Nie, M.; Xie, K. Exploration of the variations and relationships between trace metal enrichment in dust and ecological risks associated with rapid urban expansion. Ecotoxicol. Environ. Saf. 2021, 212, 111944. [Google Scholar] [CrossRef]
- Fernández, J.A.; Carballeira, A. Evaluation of contamination, by different elements, in terrestrial mosses. Arch. Environ. Contam. Toxicol. 2001, 40, 461–468. [Google Scholar] [CrossRef] [PubMed]
- Mohammad Ali, B.N.; Lin, C.Y.; Cleophas, F.; Abdullah, M.H.; Musta, B. Assessment of heavy metals contamination in Mamut river sediments using sediment quality guidelines and geochemical indices. Environ. Monit. Assess. 2015, 187, 4190. [Google Scholar] [CrossRef] [PubMed]
- Wu, W.; Wu, P.; Yang, F.; Sun, D.L.; Zhang, D.X.; Zhou, Y.K. Assessment of heavy metal pollution and human health risks in urban soils around an electronics manufacturing facility. Sci. Total Environ. 2018, 630, 53–61. [Google Scholar] [CrossRef] [PubMed]
- Herron, M.M. Geochemical classification of terrigenous sands and shales from core or log data. J. Sediment. Petrol. 1988, 58, 820–829. [Google Scholar] [CrossRef]
- Pettijohn, F.J.; Potter, P.E.; Siever, R. Sand and Sandstone; Springer: New York, NY, USA, 1987; ISBN 978-1-4612-1066-5. [Google Scholar]
- Grachev, A.F.; Nikolaev, V.A.; Nikolaev, V.G. East European platform development in the Late Precambrian and Paleozoic: Structure and sedimentation. Russ. J. Earth Sci. 2006, 8, ES4001. [Google Scholar] [CrossRef]
- Le Bas, M.J.; Le Maitre, R.W.; Streckeisen, A.; Zanettin, B. 1986 A chemical classification of volcanic rocks based onthe total alkali–silica diagram. J. Petrol. 1986, 27, 745–750. [Google Scholar] [CrossRef]
- Floyd, P.A.; Leveridge, B.E. Tectonic environment of the Devonian Gramscatho basin, south Cornwall: Framework mode and geochemical evidence from turbiditic sandstones (England). J. Geol. Soc. 1987, 144, 531–542. [Google Scholar] [CrossRef]
- Armstrong-Altrin, J.S.; Nagarajan, R.; Madhavaraju, J.; Rosalez-Hoz, L.; Lee, Y.I., II; Balaram, V.; Cruz-Martínez, A.; Avila-Ramírez, G. Geochemistry of the Jurassic and Upper Cretaceous shales from the Molango Region, Hidalgo, eastern Mexico: Implications for source-area weathering, provenance, and tectonic setting. Comptes Rendus-Geosci. 2013, 345, 185–202. [Google Scholar] [CrossRef]
- Norman, J.C.; Haskin, L.A. The geochemistry of Sc: A comparison to the rare earths and Fe. Geochim. Cosmochim. Acta 1968, 32, 93–108. [Google Scholar] [CrossRef]
- McLennan, S.M.; Hemming, S.; McDaniel, D.K.; Hanson, G.N. Geochemical approaches to sedimentation, provenance, and tectonics. Spec. Pap. Geol. Soc. Am. 1993, 284, 21–40. [Google Scholar] [CrossRef]
- Gromet, L.P.; Haskin, L.A.; Korotev, R.L.; Dymek, R.F. The “North American shale composite”: Its compilation, major and trace element characteristics. Geochim. Cosmochim. Acta 1984, 48, 2469–2482. [Google Scholar] [CrossRef]
- Bogdanova, S.V.; Bingen, B.; Gorbatschev, R.; Kheraskova, T.N.; Kozlov, V.I.; Puchkov, V.N.; Volozh, Y.A. The East European Craton (Baltica) before and during the assembly of Rodinia. Precambrian Res. 2007, 160, 23–45. [Google Scholar] [CrossRef]
- Quirein, J.A.; Gardner, J.S.; Watson, J.T. Combined natural gamma ray spectral/litho-density measurements applied to complex lithologies. In Proceedings of the SPE Annual Technical Conference and Exhibition, New Orleans, LA, USA, 26 September 1982. Paper Number: SPE-11143-MS. [Google Scholar] [CrossRef]
- Kavamura, V.N.; Esposito, E. Biotechnological strategies applied to the decontamination of soils polluted with heavy metals. Biotechnol. Adv. 2010, 28, 61–69. [Google Scholar] [CrossRef] [PubMed]
- Kwiatkowska-Malina, J. Functions of organic matter in polluted soils: The effect of organic amendments on phytoavailability of heavy metals. Appl. Soil Ecol. 2018, 123, 542–545. [Google Scholar] [CrossRef]
- Kinniburgh, D.G.; Van Riemsdijk, W.H.; Koopal, L.K.; Borkovec, M.; Benedetti, M.F.; Avena, M.J. Ion binding to natural organic matter: Competition, heterogeneity, stoichiometry and thermodynamic consistency. Colloids Surf. A Physicochem. Eng. Asp. 1999, 151, 147–166. [Google Scholar] [CrossRef]
- Radomirović, M.; Ćirović, Ž.; Maksin, D.; Bakić, T.; Lukić, J.; Stanković, S.; Onjia, A. Ecological Risk Assessment of Heavy Metals in the Soil at a Former Painting Industry Facility. Front. Environ. Sci. 2020, 8, 177. [Google Scholar] [CrossRef]
- Smedley, P.L.; Kinniburgh, D.G. Molybdenum in natural waters: A review of occurrence, distributions and controls. Appl. Geochem. 2017, 84, 387–432. [Google Scholar] [CrossRef]
- Földi, C.; Sauermann, S.; Dohrmann, R.; Mansfeldt, T. Traffic-related distribution of antimony in roadside soils. Environ. Pollut. 2018, 237, 704–712. [Google Scholar] [CrossRef]
- Won, J.H.; Park, J.Y.; Lee, T.G. Mercury emissions from automobiles using gasoline, diesel, and LPG. Atmos. Environ. 2007, 41, 7547–7552. [Google Scholar] [CrossRef]
- Paoletti, F.; Sirini, P.; Seifert, H.; Vehlow, J. Fate of antimony in municipal solid waste incineration. Chemosphere 2001, 42, 533–543. [Google Scholar] [CrossRef]


| Location Number | Description | Latitude | Longitude | Distance |
|---|---|---|---|---|
| 1 | TPP №21 | 55.92069 | 37.51762 | 3.0 |
| 2 | WIP №2 | 55.84118 | 37.63329 | 4.1 |
| 3 | TPP №16 | 55.80122 | 37.52074 | 2.0 |
| 4 | TPP №12 | 55.71282 | 37.53552 | 2.9 |
| 5 | TPP №20 | 55.70862 | 37.55891 | 1.8 |
| 6 | WIP №3 | 55.60135 | 37.67505 | 2.4 |
| 7 | TPP №26 | 55.57615 | 37.67873 | 3.0 |
| 8 | TPP №25 | 55.68122 | 37.40271 | 3.1 |
| 9 | TPP №23 | 55.82758 | 37.80274 | 2.0 |
| 10 | TPP №11 | 55.76487 | 37.77154 | 2.9 |
| 11 | TPP №8 | 55.72679 | 37.79345 | 6.1 |
| 12 | MPP | 55.63689 | 37.68948 | 0.5 |
| 13 | TPP №22 | 55.64077 | 37.85833 | 2.4 |
| 14 | WIP №4 | 55.71976 | 37.96956 | 2.2 |
| 15 | WIP №27 | 55.93471 | 37.72929 | 3.3 |
Disclaimer/Publisher’s Note: The statements, opinions and data contained in all publications are solely those of the individual author(s) and contributor(s) and not of MDPI and/or the editor(s). MDPI and/or the editor(s) disclaim responsibility for any injury to people or property resulting from any ideas, methods, instructions or products referred to in the content. |
© 2023 by the authors. Licensee MDPI, Basel, Switzerland. This article is an open access article distributed under the terms and conditions of the Creative Commons Attribution (CC BY) license (https://creativecommons.org/licenses/by/4.0/).
Share and Cite
Zinicovscaia, I.; Vergel, K.; Duliu, O.G.; Grozdov, D.; Yushin, N.; Chaligava, O. Assessment of Soil Pollution with Presumably Contaminating Elements in Moscow Recreational Areas Using Instrumental Neutron Activation Analysis. Sustainability 2023, 15, 7886. https://doi.org/10.3390/su15107886
Zinicovscaia I, Vergel K, Duliu OG, Grozdov D, Yushin N, Chaligava O. Assessment of Soil Pollution with Presumably Contaminating Elements in Moscow Recreational Areas Using Instrumental Neutron Activation Analysis. Sustainability. 2023; 15(10):7886. https://doi.org/10.3390/su15107886
Chicago/Turabian StyleZinicovscaia, Inga, Konstantin Vergel, Octavian G. Duliu, Dmitrii Grozdov, Nikita Yushin, and Omari Chaligava. 2023. "Assessment of Soil Pollution with Presumably Contaminating Elements in Moscow Recreational Areas Using Instrumental Neutron Activation Analysis" Sustainability 15, no. 10: 7886. https://doi.org/10.3390/su15107886