

Effect of Fines Content on Pore Distribution of Sand/Clay Composite Soil
1
Guoneng Ganquan Railway Co., Ltd., Bayannur 015323, China
2
State Key Laboratory of Geomechanics and Geotechnical Engineering, Institute of Rock and Soil Mechanics, Chinese Academy of Sciences, Wuhan 430071, China
*
Author to whom correspondence should be addressed.
Sustainability 2023, 15(12), 9216; https://doi.org/10.3390/su15129216
Submission received: 6 May 2023
/
Revised: 31 May 2023
/
Accepted: 3 June 2023
/
Published: 7 June 2023
(This article belongs to the Special Issue Exploration of Marine Geological Resources and Geological Technology)
Abstract
:Plant sand fixation is the most durable and environmentally friendly sand mitigation measure for windblown sand hazards. For aeolian–sand composite soil, the fines content is the main factor affecting the pore size distribution characteristics and determines the soil water retention characteristics. Sandy soil with uniform particle size was used as the material, low-plasticity clay as a fine particle, and composite soils with different fines content were prepared. The evolution of the pore size distribution of composite soils was quantitatively determined using low-field nuclear magnetic resonance technology, and the influence of the fines content on the pore size distribution was obtained. The results show that as the fines content increases, the pore size first increases and then decreases. The pore size distribution curve gradually changes from a single-peak structure to a double-peak structure and becomes a unimodal structure again. The corresponding dominant pore size of composite soils increases first and then decreases with the increase in the fines content. A critical fine particle content is identified to control the strong local honeycomb pore structure of composite soils, which provides a theoretical basis for the material selection and design of plant sand fixation measures.
1. Introduction
With the national strategy of Western Development, multiple roads have been constructed in the desert and Gobi areas [1]. China has the longest distribution of railways in desert areas globally, primarily concentrated in the northwest region. In this area, sand damage to railways is the most significant threat to railway transportation and is also a key issue in railway construction [2]. Since the end of the 19th century, the harmful effects of sandstorms on roads have been recognized, becoming the most important environmental constraint for existing railways and future projects in arid areas. In the past few decades, extensive theoretical and practical research has been conducted on sandstorm disasters, forming a series of comprehensive protection and sand control systems. Among them, the dominant technology is vegetation sand fixation. This technology not only weakens ground wind speed to reduce sand movement but also improves the local ecological environment [3]. The most critical difficulty in vegetation sand fixation is the low survival rate of plants, mainly due to the poor water retention capacity of sandy soil in arid areas. Studies have shown that adding a small amount of fine particles, such as clay, to sandy soil can greatly increase the soil’s water retention capacity.
The water retention characteristics of soil strongly depend on the pore size distribution, including pore size and pore connectivity [4]. Therefore, within a certain range, the water retention properties of soil measured macroscopically can also reflect the pore distribution characteristics at the microscopic scale [5]. In terms of experimental testing, since the drainage of soil under suction is slow, the testing process of the soil–water characteristic curve is extremely time-consuming. Therefore, many scholars have proposed using the pore size distribution curve to establish the numerical model of the water retention curve based on the Yang–Laplace equation. Similarly, many models were also proposed to evaluate the hydraulic properties of soil using certain characteristic pore sizes [6]. As a representative microstructural characteristic, pore size distribution also determines the macroscopic engineering mechanical properties of soil. Therefore, pore size distribution is a key parameter in the design of geotechnical structures. The fine content in the composite soil significantly changes the pore structure distribution of the soil [7,8], but this issue receives less attention. Therefore, experimental research on the effect of fines content on the pore size distribution curve of composite soil is of great significance for the material selection and design of vegetation sand fixation.
In practice, the change in the pore size distribution of soil with the change in fines content is very complex. Currently, due to limited detection methods, it is difficult to quantitatively determine the evolution characteristics of pore size distribution with fines content. The most commonly used experimental method for testing pore size distribution curves is mercury intrusion porosimetry, which requires freeze-drying treatment of the sample and is not suitable for sandy soil. This is mainly because sandy soil will disintegrate after drying, making it unable to form the required sample for mercury intrusion. In the petroleum field, low-field nuclear magnetic resonance technology (NMR) has been widely used to determine the flow characteristics of porous media, such as pore size distribution, effective porosity, permeability, mobile/bound fluid volume, and other geological information [9,10,11]. Moreover, this technology has the advantages of being rapid and non-destructive, not requiring drying treatment of sandy soil, and therefore, has significant advantages in quantitatively determining the pore size distribution curve [12]. When the soil is completely saturated with pore water, the pore size distribution can be determined by inverting the transverse relaxation time (T2) of nuclear magnetic resonance (NMR) based on the theoretical relationship between the pore size and T2 [13,14].
In this paper, sand and clay were used as the material, and composite soils with different fines content were prepared. Based on nuclear magnetic resonance technology, the influence of fines content on the pore size distribution of composite soils was quantitatively studied, the evolution characteristics of dominant pore size with fines content were obtained, and the critical fines content controlling the pore size distribution of composite soils was identified. At the microscale, the underlying mechanism of fines content on the pore structure characteristics of soil was quantitatively determined, and the quantitative relationship between pore distribution, dominant pore size, and fines content was obtained. By characterizing the microscopic pore structure, the water retention characteristics of composite soil considering the influence of fines content can be deduced macroscopically. The results can provide a detailed theoretical basis and technical reference for the selection and design of soil in plant sand fixation. In addition, the relationship was correlated with the macroscopic water retention characteristics of the soil, providing a detailed theoretical basis and technical reference for the selection and design of soil in plant sand fixation.
2. Materials and Methods
2.1. Materials
The experimental material used in this study was sand with a relatively uniform particle size (optimal particle size of 0.2 mm), and low-plasticity clay was used as the fine-grained material. The soil samples used in the experiment were first air-dried, crushed, and sieved, and then basic physical property tests were carried out. The physical parameters of the soil were obtained as shown in Table 1, and the particle size distribution curve is shown in Figure 1. The sand and clay were mixed in different mass fractions to obtain a series of composite soils with different fines content. The fines content used were 0%, 10%, 20%, 30%, 40%, 50%, 60%, 70%, 80%, and 100%, for a total of 11 composite soils. The mixtures with fines content of 0% and 100% were named sand and clay, respectively, and the other mixtures were named SC1, SC2, SC3, SC4, SC5, SC6, SC7, SC8, and SC9.
The composite soils were prepared into soil samples with a dry density of 1.4 g/cm3 and a porosity of about 0.89. First, deionized water was added to the composite soil to achieve the desired initial water content of 10%, and the samples were prepared using static compaction. In nuclear magnetic resonance experiments, due to the problem of magnetic field uniformity, the traditional stainless steel ring cutter was replaced with a polytetrafluoroethylene ring cutter, which is a special material that does not affect the magnetic field. The diameter of the soil sample was 45 mm, and the height was 20 mm. The prepared samples were saturated using a vacuum technique. First, the soil samples were placed in a saturation chamber, and a vacuum was applied for 4 h. Then, deionized water was introduced under vacuum conditions, and the samples were soaked for 24 h under vacuum conditions to ensure full saturation.
2.2. Experimental Method
The principle of nuclear magnetic resonance (NMR) to obtain the pore size distribution curve is detecting the content and distribution of hydrogen protons in pore water in the soil. Hydrogen protons in pore water generate small magnetic moments due to their spin, which can be regarded as micro magnets. When a fully saturated soil sample is placed in a fixed magnetic field, all hydrogen protons tend to align along the direction of the magnetic field. At this time, a radiofrequency pulse is applied, causing the hydrogen protons to deviate under the interference pulse. When the radiofrequency pulse is stopped, the group of hydrogen protons that deviated will return from a non-equilibrium state to an equilibrium state, which is called relaxation. In geotechnical engineering, the transverse T2 relaxation (spin–spin relaxation) is usually used, controlling the phase shift of nuclear spins in a direction perpendicular to the applied static magnetic field. The abscissa of the obtained T2 distribution curve is the transverse relaxation time T2, and the ordinate is the nuclear magnetic signal corresponding to the T2 value, which characterizes the content of pore water at that T2. The peak area of the entire distribution curve represents the total pore water content in the soil sample [15,16]. Assuming that the soil meets the condition of fast diffusion and the soil pores are composed of cylindrical capillaries of different sizes, the T2 value of pore water is directly related to the pore size at which the pore water is located, i.e., [17],
where T2 represents the transverse relaxation time of the pore water, which is related to the physical and chemical characteristics of the soil and is a constant for the same type of soil; R represents the pore radius; ρ2 is transverse surface relaxivity, μm/ms. From Equation (1), it can be seen that the T2 value of pore water’s transverse relaxation time is proportional to the pore radius R. This means that the T2 value of water in larger pores is greater than that of water in smaller pores. Therefore, based on the obtained transverse relaxation time T2 distribution curve and Equation (1), the pore size distribution curve of the soil sample can be derived. Furthermore, the method of obtaining the pore size distribution curve described above has been extensively tested and validated experimentally and theoretically [12,18,19].
In this experiment, a nuclear magnetic resonance analyzer produced by NIUMΛG was used. The permanent magnet of the instrument has a magnetic field strength of 0.52 T. Low-field frequency of 23 MHz could effectively exclude the influence of minerals in the soil, ensuring that all detected signals come from the pore water. The saturated soil sample prepared above was taken out from the saturation device, weighed to obtain the water content, and then placed in a sample tube for nuclear magnetic resonance testing. The CPMG (Carr–Purcell–Meiboom–Gill) pulse sequence was used in the experiment to obtain the free decay signal of the pore water during relaxation. The T2 time distribution curve of the pore water of the composite soil with different fines content can be obtained through Fourier transform.
3. Results and Discussion
3.1. Particle Size Distribution Curves of Composite Soils with Different Fines Content
The particle size distribution curves of the composite soil with different fines content are shown in Figure 2. The particle size distribution curves of the sand and clay are the boundary lines in the figure. The particle size distribution curves of the composite soils at different fines content are distributed uniformly based on mass fraction, and the measured curves are consistent with those calculated using sand/clay mass fraction. Therefore, based on the particle size distribution curves of sand and clay, the optimal grading of the composite soil can be obtained, achieving the optimal water retention characteristics and mechanical properties.
3.2. Influence of Fines Content on the T2 Distribution Curve of Composite Soil
The T2 distribution curves of 11 saturated soil samples are shown in Figure 3. It can be seen from Figure 3 that with the increase in the fines content, the T2 distribution curve first moves to the right and then gradually moves to the left. To clarify the above trend more clearly, the experimental results in Figure 3 were redrawn at different fine-grained contents in Figure 4, where Figure 4a shows the T2 distribution curve under low fines content (fines content increases from 0 to 30%), and Figure 4b shows the T2 distribution curve under high fines content (fines content increases from 40 to 100%). From Figure 4a, the T2 distribution curve of pure sand has only one single peak, and the pore size distribution is relatively narrow. With the increase in fines content, the corresponding signals of smaller T2 values (in the range of 0.1–1 ms) increase, and at the same time, the maximum T2 value increases (gradually from 200 ms of sand), that is, the horizontal range of the T2 distribution expands, the vertical range decreases, and the curve becomes wider and shorter. The curve gradually changes from a single peak to a double peak and reaches the maximum width when the fines content increases to 30%. When the fines content exceeds 30% (Figure 4b), the T2 distribution curve moves to the left, the maximum T2 value decreases, and the signals of smaller T2 values increase further, making the curve narrower. The T2 distribution gradually changes from a double peak to a single peak. When the fine-grained content reaches 100% or clay, the T2 distribution is the narrowest.
In the T2 distribution curve, there is a peak value, and the T2 value corresponding to the peak value represents the dominant pore size in the composite soil. Figure 5 shows the T2 value corresponding to the peak value of composite soil with different fines content. It can be seen from the figure that when the fines content is relatively small, the peak T2 value increases with the increase in fines content. When the fines content reaches 30%, the T2 value reaches the maximum value (123 ms) and then decreases rapidly with the further increase in fines content. When the fines content is relatively large, the change of T2 value with fines content gradually becomes gentle.
3.3. Effect of Fines Content on the Pore Size Distribution Curve of the Composite Soil
According to the principle of NMR, the pore size of soil can be obtained by the transverse relaxation time T2 distribution curve, and the number of pores corresponding to that size can be obtained by the nuclear magnetic signal amplitude (dimensionless) on the vertical axis. To obtain the pore size distribution curve (PSD) of the soil using the T2 distribution data obtained by NMR, a key parameter is required, namely, the surface relaxation rate. In this paper, a relaxation rate of 14.92 μm/ms reported in the reference [20] is used, and PSD curves for composite soils with different fines content are obtained as shown in Figure 6, where the vertical axis f is frequency, representing the ratio of pore volume with the corresponding size to the total pore volume. Similar to Figure 3, at lower fines content, the pore size distribution curve first shifts to the right and then moves to the left as the fines content increases. The detailed trend of changes is shown in Figure 7, where Figure 7a shows the PSD curve at lower fines content. When the fines content increases, the number of small pores increases, and the pore size of the large pores increases. The pore size distribution of sand is relatively single-peaked. When fine particles are added, the proportion of small pores increases (i.e., in the range of 1–20 μm). This is mainly because the finer the particles, the smaller the pores formed. When the fines content is zero, i.e., the maximum pore size of the sand is about 104 μm, the addition of fine particles further increases this maximum pore size. The pore size distribution curve widens, the height decreases, and the shape gradually changes from a single peak to a bimodal structure, with small pores dominated by clay and large pores dominated by sand. When the fines content reaches 30%, this bimodal structure is most evident.
Figure 7b shows the PSD curve of the composite soil with a higher fines content. As the fines content further increases beyond 30%, the pore size gradually decreases, mainly because the fine particles fill some of the large pores, gradually changing from a bimodal to a unimodal structure. The main reason for these different changes is that at lower fines content, the skeleton is formed by coarse particles, and the addition of fine particles causes the coarse particles to form a local honeycomb pore structure, resulting in large pores and shifting the pore size distribution curve to the right (shown in Figure 7c). With the increase in fines content, this local structure effect becomes stronger. When the fines content reaches 30%, this honeycomb structure is most developed, forming the noticeable structure of the composite soil. This kind of pore structure is similar to that of loess, and soil collapsibility is the highest at this time. With the further increase in fines content, fine particles gradually fill the large pores of the coarse particle skeleton, resulting in a decrease in the pore size of the large pores and a leftward shift of the pore size distribution curve. The increase in fine particles greatly increases the proportion of small pores, and the pore distribution curve gradually changes from a bimodal distribution to a unimodal structure, and the soil gradually becomes more like cohesive soil.
4. Discussion
To analyze the influence of fines content on the particle size distribution quantitatively, the optimal pore size in the pore size distribution curve is used for discussion. The dominant pore size of the composite soil obtained under different fines content is plotted in Figure 8. From the figure, it can be seen that for lower fines content, the dominant pore size first increases with the increase in fines content. The maximum value is reached when the fines content reaches 30%, corresponding to the strongest local honeycomb pore structure. As the fines content further increases, the number of small pores increases while the number of large pores decreases, and the dominant pore size rapidly decreases. When the fines content exceeds 60–70%, the dominant pore size almost no longer changes. At this point, the soil becomes a cohesive soil, where the coarse particles are wrapped by fine particles, and the fines content has little effect on the size of the dominant pore size.
According to the variation of the location and shape of the pore size distribution curve of the composite soil with different fines content, the influence of fines content can be divided into three stages. (1) When the fines content is 0–30%, the soil skeleton is dominated by coarse particles. The addition of fines changes the arrangement of coarse particles and forms a locally large pore structure. Fine particles do not bear the load, and the soil structure is strong at this stage. (2) When the fines content is 30–70%, the fine particles fill the voids between coarse particles, and the pore structure is weakened. The solid skeleton is composed of both coarse and fine particles, and both bear the load. (3) When the fines content is 70–100%, the solid skeleton is dominated by fine particles and the coarse particles are wrapped by fine particles and suspended in the soil. Therefore, based on the above results, key parameters such as pore size and distribution and dominant pore size can accurately describe the variation of pore structure of composite soil with the fines content [21]. By establishing the correlation with water retention characteristics, a model considering the effect of fines content on the water retention characteristics of composite soil can be further developed [22,23].
The effect of fines content on the water retention characteristics of soil samples has been extensively studied. Zhang et al. (2022) pointed out that as the fines content increases, the soil water retention characteristic curve (SWRC) moves upwards, indicating that the water retention capacity of soil samples increases with increasing fines content [24]. Here the previously obtained pore size distribution curves (Figure 6) are used to derive SWCCs for composite soils with different fines content, where the hysteresis effect is not considered. Assuming that the soil pores are composed of a series of cylindrical capillaries with different diameters, the relationship between matric suction and pore size can be expressed by the Young–Laplace equation:
where sc is the matric suction, γ is the air-water surface tension, and R is the pore radius. At 20 °C, the air–water surface tension is 72.8 J/m2. From the above equation, it can be seen that the matric suction of the soil sample is inversely proportional to the pore radius. Therefore, during the drying process, when the matric suction gradually increases, the larger pores first drain, and then the smaller pores gradually begin to drain. Under a certain matric suction, there is a pore size corresponding to the matric suction value. Pores larger than this size are assumed to have already completely drained, while pores smaller than this size are assumed to be fully saturated. Therefore, for a given matric suction, the corresponding degree of saturation can be obtained by integrating the pore size distribution curve from the smallest pore to the pore size corresponding to that suction:
where Rmin is the radius of the smallest pore in the pore size distribution curve.
Using the above method, the soil–water characteristic curves of the composite soils with various fines content can be obtained, as shown in Figure 9. From the figure, it can be seen that the SWCC of the sand has a steeper slope due to the more concentrated pore size distribution. As the fines content increases, the SWCC becomes flatter, accompanied by a decrease in the air entry value. This is consistent with the pore size distribution characteristics obtained earlier; that is, the maximum pore size increases, and the corresponding air entry value decreases. When the fines content reaches 30%, the air entry value reaches the minimum, and the SWCC curve is the flattest for this composite soil. As the fines content further increases, the air entry value increases and the water retention capacity of the composite soil begins to increase. Therefore, from the experimental results, it can be concluded that adding fine particles to the sandy soil does not necessarily increase its water retention capacity. On the contrary, there is a critical fines content at which the water retention capacity of the composite soil is poor.
In this paper, the effect of fines content on the pore size distribution of composite soil is investigated, and the mechanism of how the fines content affects the water retention characteristics of the composite soil is also clarified. However, the special honeycomb pore structure also has a significant impact on the strength and deformation of the soil. Therefore, future work can focus on the effect of fines content on the mechanical behavior of composite soil [25,26,27].
5. Conclusions
Based on nuclear magnetic resonance technology, the pore size distribution curves of sand and clay composite soil with different fines content were measured, and the influence of fines content on pore distribution and dominant pore size was systematically studied. This provides experimental evidence from a microscopic perspective for the systematic study of the water retention characteristics of composite soil. The following conclusions can be drawn from this experimental study.
- (1)
- When the fines content is relatively small (0–30%), the pore size distribution curve of the composite soil shifts to the right as the fines content increases. The proportion of small pores increases, accompanied by an increase in the size of large pores. This causes the shape of the pore size distribution curve to gradually transition from a unimodal distribution of pure sand to a bimodal distribution, composed of small pores dominated by fine particles and large pores dominated by the coarse particle skeleton. This is mainly because the addition of fine particles will cause the skeletal structure dominated by coarse particles to form a skeletal structure with locally large pores. When the fines content reaches 30%, the bimodal structure is the strongest with the most developed honeycomb pore structure, leading to the largest collapsibility of the composite soil.
- (2)
- As the fines content continues to increase beyond 30%, the pore size distribution curve begins to shift to the left; that is, the number of large pores in the composite soil decreases, and the number of small pores increases. Fine particles begin to fill the large pores, weakening the honeycomb pore structure. The pore distribution curve gradually becomes unimodal with more uniform pore size distribution.
- (3)
- As the fines content increases, the dominant pore size of the composite soil first increases and then decreases. When the fines content reaches 30%, the dominant pore size increases to its maximum value, and the corresponding local skeletal structure is the strongest. With the further increase in the fines content, the number of small pores increases while the number of large pores decreases, and the dominant pore size rapidly decreases. When the fine particle content is greater than 60–70%, the dominant pores almost no longer change. At this time, the soil becomes cohesive soil, the coarse particles are wrapped by fine particles, and the fines content has almost no influence on the dominant pore size.
- (4)
- The effect of fines content is divided into three stages, and the influence mechanism of fines content on pore structure is obtained for each stage. By characterizing the microscopic pore structure, the water retention characteristics of composite soil considering the influence of fines content can be deduced macroscopically, providing a theoretical basis for material selection and design for plant sand fixation.
Author Contributions
Conceptualization, T.M. and M.W.; methodology, P.C.; software, P.Y.; validation, P.C., M.W. and T.M.; formal analysis, M.W.; investigation, T.M.; resources, P.C.; data curation, M.W.; writing—original draft preparation, M.W.; writing—review and editing, T.M.; visualization, M.W.; supervision, T.M.; project administration, T.M.; funding acquisition, T.M., P.C. and P.Y. All authors have read and agreed to the published version of the manuscript.
Funding
This research was funded by the National Natural Science Foundation of China (41972290 and 12002243).
Institutional Review Board Statement
Not applicable.
Informed Consent Statement
Not applicable.
Data Availability Statement
The research data can be provided upon request to the corresponding author.
Conflicts of Interest
The authors declare no conflict of interest.
References
- Zhang, D.; Xu, Z. Study on the prevention and control measures of wind and sand on a certain railway in the Middle East. Railw. Stand. Des. 2014, 58, 64–66. [Google Scholar]
- Zhang, K.; Qu, J.; Yu, Y.; Han, Q.; Wang, T.; An, Z.; Hu, F. Progress of research on wind-blown sand prevention and control of railways in China. Adv. Earth Sci. 2019, 34, 573–583. [Google Scholar]
- Zhang, Y.; Zhang, K.; Fang, Q. Research progress and prospect of plant sand fixation in China. J. Green Sci. Technol. 2020, 6, 123–124+127. [Google Scholar]
- Niu, G.; Shao, L.; Sun, D.; Wei, C.; Guo, X.; Xu, H. Evolution law of pore-size distribution in soil-water retention test. Rock. Soil. Mech. 2020, 41, 1195–1202. [Google Scholar]
- Fredlund, D.G.; Xing, A. Equations for the soil-water characteristic curve. Can. Geotech. J. 1994, 31, 521–532. [Google Scholar] [CrossRef]
- Simms, P.H.; Yanful, E.K. Predicting soil-water characteristic curves of compacted plastic soils from measured pore-size distributions. Géotechnique 2002, 52, 269–278. [Google Scholar] [CrossRef]
- Feng, S.; Chai, J.; Xu, Z.; Yuan, Q. Evaluating the mesostructural changes of laboratory created soil-rock mixtures using a seepage test based on NMR technology. J. Test. Eval. 2018, 46, 879–891. [Google Scholar] [CrossRef]
- Jiao, W.; Zhou, D.; Wang, Y. Effects of clay content on pore structure characteristics of marine soft soil. Water 2021, 13, 1160. [Google Scholar] [CrossRef]
- Appel, M.; Stallmach, F.; Thomann, H. Irreducible fluid saturation determined by pulsed field gradient NMR. J. Pet. Sci. Eng. 1998, 19, 45–54. [Google Scholar] [CrossRef]
- Gao, H.; Li, H. Determination of movable fluid percentage and movable fluid porosity in ultra-low permeability sandstone using nuclear magnetic resonance (NMR) technique. J. Pet. Sci. Eng. 2015, 133, 258–267. [Google Scholar] [CrossRef]
- Meng, M.; Ge, H.; Ji, W.; Shen, Y.; Su, S. Monitor the process of shale spontaneous imbibition in co-current and counter-current displacing gas by using low field nuclear magnetic resonance method. J. Nat. Gas Sci. Eng. 2015, 27, 336–345. [Google Scholar] [CrossRef]
- Tian, H.; Wei, C.; Wei, H.; Chen, P.; Cheng, F. A NMR-based analysis of drying processes of compacted clayey sands. Rock Soil. Mech. 2014, 35, 2129–2136. [Google Scholar]
- Brownstein, K.R.; Tarr, C.E. Importance of classical diffusion in NMR studies of water in biological cells. Phys. Rev. A 1979, 19, 2446–2453. [Google Scholar] [CrossRef]
- Benavides, F.; Leiderman, R.; Souza, A.; Carneiro, G.; Bagueira de Vasconcellos Azeredo, R. Pore size distribution from NMR and image based methods: A comparative study. J. Pet. Sci. Eng. 2020, 184, 106321. [Google Scholar] [CrossRef]
- Gao, S.; Chapman, W.G.; House, W. Application of low field NMR T2 measurements to clathrate hydrates. J. Magn. Reson. 2009, 197, 208–212. [Google Scholar] [CrossRef] [PubMed]
- Bird, N.; Preston, A.; Randall, E.; Whalley, W.; Whitmore, A. Measurement of the size distribution of water-filled pores at different matric potentials by stray field nuclear magnetic resonance. Eur. J. Soil Sci. 2005, 56, 135–143. [Google Scholar] [CrossRef]
- Jaeger, F.; Bowe, S.; Van As, H.; Schaumann, G.E. Evaluation of 1H NMR relaxometry for the assessment of pore-size distribution in soil samples. Eur. J. Soil. Sci. 2009, 60, 1052–1064. [Google Scholar] [CrossRef]
- Chen, P.; Liu, J.; Wei, C.; Xue, W. Approach to rapidly determining the water retention curves for fine-grained soils in capillary regime based on the NMR technique. J. Eng. Mech. 2017, 143, 04017032. [Google Scholar] [CrossRef]
- He, P.; Xu, Q.; Liu, J.; Li, P.; Pu, C.; Chen, D. Effect of pore size distribution on percolation characteristics of loess based on nuclear magnetic resonance technique. Sci. Technol. Eng. 2020, 20, 12355–12360. [Google Scholar]
- Wei, X. Hydraulic Path Dependence of Shear Strength and Slope Stability of Compacted Loess. Master’s Thesis, Guilin University of Technology, Guilin, China, 2021. [Google Scholar]
- Hu, R.; Li, X.; Wang, Y.; Gao, W.; Xia, J.; Li, Z.; Gao, W.; Sun, Y. Research on engineering geomechanics and structural effect of soil-rock mixture. J. Eng. Geol. 2020, 28, 255–281. [Google Scholar]
- Gao, Y.; Sun, D.; Zhang, J.; Luo, T. Temperature effect on the water retention curve of lime-treated soil during curing. Chin. J. Geotech. Eng. 2019, 41, 2191–2196. [Google Scholar]
- Tao, G.; Kong, L. Prediction of air-entry value and soil water characteristic curve of soils with different initial void ratios. Chin. J. Geotech. Eng. 2018, 40, 34–38. [Google Scholar]
- Zhang, Q.; Cao, Z.; Gu, C.; Cai, Y. Prediction of soil–water retention curves of road base aggregate with various clay fine contents. Appl. Sci. 2022, 12, 3624. [Google Scholar] [CrossRef]
- Kaothon, P.; Lee, S.-H.; Choi, Y.-T.; Yune, C.-Y. The effect of fines content on compressional behavior when using sand–kaolinite mixtures as embankment materials. Appl. Sci. 2022, 12, 6050. [Google Scholar] [CrossRef]
- Aldaood, A. Impact of fine materials on the saturated and unsaturated behavior of silty sand soil. Ain Shams Eng. J. 2020, 11, 717–725. [Google Scholar] [CrossRef]
- Hyodo, T.; Wu, Y.; Hyodo, M. Influence of fines on the monotonic and cyclic shear behaviour of volcanic soil “Shirasu”. Eng. Geol. 2022, 301, 106591. [Google Scholar] [CrossRef]
Figure 1.
Grain size distribution curves of sand and clay.
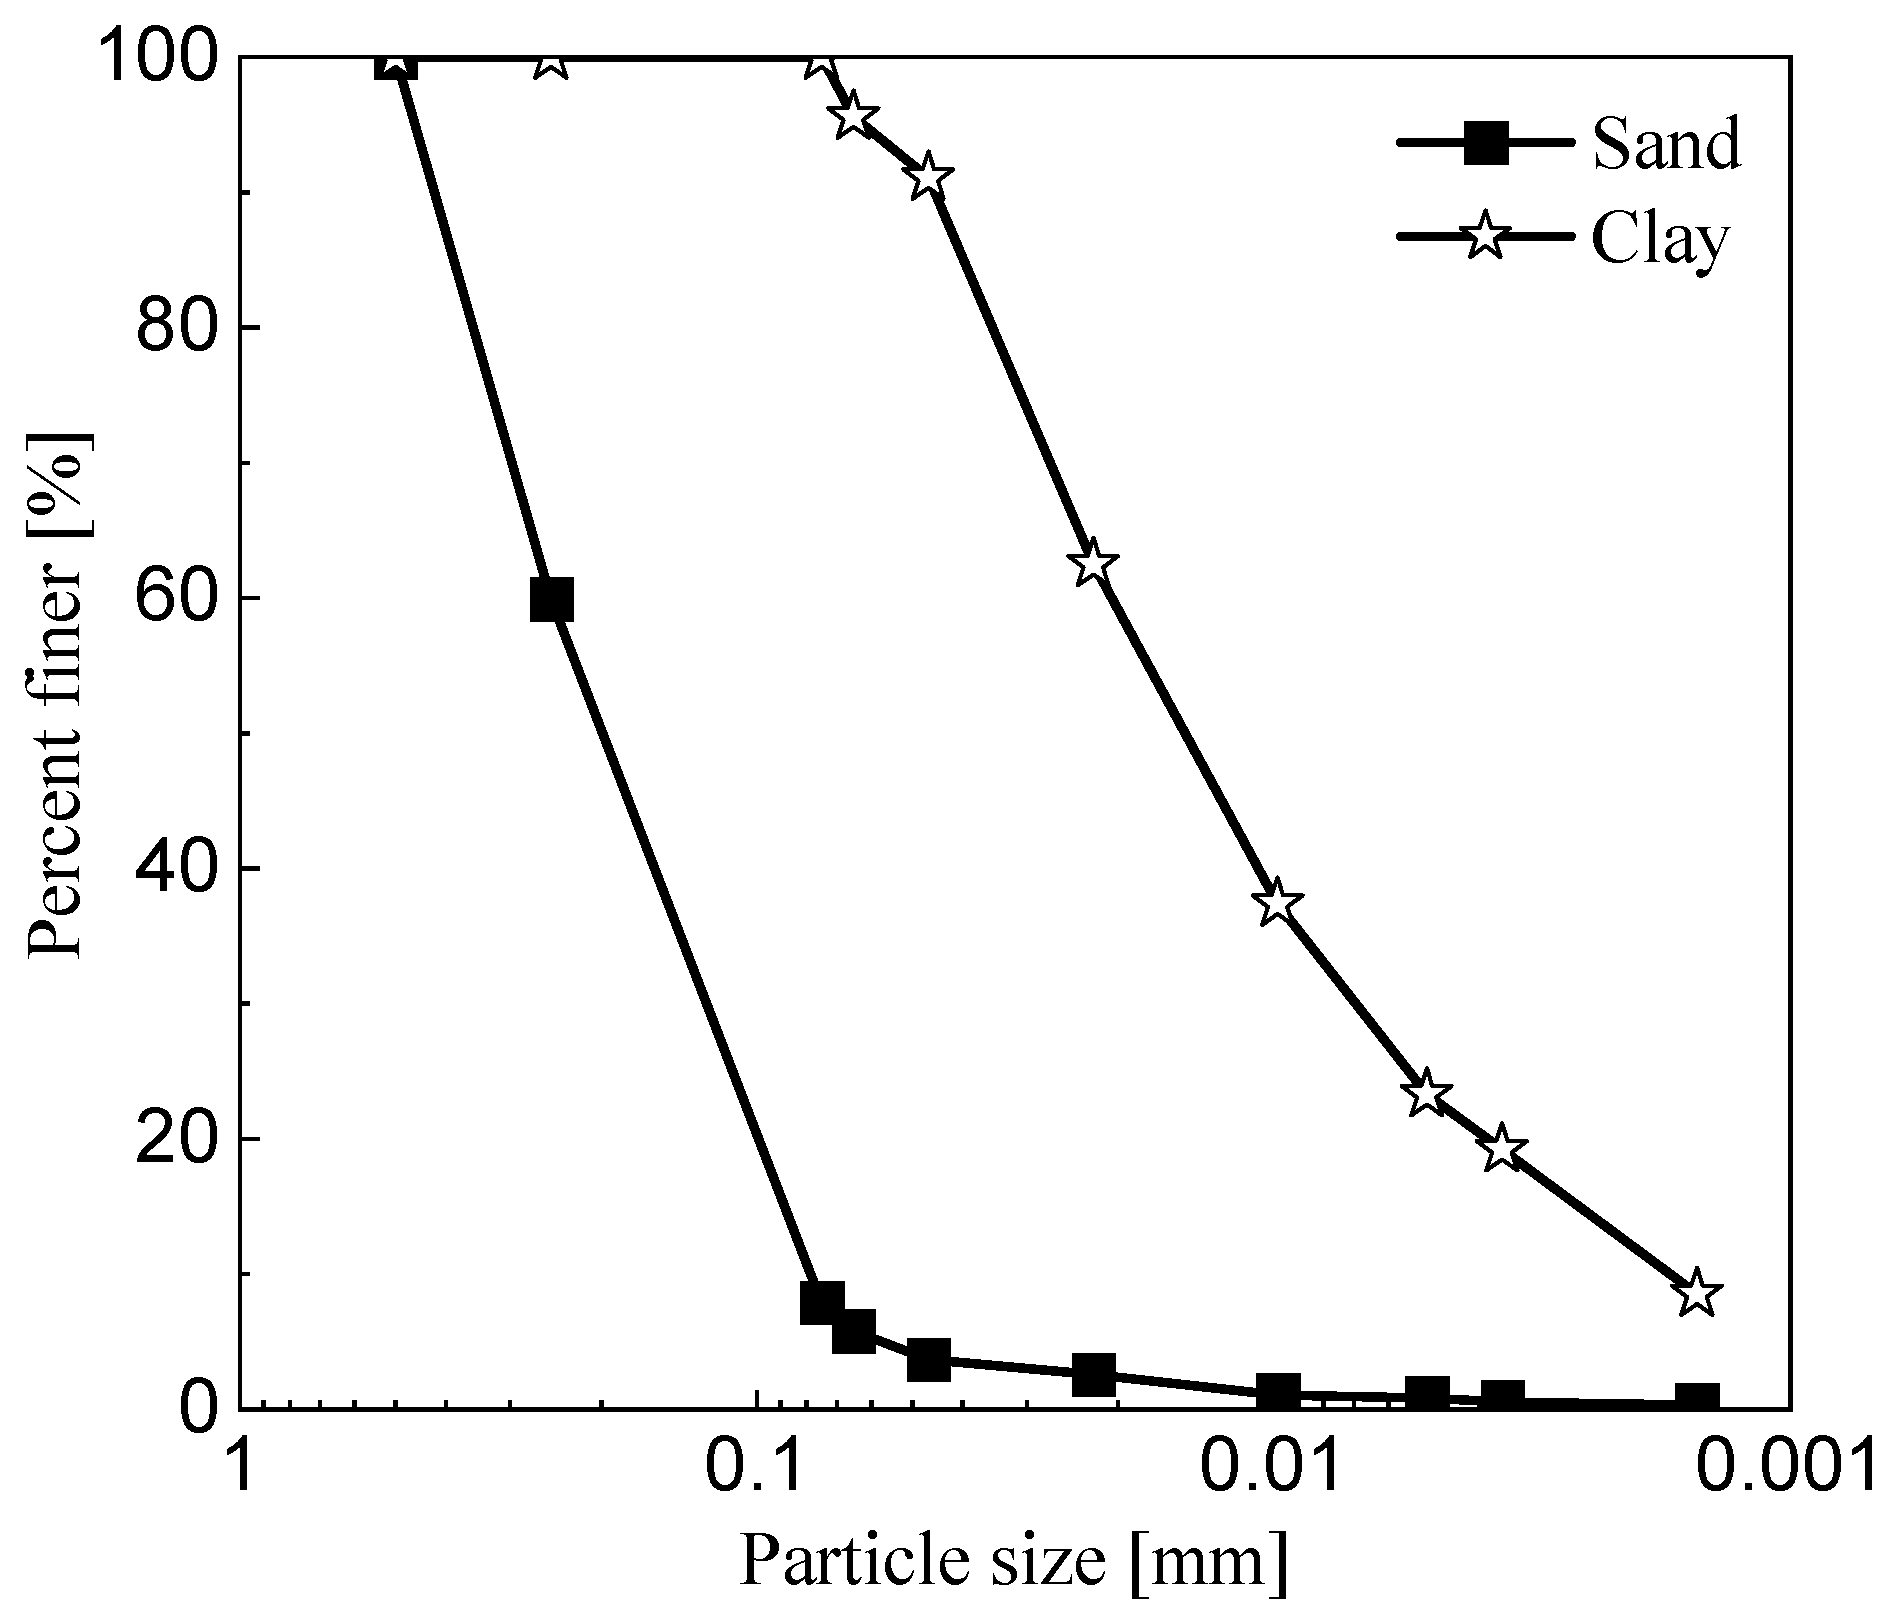
Figure 2.
Grain size distribution curves of composites with different fines content.
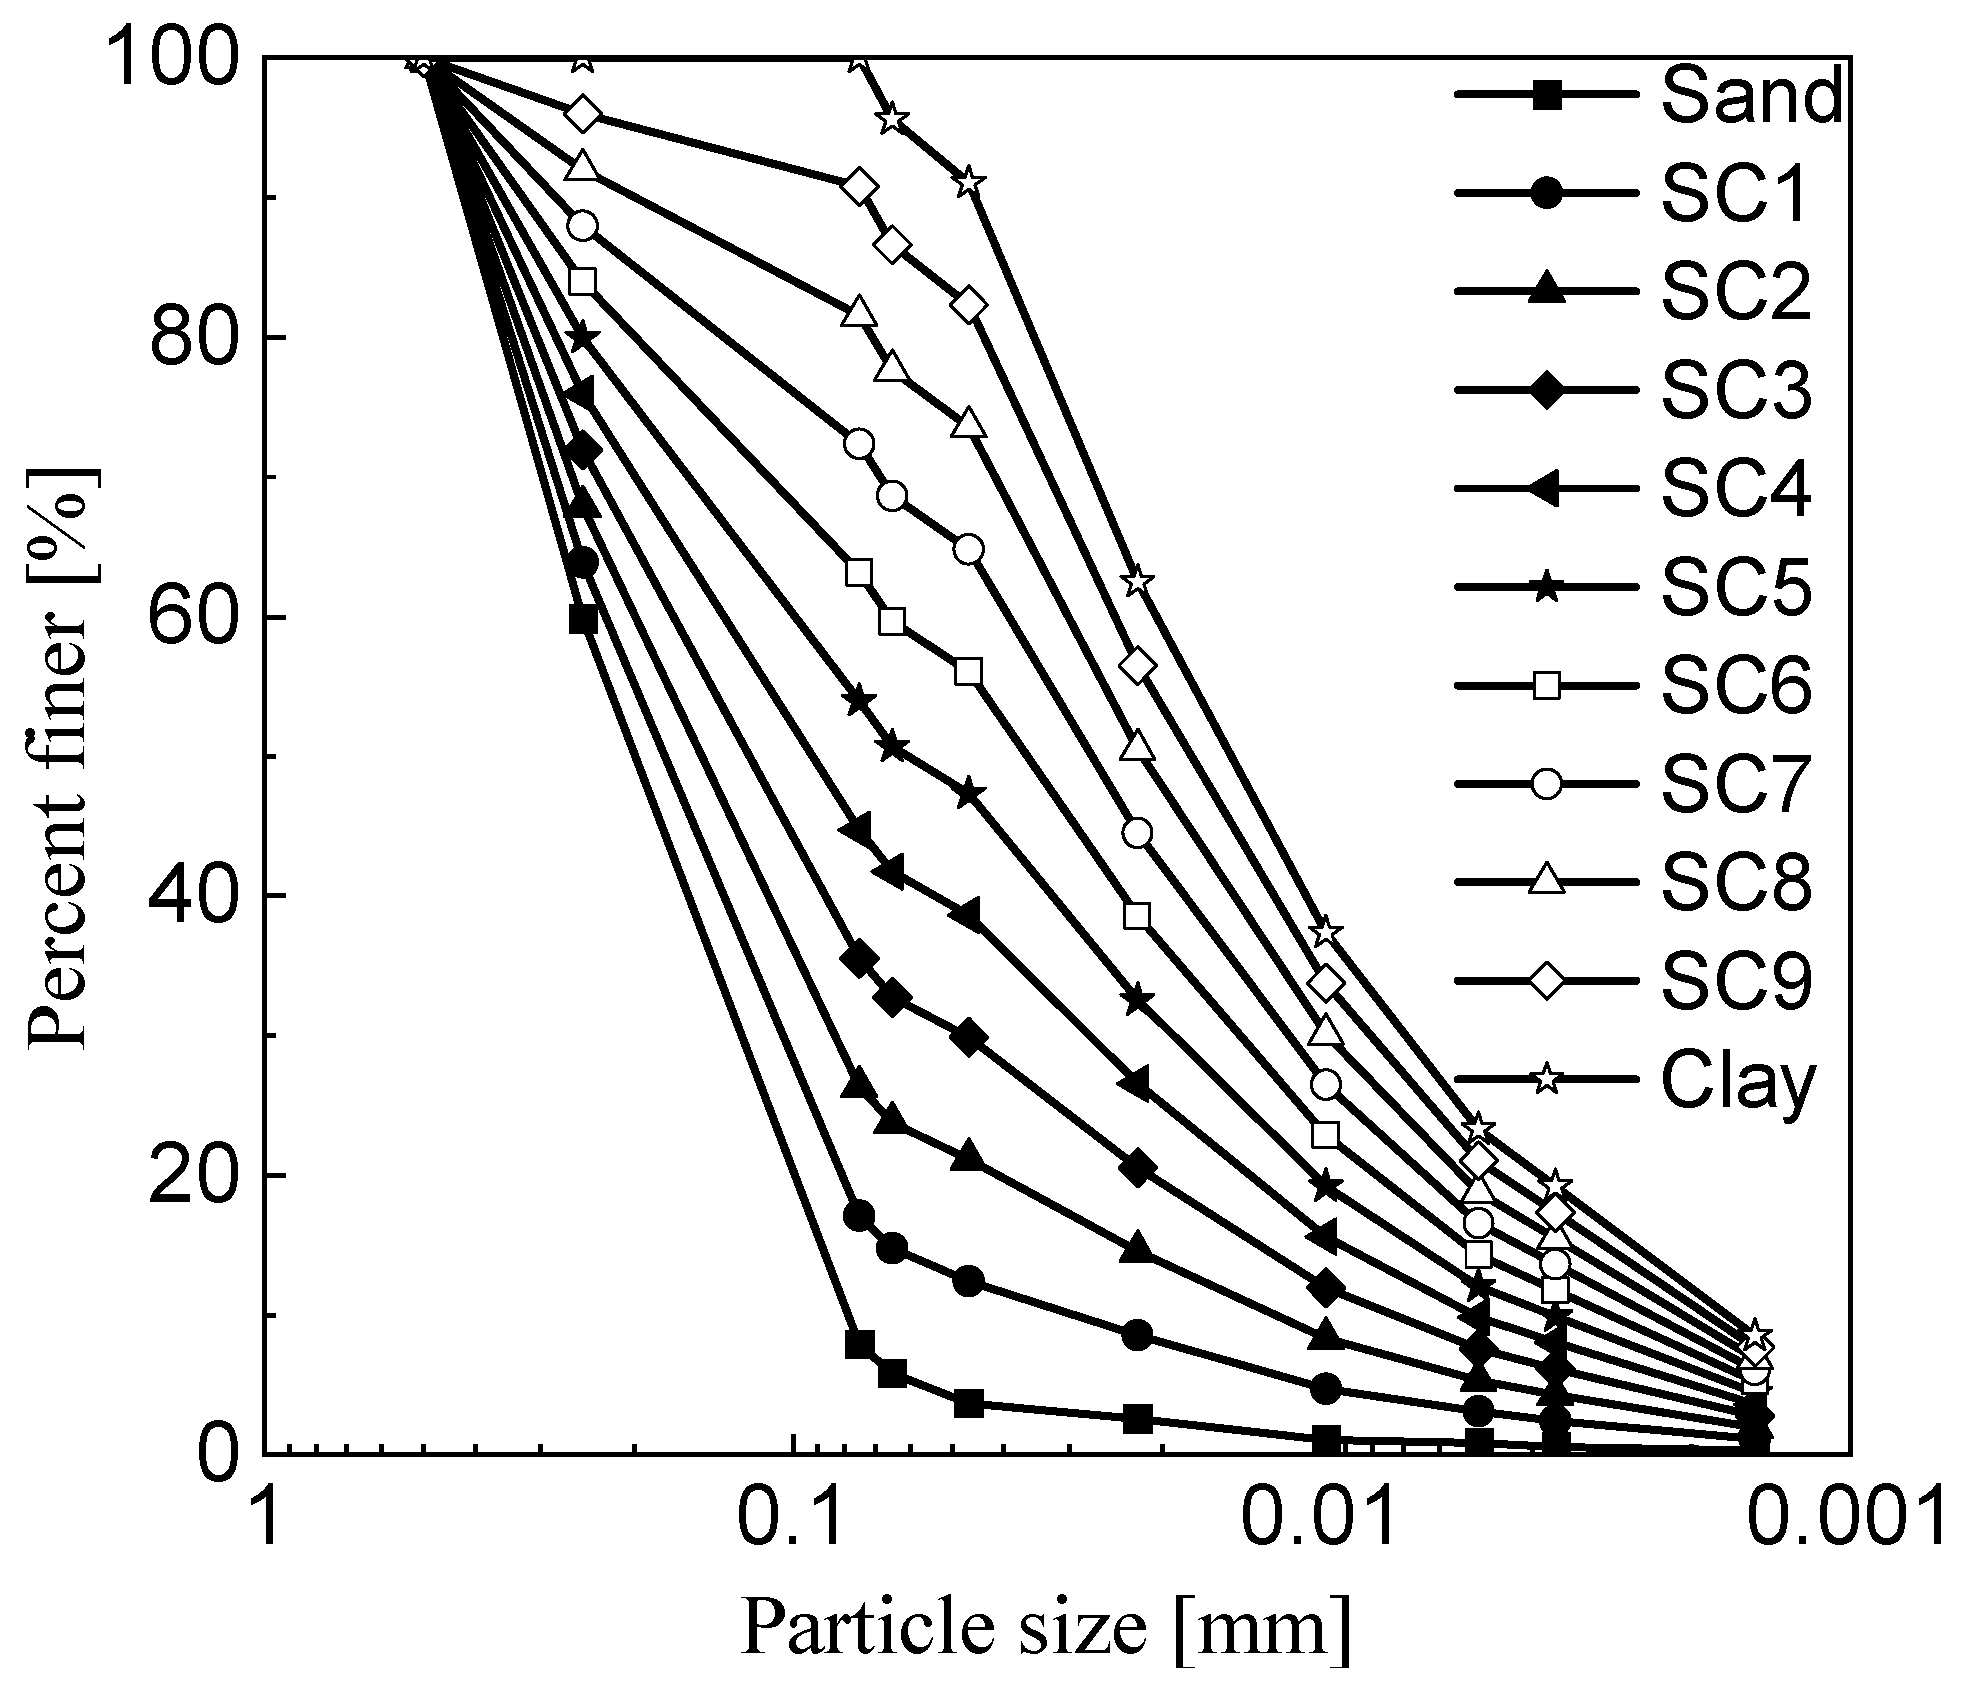
Figure 3.
T2 distribution curves of composite soils with different fines content.
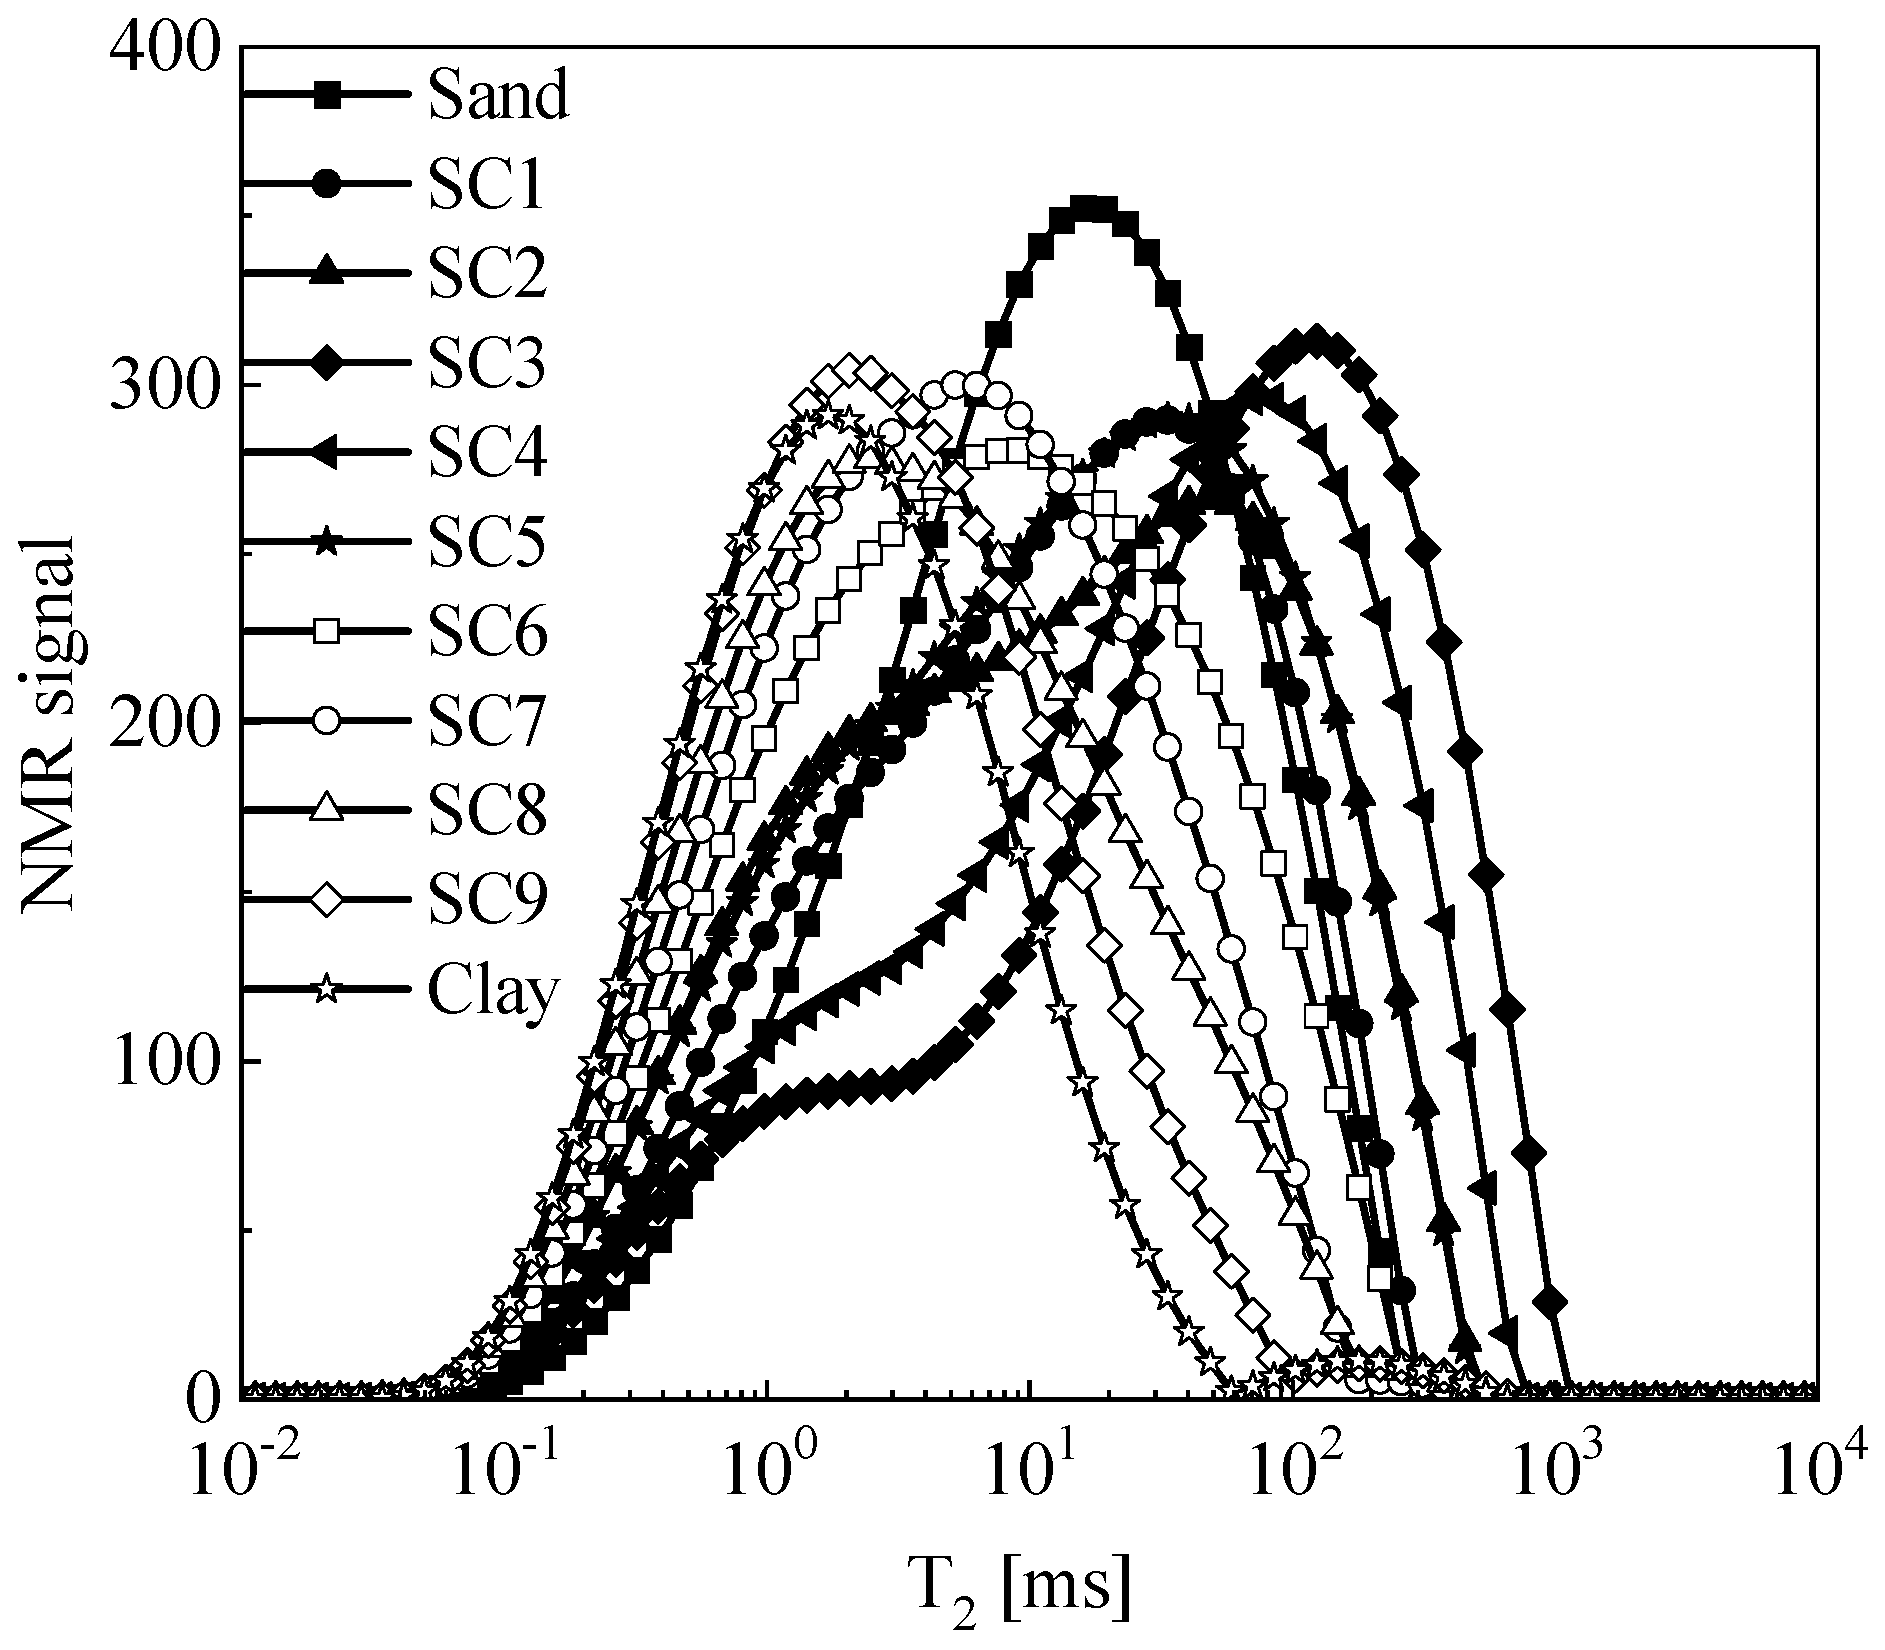
Figure 4.
T2 distribution curves of composite soils with different fines content: (a) 0~30%; (b) 40~100%.
Figure 4.
T2 distribution curves of composite soils with different fines content: (a) 0~30%; (b) 40~100%.
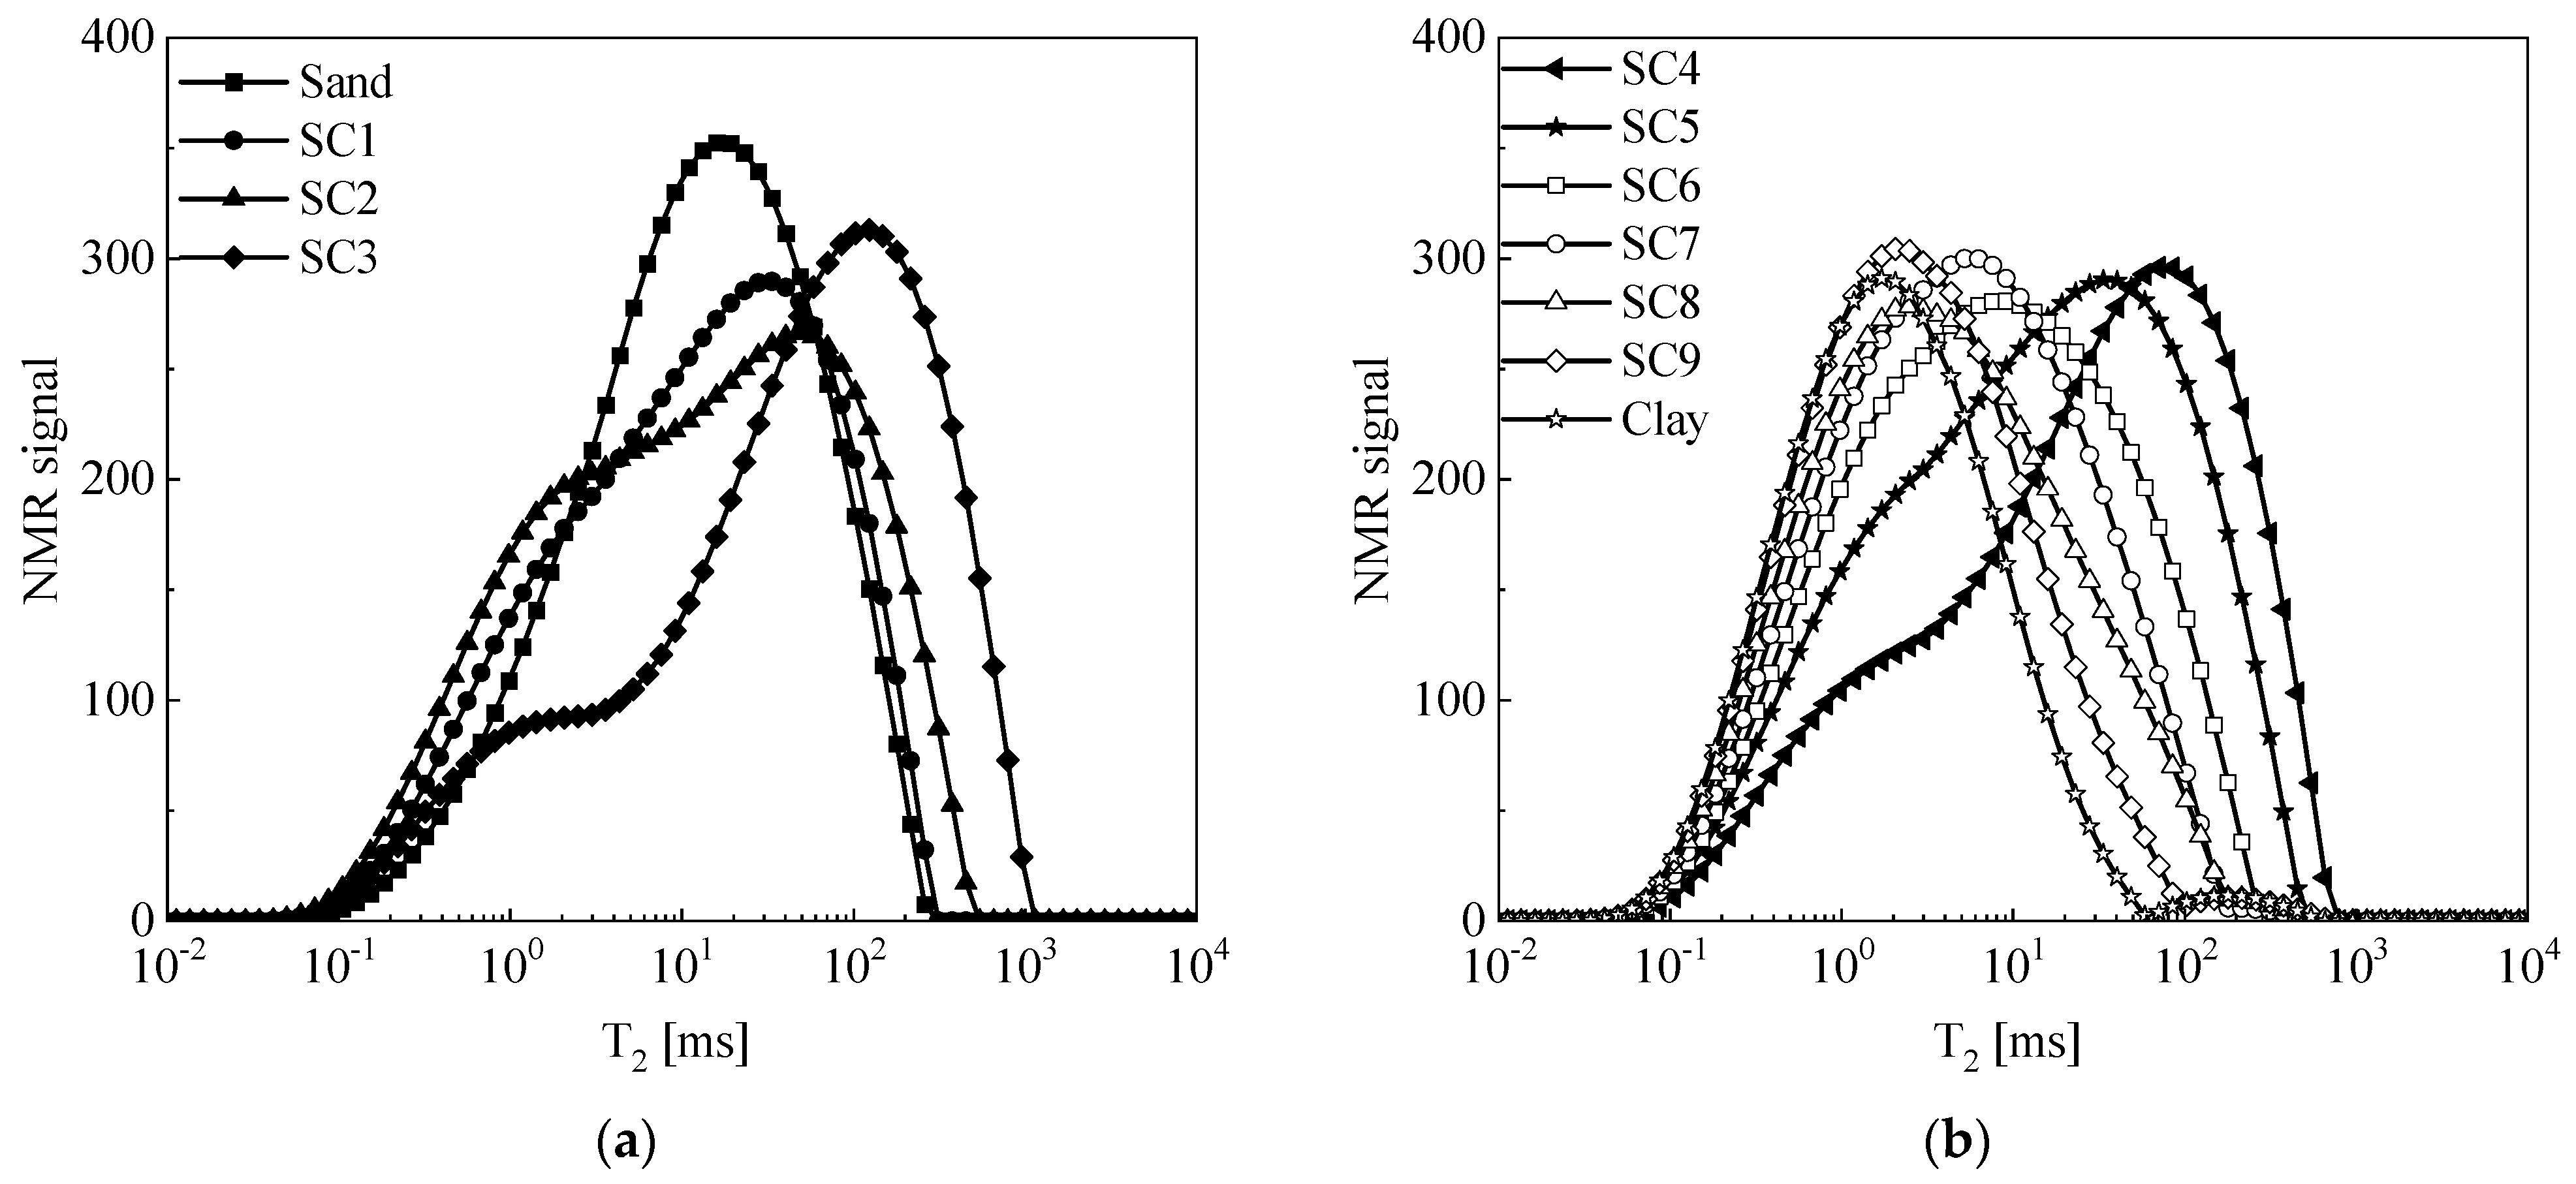
Figure 5.
Relationship between fines content and T2 value of peak signal.
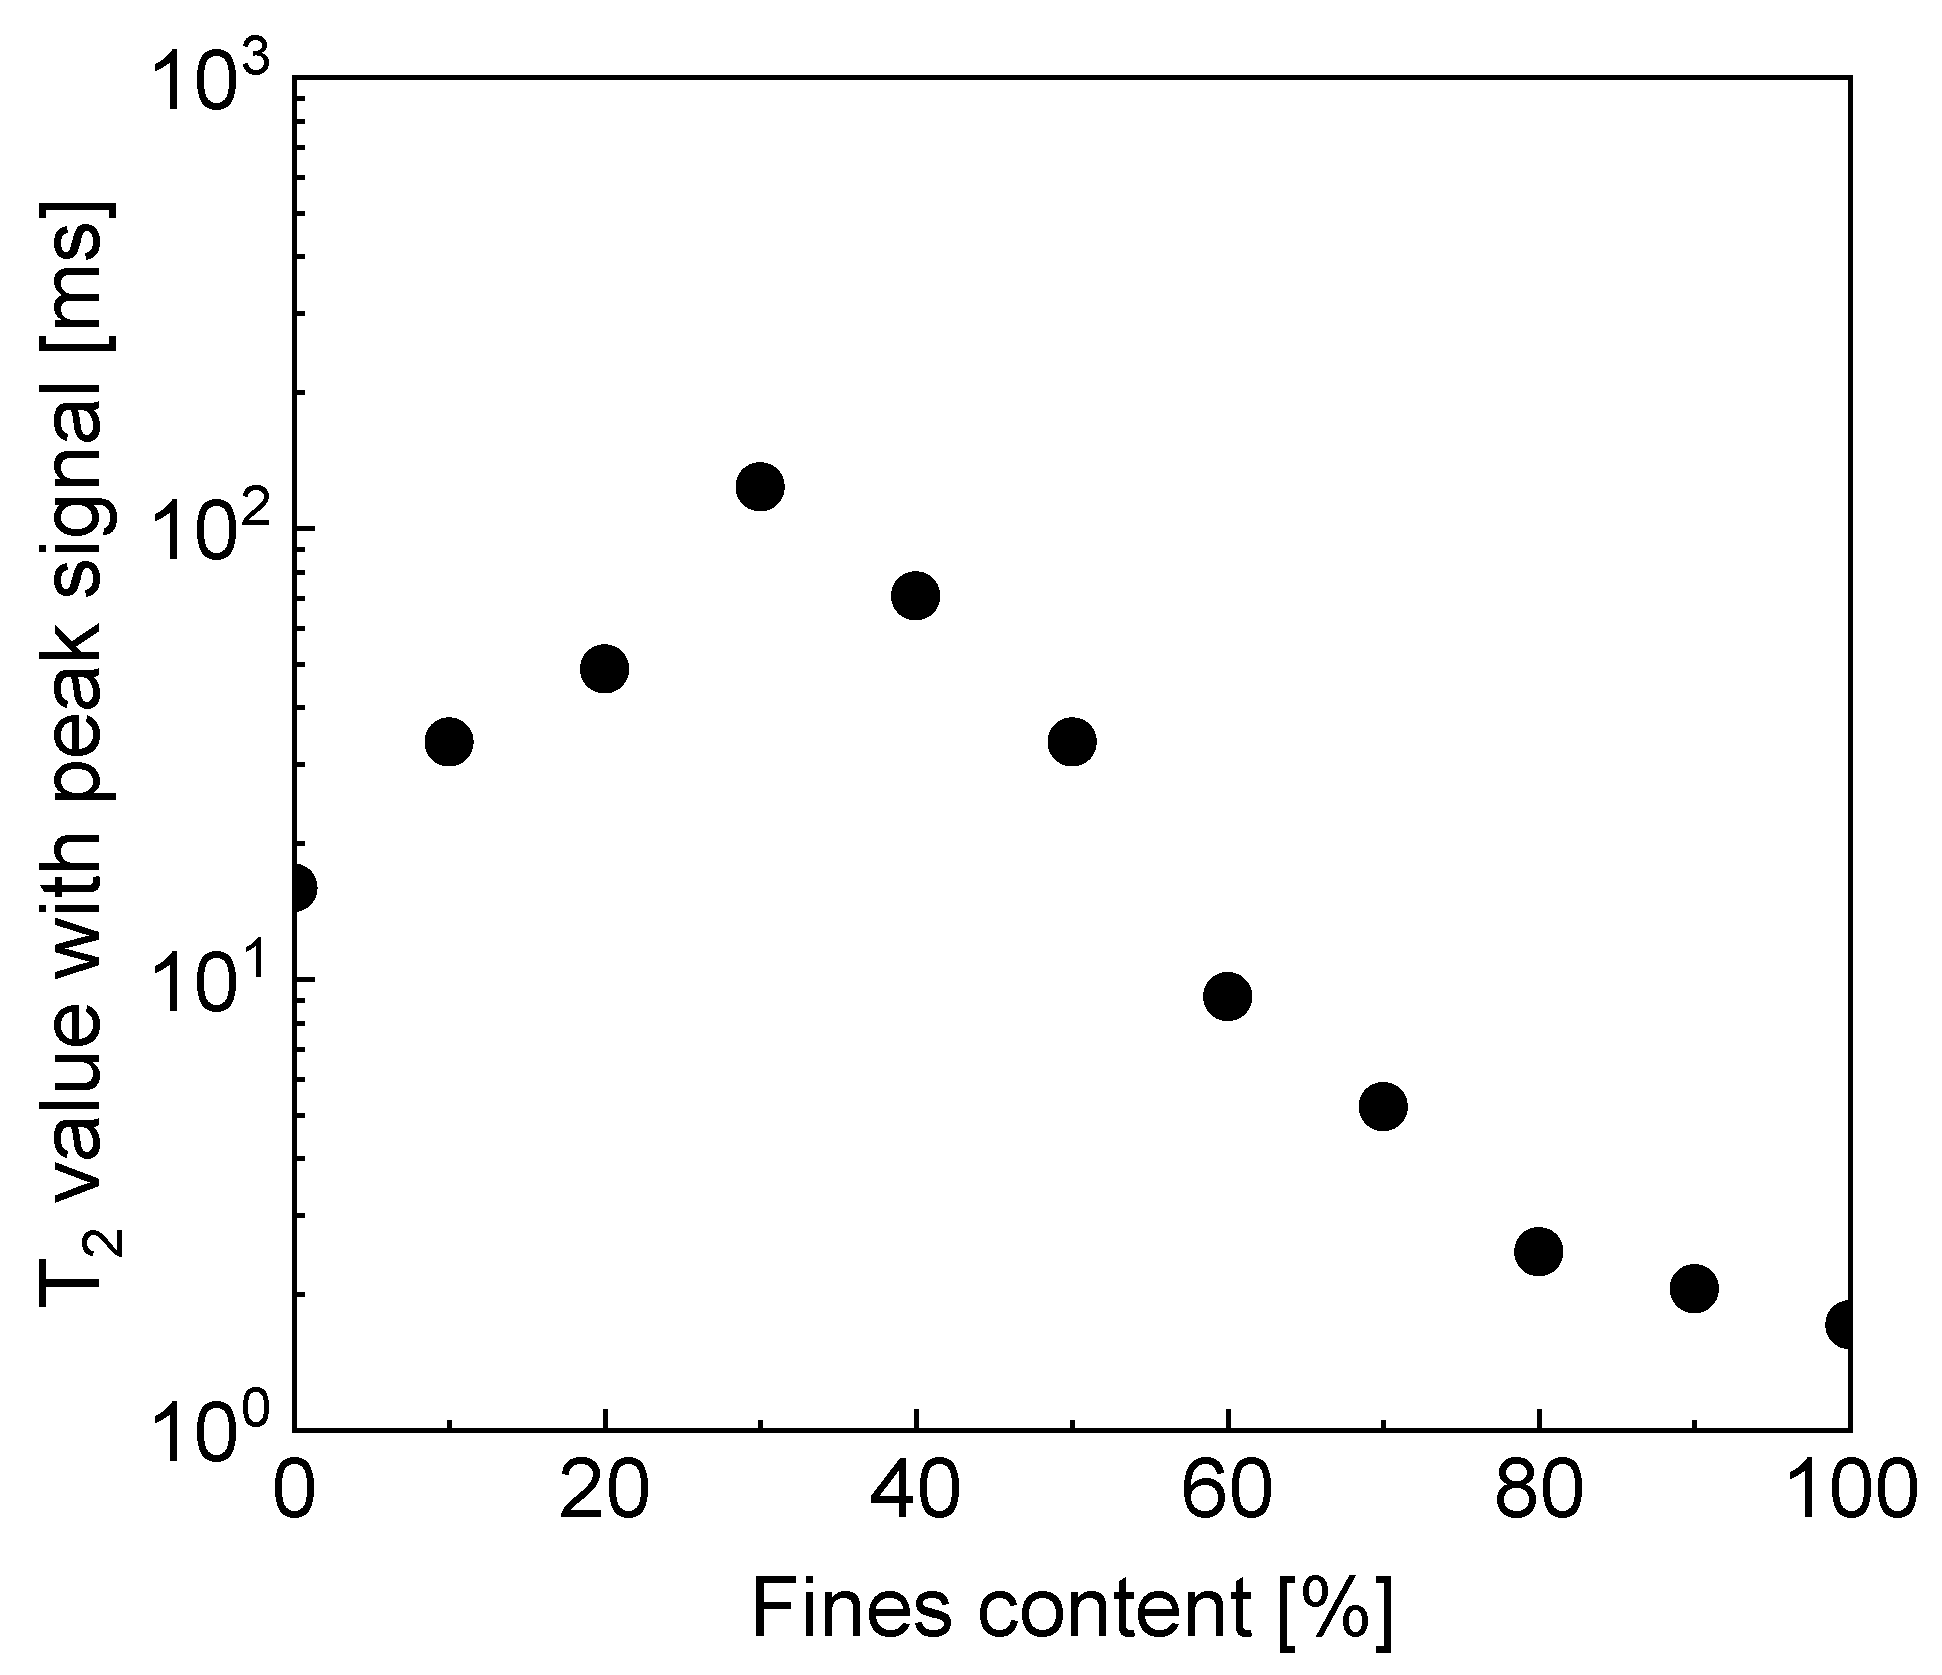
Figure 6.
Pore size distribution curves of composite soils with different fines content.

Figure 7.
Pore size distribution curves of composite soils with different fines content: (a) 0~30%; (b) 40~100%; (c) schematic diagram for the effect of fines content on the pore size distribution.
Figure 7.
Pore size distribution curves of composite soils with different fines content: (a) 0~30%; (b) 40~100%; (c) schematic diagram for the effect of fines content on the pore size distribution.
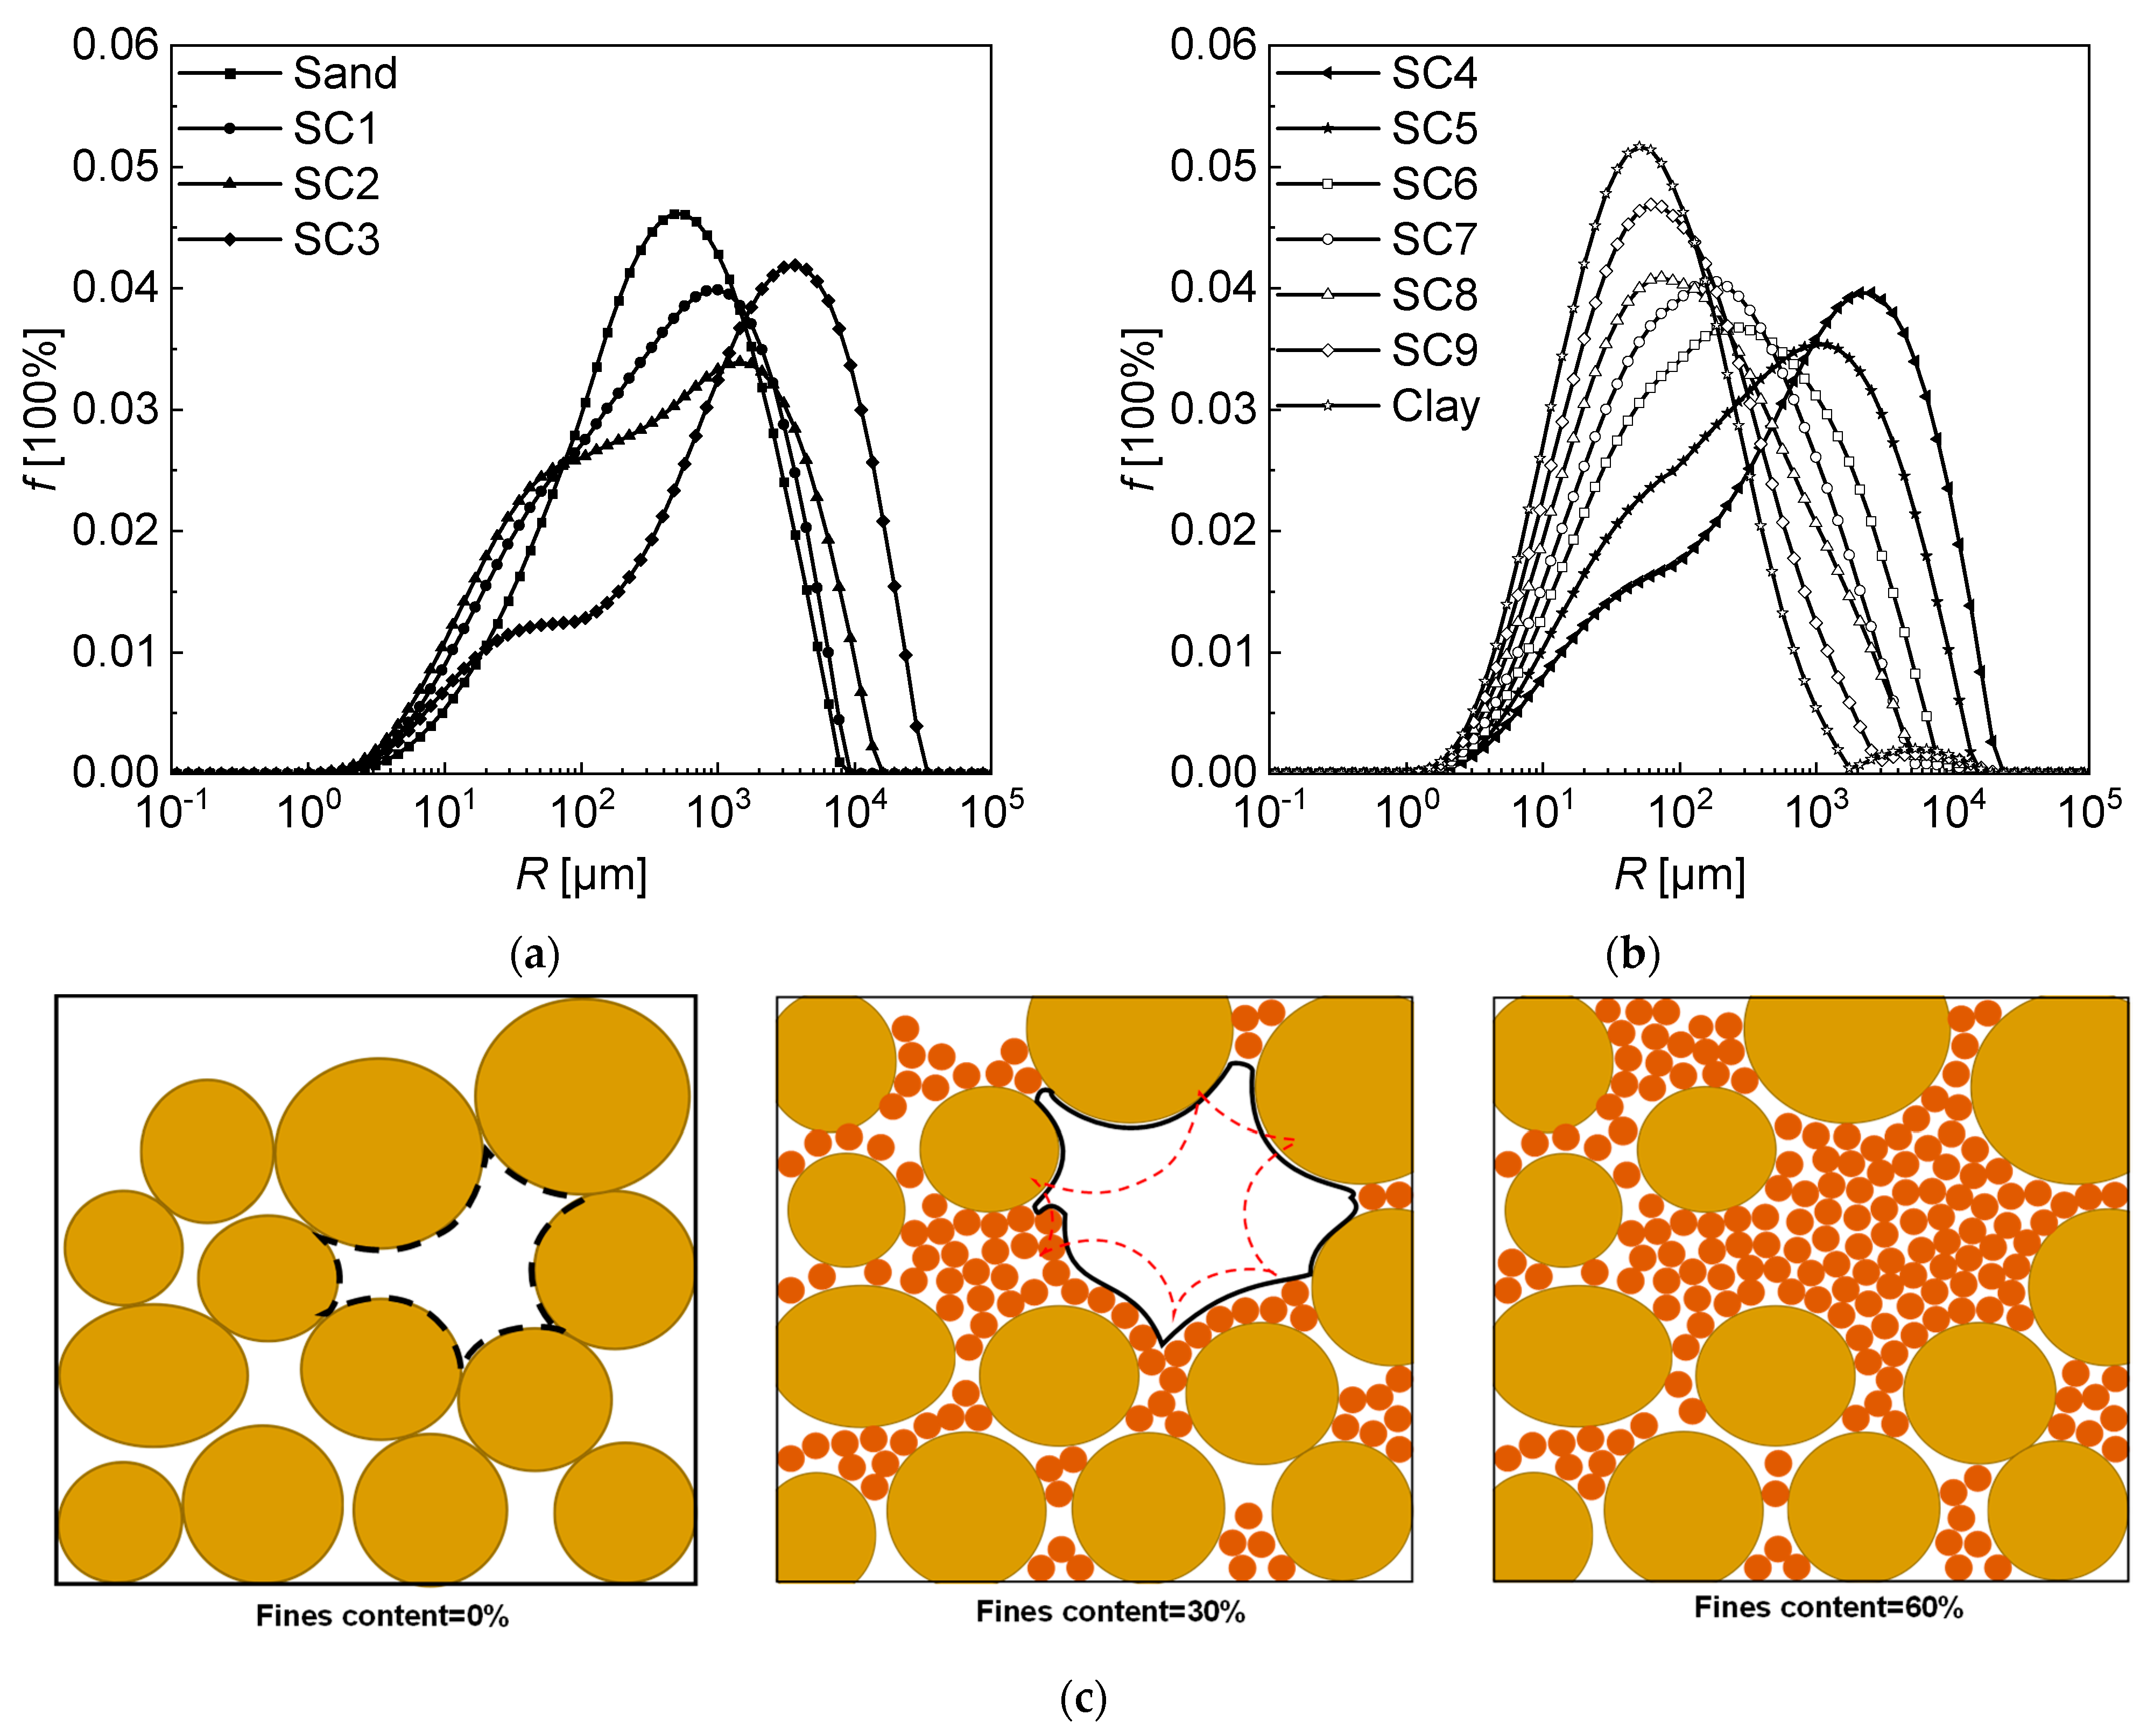
Figure 8.
Relationship between the dominated pore size of the composite soil and the fines content.
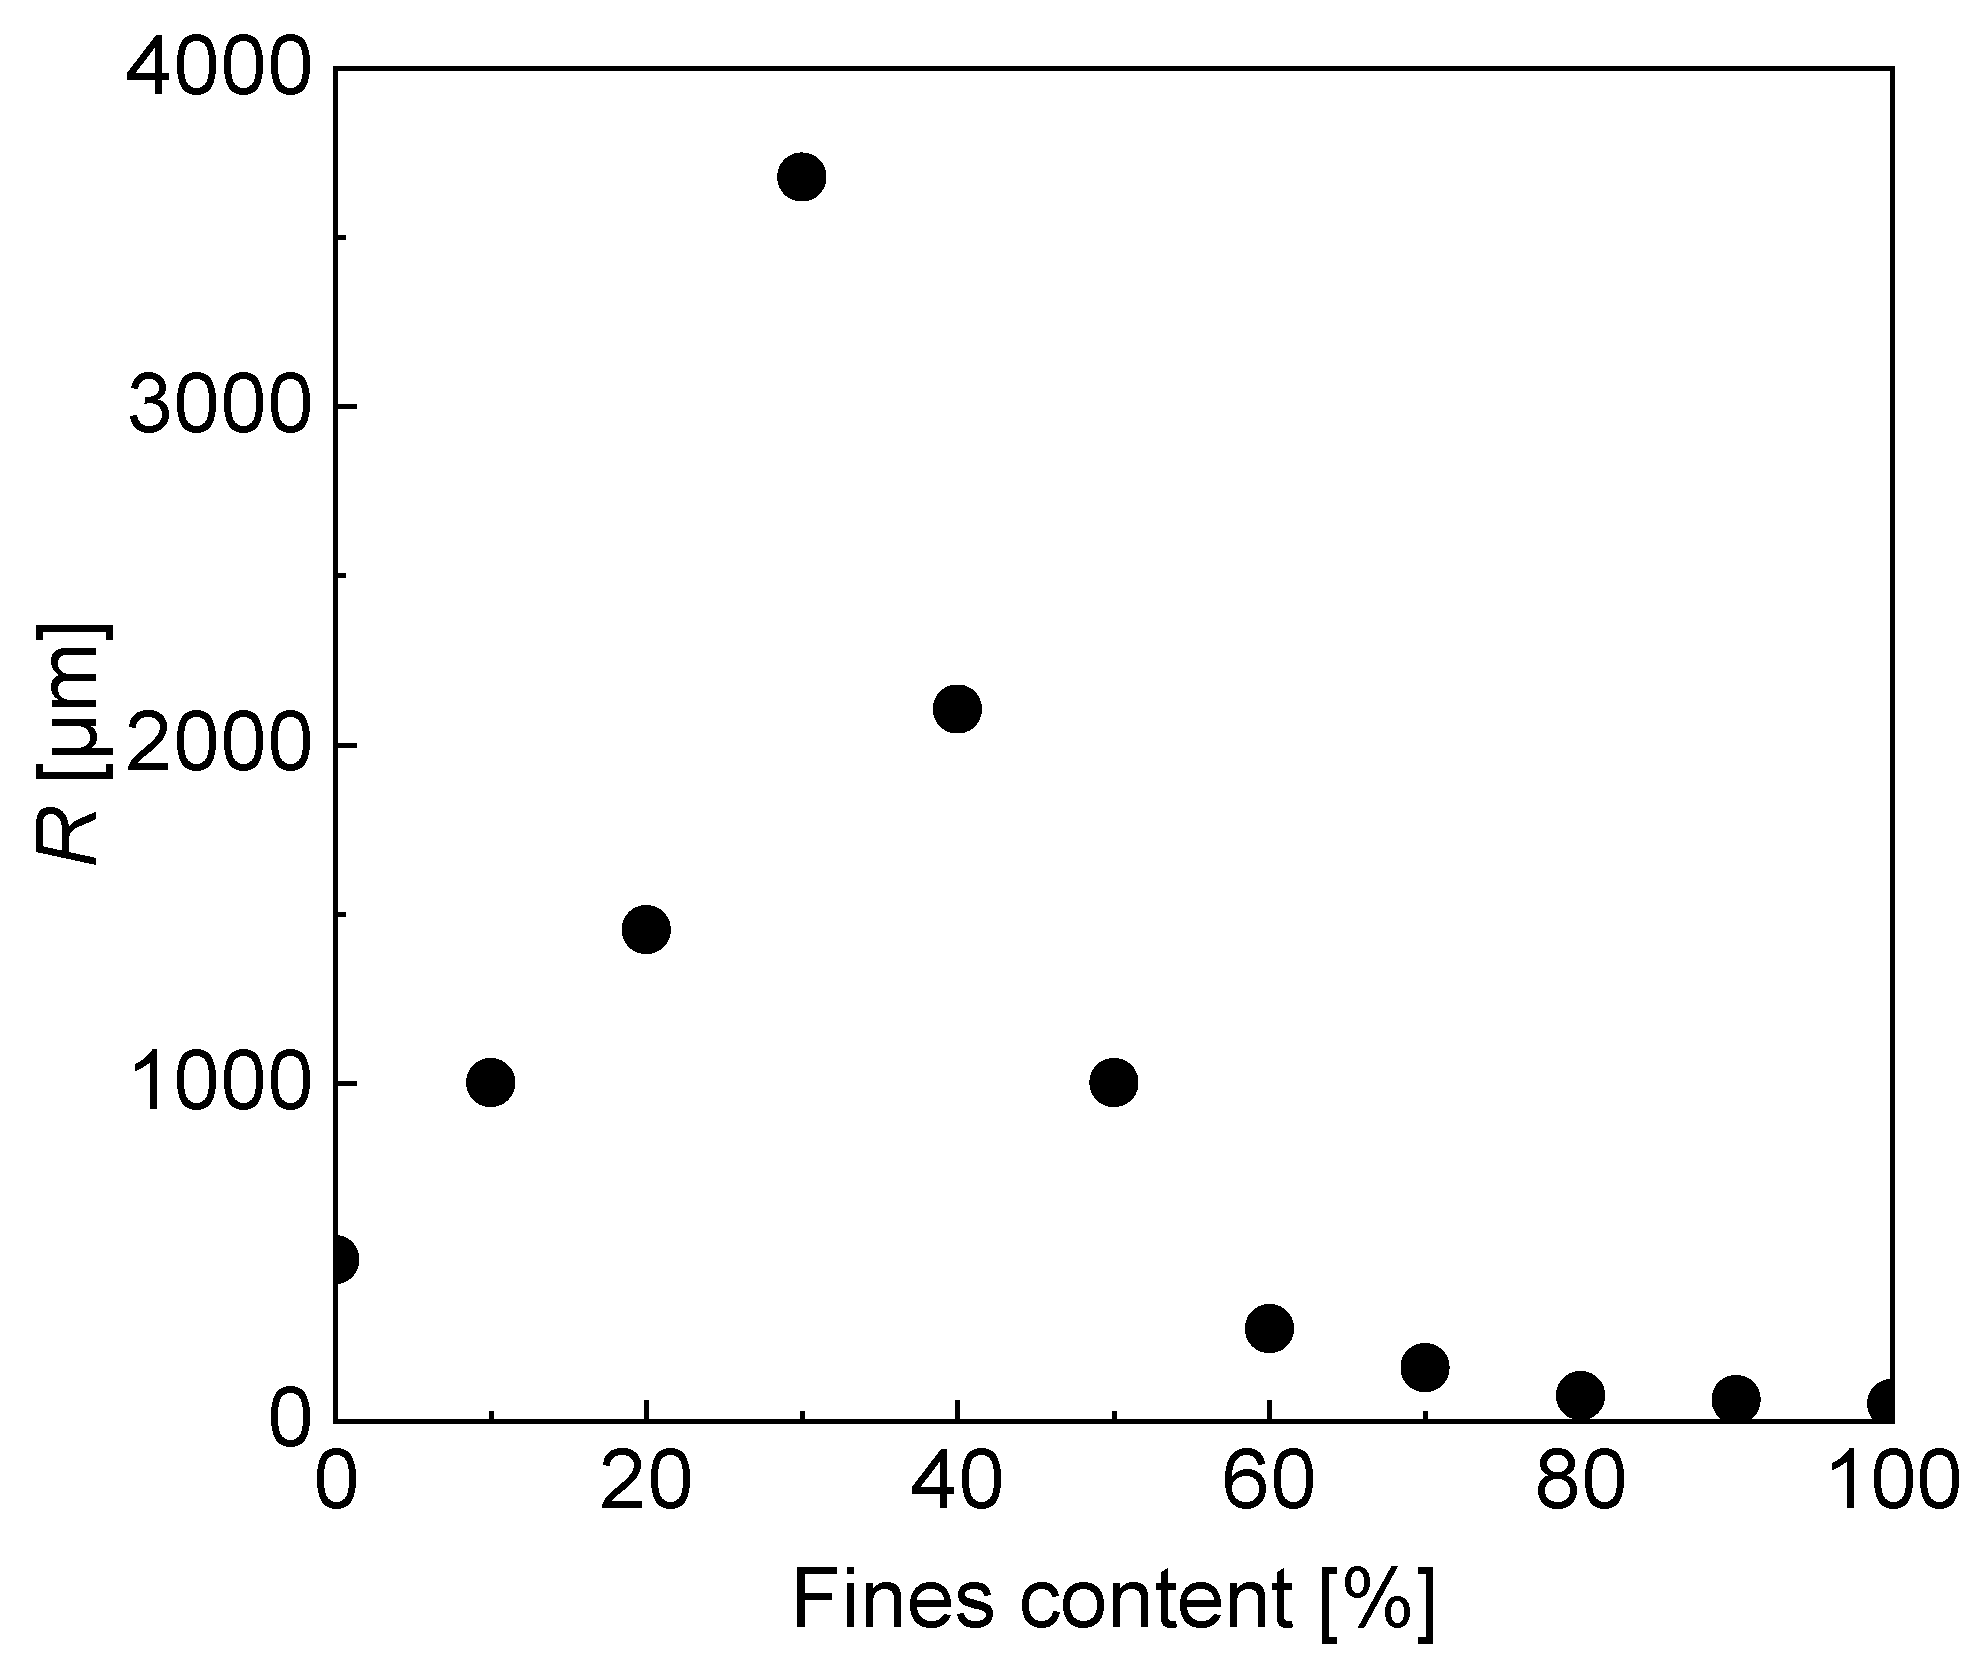
Figure 9.
Soil water characteristic curves of the composite soil with different fines content.


Table 1.
Physical indexes of sand and clay.
| Sand | Clay | ||
|---|---|---|---|
| Specific gravity | 2.67 | Specific gravity | 2.74 |
| Maximum void ratio | 1.02 | Liquid limit/% | 36.7 |
| Minimum void ratio | 0.62 | Plastic limit/% | 20.0 |
Disclaimer/Publisher’s Note: The statements, opinions and data contained in all publications are solely those of the individual author(s) and contributor(s) and not of MDPI and/or the editor(s). MDPI and/or the editor(s) disclaim responsibility for any injury to people or property resulting from any ideas, methods, instructions or products referred to in the content. |
© 2023 by the authors. Licensee MDPI, Basel, Switzerland. This article is an open access article distributed under the terms and conditions of the Creative Commons Attribution (CC BY) license (https://creativecommons.org/licenses/by/4.0/).
Share and Cite
MDPI and ACS Style
Wang, M.; Chen, P.; Yi, P.; Ma, T. Effect of Fines Content on Pore Distribution of Sand/Clay Composite Soil. Sustainability 2023, 15, 9216. https://doi.org/10.3390/su15129216
AMA Style
Wang M, Chen P, Yi P, Ma T. Effect of Fines Content on Pore Distribution of Sand/Clay Composite Soil. Sustainability. 2023; 15(12):9216. https://doi.org/10.3390/su15129216
Chicago/Turabian StyleWang, Mingqiang, Pan Chen, Panpan Yi, and Tiantian Ma. 2023. "Effect of Fines Content on Pore Distribution of Sand/Clay Composite Soil" Sustainability 15, no. 12: 9216. https://doi.org/10.3390/su15129216
Note that from the first issue of 2016, this journal uses article numbers instead of page numbers. See further details here.