Article

Remote Sensing Surveillance of NO2, SO2, CO, and AOD along the Suez Canal Pre- and Post-COVID-19 Lockdown Periods and during the Blockage

1
Department of Natural Resources, Faculty of African Postgraduate Studies, Cairo University, Giza 12613, Egypt
2
Department of Water Supply, Sanitation and Environmental Engineering, IHE Delft Institute for Water Education, Westvest 7, 2611 AX Delft, The Netherlands
3
Faculty of Behavioral, Managerial and Social Sciences, University of Twente, Drienerlolaan 5, 7522 NB Enschede, The Netherlands
4
Environmental Engineering Program, Zewail City of Science and Technology, 6th October City, Giza 12578, Egypt
5
Civil Engineering Department, Higher Institute for Engineering and Technology, New Damietta, Ministry of Higher Education, New Damietta 34517, Egypt
6
Faculty of Engineering and Technology, Badr University in Cairo (BUC), Cairo 11829, Egypt
*
Author to whom correspondence should be addressed.
Sustainability 2023, 15(12), 9362; https://doi.org/10.3390/su15129362
Submission received: 23 April 2023 / Revised: 7 June 2023 / Accepted: 8 June 2023 / Published: 9 June 2023

Abstract

:
This study investigates the impact of the COVID-19 pandemic and the Ever Given ship blockage on the air quality in Suez Canal region. Nitrogen dioxide (NO2), sulfur dioxide (SO2), carbon monoxide (CO), and aerosol optical depth (AOD) were studied, and data were obtained from satellite instruments. The study compared monthly average data for 2020, 2021, and 2022 with a baseline period of 2017–2019 to investigate the pandemic’s effect. The study also analyzed the corresponding period of the canal blockage to identify its impact on air pollution levels. The pandemic had a significant role in decreasing NO2 by 2.5 × 1014 molecule/cm2 and SO2 by 0.05 DU due to reduced car traffic and industrial activities. A reduction in AOD by 20% and CO concentration in the range from 3.5% to 4.7% was reported in early 2020. During the blockage, NO2 and SO2 levels decreased by 14.4% and 66.0%, respectively, while CO and AOD index increased by 12.68% and 51.0%, respectively. The study concludes that the containment measures during the pandemic had a positive impact on the environment, which shows how the reduction in the anthropogenic activities, especially industrial and transportation activities, have improved the air quality. Thus, stricter actions are needed to protect the environment; for example, the transition towards the using of electric vehicle is necessary, which is part of Egypt’s strategy to transition towards a green economy. The government should also adopt a policy to trade carbon emissions reduction certificates to help reduce air pollution.

1. Introduction

On the 31 December 2019, the Municipal Health commission of Wuhan informed the World Health Organization (WHO) office in China about the emergency of pneumonia cases of obscure etiology [1]. On the 9 January, the Chinese Center for Disease Control and Prevention (China CDC) announced that these cases were a result of a novel coronavirus that was detected in 15 additional cases of pneumonia [2]. Later, on the 11 March 2020, the WHO declared that the Severe Acute Respiratory Syndrome Coronavirus-2 (SARS-CoV-2) has caused a global pandemic after infecting more than 118,000 people in more than 110 countries [3]. Egypt recorded its first case of pneumonia due to COVID-19 in March 2020. To stop the COVID-19 virus from spreading within Egypt’s borders, the government implemented a few limitations. These limitations included quarantine, partial lockdown, border closures, movement restrictions, social isolation, and staff reductions in non-essential services. In addition, the Egyptian government initiated the “stay at home” campaign to control the pandemic as much as possible [4]. As a result of shocks brought on by the pandemic and the spoilage of agricultural goods, food supply chains were also impacted [5,6].
Egypt is one of the developing countries that face challenges in terms of air pollution. For a long time, the Greater Cairo region has seen deteriorating air quality, which is brought on by both significant anthropogenic activity, such as traffic, industry, and agricultural biomass burning events, and natural sources of particulate matter, such as dust and sand events [7]. There are several measurables that can be used as indicators for air pollution, such as nitrogen dioxide (NO2), ozone (O3), absorbing aerosol Index (AAI), and carbon monoxide (CO). These concentrations are an increasing concern given that they show an increasing trend with the prosperity of the economy and are emitted close to the ground level [8]. This can ultimately affect the quality of the environment and human health and consequently global sustainability. Both NO2 and SO2 play a significant role in atmospheric chemistry [9,10]. NO2 is a precursor of secondary fine particulate matter and tropospheric ozone which are both linked to various environmental and health concerns [11]. NO2 itself is the cause of various diseases, including pulmonary heart disease and lung impairment [12,13]. SO2 is another infamous pollutant, being the main precursor of acid rain, a phenomenon that can damage infrastructure, soil quality, water quality, and aquatic environments [14,15,16]. Many countries have successfully minimized their ambient SO2 concentrations by introducing regulations mandating the use of low-sulfur fuel in maritime transport [17,18]. According to [19], premature mortality and morbidity can be reduced by 34% and 54% if the ships have used cleaner fuels with less sulfur content.
As countries went into lockdown, industrial and commercial activities ceased or paused. For example, transportation was significantly affected as road transportation was either stopped or reduced due to the restrictions of the lockdown. Previous research has suggested that the governmental policies and acts can directly reduce human activity, commercial demand, and transportation, which consequently reduces urban air pollution [20,21,22,23]. Supporting this, studies on subsequent modeling [22], satellite observation [24,25], and data monitoring [26,27] from areas that had earlier been impacted and/or subject to lockdowns all indicated high affiliated declines in pollutant levels, with many of these declines being in the range of 25–55% and 15–30% for NO2 and PM10, respectively. After analyzing PM2.5 data from Beijing, Shanghai, Guangzhou, and Wuhan during COVID-19, a significant decrease in air pollution was linked to lower emissions in the transportation and industrial sectors [28]. According to [25], lockdowns caused NO2 emissions in China, Spain, France, Italy, and the USA to drop by 20–30%. It was also noted a decrease in PM2.5 in the world’s largest cities [29].
Regionally, NO2 was found in the eastern province of Saudi Arabia to be a marker pollutant in response to the lockdown measures, as it had decreased up to 86% during the lockdown period compared with the pre-lockdown period [30]. Significant reductions were also found with varying rates for respirable particulate matter (PM10) (21–70%), CO (5.8–55%), and SO2 (8.7–30%) in the same context. In Abu Dhabi in the United Arab Emirates (UAE), NO2 had decreased up to 40%, while the SO2, CO, and C6H6 had decreased by 12.2, 25.8, and 19.9%, respectively [31]. Similar findings were also found out in Egypt as well; it was found that AAI has decreased by 30% and NO2 decreased by 15% and 30% over Cairo and Alexandria governorates, respectively [30]. The CO has decreased by 5% over the two governorates, while the GHG emissions decreased by 4% during the studied period of 2020 [32].
Research on the impact of COVID-19 lockdowns on air pollution used different sources of data depending on the available resources. For example, Kotnala et al. [33] collected data from local air monitoring stations owned by the Central Pollution Control Board (CPCB) of New Delhi. In China, researchers combined ground indicators and satellite information to investigate air pollution during lockdowns [34], while Gautam et al. [35] utilized satellite data from NASA to study changes in air quality in India. The data collection process varied between studies, with some analyzing yearly data, including short- or long-term periods, and others using different time bases. Some studies included data from the entire year, while others focused on a specific season and compared it with the studied COVID year period. The reported information also varied by location, with cities having more air monitoring stations than rural areas, resulting in studies ranging from a limited number of locations (tens) to comprehensive ones (hundreds or thousands). In developed countries, researchers tend to obtain data from multiple sources, including satellites, local air stations, and environmental protection agencies [36]. However, for countries with limited ground resources, the data come mainly from available satellites. NASA remote sensing data comprise a valuable tool for monitoring air pollutant concentrations from space. NASA’s Earth Observing System (EOS) has several satellites that collect data on various atmospheric pollutants such as nitrogen dioxide, carbon monoxide, sulfur dioxide, and particulate matter. The data collected from these satellites can be used to generate air quality maps that show the spatial distribution of pollutants [37,38]. Other studies have used a combination of low-cost sensor data and satellite remote sensing for monitoring air pollutants [39,40,41].
Several studies have investigated the changes in air quality during the COVID-19 lockdown periods using remote sensing data. For example, Chu et al. [42] analyzed the NO2 concentration over China during the lockdown period and found a significant reduction in NO2 concentration as compared to the same period in the previous year. Similarly, Orak and Ozdemir [43] examined the SO2 concentration across Turkey and reported a 59% decrease in SO2 levels in April 2020 as compared to the previous five years (2015–2019). Otmani et al. [44] have observed a significant reduction in NO2 and SO2 concentrations by about 96% and 49%, respectively, over Salé City, Morocco. In northern Egypt, El-Sheekh and Hassan [45] have reported that the NO2, PM10, and PM2.5 concentrations decreased by 25.9%, 22.8%, and 29.3%, respectively, after the first lockdown, which started on 13 March 2020, due to the reduction in transportation, as well as industrial and economic activities [45]. A significant reduction in NO2 and PM were also reported during the full lockdown on official holidays (Easter, Ramadan, and Eid Al-Fitr) [45]. Bray et al. [46] analyzed the changes in CO concentrations recorded by most monitoring sites in Europe, USA, China, and India, and found a decrease in CO concentrations during the lockdown period. Furthermore, remote sensing has also been used to monitor AOD during the COVID-19 lockdown periods. Ranjan et al. [47] analyzed the changes in AOD over India and found a decrease in AOD levels during the lockdown period.
Although the literature has proven the COVID 19 impact on air quality, this study comes in a series of needed examinations conducted on a regional scale to investigate not only the short-term effect but also the long-term one, as well as the extent of variations on spatial basis. This study aims to investigate the influence of COVID-19 and the Suez Canal closure on the air quality in the Suez Canal region during 2020, 2021, and 2022 and compares it with the mean values from previous years (2017–2019) as the baseline. Several indicators were used for that purpose, such as NO2, SO2, CO, and AOD indices. To achieve these aims, (i) the concentration data for NO2 and SO2 were obtained from Ozone Monitoring Instrument (OMI); (ii) an Atmospheric Infrared Sounder (AIRS) was used to collect carbon monoxide data, and Goddard Earth Sciences Data and Information Services Center (GES/DISC) is the primary repository for AIRS CO product; (iii) Aerosol Optical Depth (AOD) data are obtained from Moderate Resolution Imaging Spectroradiometer (MODIS) on the AQUA satellite with a quality flag (QF) of at least 2 and a spatial resolution of 10; km, and (iv) the monthly averaged data for the study duration (2020, 2021, and 2022) were compared with the baseline period (2017, 2018, and 2019) to investigate the role played by the COVID-19 pandemic and the Suez Canal closing during the Ever Given ship accident in the changing air quality.

2. Materials and Methods

2.1. Study Area

Egypt’s Suez Canal, which was constructed in the 19th century, is one of the most important human-made waterways in the world [48]. According to the Suez Canal Authority, 18,880 vessels carrying 1.031 million tons of cargo have passed through the Suez Canal from both directions in 2019 [49]. The main sources of air pollution in the study area represents an industrial area and power plant located in the middle-western part of the study area.
The canal has a length of 193 km and connects the Red Sea (Gulf of Suez) with the Mediterranean Sea at Port Said city. The Suez Canal was blocked on 23 March 2021 and lasted for 6 days after 200,000 tons container ship grounded [50]. To accommodate for the effects of the Suez Canal closure on the air quality, the whole Suez Canal region was studied. The studied region coordinates were between 32°0°0° E to 33°0°0° E and 29°0°0° N to 31°30°0° N (Figure 1). However, it is to be noted that the ship was stuck at the bottom portion of the canal, as this is instrumental in our analysis. Moreover, our study assumes the water to flow from the couth to the north along the canal, and so references the “upstream” and “downstream” ends accordingly.

2.2. Data Source of Air Pollutants

Publicly accessible pollutant data sources are scarce in Egypt, given the country’s deficiency in ground-based monitoring stations, especially outside the Greater Cairo Region. Nowadays, satellite instruments can accurately detect air pollutants such as nitrogen dioxide (NO2), sulfur dioxide (SO2), and carbon monoxide (CO) by calculating the sun’s backscattered radiation in a broad range of wavelengths from ultraviolet to infrared [51]. Advanced retrieval algorithms are then applied to convert the measured radiation to pollutant concentration, such as tropospheric column density [32].
In this paper, to study the impact of COVID-19 on air quality, the concentrations of selected pollutants in the study period 2020–2022 are compared to the mean value in the same period in previous year (2019). The data are obtained for the pollutants on a daily basis, record between the 1 January to the 31 December for the years 2017, 2018, 2019, 2020, 2021, and 2022. The values for the years 2020, 2021, and 2022 are compared to the mean value from previous years (2017, 2018, and 2019) as a baseline, and the results are then analyzed. Further details about the pollutants under study are provided in the following subsections.

2.2.1. Data for Nitrogen Dioxide and Sulfur Dioxide

The concentration data for NO2 and SO2 were obtained from Ozone Monitoring Instrument (OMI). The OMI is a satellite instrument on board the AURA satellite launched as part of the NASA Earth Observation System in 2004. The OMI measures the solar radiation reflected by the Earth’s surface and the atmosphere with a spectral resolution of 0.5 nm and in the range from 270 to 500 nm. This tool can take measurements on a global level and is able to cover nearly the entire surface of the Earth in one day, which is mainly due to the satellite’s orbital period reaching 98.8 min, as well as the width of the surface’s recorded strip reaching 2600 km. In the OMI mode, when shooting in the nadir direction, the pixel size is 24 × 13 km across and along the shooting strip, respectively [21]. The concentrations of NO2 and SO2 were determined using the spectrometer measurement data. The SO2 concentrations are normally measured at three altitudes using the data processing algorithm: 15 km represents the large explosive eruptions, 5 km represents the passive volcanic degassing, and 2 km represents the anthropogenic SO2 [52]. There are two steps for estimating SO2 concentrations: (1) the spectral characteristics of sunlight reflected from Earth surface and scattered in the atmosphere are measured; and (2) comparing reflected and initial spectra, where SO2 scatters and absorbs part of the incoming sunlight. SO2 data were provided only if the solar zenith angle ˂ 70° and cloud radiance fraction ˂0.2 to ensure data quality [53]. It is also worth mentioning that the interference between ozone (O3) and SO2 absorption in the UV region could lead to our recording very low values for SO2 or even negative values [54]. Dobson Units (DU) are normally used as a representative of SO2 concentration (1 DU = 2.69 × 10¹⁶ molecules cm–2).
The OMI instrument was also used to estimate the total number of NO2 molecules between the tropopause and the Earth’s surface per unit area [20]. The OMI has been successfully used by many researchers for air pollution monitoring [55,56,57]. The inclined content was divided by the air mass value of NO2 for calculating the number of NO2 molecules in the vertical column of the atmosphere. The air mass value of NO2 depends on four main parameters: (1) the surface albedo; (2) cloud characteristics (sky coverage, height, and density); (3) geometry of observations; and (4) the shape of vertical profile of NO2 [58]. NO2 data were excluded in case solar zenith angle ˂85° and cloud radiance fraction >0.3 to ensure data quality. In the current study, daily Level 3 Aura/OMI NO2 and SO2 columnar data products from the NASA GESDISC archive with a spatial resolution of 0.25 × 0.25° were used to study NO2 and SO2 concentration variation in the Suez Canal area. The OMNO2d data product is a Level-3 Gridded Product where pixel level data of good quality are binned and “averaged” into 0.25 × 0.25-degree global grids. This product contains total column NO2 and total tropospheric column NO2 for all atmospheric conditions, and for sky conditions where the cloud fraction is less than 30% [58]. For SO2 concentration, the OMI science team produces Level-3 Aura/OMI Global OMSO2e data products (0.25-degree Latitude/Longitude grids). In the Level-3 daily global SO2 data product, each grid contains only one observation of total column density of SO2 in the planetary boundary layer (PBL) based on an improved principal component analysis (PCA) algorithm. This single observation is the “best pixel” selected from all “good” L2 pixels of OMSO2 that overlap this grid and have UTC time between UTC times of 00:00:00 and 23:59:59.999. In addition to the SO2, the vertical column value and some ancillary parameters, e.g., cloud fraction, terrain height, scene number, solar and satellite viewing angles, row anomaly flags, and quality flags have been also made available, corresponding to the best selected SO2 data pixel in each grid [59]. The “good” NO2 pixels can be selected based on similar criteria to those used for SO2 pixels. These criteria include cloud screening, removal of stratospheric NO2, consideration of surface reflectance, assessment of instrument quality, and analysis of temporal variation.

2.2.2. Carbon Monoxide Data

The Atmospheric Infrared Sounder (AIRS) is a satellite instrument on board the AQUA satellite launched in May 2002. The AIRS is an infrared spectrometer, which is capable of measuring the concentration of some gases in the atmosphere, such as ozone, carbon monoxide, carbon dioxide, methane, and water vapor. The AIRS instrument has 2378 spectral channels and is able to record a wide range of the intensity of the outgoing thermal radiation from 3.74 to 15.4 µm with footprint = 13.5 km at the nadir and high spectral resolution (R = λ/Δλ∼1200) [60,61,62]. The absorption zones of the above mentioned atmospheric parameters are included in these spectral ranges: water vapor (6.3 μm); ozone (9.6 μm); carbon dioxide (4.3 and 15 μm); and methane (7.6 μm) [63]. In this study, the CO data were obtained at a height of 7 km (400 hPa), where the most efficient CO extraction is in the middle of troposphere (from 9–5.5 km (300 to 500 hPa)). The data for CO are normally extracted in day and nighttime around the world under cloudy and clear-sky conditions [64,65]. Only daily Level 3v6 measurements of CO of the ascending orbit (12:30–13:30 local solar time) with a spatial resolution of 1 × 1° were used in this study. Goddard Earth Sciences Data and Information Services Center (GES/DISC) are the main sources for the AIRS CO products.

2.2.3. Aerosol Optical Depth (AOD) Index

The aerosol optical depth (AOD) index is normally used as an assessment tool for investigating spatiotemporal changes in aerosols. It is also a useful tool for cross-comparison with the measurements data available for gaseous pollutants. AOD data are obtained from a moderate resolution imaging spectroradiometer (MODIS) on the AQUA satellite with a quality flag (QF) of at least 2 and a spatial resolution of 10 km. On the basis of previous studies, there is a high consistency between the ground based observations and the MODIS seasonal observation cycle [65]. The ground based aerosol observations are represented by the Aerosol Robotic Network (AERONET) sky and sun radiance measurements [66,67]. The uncertainty of MODIS AOD over the land has been reported as ±(0.05 + AODAERONET × 0.15) [68] and ±(0.05 + AODAERONET × 0.20) [69]. In this study, MODIS AOD data were obtained from NASA’s Level-1 and the Atmosphere Archive and Distribution System’s Distributed Active Archive Center (LAADS DAAC) online archive [70,71,72,73].

2.3. Absolute Difference

The pollutants selected for investigation in our analysis are NO2, SO2, CO, and aerosols represented by the AOD index, since they are among the major air pollutants and due to their adverse environmental and health effects as elaborated in the introduction. For each pollutant, the data were obtained for the study period from 2020 to 2022 and compared with the mean value of the data from previous years (2017–2019) during the same period. These values are mapped out and displayed for analysis of the spatial distribution of the pollutants. The absolute difference of each parameter can be calculated by subtracting the average concentration of each pollutant during the baseline period from the average concentration during 2020, 2021, or 2022, and taking the absolute value of this difference.

3. Results and Discussion

3.1. Spatial Distribution of Pollutants

3.1.1. Nitrogen Dioxide

Figure 2 shows the spatial distribution of the concentration of NO2 during the baseline (2017, 2018, and 2019) and the study period (2020, 2021, and 2022). As shown from Figure 2a, during the baseline (2017–2019), the highest concentration of NO2 molecules was present in the west portion of the study area with a concentration of 0.5 × 10¹⁶ molecule/cm2. This is mainly due to the anthropogenic activities at the western part of the Canal, where many power plants are located (refer to Figure 1). Another reason for the high NO2 concentration is the high traffic of vessels passing through the Suez Canal. The average NO2 concentration in the rest of the area is about 0.2 × 10¹⁶ molecule/cm2. Compared to the baseline period, a decrease in yearly NO2 concentrations was observed in the southern part of the study area for the periods 2020, 2021, and 2022, as shown in Figure 2b–d. However, an increase in yearly NO2 concentrations with about 2 × 10¹⁴ molecule/cm2 were observed in the middle and northern parts in 2020, which is mainly due to the navigation traffic from both sides, as well as the construction works in the northern area. Meanwhile, NO2 concentrations in 2021 and 2022 increased by 0.9 × 10¹⁴ and 2 × 10¹⁴ molecule/cm2 compared to the previous year (2020), respectively (Figure 2c,d). This is mainly due to the increase in the number of ships passing through the canal, where there is an annual increase in the number of ships by about 9.5% since 2017 as reported in reports published by the Suez Canal Authority, refer to Figure 3 [74,75].
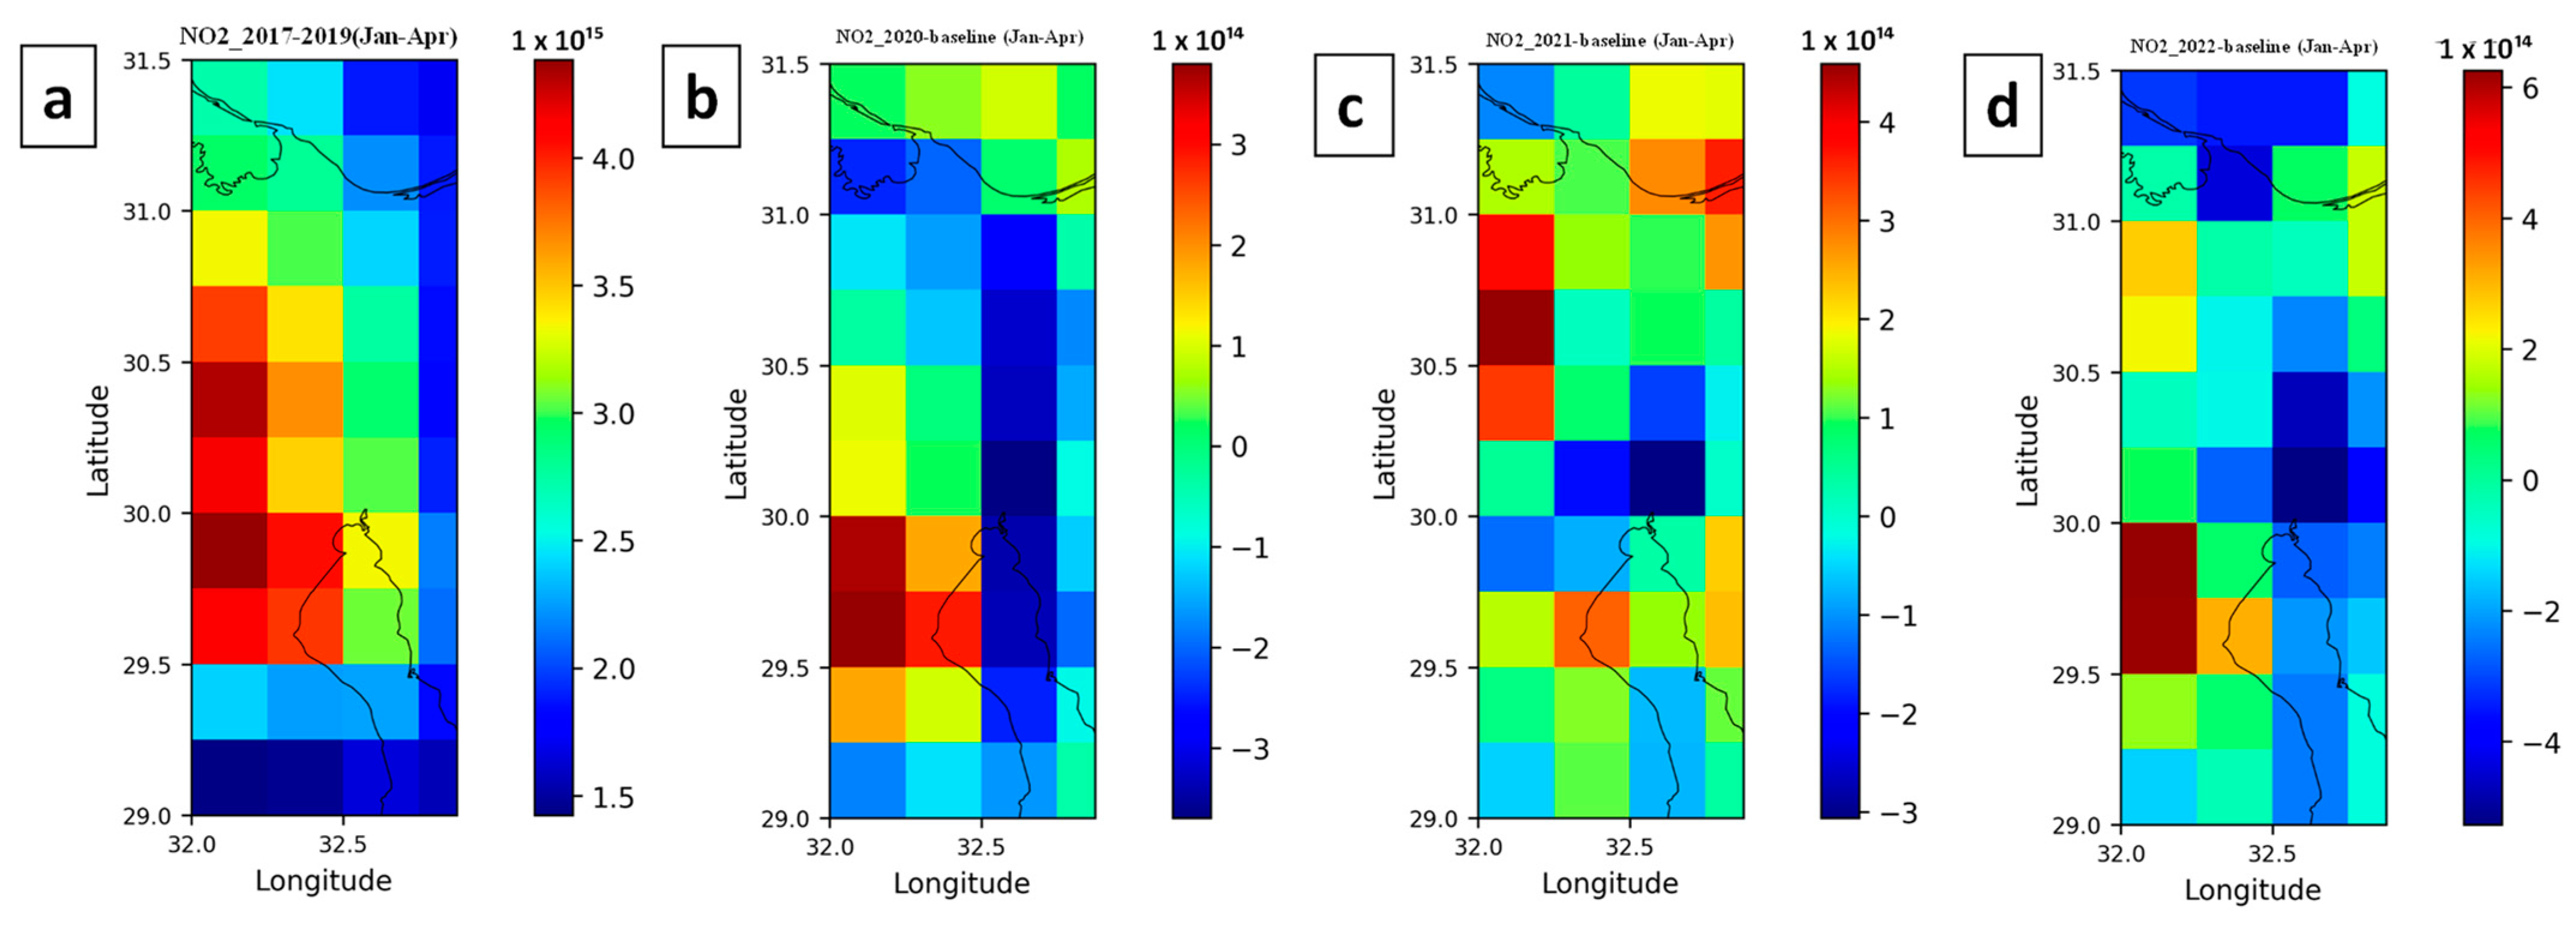
As shown in Figure 4a,b, the average NO2 concentrations for the period from January to April 2020 decreased by about 2.5 × 10¹⁴ molecule/cm2 along the canal compared to the baseline period. This may be due to the lockdown measures during the COVID-19 pandemic. These results were also confirmed by [76], who have concluded that the pandemic caused a shortage in ship supply capacity and containers. These results also agree with the findings of research conducted in other regions in Egypt during the pandemic, where a decrease in NO2 concentration was reported in the Alexandria (~33%) and Cairo (~15%) governorates during the same period [32]. Another study [77] demonstrated that during the lockdown, the concentration of NO2 decreased by 43% and 23% in Riyadh and Cairo, respectively, compared to the baseline defined for the same period during 2017–19. For the period from January to April, the average NO2 concentration increased by 2.0 × 10¹⁴ molecule/cm2 in 2021 compared to the baseline period, which agrees with the previous explanation. According to [78], NO2 undergoes several complex chemical reactions in the atmosphere that change its composition; thus, high NO2 ambient concentrations can generally be found near areas with high NO2 emissions. Therefore, the reduction in the concentration of NO2 molecules by 14.4% along the canal for the period from 23 March to 29 March 2021 compared to the baseline period (23 March to 29 March 2019) (Figure 5) could be due to the blockage and the no-load mode of vessels [79]. In the no-load mode, the in-cylinder temperature of the engine is low, leading to a reduction in NO2 formation [79]. There is a positive relationship between the engine cylinder temperature and NO2 generation. These results were confirmed by the literature [80,81,82,83,84,85].
After comparing OMI NO2 observation with the ground-based Pandora spectrometer in 18 global sites, the OMI’s total column NO2 values were recorded as almost 16% higher than Pandora on average. OMI and Pandora occasionally have considerable disparities due to a combination of regional heterogeneity, different spatial and temporal sampling, different vertical sensitivity between satellite and ground-based data, and retrieval mistakes [10]. However, it is important to consider the strengths and limitations of OMI and Pandora NO2 methods. OMI NO2 measurements provide global-scale coverage of atmospheric pollutants with relatively high spatial resolution, which can be useful for studying large-scale patterns and trends in atmospheric pollution [86]. In contrast, Pandora NO2 measurements provide high-quality measurements of atmospheric pollutants with high temporal and spatial resolution, which can be useful for studying local-scale patterns and trends in atmospheric pollution [87]. One practical application where OMI NO2 measurements are commonly used is in air quality monitoring and management [86]. OMI NO2 measurements can provide information on the spatial and temporal distribution of atmospheric pollutants over large areas, which can be useful for identifying sources of pollution and assessing the effectiveness of pollution control measures [88]. Pandora NO2 measurements are commonly used for air quality monitoring and management at the local scale [87]. Pandora NO2 measurements can provide high-quality measurements of atmospheric pollutants with high temporal and spatial resolution, which can be useful for identifying sources of pollution and assessing the effectiveness of pollution control measures at the local scale [89]. However, Pandora NO2 measurements have limited spatial coverage and may not provide a complete picture of atmospheric pollution over larger areas [90].

3.1.2. Sulfur Dioxide

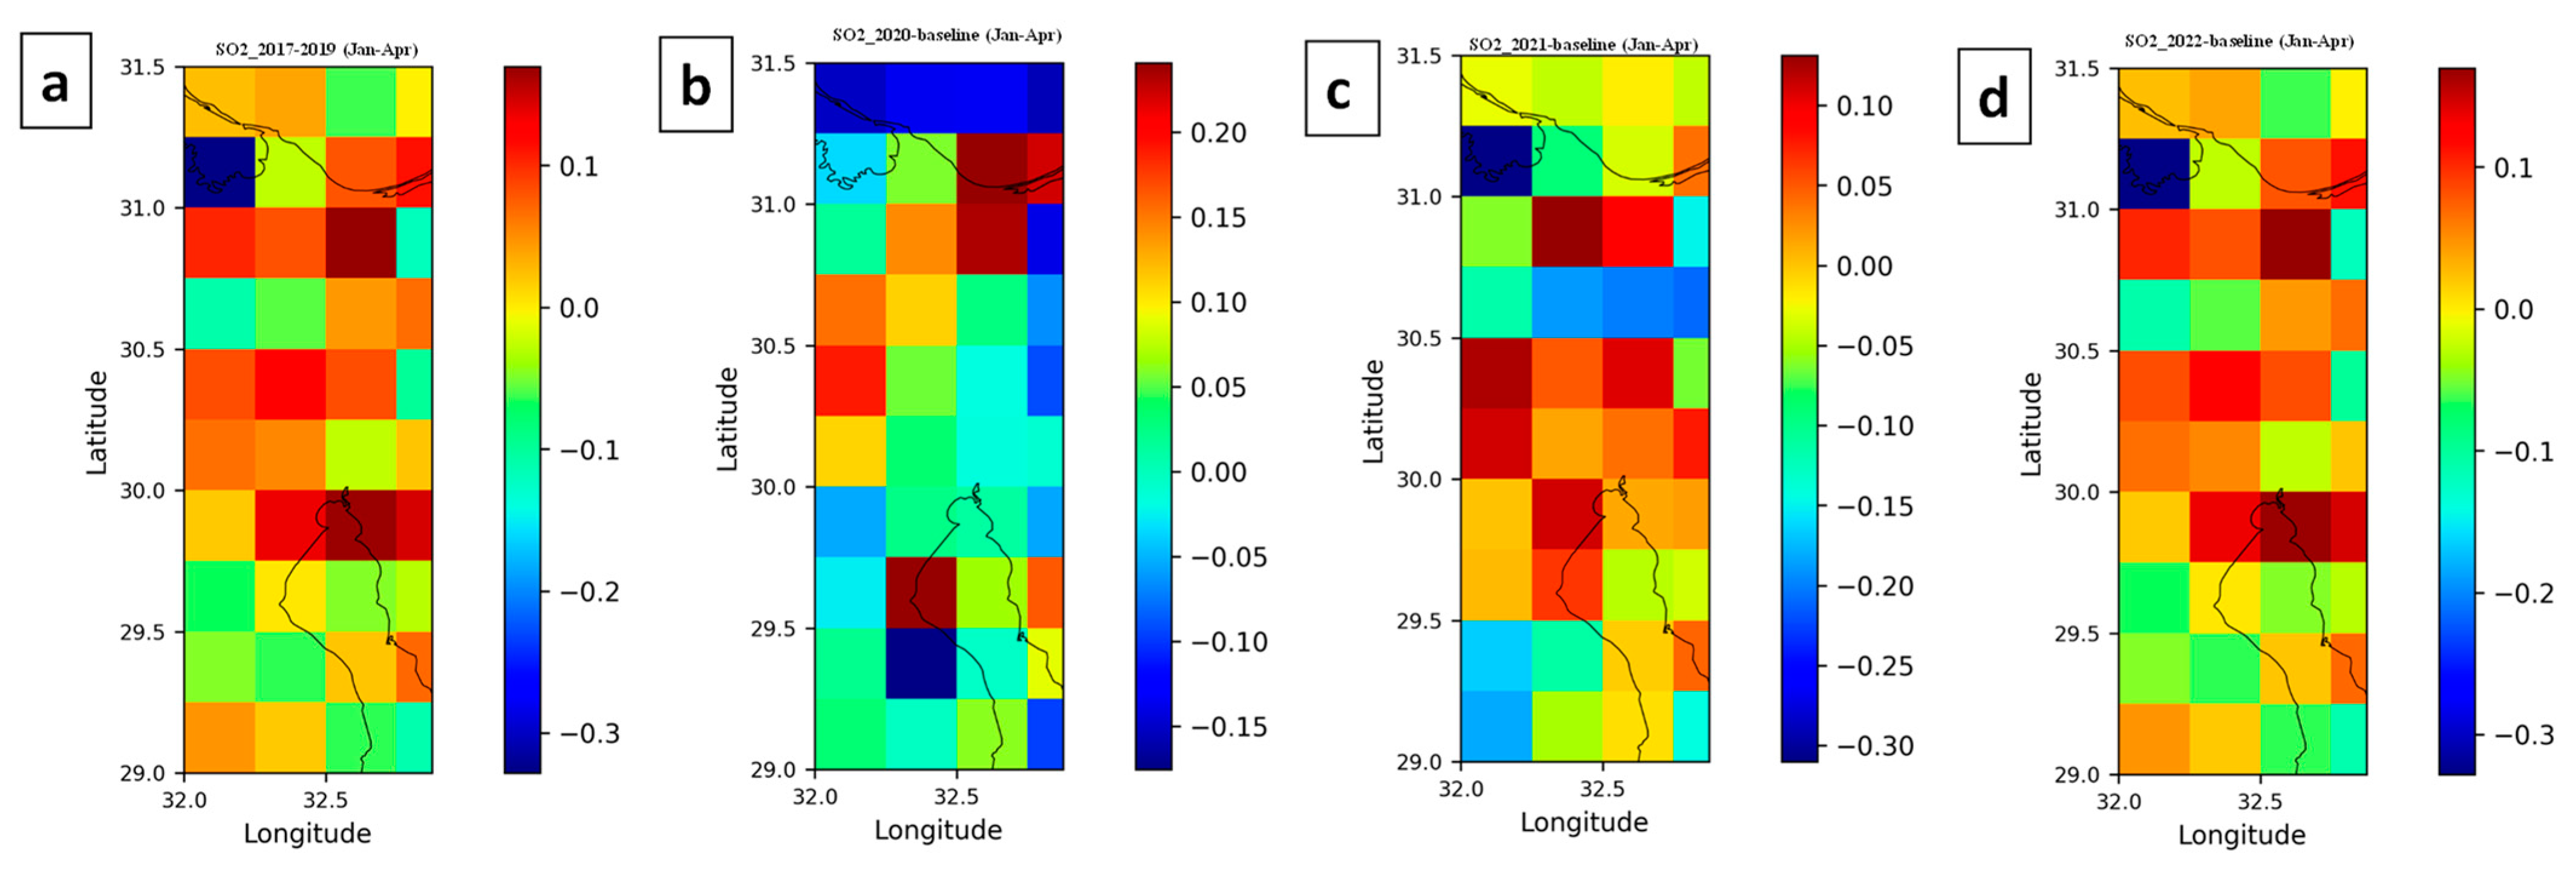
As shown in Figure 6a, during the baseline, the highest SO2 concentrations were present in the middle and northern parts of the study area (between 0.05–0.10 Dobson unit (DU)). In the Middle part, there are power plants and two ports (Adabiya and Sokhna) located in this area. In the northern part, the main sources of SO2 pollution are the emissions from cars and trucks in Al Ismailiyah and Port Said Governorates. Low levels of SO2 were recorded at the southern part of the study area, which is mainly due to the absence of anthropogenic activities in this area (Figure 6a). An increase in yearly SO2 concentrations in the range between 0.025–0.125 DU was observed in the middle and northern parts in 2020 (Figure 6b), which is mainly due to the navigation traffic from both sides, as well as the construction works in the northern area. Meanwhile, SO2 concentrations in 2021 and 2022 increased in the range from 0.02–0.1 DU compared to the baseline period (2017–2019), respectively (Figure 6c,d). The main OMI SO2 dataset algorithm limitation is its use of a constant air mass factor (AMF), which represents the OMI radiance sensitivity of SO2. Its accuracy hugely depends on the ozone amount and profile, SO2 a priori profile, surface reflectivity, cloud fraction, surface and cloud pressure, and solar and viewing zenith angles [91]. The accumulative uncertainties in AMF were estimated at 50–100% for polluted regions [55].
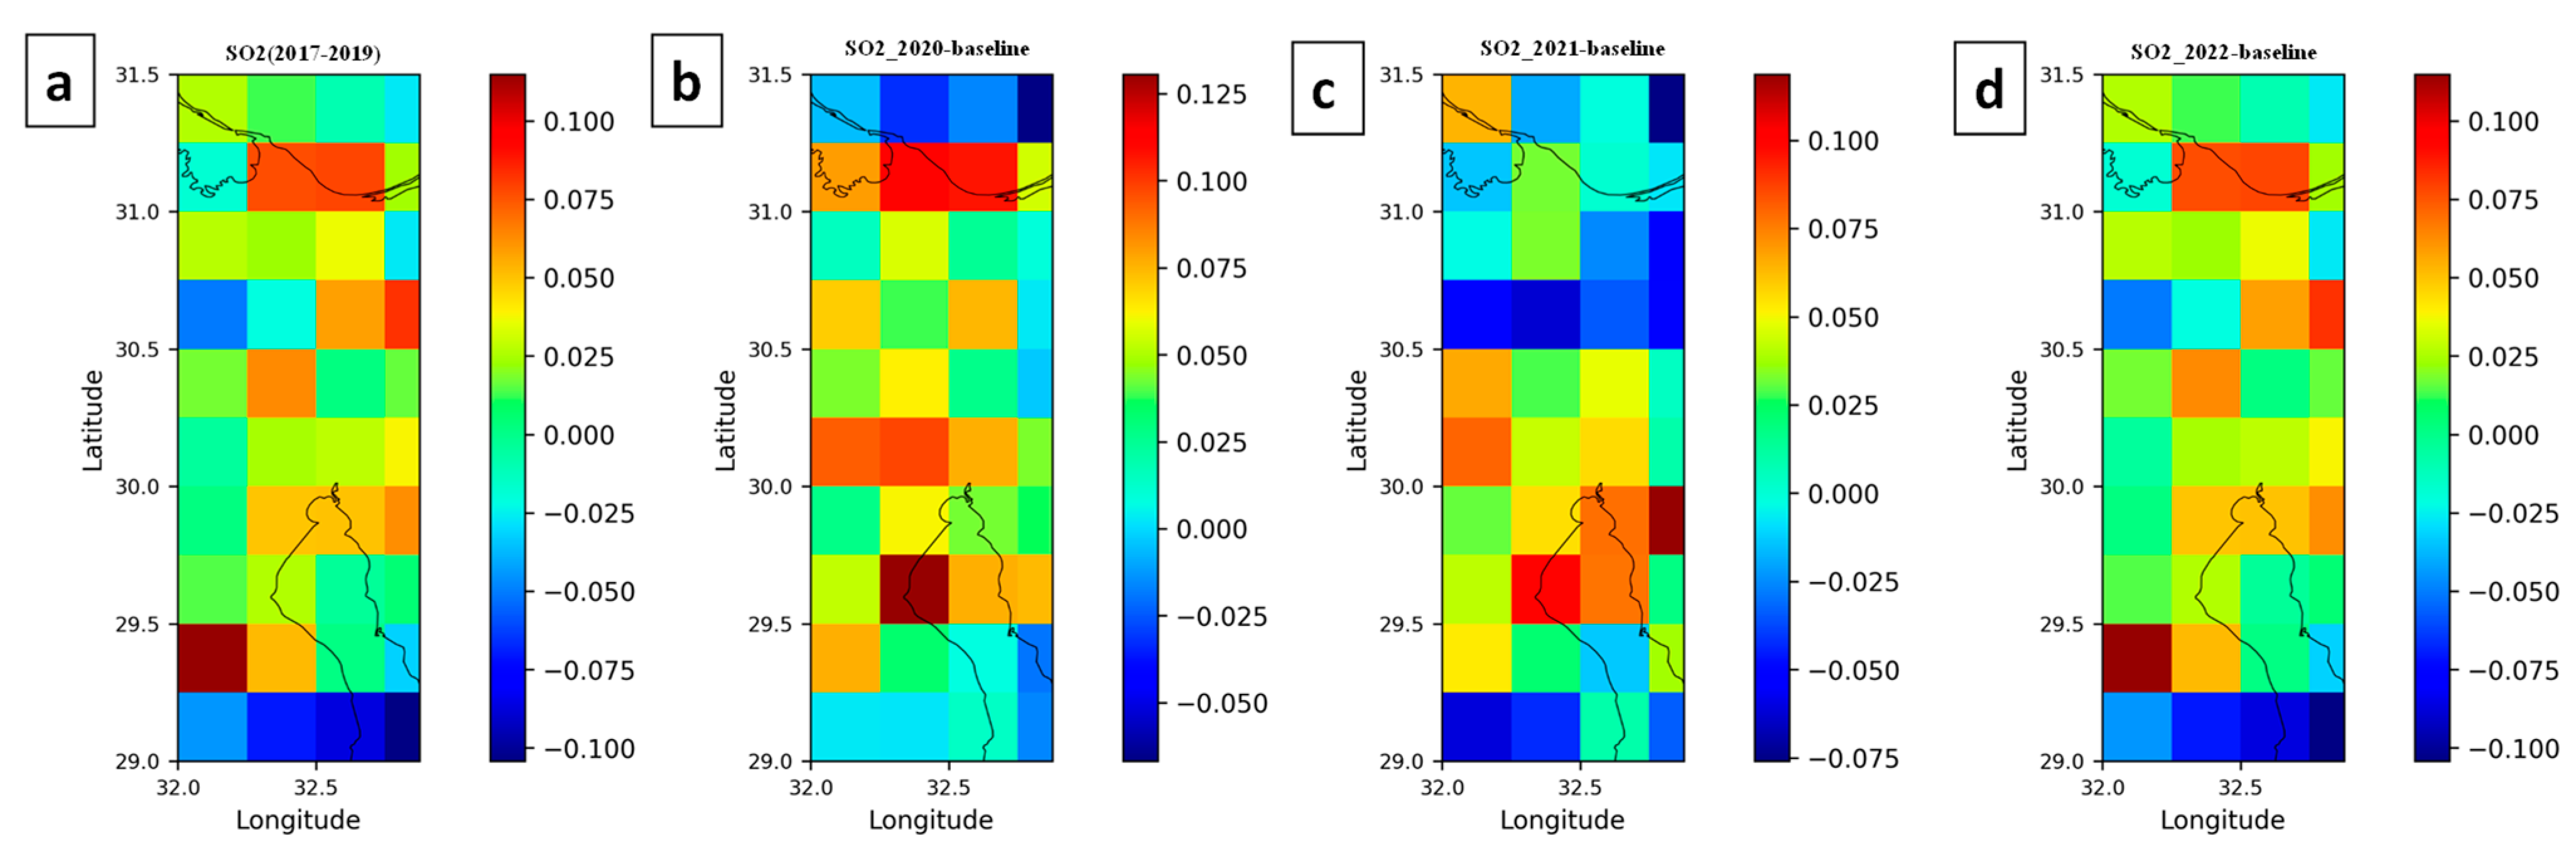
Compared to the baseline period (January to April 2017–2019), a significant reduction in SO2 concentrations were reported in the same period in 2020, (Figure 7a,b), which is mainly due to the reduction in car traffic and industrial activities during the COVID-19 pandemic, leading to improved air quality. This was more obvious in the urbanized areas of Al Ismailiyah Governorate, where the averaged SO2 concentrations have decreased by about 0.05 DU. These results agree with the findings of research conducted in other regions in Egypt during the pandemic, where a 15.2% decrease in SO2 concentration was reported in the greater Cairo region during the lockdown period [92]. For the period from January to April, the average SO2 concentration has increased on average by 0.05 DU in 2021 and 2022 compared to the baseline period, which is due to the increase in the number of ships passing through the canal (Figure 3).
Similar to NO2, a reduction in SO2 concentrations by 66% along the canal for the period from 23 March to 29 March 2021 compared to the baseline period (23 March to 29 March 2019) (Figure 8) could be due to the Suez Canal closure caused by obstruction of the canal by the Ever Given ship and the no-load mode of vessels. The significant reduction in SO2 molecules may also be attributed to the new law that request a reduction in sulfur content. According to the International Maritime Organization (IMO), a mandatory reduction in the sulfur content of shipping fuel was initiated on the 1 January 2020. The maximum allowed sulfur content was dropped by a factor of 7 on that date, from 3.5% to 0.5%. Therefore, the SO2 concentration in the study period has significantly decreased as compared to the baseline period (Figure 8). The short residence time of SO2 and NO2 in the atmosphere (several hours) may also play a great role in the difficulty of tracking their spatial distribution. The above results were confirmed by an article published by Hellenic Shipping News Worldwide on 15 April 2021 [93]. There were also a significant reduction in SO2 concentration for the period from 23 March to 29 March (Figure 8), which may be attributed to containment actions applied by the Egyptian Government, especially the quarantine and the curfew [32,77,92,94]. These containment actions have decreased industrial, commercial, and transportation activities because people are encouraged to stay at home.
High NO2 and SO2 concentrations were also reported in some areas in the south direction without the presence of any anthropogenic activities (Figure 2, Figure 3, Figure 6 and Figure 7), where there is a high possibility of short distance transportation of pollutants from areas with heavier pollutants to neighboring areas. As shown in Figure 9, the wind direction in the study area is northwest and the wind speed varies between 2 and 4 m/s. These findings confirm the reason for detecting high NO2 and SO2 concentrations in the south direction. This may be attributed to high solubility of SO2 and NO2; thus, their presence in the lower atmosphere may not exceed 2 days depending on terrain and season [95].

3.1.3. Carbon Monoxide (CO)

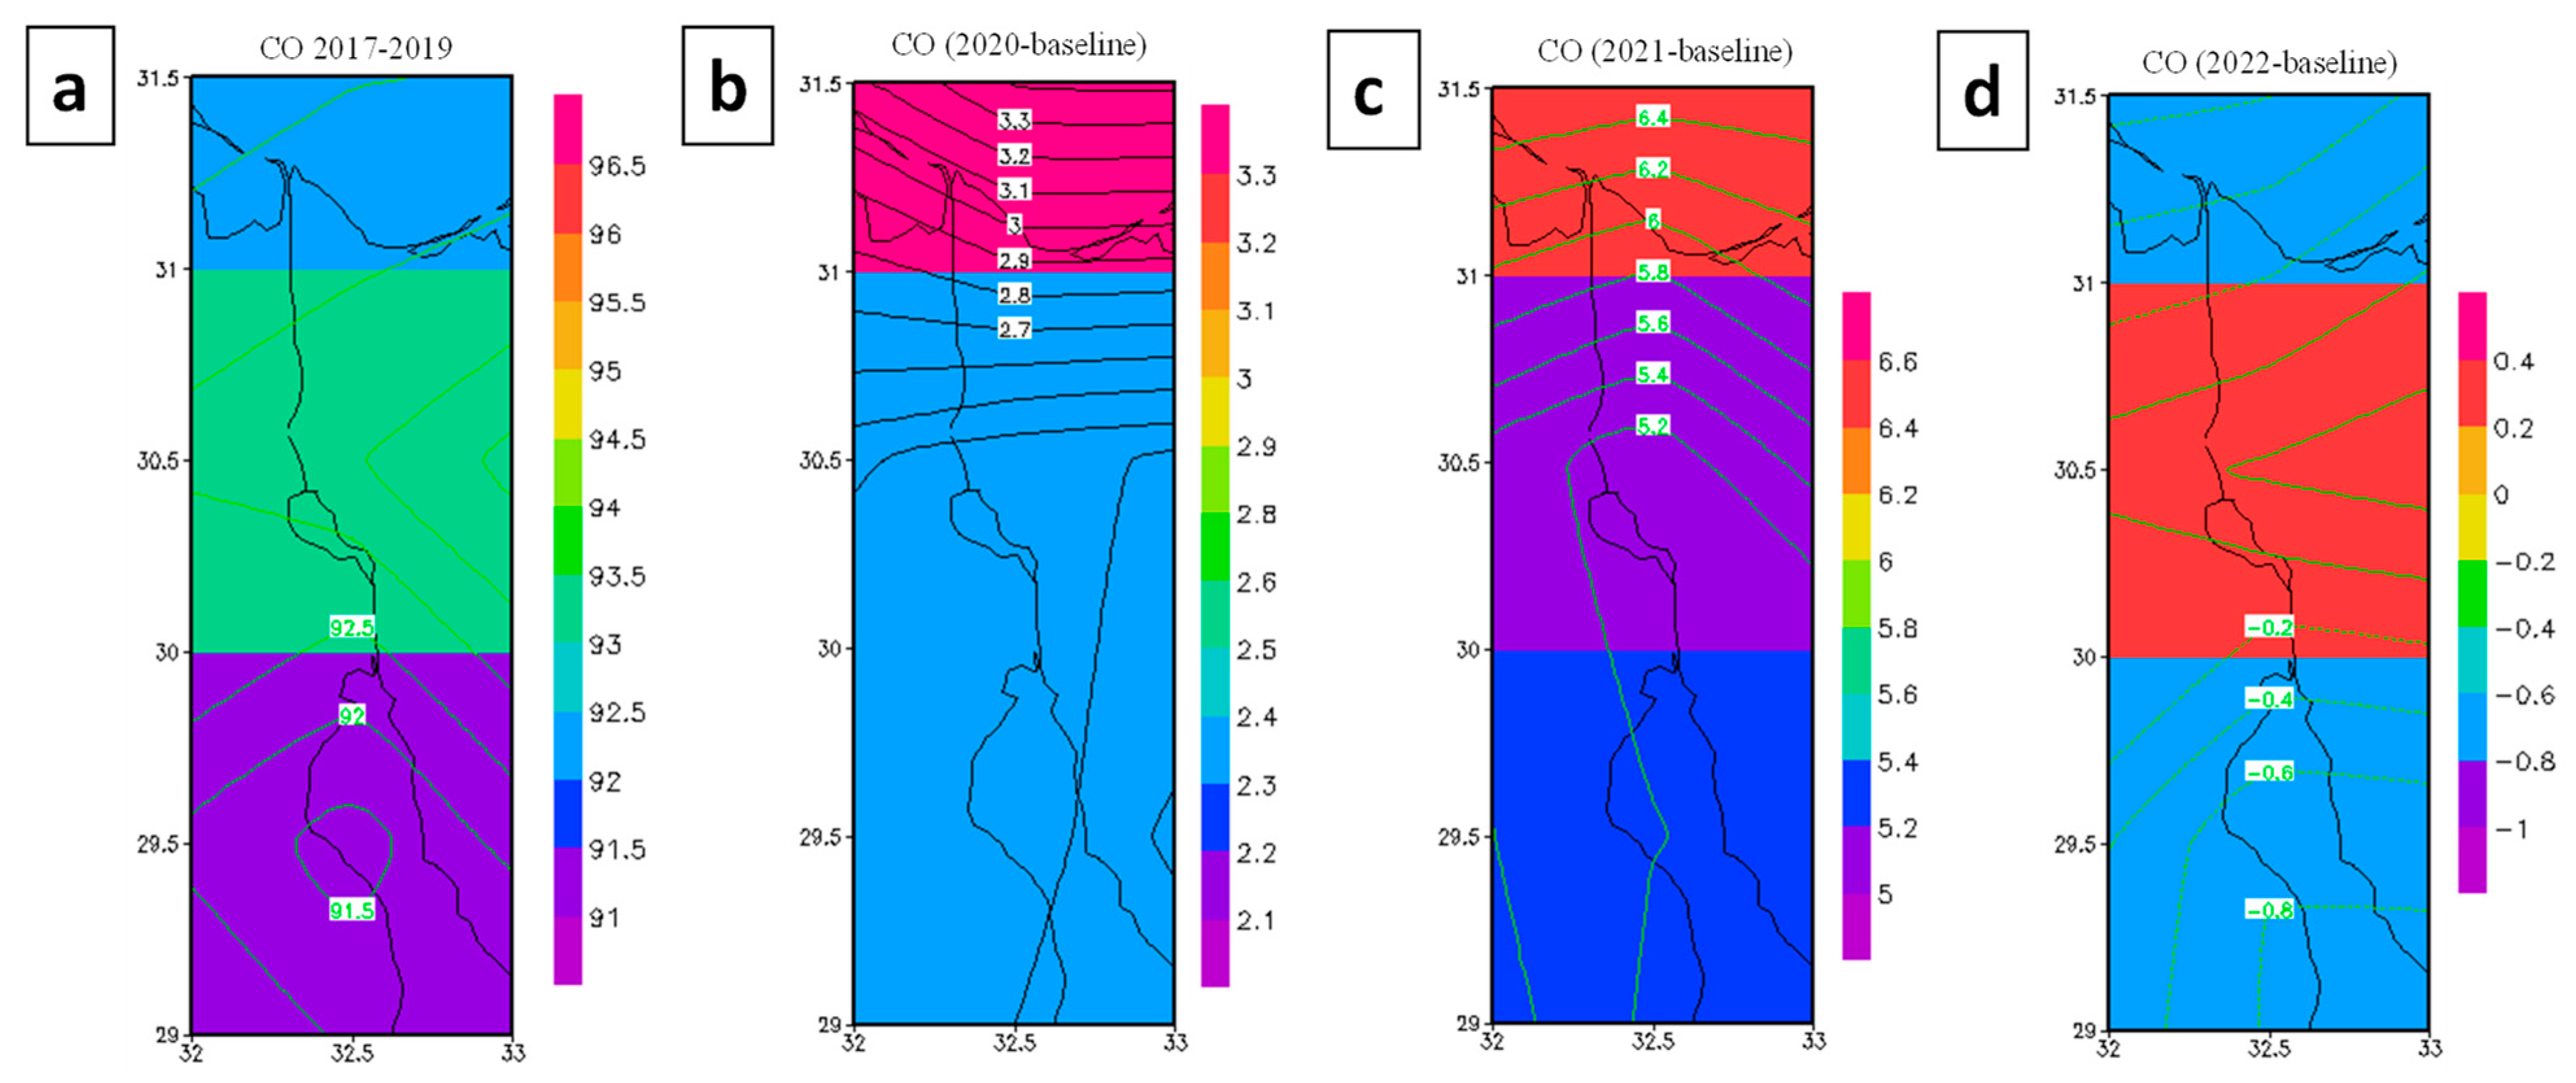
Figure 10 shows the spatial distribution of CO during the baseline (2017, 2018, and 2019) and the study period (2020, 2021, and 2022). As noticed from Figure 10a, during the baseline, the highest CO concertation of 94 parts per billion by volume (ppbv) was present in the middle part of the study area. High CO concentration is normally related to locality and population density [96]. In our case, the high CO concentration in the middle part is due to the anthropogenic activities at the three governorates (Suez, Port Said, and Al Ismailiyah), where many power plants and industries are located (Figure 1), as well as the emissions from vehicles. The high CO concentration, especially in the Suez Gulf, could also be due to ships passing through the canal. In Figure 10a, the CO concentration in the southern part reduced to 91.5 ppbv, where there are limited or no anthropogenic activities. Similar trends were observed for the study periods (2020, 2021, and 2022), as shown in Figure 10b–d. As opposed to NO2 and SO2, the CO concentration has increased in the range from 2.5 to 3.3 ppbv as compared to the baseline period during the COVID-19 pandemic (Figure 10b). However, CO concentration has decreased in the period from 20 February to 11 March 2020 in the range from 3.5 to 4.7% compared to the same period in 2017–2019, 2021, and 2022, which could be due to the low anthropogenic activities during the pandemic. These results agree with the findings of research conducted in other regions in Egypt during the pandemic, where a 5% reduction in CO was reported over Cairo and Alexandria [32], and a 46.23% reduction was recorded over the Nile Delta and Cairo region [97]. A further increase was also observed in the range from 5.0 to 6.4 ppbv in 2021 as compared to the baseline period (Figure 10c). This is mainly due to the increase in the number of ships passing through the canal (Figure 3), as well as the increasing energy demand and consumption that the lockdown has created. A noticed increment of energy demand was recorded globally with 6–10% high [55,97,98]. During the blockage, the CO concentration has increased by about 12.68% compared to the baseline period, as shown in Figure 11. For the same period in 2020 and 2022, the increase was only limited to 7.27% and 3.97%, respectively (Figure 11). These results indicate that the closure and the associated refloating activities may be the reason for increasing CO concentrations during this period. A reduction of CO concentration was also observed during 2022 compared with the two previous years, 2020 and 2021. It is worth mentioning that CO can survive a relatively longer time in the atmosphere, which explains the relatively high CO concentration, and especially why the CO distribution was uniform throughout the study area.

3.1.4. Aerosol Optical Depth (AOD) Index

Figure 12 shows the spatial distribution of AOD index during the baseline (2017–2019) and the study period (2020, 2021, and 2022) for the first four months of the year (January to April). The main sources of aerosols are the burning of fossil fuels for power plants and industrial activities (Figure 1), emissions from mobile sources (ships, vehicles, etc.), and the dust transfer over long distances. As is clear from Figure 12a, during the baseline, a high AOD index of 0.36 was observed in the middle part of the study area. The main reasons for high AOD are as follows: (1) the emissions from anthropogenic activities (power plants, industries (Figure 1), and motor vehicles) in the Suez and Al Ismailiyah governorates; (2) the high traffic of vessels passing through the Suez Canal; and (3) the long-range transport of aerosol from the dessert northeast of Egypt, where the prevailing wind is most frequently from the north (Figure 9) [99]. Similar trends were observed for the study periods (2020, 2021, and 2022), as shown in Figure 12b–d. A lower level of AOD index of 0.21 was observed in the northern portion of the study area, where the emissions are limited to anthropogenic activities in the Port Said governorate and are much lower than the emissions from the Suez and Al Ismailiyah governorates. High AOD index values were detected in almost the same areas—where SO2 and NO2 had high values—due to the much shorter residence time of SO2 and NO2 in the atmosphere (several hours) in contrast with the several days for aerosol particles. Additionally, aerosol particles can be transported over long distances. Compared to the baseline period, the average AOD index has increased by 0.04 in 2020, 0.01 in 2021, and 0.05 in 2022 (Figure 12). This is mainly due to the increase in the number of ships passing through the canal.
Figure 13a shows a 20% reduction in the AOD index in the period from 1 January to 9 February 2020 as compared to the same period in 2017–2019, which could be due to the low anthropogenic activities during the pandemic. The reduction is aligned with the findings of [94], who discovered that the AOD index decreased by 68.5% during the pandemic compared to the previous two years. During the blockage (23 March to 29 March), the AOD index value increased by about 51.0% compared to the baseline period, as shown in Figure 13b. These results indicate that the closure and the associated refloating activities may be the reason for the increasing AOD index during this period. For the period from 2 March to 9 April 2020, a significant increase in the AOD index was observed, which may be due to the return of industrial activities to their normal operation before the pandemic.

4. Conclusions

This study highlights the impact of the COVID-19 pandemic and the obstruction of the Suez Canal by the Ever Given ship (23–29 March 2021) on the ambient air quality in the Suez Canal area. Prior to the COVID-19 pandemic, traffic through the canal increased by 10% between 2017 and 2019, leading to an increasing trend in NO2 and SO2, with average concentrations of 9.4% and 4.3%, and an increase in the AOD index of 21.9% in 2019. In contrast, a significant reduction in NO2 and SO2 concentrations of 2.5 × 10¹⁴ molecule/cm2 and 0.05 DU, respectively, was reported in the period January to April 2020, compared to the same period in 2017–2019. This decrease may be attributed to the reduction in car traffic and industrial activities during the COVID-19 lockdown. Similarly, during the Suez Canal blockage, a reduction in NO2 by 14.4% and SO2 by 66.0% was recorded compared to the baseline period, which could be due to the Suez Canal blockage and the no-load mode of the vessels. However, the short residence time of SO2 and NO2 in the atmosphere (in the order of hours) limits our ability to track their spatial distribution. CO concentrations decreased in the period 20 February to 11 March 2020 in a range from 3.5% to 4.7% compared to the same period in 2017–2019, 2021 and 2022, which could be due to the decrease in anthropogenic activities at the start of the COVID-19 pandemic. A similar decrease in the AOD index was observed between 1 January to 9 February 2020. However, the AOD index increased by 51% during the canal blockage (23 March to 29 March) due to the associated refloating activities. Both the COVID-19 pandemic and the Canal closure had a negative impact on transport and commerce; however, this study suggests that they potentially had a positive impact on air quality by temporarily reducing the load of pollutants. This positive impact was short-lived; thus, long-term mitigation measures must be prioritized to control air pollution while maintaining a balance between environmental protection and economic growth. Transport, commerce, and air quality may or may not be associated and interrelated, so further investigation is needed before any confirmation can be attained. In our research, there were also no ground-based air quality monitoring stations, and this justifies the methodology of using satellite data to obtain air pollutant concentrations. The use of low-cost sensors and citizen-based monitoring networks are possible methods to be employed in the futured. The unavailability of an emissions inventory (a continuous record of all human-made and natural sources of air pollutant emissions within a specific geographic area) is another limitation of this study; these data could be used to identify and quantify sources of air pollution and provide a basis for developing effective control measures and air quality management plans. By using emission inventories in conjunction with air quality modeling, policymakers and environmentalists can assess the impact of different control measures and track their progress in reducing air pollutant emissions over time.

Author Contributions

Conceptualization, M.K.M. and O.M.A.; methodology, M.K.M. and H.E.; software, G.G.; validation, M.K.M., O.M.A., H.E. and S.H.; formal analysis, M.K.M., O.M.A. and H.E.; investigation, M.K.M., O.M.A., H.E., M.E.G. and S.H.; resources, M.K.M., G.G., O.M.A. and H.E.; data curation, G.G. and S.H.; writing—original draft preparation, M.K.M., O.M.A. and H.E.; writing—review and editing, M.K.M., G.G., S.H., O.M.A., M.E.G. and H.E.; visualization, M.K.M., O.M.A., H.E., M.E.G. and S.H.; supervision, M.K.M. and G.G.; project administration, M.K.M. and G.G. All authors have read and agreed to the published version of the manuscript.

Funding

This research received no external funding.

Institutional Review Board Statement

Not applicable.

Informed Consent Statement

Not applicable.

Data Availability Statement

The data of this study are mainly from publicly available data sets. Analyses and visualizations used in this paper were obtained mainly from AURA and AQUA satellites’ data sets.

Conflicts of Interest

The authors declare no conflict of interest.

References

  1. World Health Organization. Novel Coronavirus (2019-nCoV): Situation Report, 11. 2020. Available online: https://apps.who.int/iris/handle/10665/330776 (accessed on 22 April 2023).
  2. Abdeldayem, O.M.; Dabbish, A.M.; Habashy, M.M.; Mostafa, M.K.; Elhefnawy, M.; Amin, L.; Al-Sakkari, E.G.; Ragab, A.; Rene, E.R. Viral outbreaks detection and surveillance using wastewater-based epidemiology, viral air sampling, and machine learning techniques: A comprehensive review and outlook. Sci. Total Environ. 2022, 803, 149834. [Google Scholar] [CrossRef] [PubMed]
  3. Liu, J.; Liao, X.; Qian, S.; Yuan, J.; Wang, F.; Liu, Y.; Wang, Z.; Wang, F.-S.; Liu, L.; Zhang, Z. Community Transmission of Severe Acute Respiratory Syndrome Coronavirus 2, Shenzhen, China, 2020. Emerg. Infect. Dis. 2020, 26, 1320–1323. [Google Scholar] [CrossRef] [PubMed]
  4. El-Adawi, R. Stay Home, Stay Safe, and Enjoy Theatre—Theater—Al-Ahram Weekly—Ahram Online. Ahramonline. 2020. Available online: https://english.ahram.org.eg/NewsContent/50/1222/369642/AlAhram-Weekly/Theater/Stay-home,-stay-safe,-and-enjoy-theatre-.aspx (accessed on 22 April 2023).
  5. Selim, T.; Eltarabily, M.G. Impact of COVID-19 lockdown on small-scale farming in Northeastern Nile Delta of Egypt and learned lessons for water conservation potentials. Ain Shams Eng. J. 2022, 13, 101649. [Google Scholar] [CrossRef]
  6. Nicola, M.; Alsafi, Z.; Sohrabi, C.; Kerwan, A.; Al-Jabir, A.; Iosifidis, C.; Agha, M.; Agha, R. The socio-economic implications of the coronavirus pandemic (COVID-19): A review. Int. J. Surg. 2020, 78, 185. [Google Scholar] [CrossRef] [PubMed]
  7. Hereher, M.; Eissa, R.; Alqasemi, A.; El Kenawy, A.M. Assessment of air pollution at Greater Cairo in relation to the spatial variability of surface urban heat island. Environ. Sci. Pollut. Res. 2022, 29, 21412–21425. [Google Scholar] [CrossRef]
  8. Gall, C.; Van Rafelghem, M. Marine Emission Reduction Options for Hong Kong and the Pearl River Delta Region. Civic Exchange. 2006. Available online: www.civic-exchange.org (accessed on 14 January 2022).
  9. Tiwari, S.; Dahiya, A.; Kumar, N. Investigation into relationships among NO, NO2, NOx, O3, and CO at an urban background site in Delhi, India. Atmos. Res. 2015, 157, 119–126. [Google Scholar] [CrossRef]
  10. Lamsal, L.N.; Krotkov, N.A.; Vasilkov, A.; Marchenko, S.; Qin, W.; Yang, E.-S.; Fasnacht, Z.; Joiner, J.; Choi, S.; Haffner, D.; et al. Ozone Monitoring Instrument (OMI) Aura nitrogen dioxide standard product version 4.0 with improved surface and cloud treatments. Atmos. Meas. Tech. 2021, 14, 455–479. [Google Scholar] [CrossRef]
  11. Carmona-Cabezas, R.; Gómez-Gómez, J.; de Ravé, E.G.; Jiménez-Hornero, F.J. Checking complex networks indicators in search of singular episodes of the photochemical smog. Chemosphere 2020, 241, 125085. [Google Scholar] [CrossRef]
  12. Chen, J.; Zeng, J.; Shi, C.; Liu, R.; Lu, R.; Mao, S.; Zhang, L. Associations between short-term exposure to gaseous pollutants and pulmonary heart disease-related mortality among elderly people in Chengdu, China. Environ. Health 2019, 18, 64. [Google Scholar] [CrossRef] [Green Version]
  13. Jin, L.; Berman, J.D.; Zhang, Y.; Thurston, G.; Zhang, Y.; Bell, M.L. Land use regression study in Lanzhou, China: A pilot sampling and spatial characteristics of pilot sampling sites. Atmos. Environ. 2019, 210, 253–262. [Google Scholar] [CrossRef]
  14. De Kluizenaar, Y.; Aherne, J.; Farrell, E. Modelling the spatial distribution of SO2 and NOx emissions in Ireland. Environ. Pollut. 2001, 112, 171–182. [Google Scholar] [CrossRef] [PubMed]
  15. Dore, A.; Vieno, M.; Tang, Y.; Dragosits, U.; Dosio, A.; Weston, K.; Sutton, M. Modelling the atmospheric transport and deposition of sulphur and nitrogen over the United Kingdom and assessment of the influence of SO2 emissions from international shipping. Atmos. Environ. 2007, 41, 2355–2367. [Google Scholar] [CrossRef] [Green Version]
  16. Abdeldayem, O.M.; Eldaghar, O.; Mostafa, M.K.; Habashy, M.M.; Hassan, A.A.; Mahmoud, H.; Morsy, K.M.; Abdelrady, A.; Peters, R.W. Mitigation Plan and Water Harvesting of Flashflood in Arid Rural Communities Using Modelling Approach: A Case Study in Afouna Village, Egypt. Water 2020, 12, 2565. [Google Scholar] [CrossRef]
  17. Anastasopolos, A.T.; Sofowote, U.M.; Hopke, P.K.; Rouleau, M.; Shin, T.; Dheri, A.; Peng, H.; Kulka, R.; Gibson, M.D.; Farah, P.-M.; et al. Air quality in Canadian port cities after regulation of low-sulphur marine fuel in the North American Emissions Control Area. Sci. Total Environ. 2021, 791, 147949. [Google Scholar] [CrossRef] [PubMed]
  18. Isakson, J.; Persson, T.A.; Lindgren, E.S. Identification and assessment of ship emissions and their effects in the harbour of Göteborg, Sweden. Atmos. Environ. 2001, 35, 3659–3666. [Google Scholar] [CrossRef]
  19. Sofiev, M.; Winebrake, J.J.; Johansson, L.; Carr, E.W.; Prank, M.; Soares, J.; Vira, J.; Kouznetsov, R.; Jalkanen, J.-P.; Corbett, J.J. Cleaner fuels for ships provide public health benefits with climate tradeoffs. Nat. Commun. 2018, 9, 406. [Google Scholar] [CrossRef] [PubMed] [Green Version]
  20. Filonchyk, M.; Hurynovich, V.; Yan, H.; Gusev, A.; Shpilevskaya, N. Impact assessment of COVID-19 on variations of SO2, NO2, CO and aod over east China. Aerosol Air Qual. Res. 2020, 20, 1530–1540. [Google Scholar] [CrossRef]
  21. Filonchyk, M.; Hurynovich, V. Spatial distribution and temporal variation of atmospheric pollution in the South Gobi Desert, China, during 2016–2019. Environ. Sci. Pollut. Res. 2020, 27, 26579–26593. [Google Scholar] [CrossRef]
  22. Xu, K.; Cui, K.; Young, L.-H.; Wang, Y.-F.; Hsieh, Y.-K.; Wan, S.; Zhang, J. Air quality index, indicatory air pollutants and impact of COVID-19 event on the air quality near central china. Aerosol. Air Qual. Res. 2020, 20, 1204–1221. [Google Scholar] [CrossRef] [Green Version]
  23. Moussa, M.S.; Mostafa, M.K. Rapid assessment method for evaluation of the weighted contribution of anthropogenic pollution: A case study of lake burullus, Egypt. Water 2021, 13, 3337. [Google Scholar] [CrossRef]
  24. Bauwens, M.; Compernolle, S.; Stavrakou, T.; Müller, J.-F.; Van Gent, J.; Eskes, H.; Levelt, P.F.; Van Der A, R.; Veefkind, J.P.; Vlietinck, J.; et al. Impact of Coronavirus Outbreak on NO2 Pollution Assessed Using TROPOMI and OMI Observations. Geophys. Res. Lett. 2020, 47, e2020GL087978. [Google Scholar] [CrossRef] [PubMed]
  25. Muhammad, S.; Long, X.; Salman, M. COVID-19 pandemic and environmental pollution: A blessing in disguise? Sci. Total Environ. 2020, 728, 138820. [Google Scholar] [CrossRef] [PubMed]
  26. Collivignarelli, M.C.; Abbà, A.; Bertanza, G.; Pedrazzani, R.; Ricciardi, P.; Miino, M.C. Lockdown for COVID-2019 in Milan: What are the effects on air quality? Sci. Total Environ. 2020, 732, 139280. [Google Scholar] [CrossRef] [PubMed]
  27. Bao, R.; Zhang, A. Does lockdown reduce air pollution? Evidence from 44 cities in northern China. Sci. Total Environ. 2020, 731, 139052. [Google Scholar] [CrossRef] [PubMed]
  28. Wang, P.; Chen, K.; Zhu, S.; Wang, P.; Zhang, H. Severe air pollution events not avoided by reduced anthropogenic activities during COVID-19 outbreak. Resour. Conserv. Recycl. 2020, 158, 104814. [Google Scholar] [CrossRef] [PubMed]
  29. Chauhan, A.; Singh, R. Decline in PM2.5 concentrations over major cities around the world associated with COVID-19. Environ. Res. 2020, 187, 109634. [Google Scholar] [CrossRef]
  30. Anil, I.; Alagha, O. The impact of COVID-19 lockdown on the air quality of Eastern Province, Saudi Arabia. Air Qual. Atmos. Health 2021, 14, 117–128. [Google Scholar] [CrossRef]
  31. Shanableh, A.; Al-Ruzouq, R.; Hamad, K.; Gibril, M.B.A.; Khalil, M.A.; Khalifa, I.; El Traboulsi, Y.; Pradhan, B.; Jena, R.; Alani, S.; et al. Effects of the COVID-19 lockdown and recovery on People’s mobility and air quality in the United Arab Emirates using satellite and ground observations. Remote Sens. Appl. Soc. Environ. 2022, 26, 100757. [Google Scholar] [CrossRef]
  32. Mostafa, M.K.; Gamal, G.; Wafiq, A. The impact of COVID-19 on air pollution levels and other environmental indicators—A case study of Egypt. J. Environ. Manag. 2021, 277, 111496. [Google Scholar] [CrossRef]
  33. Kotnala, G.; Mandal, T.K.; Sharma, S.K.; Kotnala, R.K. Emergence of Blue Sky Over Delhi Due to Coronavirus Disease (COVID-19) Lockdown Implications. Aerosol Sci. Eng. 2020, 4, 228–238. [Google Scholar] [CrossRef]
  34. Fan, C.; Li, Y.; Guang, J.; Li, Z.; Elnashar, A.; Allam, M.; De Leeuw, G. The Impact of the Control Measures during the COVID-19 Outbreak on Air Pollution in China. Remote Sens. 2020, 12, 1613. [Google Scholar] [CrossRef]
  35. Gautam, S. COVID-19: Air pollution remains low as people stay at home. Air Qual. Atmos. Health 2020, 13, 853–857. [Google Scholar] [CrossRef] [PubMed]
  36. Albayati, N.; Waisi, B.; Al-Furaiji, M.; Kadhom, M.; Alalwan, H. Effect of COVID-19 on air quality and pollution in different countries. J. Transp. Health 2021, 21, 101061. [Google Scholar] [CrossRef] [PubMed]
  37. Li, M.; Zhang, Q.; Kurokawa, J.-I.; Woo, J.-H.; He, K.; Lu, Z.; Ohara, T.; Song, Y.; Streets, D.G.; Carmichael, G.R.; et al. MIX: A mosaic Asian anthropogenic emission inventory under the international collaboration framework of the MICS-Asia and HTAP. Atmos. Chem. Phys. 2017, 17, 935–963. [Google Scholar] [CrossRef] [Green Version]
  38. van Donkelaar, A.; Martin, R.V.; Brauer, M.; Hsu, N.C.; Kahn, R.A.; Levy, R.C.; Lyapustin, A.; Sayer, A.M.; Winker, D.M. Global Estimates of Fine Particulate Matter using a Combined Geophysical-Statistical Method with Information from Satellites, Models, and Monitors. Environ. Sci. Technol. 2016, 50, 3762–3772. [Google Scholar] [CrossRef] [PubMed]
  39. Stékouabou, C.K.; Chenal, J.; Azmi, R.; Diop, E.B.; Toulni, H.; de Nsegbe, A. Towards air quality particulate-matter monitoring using low-cost sensor data and visual exploration techniques: Case study of Kisumu, Kenya. Procedia Comput. Sci. 2022, 215, 963–972. [Google Scholar] [CrossRef]
  40. Kang, Y.; Aye, L.; Ngo, T.D.; Zhou, J. Performance evaluation of low-cost air quality sensors: A review. Sci. Total Environ. 2022, 818, 151769. [Google Scholar] [CrossRef]
  41. Lin, C.; Labzovskii, L.D.; Mak, H.W.L.; Fung, J.C.; Lau, A.K.; Kenea, S.T.; Bilal, M.; Hey, J.D.V.; Lu, X.; Ma, J. Observation of PM2.5 using a combination of satellite remote sensing and low-cost sensor network in Siberian urban areas with limited reference monitoring. Atmos. Environ. 2020, 227, 117410. [Google Scholar] [CrossRef]
  42. Chu, B.; Zhang, S.; Liu, J.; Ma, Q.; He, H. Significant concurrent decrease in PM2.5 and NO2 concentrations in China during COVID-19 epidemic. J. Environ. Sci. 2021, 99, 346–353. [Google Scholar] [CrossRef]
  43. Orak, N.H.; Ozdemir, O. The impacts of COVID-19 lockdown on PM10 and SO2 concentrations and association with human mobility across Turkey. Environ. Res. 2021, 197, 111018. [Google Scholar] [CrossRef]
  44. Otmani, A.; Benchrif, A.; Tahri, M.; Bounakhla, M.; Chakir, E.M.; El Bouch, M.; Krombi, M. Impact of COVID-19 lockdown on PM10, SO2 and NO2 concentrations in Salé City (Morocco). Sci. Total Environ. 2020, 735, 139541. [Google Scholar] [CrossRef] [PubMed]
  45. El-Sheekh, M.M.; Hassan, I.A. Lockdowns and reduction of economic activities during the COVID-19 pandemic improved air quality in Alexandria, Egypt. Environ. Monit. Assess. 2021, 193, 11. [Google Scholar] [CrossRef] [PubMed]
  46. Bray, C.D.; Nahas, A.; Battye, W.H.; Aneja, V. Impact of lockdown during the COVID-19 outbreak on multi-scale air quality. Atmos. Environ. 2021, 254, 118386. [Google Scholar] [CrossRef] [PubMed]
  47. Ranjan, A.K.; Patra, A.K.; Gorai, A.K. Effect of lockdown due to SARS COVID-19 on aerosol optical depth (AOD) over urban and mining regions in India. Sci. Total Environ. 2020, 745, 141024. [Google Scholar] [CrossRef] [PubMed]
  48. Carminati, L. Port Said and Ismailia as Desert Marvels: Delusion and Frustration on the Isthmus of Suez, 1859–1869. J. Urban Hist. 2019, 46, 622–647. [Google Scholar] [CrossRef]
  49. SCA. SCA—Navigation Statistics. Suez Canal Authority. 2019. Available online: https://www.suezcanal.gov.eg/English/Navigation/Pages/NavigationStatistics.aspx (accessed on 14 January 2022).
  50. Legget, T. Egypt’s Suez Canal Blocked by Huge Container Ship—BBC News. BBC International. 2021. Available online: https://www.bbc.com/news/world-middle-east-56505413 (accessed on 22 April 2023).
  51. Somvanshi, S.S.; Vashisht, A.; Chandra, U.; Kaushik, G. Delhi Air Pollution Modeling Using Remote Sensing Technique. Handb. Environ. Mater. Manag. 2019, 1–27. [Google Scholar] [CrossRef]
  52. NKrotkov, A.; Cam, S.A.; Krueger, A.J.; Bhartia, K.; Yang, K. Band residual difference algorithm for retrieval of so2 from the aura Ozone Monitoring Instrument (OMI). IEEE Trans. Geosci. Remote Sens. 2006, 44, 1259–1266. [Google Scholar] [CrossRef]
  53. Krotkov, N.A.; McLinden, C.A.; Li, C.; Lamsal, L.N.; Celarier, E.A.; Marchenko, S.V.; Swartz, W.H.; Bucsela, E.J.; Joiner, J.; Duncan, B.N.; et al. Aura OMI observations of regional SO2 and NO2 pollution changes from 2005 to 2015. Atmos. Chem. Phys. 2016, 16, 4605–4629. [Google Scholar] [CrossRef] [Green Version]
  54. Yan, H.; Chen, L.; Tao, J.; Su, L.; Huang, J.; Han, D.; Yu, C. Corrections for OMI SO2 BRD retrievals influenced by row anomalies. Atmos. Meas. Tech. 2012, 5, 2635–2646. [Google Scholar] [CrossRef] [Green Version]
  55. Li, C.; Krotkov, N.A.; Leonard, P.J.T.; Carn, S.; Joiner, J.; Spurr, R.J.D.; Vasilkov, A. Version 2 Ozone Monitoring Instrument SO2 product (OMSO2 V2): New anthropogenic SO2 vertical column density dataset. Atmos. Meas. Tech. 2020, 13, 6175–6191. [Google Scholar] [CrossRef]
  56. Mak, H.W.L.; Laughner, J.L.; Fung, J.C.H.; Zhu, Q.; Cohen, R.C. Improved Satellite Retrieval of Tropospheric NO2 Column Density via Updating of Air Mass Factor (AMF): Case Study of Southern China. Remote Sens. 2018, 10, 1789. [Google Scholar] [CrossRef] [Green Version]
  57. Schaap, M.; Kranenburg, R.; Curier, L.; Jozwicka, M.; Dammers, E.; Timmermans, R. Assessing the Sensitivity of the OMI-NO2 Product to Emission Changes across Europe. Remote Sens. 2013, 5, 4187–4208. [Google Scholar] [CrossRef] [Green Version]
  58. Li, C.; Krotkov, N.A.; Leonard, J.T. OMI/Aura Sulfur Dioxide (SO2) Total Column L3 1 Day Best Pixel in 0.25 Degree × 0.25 Degree V3; Goddard Earth Sciences Data and Information Services Center (GES DISC): Greenbelt, MD, USA, 2020. [Google Scholar] [CrossRef]
  59. Krotkov, N.A. OMI/Aura NO2 Cloud-Screened Total and Tropospheric Column L3 Global Gridded 0.25 Degree × 0.25 Degree V3; NASA Goddard Space Flight Center. Goddard Earth Sciences Data and Information Services Center (GES DISC): Greenbelt, MD, USA, 2019. [Google Scholar] [CrossRef]
  60. Aumann, H.H.; Chahine, M.T.; Gautier, C.; Goldberg, M.D.; Kalnay, E.; McMillin, L.M.; Revercomb, H.; Rosenkranz, P.W.; Smith, W.L.; Staelin, D.H.; et al. AIRS/AMSU/HSB on the aqua mission: Design, science objectives, data products, and processing systems. IEEE Trans. Geosci. Remote Sens. 2003, 41, 253–263. [Google Scholar] [CrossRef] [Green Version]
  61. Pagano, T.S.; Aumann, H.H.; Hagan, D.E.; Overoye, K. Prelaunch and in-flight radiometric calibration of the Atmospheric Infrared Sounder (AIRS). IEEE Trans. Geosci. Remote Sens. 2003, 41, 265–273. [Google Scholar] [CrossRef]
  62. Pagano, T.S.; Chahine, M.T.; Olsen, E.T. Seven years of observations of mid-tropospheric CO2 from the Atmospheric Infrared Sounder. Acta Astronaut. 2011, 69, 355–359. [Google Scholar] [CrossRef]
  63. Chahine, M.; Barnet, C.; Olsen, E.T.; Chen, L.; Maddy, E. On the determination of atmospheric minor gases by the method of vanishing partial derivatives with application to CO2. Geophys. Res. Lett. 2005, 32, L22803. [Google Scholar] [CrossRef] [Green Version]
  64. Xiong, X.; Barnet, C.; Maddy, E.; Sweeney, C.; Liu, X.; Zhou, L.; Goldberg, M. Characterization and validation of methane products from the Atmospheric Infrared Sounder (AIRS). J. Geophys. Res. Biogeosci. 2008, 113, G00A01. [Google Scholar] [CrossRef]
  65. Warner, J.; Comer, M.M.; Barnet, C.D.; McMillan, W.W.; Wolf, W.; Maddy, E.; Sachse, G. A comparison of satellite tropospheric carbon monoxide measurements from AIRS and MOPITT during INTEX-A. J. Geophys. Res. Atmos. 2007, 112, 12–17. [Google Scholar] [CrossRef] [Green Version]
  66. Kim, S.W.; Yoon, S.C.; Kim, J.; Kim, S.Y. Seasonal and monthly variations of columnar aerosol optical properties over east Asia determined from multi-year MODIS, LIDAR, and AERONET Sun/sky radiometer measurements. Atmos. Environ. 2007, 41, 1634–1651. [Google Scholar] [CrossRef]
  67. Dubovik, O.; Smirnov, A.; Holben, B.N.; King, M.D.; Kaufman, Y.J.; Eck, T.F.; Slutsker, I. Accuracy assessments of aerosol optical properties retrieved from Aerosol Robotic Network (AERONET) Sun and sky radiance measurements. J. Geophys. Res. Atmos. 2000, 105, 9791–9806. [Google Scholar] [CrossRef] [Green Version]
  68. Levy, R.C.; Mattoo, S.; Munchak, L.A.; Remer, L.A.; Sayer, A.M.; Patadia, F.; Hsu, N.C. The Collection 6 MODIS aerosol products over land and ocean. Atmos. Meas. Tech. 2013, 6, 2989–3034. [Google Scholar] [CrossRef] [Green Version]
  69. Sayer, A.M.; Hsu, N.C.; Bettenhausen, C.; Jeong, M.J. Validation and uncertainty estimates for MODIS Collection 6 ‘Deep Blue’ aerosol data. J. Geophys. Res. Atmos. 2013, 118, 7864–7872. [Google Scholar] [CrossRef] [Green Version]
  70. Platnick, S.; Meyer, K.; Wind, G.; Holz, R.E.; Amarasinghe, N.; Hubanks, P.A.; Marchant, B.; Dutcher, S.; Veglio, P. The NASA MODIS-VIIRS Continuity Cloud Optical Properties Products. Remote Sens. 2021, 13, 2. [Google Scholar] [CrossRef]
  71. Elshora, M. Evaluation of MODIS combined DT and DB AOD retrievals and their association with meteorological variables over Qena, Egypt. Environ. Monit. Assess. 2023, 195, 483. [Google Scholar] [CrossRef] [PubMed]
  72. LAADS DAAC. Level-1 and Atmosphere Archive & Distribution System Distributed Active Archive Center. NASA. 2022. Available online: https://ladsweb.modaps.eosdis.nasa.gov/ (accessed on 7 June 2023).
  73. Taskinen, H.; Väisänen, A.; Hatakka, L.; Virtanen, T.H.; Lähivaara, T.; Arola, A.; Kolehmainen, V.; Lipponen, A. High-Resolution Post-Process Corrected Satellite AOD. Geophys. Res. Lett. 2022, 49, e2022GL099733. [Google Scholar] [CrossRef]
  74. SCA. SCA—Home. Suez Canal Authority. 2022. Available online: https://www.suezcanal.gov.eg/English/Downloads/Pages/default.aspx (accessed on 13 September 2022).
  75. SAFETY4SEA. Despite Ever Given Blockage and COVID-19, Suez Canal Sees Record Traffic and Revenues. SAFETY4SEA. 2022. Available online: https://safety4sea.com/despite-ever-given-blockage-and-covid-19-suez-canal-sees-record-traffic-and-revenues/ (accessed on 13 September 2022).
  76. Kuźmicz, K.A. Impact of the COVID-19 pandemic disruptions on container transport. Eng. Manag. Prod. Serv. 2022, 14, 106–115. [Google Scholar] [CrossRef]
  77. Abdelsattar, A.; Al Nadhairi, R.; Hassan, A.N. Space-based monitoring of NO2 levels during COVID-19 lockdown in Cairo, Egypt and Riyadh, Saudi Arabia. Egypt. J. Remote Sens. Space Sci. 2021, 24, 659–664. [Google Scholar] [CrossRef]
  78. Shen, Y.; Jiang, F.; Feng, S.; Zheng, Y.; Cai, Z.; Lyu, X. Impact of weather and emission changes on NO2 concentrations in China during 2014–2019. Environ. Pollut. 2021, 269, 116163. [Google Scholar] [CrossRef]
  79. Gad, M.; Ağbulut, Ü.; El-Shafay, A.; Panchal, H.; Emara, K.; Al-Mdallal, Q.M.; Afzal, A. Experimental and numerical assessment of the rotary bed reactor for fuel-processing and evaluation of produced oil usability as fuel substitute. Case Stud. Therm. Eng. 2022, 29, 101710. [Google Scholar] [CrossRef]
  80. Ağbulut, Ü.; Gürel, A.E.; Sarıdemir, S. Experimental investigation and prediction of performance and emission responses of a CI engine fuelled with different metal-oxide based nanoparticles–diesel blends using different machine learning algorithms. Energy 2021, 215, 119076. [Google Scholar] [CrossRef]
  81. Bhatt, M. Performance Evaluation of Single Cylinder Diesel Engine Using Tyre Pyrolysis Oil (TPO) Blends. Int. J. Recent Innov. Trends Comput. Commun. 2019, 7, 46–51. [Google Scholar] [CrossRef]
  82. Do, O.; Elik, M.B.; Özdalyan, B. The effect of tire derived fuel/diesel fuel blends utilization on diesel engine performance and emissions. Fuel 2012, 95, 340–346. [Google Scholar] [CrossRef]
  83. Aydin, H.; Ilkili, C. Analysis of combustion, performance and emission characteristics of a diesel engine using low sulfur tire fuel. Fuel 2015, 143, 373–382. [Google Scholar] [CrossRef]
  84. Pilusa, T.J. The use of modified tyre derived fuel for compression ignition engines. Waste Manag. 2017, 60, 451–459. [Google Scholar] [CrossRef] [PubMed]
  85. Abburi, R.; Srinivas, B.; Rao, K.S. Experimental Investigations on Diesel Engine Fueled with Tyre Pyrolysis Oil and Diesel Blends. Int. J. Eng. Res. Technol. 2014, 3, 1213–1219. [Google Scholar]
  86. Chi, Y.; Fan, M.; Zhao, C.; Sun, L.; Yang, Y.; Yang, X.; Tao, J. Ground-level NO2 concentration estimation based on OMI tropospheric NO2 and its spatiotemporal characteristics in typical regions of China. Atmos. Res. 2021, 264, 105821. [Google Scholar] [CrossRef]
  87. Di Bernardino, A.; Mevi, G.; Iannarelli, A.M.; Falasca, S.; Cede, A.; Tiefengraber, M.; Casadio, S. Temporal Variation of NO2 and O3 in Rome (Italy) from Pandora and In Situ Measurements. Atmosphere 2023, 14, 594. [Google Scholar] [CrossRef]
  88. Wang, C.; Wang, T.; Wang, P. The Spatial–Temporal Variation of Tropospheric NO2 over China during 2005 to 2018. Atmosphere 2019, 10, 444. [Google Scholar] [CrossRef] [Green Version]
  89. Chang, L.-S.; Kim, D.; Hong, H.; Kim, D.-R.; Yu, J.-A.; Lee, K.; Lee, H.; Kim, D.; Hong, J.; Jo, H.-Y.; et al. Evaluation of correlated Pandora column NO2 and in situ surface NO2 measurements during GMAP campaign. Atmos. Chem. Phys. 2022, 22, 10703–10720. [Google Scholar] [CrossRef]
  90. Thompson, A.M.; Stauffer, R.M.; Boyle, T.P.; Kollonige, D.E.; Miyazaki, K.; Tzortziou, M.; Herman, J.R.; Abuhassan, N.; Jordan, C.E.; Lamb, B.T. Comparison of Near-surface NO2 Pollution with Pandora Total Column NO2 during the Korea-United States Ocean Color (KORUS OC) Campaign. J. Geophys. Res. Atmos. JGR 2019, 124, 13560. [Google Scholar] [CrossRef]
  91. Spurr, R. LIDORT and VLIDORT: Linearized pseudo-spherical scalar and vector discrete ordinate radiative transfer models for use in remote sensing retrieval problems. Light Scatt. Rev. 2008, 3, 229–275. [Google Scholar] [CrossRef]
  92. Madkour, K.M. Monitoring the impacts of COVID-19 pandemic on climate change and the environment on Egypt using Sentinel-5P Images, and the Carbon footprint methodology. Egypt. J. Remote Sens. Space Sci. 2022, 25, 205–219. [Google Scholar] [CrossRef]
  93. Hellenic Shipping News. Suez Canal Blockage Caused Sulphur Pollution Spike. Hellenic Shipping News. 2021. Available online: https://www.msn.com/en-xl/news/other/suez-canal-blockage-caused-sulphur-pollution-spike/ar-BB1fBLO6 (accessed on 13 September 2022).
  94. Rouleau, J.; Gosselin, L. Impacts of the COVID-19 lockdown on energy consumption in a Canadian social housing building. Appl. Energy 2021, 287, 116565. [Google Scholar] [CrossRef] [PubMed]
  95. Renuka, K.; Gadhavi, H.; Jayaraman, A.; Rao, S.V.B.; Lal, S. Study of mixing ratios of SO2 in a tropical rural environment in south India. J. Earth Syst. Sci. 2020, 129, 104. [Google Scholar] [CrossRef]
  96. Filonchyk, M.; Peterson, M. Air Quality Changes in Shanghai, China, and the Surrounding Urban Agglomeration During the COVID-19 Lockdown. J. Geovisualization Spat. Anal. 2020, 4, 22. [Google Scholar] [CrossRef]
  97. El-Magd, I.A.; Zanaty, N. Impacts of short-term lockdown during COVID-19 on air quality in Egypt. Egypt. J. Remote Sens. Space Sci. 2021, 24, 493–500. [Google Scholar] [CrossRef]
  98. Mehlig, D.; Apsimon, H.; Staffell, I. The impact of the UK’s COVID-19 lockdowns on energy demand and emissions. Environ. Res. Lett. 2021, 16, 054037. [Google Scholar] [CrossRef]
  99. WeatherSpark. Climate and Average Weather Year Round in Ismailia Egypt. Weather Spark. 2022. Available online: https://weatherspark.com/y/148846/Average-Weather-at-Masjed-Soleyman-Iran-Year-Round (accessed on 13 September 2022).
Figure 1. The study area at Suez Canal, Egypt.
Sustainability 15 09362 g001
Figure 2. The yearly concentration in molecule/cm2 of: (a) NO2 mean value for 2017–2019; (b) NO2 in 2020 vs. baseline; (c) NO2 in 2021 vs. baseline; (d) NO2 in 2022 vs. baseline.
Sustainability 15 09362 g002
Figure 3. Number of ships passing through the Suez Canal from 2000 to 2019.
Sustainability 15 09362 g003
Figure 4. The monthly concentration (from January to April) in molecule/cm2 of: (a) NO2 mean value for 2017–2019; (b) NO2 in 2020 vs. baseline; (c) NO2 in 2021 vs. baseline; (d) NO2 in 2022 vs. baseline.
Sustainability 15 09362 g004
Figure 5. The average NO2 concentration in molecule/cm2 for the period 23 March to 29 March.
Sustainability 15 09362 g005
Figure 6. The yearly concentration in DU of: (a) SO2 mean value for 2017–2019; (b) SO2 in 2020 vs. baseline; (c) SO2 in 2021 vs. baseline; (d) SO2 in 2022 vs. baseline.
Sustainability 15 09362 g006
Figure 7. The monthly concentration (from January to April) in DU of: (a) SO2 mean value for 2017–2019; (b) SO2 in 2020 vs. baseline; (c) SO2 in 2021 vs. baseline; (d) SO2 in 2022 vs. baseline.
Sustainability 15 09362 g007
Figure 8. The average SO2 concentration in DU for the period 23 March to 29 March.
Sustainability 15 09362 g008
Figure 9. (Left) Wind speed at study area in m/sec. (Right) Wind rose showing number of hours per year the wind blows from the indicated direction.
Sustainability 15 09362 g009
Figure 10. The yearly concentration in ppbv of: (a) CO mean value for 2017–2019; (b) CO in 2020 vs. baseline; (c) CO in 2021 vs. baseline; (d) CO in 2022 vs. baseline.
Sustainability 15 09362 g010
Figure 11. The average CO concentration in ppbv for the period 23 March to 29 March.
Sustainability 15 09362 g011
Figure 12. The monthly AOD value (from January to April): (a) 2017–2019; (b) 2020 vs. baseline; (c) 2021 vs. baseline; (d) 2022 vs. baseline.
Sustainability 15 09362 g012
Figure 13. The average AOD for the period from: (a) 1 January to 9 February; (b) 23 March to 29 March.
Sustainability 15 09362 g013
Disclaimer/Publisher’s Note: The statements, opinions and data contained in all publications are solely those of the individual author(s) and contributor(s) and not of MDPI and/or the editor(s). MDPI and/or the editor(s) disclaim responsibility for any injury to people or property resulting from any ideas, methods, instructions or products referred to in the content.