Article

An Approach to Understanding the Hydration of Cement-Based Composites Reinforced with Untreated Natural Fibers

1
CATS Research Group, Department of Architecture and Construction Engineering, University of Girona, Avda Mª Aurelia Capmany 61, 17071 Girona, Spain
2
LEPAMAP-PRODIS Research Group, Department of Organization, Business Management and Product Design, University of Girona, Avda Mª Aurelia Capmany 61, 17071 Girona, Spain
*
Author to whom correspondence should be addressed.
Sustainability 2023, 15(12), 9388; https://doi.org/10.3390/su15129388
Submission received: 23 March 2023 / Revised: 7 June 2023 / Accepted: 8 June 2023 / Published: 11 June 2023

Abstract

:
The use of untreated natural fibers to reinforce cementitious composites improves their environmental friendliness, resulting in a more sustainable material. Moreover, the influence of the untreated natural fibers on the hydration process of Portland cement composites presents some uncertainties. According to the literature, the most usual tests to analyze the degree of hydration of cement composites are the differential thermal and thermogravimetric analyses (TGA/dTGA). Several authors propose to analyze data methods to establish the degree of hydration of cement composites. This paper presents the TGA/dTGA test carried out on mortar samples with and without fibers at age 2, 3, 7, 14, and 28 days. The degree of hydration was calculated according to Bhatty’s method. To characterize the raw materials, the quantitative chemical was determined using scanning electron microscopy and energy dispersive X-ray spectroscopy (SEM–EDX). The main findings of this study were that the presence of untreated natural hemp fibers in the OPC composites increased the hydration degree by 9%. The presence of fibers affected the formation of several components. Thus, their presence increased the formation of monosulphate, reduced portlandite, did not affect ettringite, and increased the formation of calcite, thereby improving the sustainable footprint due to the increased CO2 fixation.

1. Introduction

In the last few years, with the aim of using sustainable materials, a great deal of research has been carried out on eco-friendly materials. Cement composites are commonly used building materials that are used as mortar or concrete [1]. Attributed to their excellent compressive strength, low cost, long service life, and relatively low maintenance requirements, cement composites have been used for 2000 years. The main drawbacks of cement composites are their low tensile strength. To overcome this shortcoming, the cement composites have traditionally been reinforced with steel bars or steel, mineral, or plastic fibers. The natural fiber obtained from recycled plant resources has a hydrophilic nature, low cost, is environmentally friendly, and is biocompatible. These properties make it an ideal candidate for cement-based composites [2,3,4]. Moreover, the use of natural fibers reduces the carbon footprint in relation to cement composites reinforced with metal or plastic fibers [5,6]. Due to the requirements for the sustainable development of environmentally friendly building materials, particular interest has been given to the use of natural fibers as reinforcement for cementitious materials [7,8].
It is well known that natural fiber consists of three main components: cellulose, hemicellulose, and lignin [9,10,11,12]. Cellulose, the main structural component in natural fiber, has a hemi-crystal phase, while hemicellulose and lignin have amorphous phases and binding phases for cellulose [9,13,14]. The mechanical properties of the natural fiber are excellent due to their low density, but when they are exposed to alkaline pore solutions and the mineral-rich environment of the cement matrix, the natural fiber degrades. This significantly affects the bond between the fiber and the cement composite matrix, decreasing its reinforced capacity [15].
To mitigate this degradation, the natural fibers are pre-treated using hornification, sodium silicate, potassium silicate, silane coating, among the others [2,15,16,17,18]. Nevertheless, several authors have proposed a matrix of ordinary Portland cement (OPC) free of calcium hydroxide (CH). For this purpose, the OPC is partially replaced with several materials such as metakaolin [19,20,21,22], crushed calcined clay bricks [19,20], ground granulated blast furnace slag [22,23,24], and the results are promising. In this case, partial Porland cement replacement materials initially improve the mechanical properties and the durability of the natural fiber reinforcement cement composites (NFRCCs). Although the above referenced studies do not specifically focus on the study of the hydration of cementitious composites, they do modify the hydration process of cement by changing the behavior of natural fibers. Moreover, the use of natural fibers is suitable to increase the level of hydration in cement composites [25]. As stated in [26], the natural fibers have a high water-adsorption capacity that reduces the free water available for the curing process and delays the hardening of the NFRCCs. The authors of [27] analyzed the effect of the water/binder (W/B) ratio with different dosages of coconut fiber, and they concluded that a low W/B ratio reduces the water absorption of the samples due to the reduction of their porosity. Despite previous research, the effect of fibers in enhancing cement hydration presents uncertainties.
Among others, one of the most widely used fibers is hemp due to its low environmental impact, since fertilizer doses used in its cultivation are lower than those of other fibers, and hemp does not require pesticides. In addition, it contributes favorably to the greenhouse effect due to its “carbon-negative” behavior [28,29]. Others research [30,31] focuses on the use of hemp as a substitute for aggregate to reduce the consumption of mineral aggregate and to mitigate their effect on greenhouse gas emissions.
According to the literature, the most relevant products from the hydration of the OPC are calcium silicate hydrate (C-S-H) and portlandite (calcium hydroxide CH) [32,33].
In order to analyze the hydration of the OPC, a differential thermal and thermogravimetric analysis (DTA-TG) is one of the most effective tests proposed [34,35,36]. Thus, the reactions that occur in OPC with increasing temperature have been described in the literature [32]. To determine the degree of hydration from the thermal analysis tests, the most widely used methods are those proposed by Bhatty [37]. The author proposed four phases based on the loss of water from cement hydrates. The first refers to evaporative free water loss. The second, called the dehydration phase (Ldh), corresponds to the decomposition of gypsum and ettringite, as well as to the loss of the water from the carboalumination and C-S-H hydrates. The third phase relates to the dihydroxylation of portlandite (Ldx). Finally, the last phase refers to the decarbonation of calcium carbonate (Ldc) [32,38].
Based on Bhatty’s method, several authors presented different ways to achieve more accurate results. Thus, Pane et al. [39] added a new value depending on the type of mineral used to replace a portion of the Portland cement. The authors proposed a different range of degrees for Ldh, Ldx, and Ldc. Monteagudo et al. [34] used a mixed equation proposed by Bhatty and Pane et al. and proposed another range of degrees for the water loss. Mounanga [40] added the values of the mass loss recorded between 600 and 800 °C, the device’s drift, the meaning of the mass variation of the empty crucible subjected to an elevated temperature causing a weight increase, and finally, the ignition loss of the anhydrous cement mass. Finally, Ref. [41] proposed a more accurate method to compute calcium hydroxide [Ca(OH)2], taking into account the carbonation that occurs during the preparation of the specimens.
The limits of these phases differ according to the different models proposed in the literature. Table 1 shows the Ldh, Ldx, and Ldc range values recorded by the different authors.
Moreover, the main weight loss phases in natural fibers consisted of the loss of water through evaporation that occurred in the 40–110 °C range, the weight loss that occurred through hemicellulose decomposition, as well as a major part of lignin in the 270–380 °C range. The higher temperature presented the bigger loss of weight due to the degradation of lignin and cellulose [15,42,43,44].
Although the literature indicates the positive effect of natural fibers on cement hydration [25], there are few studies on this matter. The goal of this study is to understand the influence of natural fibers, in this case hemp without pre-treatment, in the hydration of NFRCCs using a qualitative analysis. For this purpose, several samples of OPC mortar with and without natural hemp fibers were tested. The fibers were not treated to maximize the fibers’ water retention and its effect in the hydration process. Different tests were carried out to characterize the mortar samples: scanning electron microscopy and energy dispersive X-ray spectroscopy (SEM–EDX), X-ray diffraction (XRD), and TGA/dTGA. For the characterization of cement, sand, and fibers, SEM–EDX was carried out. Moreover, due to its ease of computing values and its sufficient level of accuracy for this study, Bhatty’s method [37] was used to compute the degree of hydration. The main conclusion of this study was that the natural untreated hemp fibers increased the hydration degree of the samples by 9%. Moreover, the formation of ettringite was not affected by the fibers, but the formation of monosulphate clearly increased. Moreover, the presence of the fibers reduced, in general, the formation of portlandite. Finally, the higher formation of calcite in the samples with fibers confirmed its behavior as a CO2 collector and reduced the carbon footprint.

2. Materials and Methods

2.1. Materials

According to [45], the samples were manufactured using Portland Cement CEM I/42.5 N-SR 5, Uniland brand. The sand was a granitic, crushed, washed aggregate with 0/2 granulometric fraction (AF-0/2-T-G-L) according to [46]. The cement to sand ratio (C:S) was 1:3. Normally, the water: cement ratio for a concrete and mortar elements ranges between 0.45 and 0.55 if additives are not used. The minimum stochiometric water: cement ratio is 0.23, in terms of the hydration process [47], so the remaining water was used to improve the workability of the conglomerate. Thus, to analyze the effect of the fibers in the hydration process of the cement, this study used a potable water to cement ratio (W/C)of 0.33.
The function of the fiber is to partially replace the aggregates, so the fiber size ranged from 0.5 to 2 mm. The fiber was supplied in blankets that were manually cut. To unify the size of the fibers, they were sieved with a rotary and vibrating machine using 0.5- and 2-mm sieves from the UNE 7050 series. According to the literature [30,48], the most common weight rate of fiber versus Portland cement weight ranges between 0.5 and 3%, and 1% is a very frequent rate.
Table 2 shows the quantitative chemical composition of Portland cement, sand, and fibers, and this was determined through scanning electron microscopy and energy dispersive X-ray spectroscopy (SEM–EDX) using a scanning electron microscope (SEM) (ZEISS DSM 960 A, 20 kV, resolution 25–4 nm, image resolution 2048 × 2048 pixels) and energy dispersive X-ray spectrometer (EDX) (Bruker X-Flash 5010), and a silicon drift detector (SDD) refrigerated by Peltier, with a resolution ≥ 129 eV Kα Mn. (Bruker, GmbH, Germany). To analyze the samples, they were soaked in a dilution of acetone to stop hydration, water exchange, and to avoid carbonation of the samples.
Although this was a semi-quantitative analysis, since the reading of the composition of the samples was superficial, it was useful to have an approximation of the composition of the raw materials used in the manufacturing of the mortar. Table 2 presents the average values obtained from the analysis of four points in the sample of Portland cement (Figure 1a), and three points in the sand samples (Figure 2a). Figure 1b shows the EDX plot of the Portland cement sample corresponding to point object 2. As can be seen, the main components of the cement used were O, Ca, Si, and C at a rate of 48.34%, 35.38%, 5.47%, and 4%, respectively. It was a cement with a high percentage of Ca and low Al content (1.36%) as it was a sulphate-resistant cement in which the amount of C3A must be less than or equal to 5% [49,50]. For the sand, Figure 2b shows the EDX plot of the sample corresponding to point object 3. In this case, the major components were O, C, Si, and Fe at a rate of 47.74%, 15.34%, 13.75%, and 8.69%, respectively. It was a silica sand appropriate for the manufacturing of mortar.
For the fiber, due to its greater uniformity, all samples (Figure 3a) were analyzed. As hemp fiber is an organic material, it is mainly composed of C, O, and Ca at a rate of 65.99%, 32.34%, and 1.20%, respectively. As in any organic material, carbon was the main element. Figure 3b shows the EDX plot of the untreated hemp fiber.

2.2. Test Methods

To analyze the degree of hydration, different tests were carried out on the samples with and without fibers at age 2, 3, 7, 14, and 28 days and manufactured according to [45]. The size of the mortar samples was 30 × 30 mm2 and 3 mm thick. The manufacturing process of the specimens was carried out in a planetary mixer, following these steps: (1) water and Portland cement were introduced and mixed for 30 s. (2) Sand and fiber were added and mixed for 30 s. more. (3) As indicated in the standard, the planetary mixer was stopped for 30 s. (4) To improve the homogeneity of the mortar, the material adhering to the walls of the planetary mixer was recovered and mixed for 60 s. All materials were added dry.
As stated in [51], the samples were kept in a humid chamber at 20 ± 3 °C with 65 ± 5% relative humidity after demolding (1 to 3 days) until the day of testing.
The thermogravimetric analysis (TGA) was carried out according to [52] with a TGA/DSC 1 instrument from METTLER TOLEDO, with a balance resolution of 0.1 μg and a temperature accuracy of ±0.5 °C. The method consisted of a heating rate of 30 °C to 1000 °C, 20 °C/min under an atmosphere of synthetic air with a purge of 40 mL/mm, and using crucibles of alumina with a capacity of 150 μL.
Once the TGA test was performed and the corresponding values were obtained, Bhatty’s [37] method was applied to determine the degree of hydration of the mortar. The method proposes Equations (1) and (2) for calculating the chemically bound water and the degree of hydration, respectively.
WB = Ldh + Ldx + 0.41 (Ldc)
α = W B   0 . 24 ×   100
where WB, Ldh, Ldx, Ldc, and α are the chemically bound water, mass loss in dehydration (105–440 °C), dihydroxylation (440–580 °C), and decarbonation (580–1000 °C) phases and the hydration degree, all values are expressed in percentage.
Equation (1) expresses the chemically bound water (WB) calculation from the relative mass losses of Ldh, Ldx, and Ldc. Bhatty proposed a constant value of 0.41 derived from the carbonated portlandite. This factor is the result of a division of the molecular weights of H2O and CO2 (18/44). Equations (3) and (4) show the reactions that take place during the carbonation of calcium hydroxide (CH) and the posterior decomposition of the carbonates. Molecular weights were added under different molecules involved in the carbonation process.
Ca (OH)2 + CO2 → CaCO3 + H2O
 74    44       100      18
CaCO3 → CaO + CO2
100    56    44
The value of 0.24 in Equation (2) represents the maximum chemically bound water necessary to hydrate a cement particle that has lost its wholeness (WB∞), which can range between 0.23 and 0.25 [53]. Thus, the degree of hydration is directly proportional to the chemically bound water.
The chemical composition of the mortar samples was determined using X-ray diffraction (XRD) with a Bruker D8 Advance powder diffractometer with Bragg–Brentano Theta-2Theta geometry and copper K-alpha radiation (λ = 1.5406 Ǻ) from a ceramic X-ray tube. A secondary graphite monochromator was used and the angle range scanned was 4 to 50° 2 θ with a step size of 0.05° and a scan step of 13, 15, 10, and 6 s.
The quantitative chemical composition of the mortar samples was carried out using scanning electron microscopy and energy dispersive X-ray spectroscopy (SEM–EDX). The specimen preparation and test procedure were the same as those described in the previous section.

3. Results and Discussion

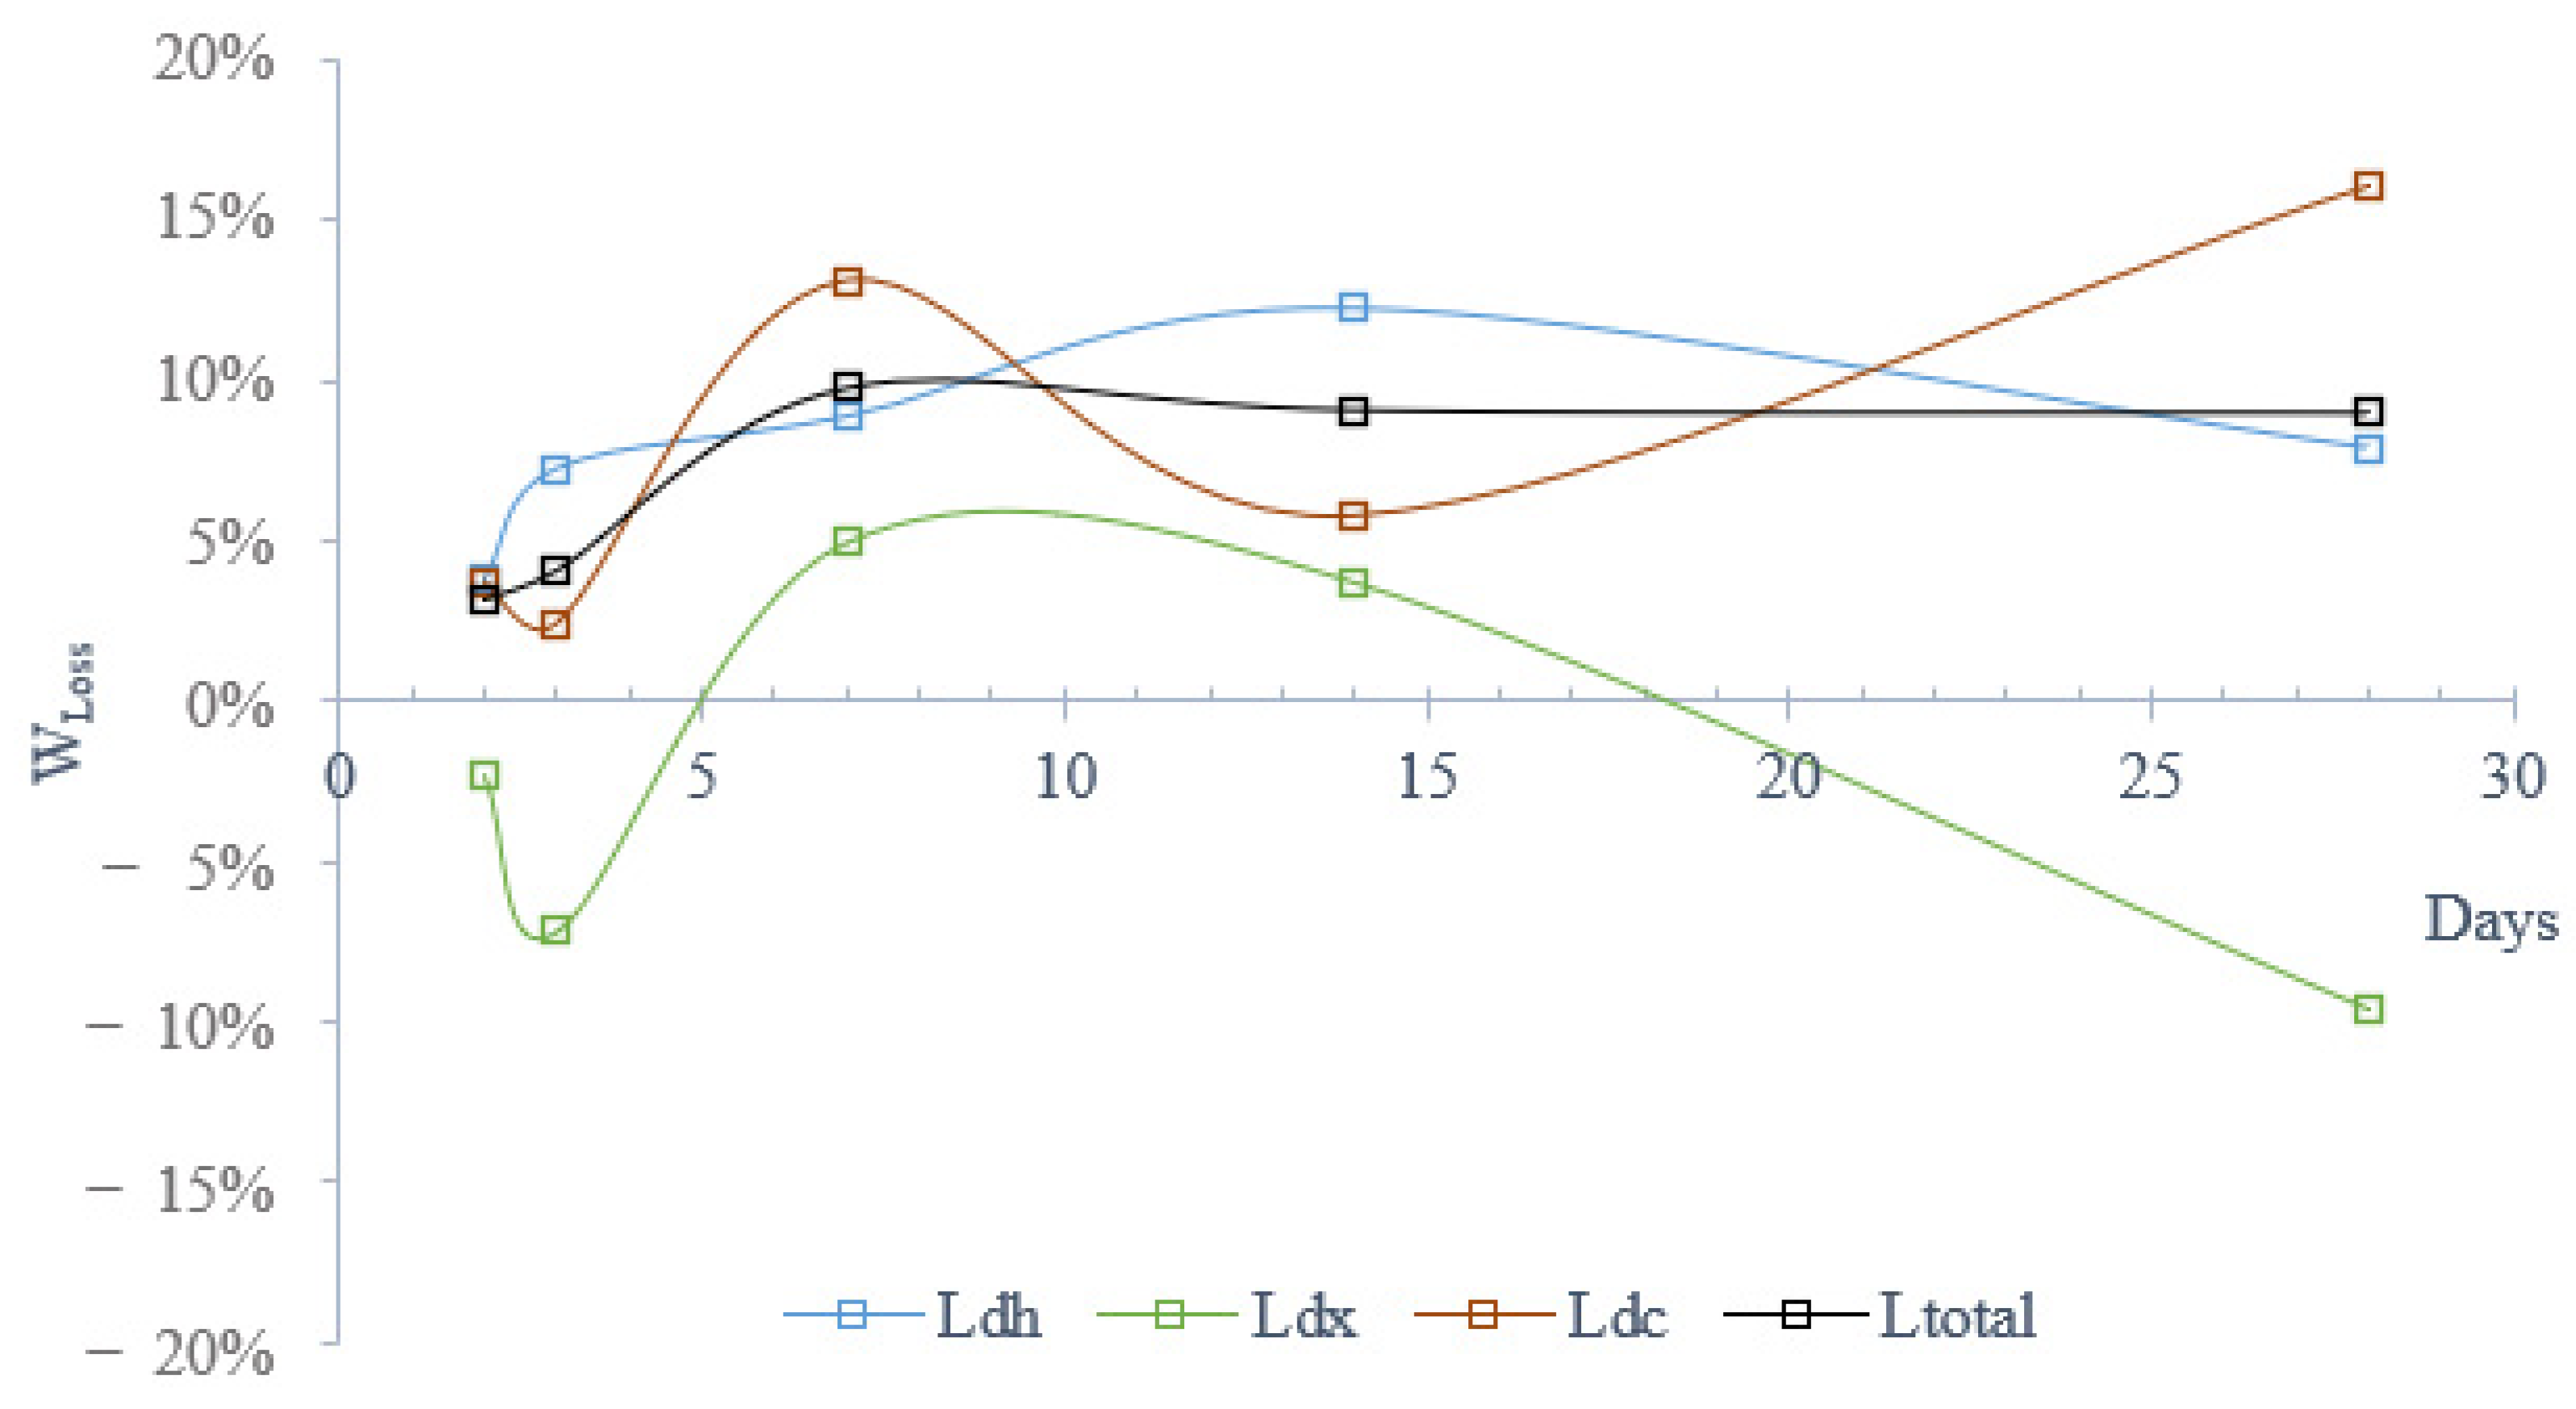
3.1. Differential Thermal and Thermogravimetric Analysis (TGA/dTGA)

Table 3 shows the weight losses, chemically bound water, and hydration degree after analyzing the TG heating curve of the samples with (MF) and without (M) fibers.
The degree of hydration showed slightly lower values than expected [54]. Moreover, the hydration values of the samples at 28 days were lower than those obtained at 14 days. These decreases could be associated with the presence of fine aggregate. This fact does not substantially modify the qualitative analysis sought in this study, but it would require future studies to minimize its effect.
To better analyze the values presented in Table 3, Figure 4 shows the difference in the weight loss (Wloss) computed as the value of the weight loss of the sample with fibers minus the value of the same sample but without fibers, and divided by the weight loss of the sample with fibers expressed in percentage for Ldh, Ldx, Ldc, and Ltotal over time. As observed in Figure 4 and Table 3, the degree of hydration was higher in the mortar with fibers.
From the values for Ltotal, it could be observed that the value for the fiber samples was higher than for the samples without fiber. This value increased to a value of around 9% at 7 days, and from here, it remained constant. In the dehydration phase (Ldh), the difference in weight loss increased until it reached 12% at 14 days, and decreased to a value of 8% at 28 days. These hydration increases in the samples with fibers agree with the literature [25]. In this phase, the fiber decomposed from 110 to 380 °C, with approximately 96% disappearing and the rest becoming ash [44], but it was not possible to attribute all of the difference in weight loss at this point because the fiber represented 0.25% of the total weight of the samples. Moreover, the formation of ettringite, produced at early ages, remained similar in both with and without fiber samples. The hemp fibers, due to their composition (Table 2), promoted the formation of a greater quantity of monosulphate through a reaction between ettringite, C3A, and water. When the gypsum was consumed, monosulphate was formed (at advanced ages) and the amount of ettringite decreased. When the hemp fiber was added, it provided a major retention of water, an additional amount of Ca, and a small amount of Al, which together with the C and O from the fiber accelerated carbonation, promoting the formation of a greater amount of monosulphate, although it was not detected in the XRD. Thus, the greater weight loss for the fiber samples in this phase could be associated with an increase in the production of monosulphate.
In the dihydroxylation phase (Ldx), a lower level of hydrated products, in this case portlandite, was observed in the samples with fibers during the first 3 days. This behavior could be attributed to the chemical composition, porosity, and hydrophilicity of the fibers that delay the hydration of the mortar. The existing literature confirms this fact because the porosity and hydrophilicity of fibers produces a buffer effect that regulates the moisture within the mortar [26,55]. For this reason, it was observed in the thermogravimetric curves and in the diffractograms that there was a lower portlandite content in the mortar with fibers at early ages. Then after 7 days, the portlandite content increased in all samples and was very similar but always slightly lower in the mortar with fibers. Therefore, the fibers acted as regulators in the curing of the mortar, producing a slower hydration in the early ages.
Finally, in the decarbonation phase (Ldc), the effect of carbonation in the mortar was complete at 14 days for a sample without fibers, while carbonation in the fiber samples continued to increase. This point could be attributed to the saturation of the samples without fibers at 14 days due to the small amount of mixing water, while in the samples with fiber, the water was still passing through. The combination of the last statements could point to the idea that for the fiber samples, the hydration process was ongoing The TGA and dTGA curves (Figure 5) clearly show the peaks corresponding to the three phases of the cement hydration process at different ages with the formation of ettringite, monosulphate, and C(A)SH gels in the first phase, portlandite in the second, and calcite in the third [56]. As can be seen, after 7 days, the process of decomposition of ettringite and the appearance of monosulphate began, both in the samples with and without fibers, which became evident at 14 days with a peak at 130 °C. Ettringite was the first hydrate to form due to the high sulfate/aluminate ratio of the cement. As already mentioned in the composition of the cement, a sulphate resistant cement with a low percentage of aluminum was used so that monocarboaluminate and hemicarboaluminate did not appear in the curves. Ettringite became unstable when the amount of aluminate increased again upon dissolution, and reacted with tricalcium aluminate to form monosulphate [56,57]. When carbonation occurs, the aluminate phases AFm and ettringite decompose to form gypsum, calcium carbonate, and alumina gel [58]. At 28 days, it could be observed that in the samples with fibers, the monosulphate peak was higher than that of ettringite, while in the samples without fibers, they were at the same level. This behavior is in agreement with the existing literature [59], since a strong delaying effect in cement hydration was detected at a peak of 145 °C, which was attributed to the formation of gypsum (monosulphate) when yellow dextrin, one oligosaccharide of similar composition to the fibers, was added.
An anomaly was observed in the total weight loss and in the degree of hydration of the mortar without fibers at 7 days, as the result was lower than that obtained at 3 days (Table 3). This anomaly in the sample without fibers at 7 days was clearly observed in the dTGA curve (Figure 5a), where only the peaks corresponding to ettringite, portlandite, and calcite appeared, while the rest of the curves showed a multiplicity peak, especially between the formation process of portlandite and calcite and during the formation of calcite. This behavior can be attributed to the higher compactness of the 7 day mortar sample.
The weight losses observed between 540 and 760 °C could be attributed to the carbon present in the samples. This carbon produced greater weight losses in the samples with fibers since the carbon appeared in greater proportion. This proportion of carbon corresponded to the remaining carbon from the hemp fibers that was not completely eliminated during the first decomposition of the hemp fibers at a temperature of approximately 330 to 400 °C [44]. It was observed that the most important peak appeared in the samples with fibers at 28 days and at a temperature of 670 °C. The rest of the peaks were less representative, and this was also the case for the samples without fibers. The amount of silicon in the sample could increase the decomposition temperature (oxidation) of the carbon [60].
The broad undulation observed in the dTGA curve of the samples without fiber (Figure 5a) between about 560 °C and 770 °C was attributed to the CO2 release that occurred gradually between the dehydration of calcium hydroxide (portlandite) and the onset of the carbonation of calcium carbonate (calcite) through the action of silicon oxide. This reaction could produce calcium chondrite (around 775 °C) and a compound similar to belite (γ-C2S) called kilchoanite (around 685 °C) [61]. This undulation was also observed in the samples with fibers, but not as uniform due to the attenuating intervention of the chemical compounds of the hemp. The peaks of 885 and 870 °C in the samples without and with fibers, respectively (Figure 5a,b), were in correspondence with the decomposition of an anhydride carbo-silicate [61].
The endothermic peak that corresponded to a temperature of 600 °C produced an increase in weight as it was a metallic element, and could be attributed to the oxidation of Ti from the sand (Figure 2b). The existing literature fixes this peak at about 557 °C [62]. This peak only appeared in the sample with fibers at 7 days due to a concentration of Ti. As can be observed in the dTGA curves, this element did not appear in the rest of the samples.

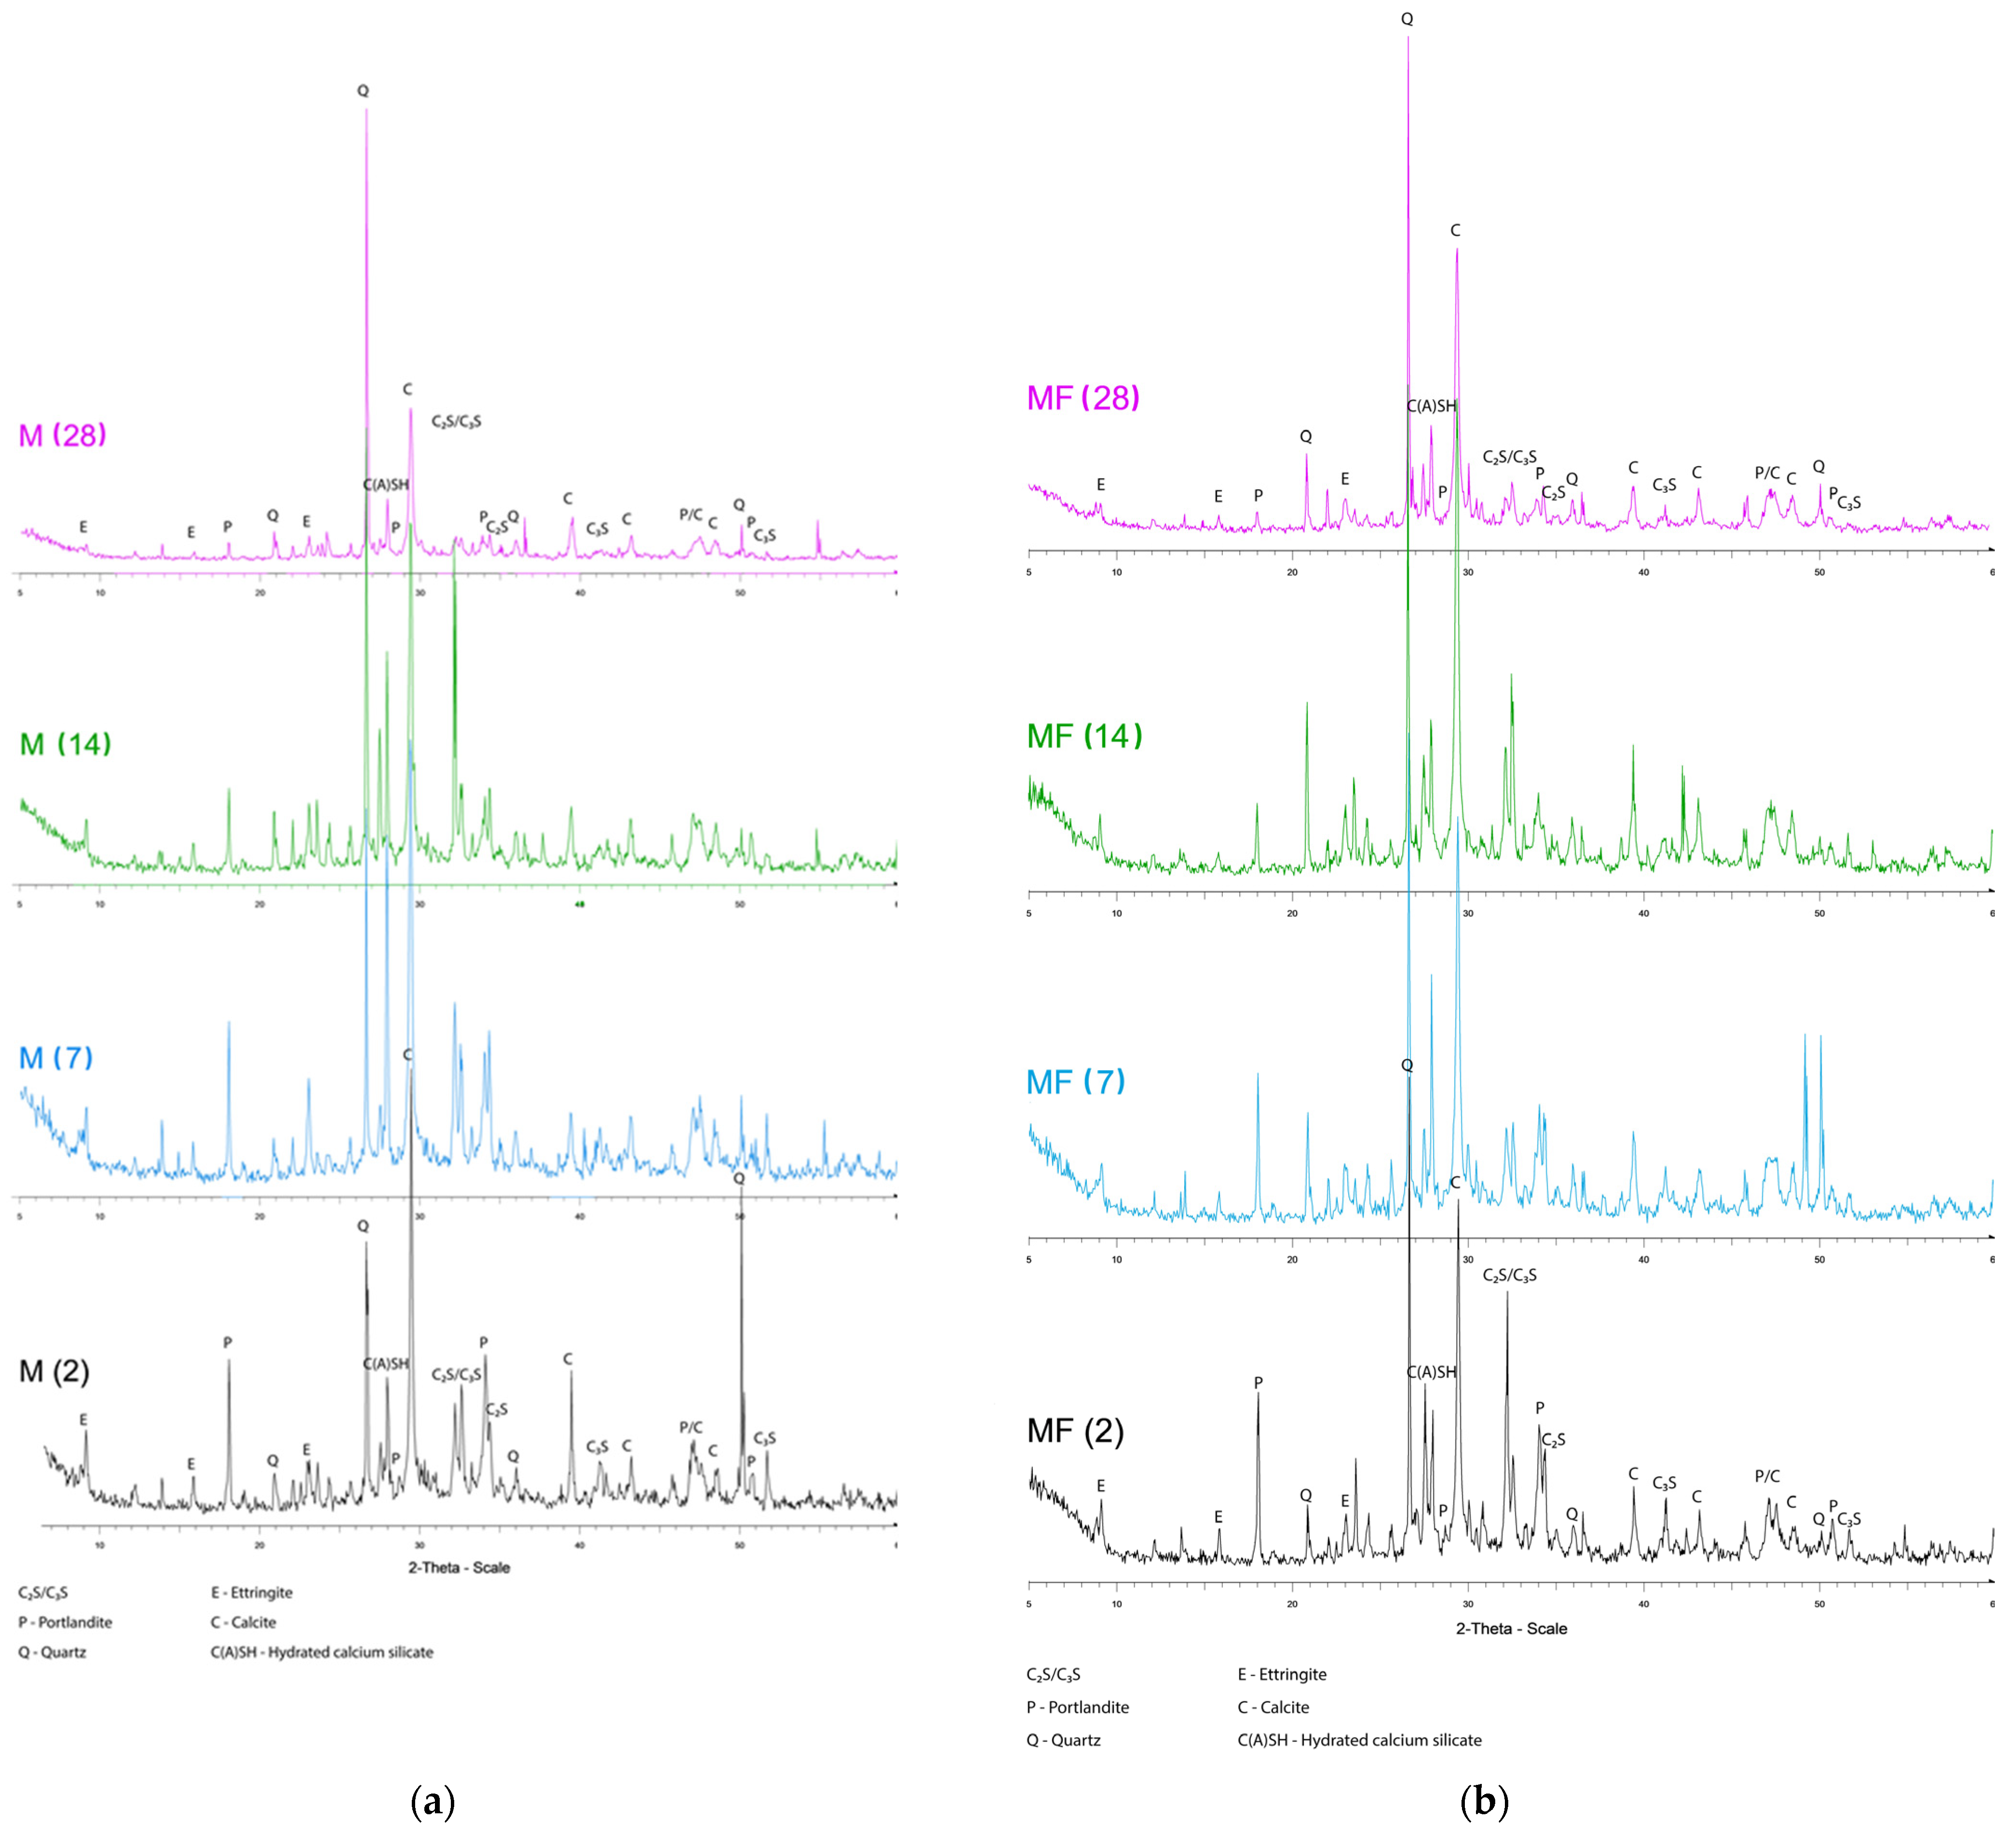
3.2. X-ray Diffraction (XRD)
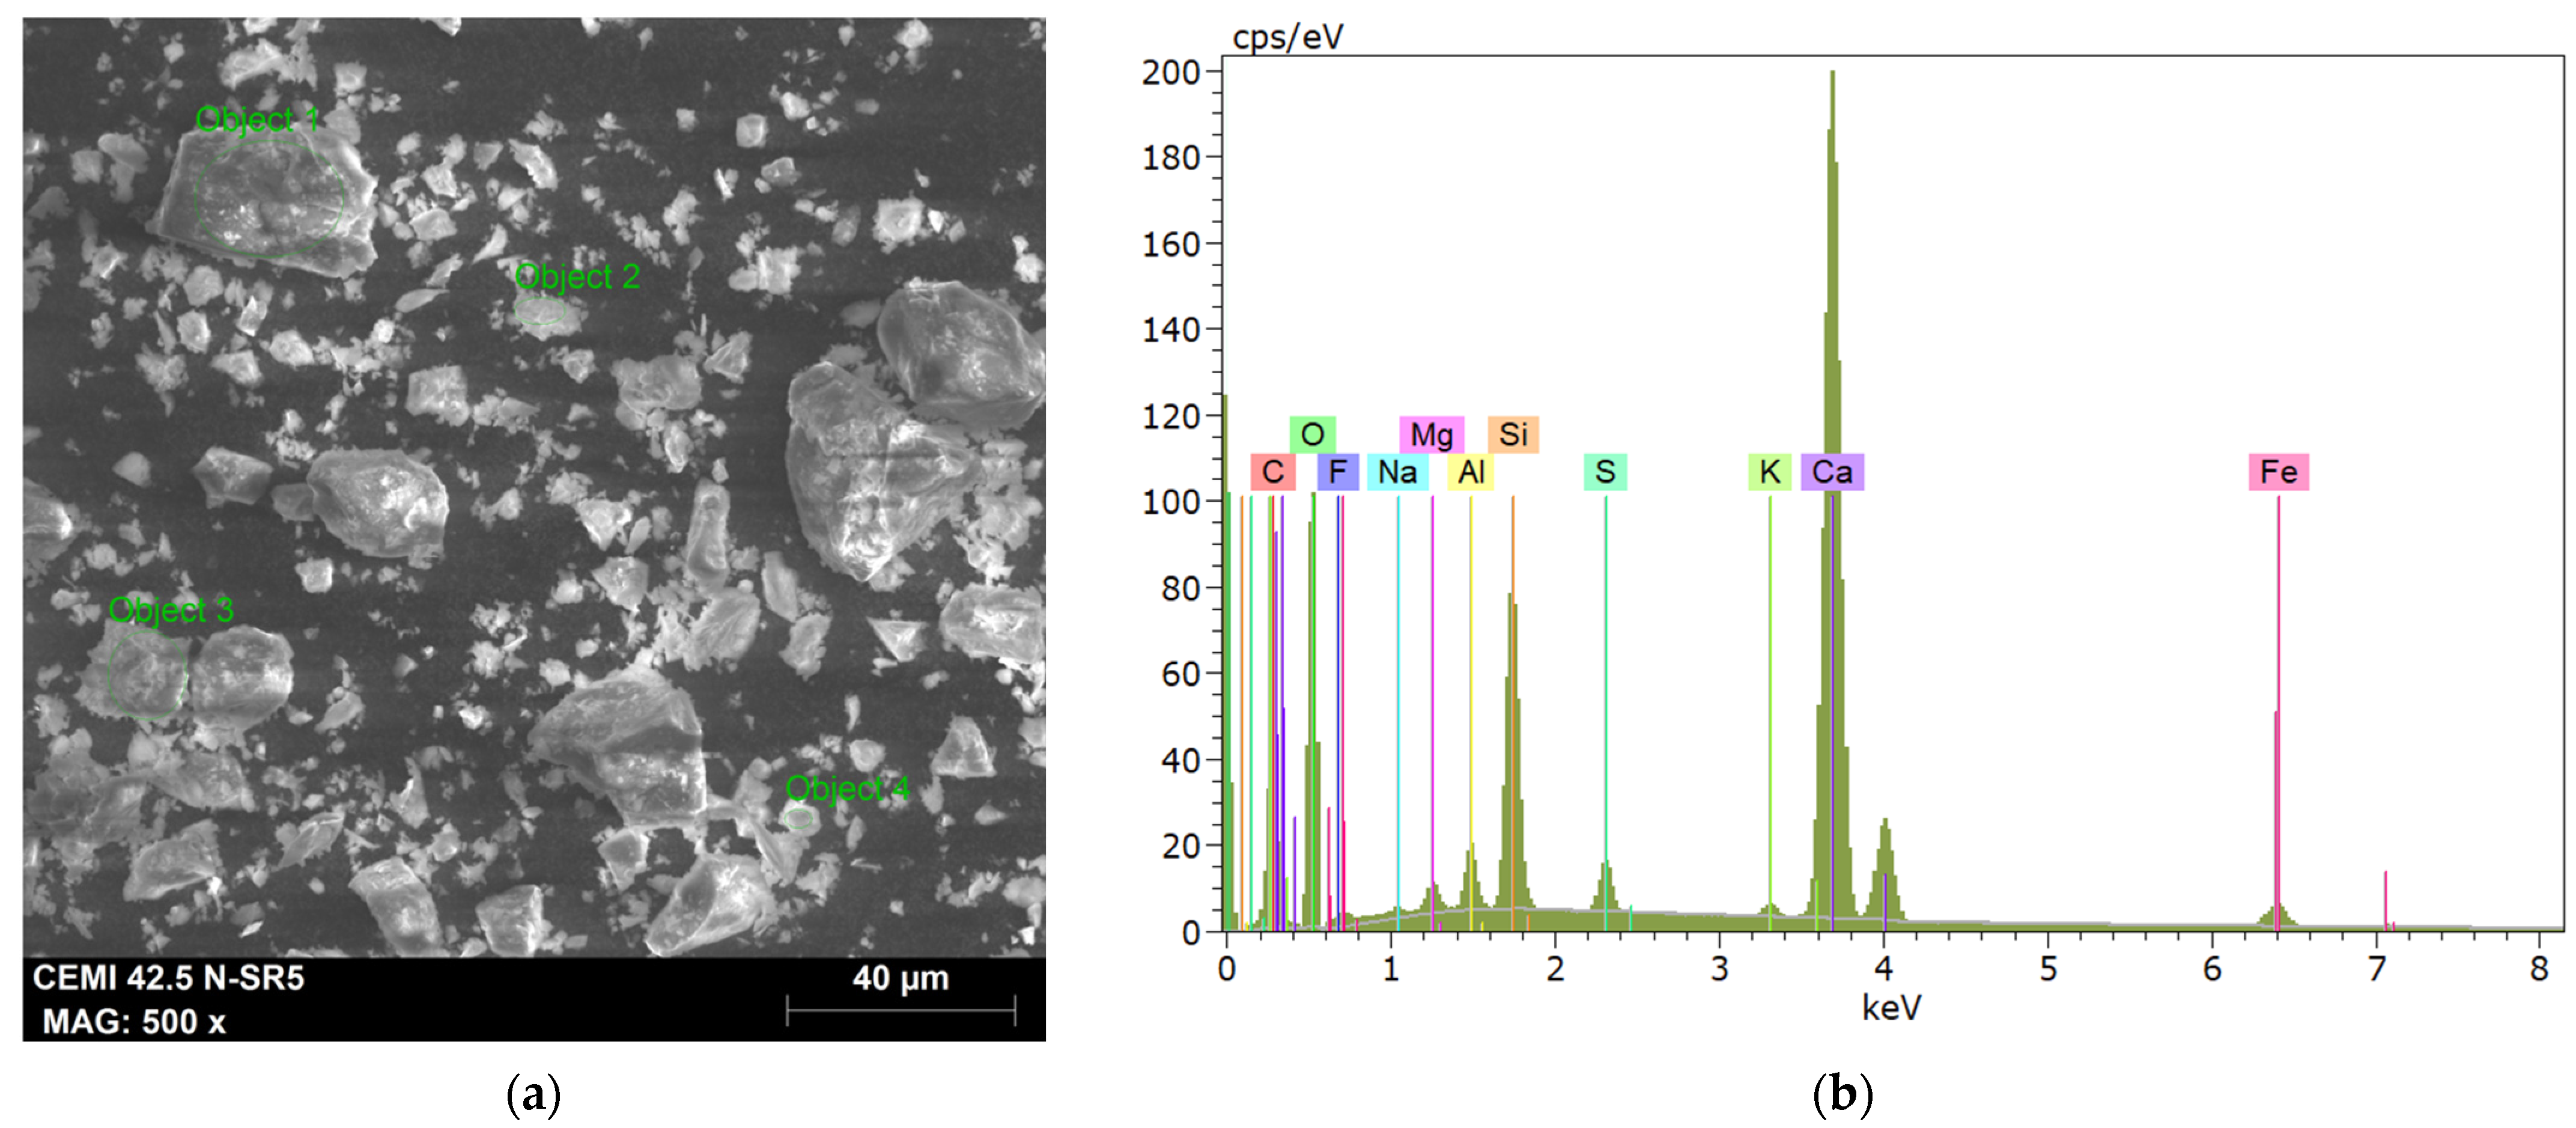
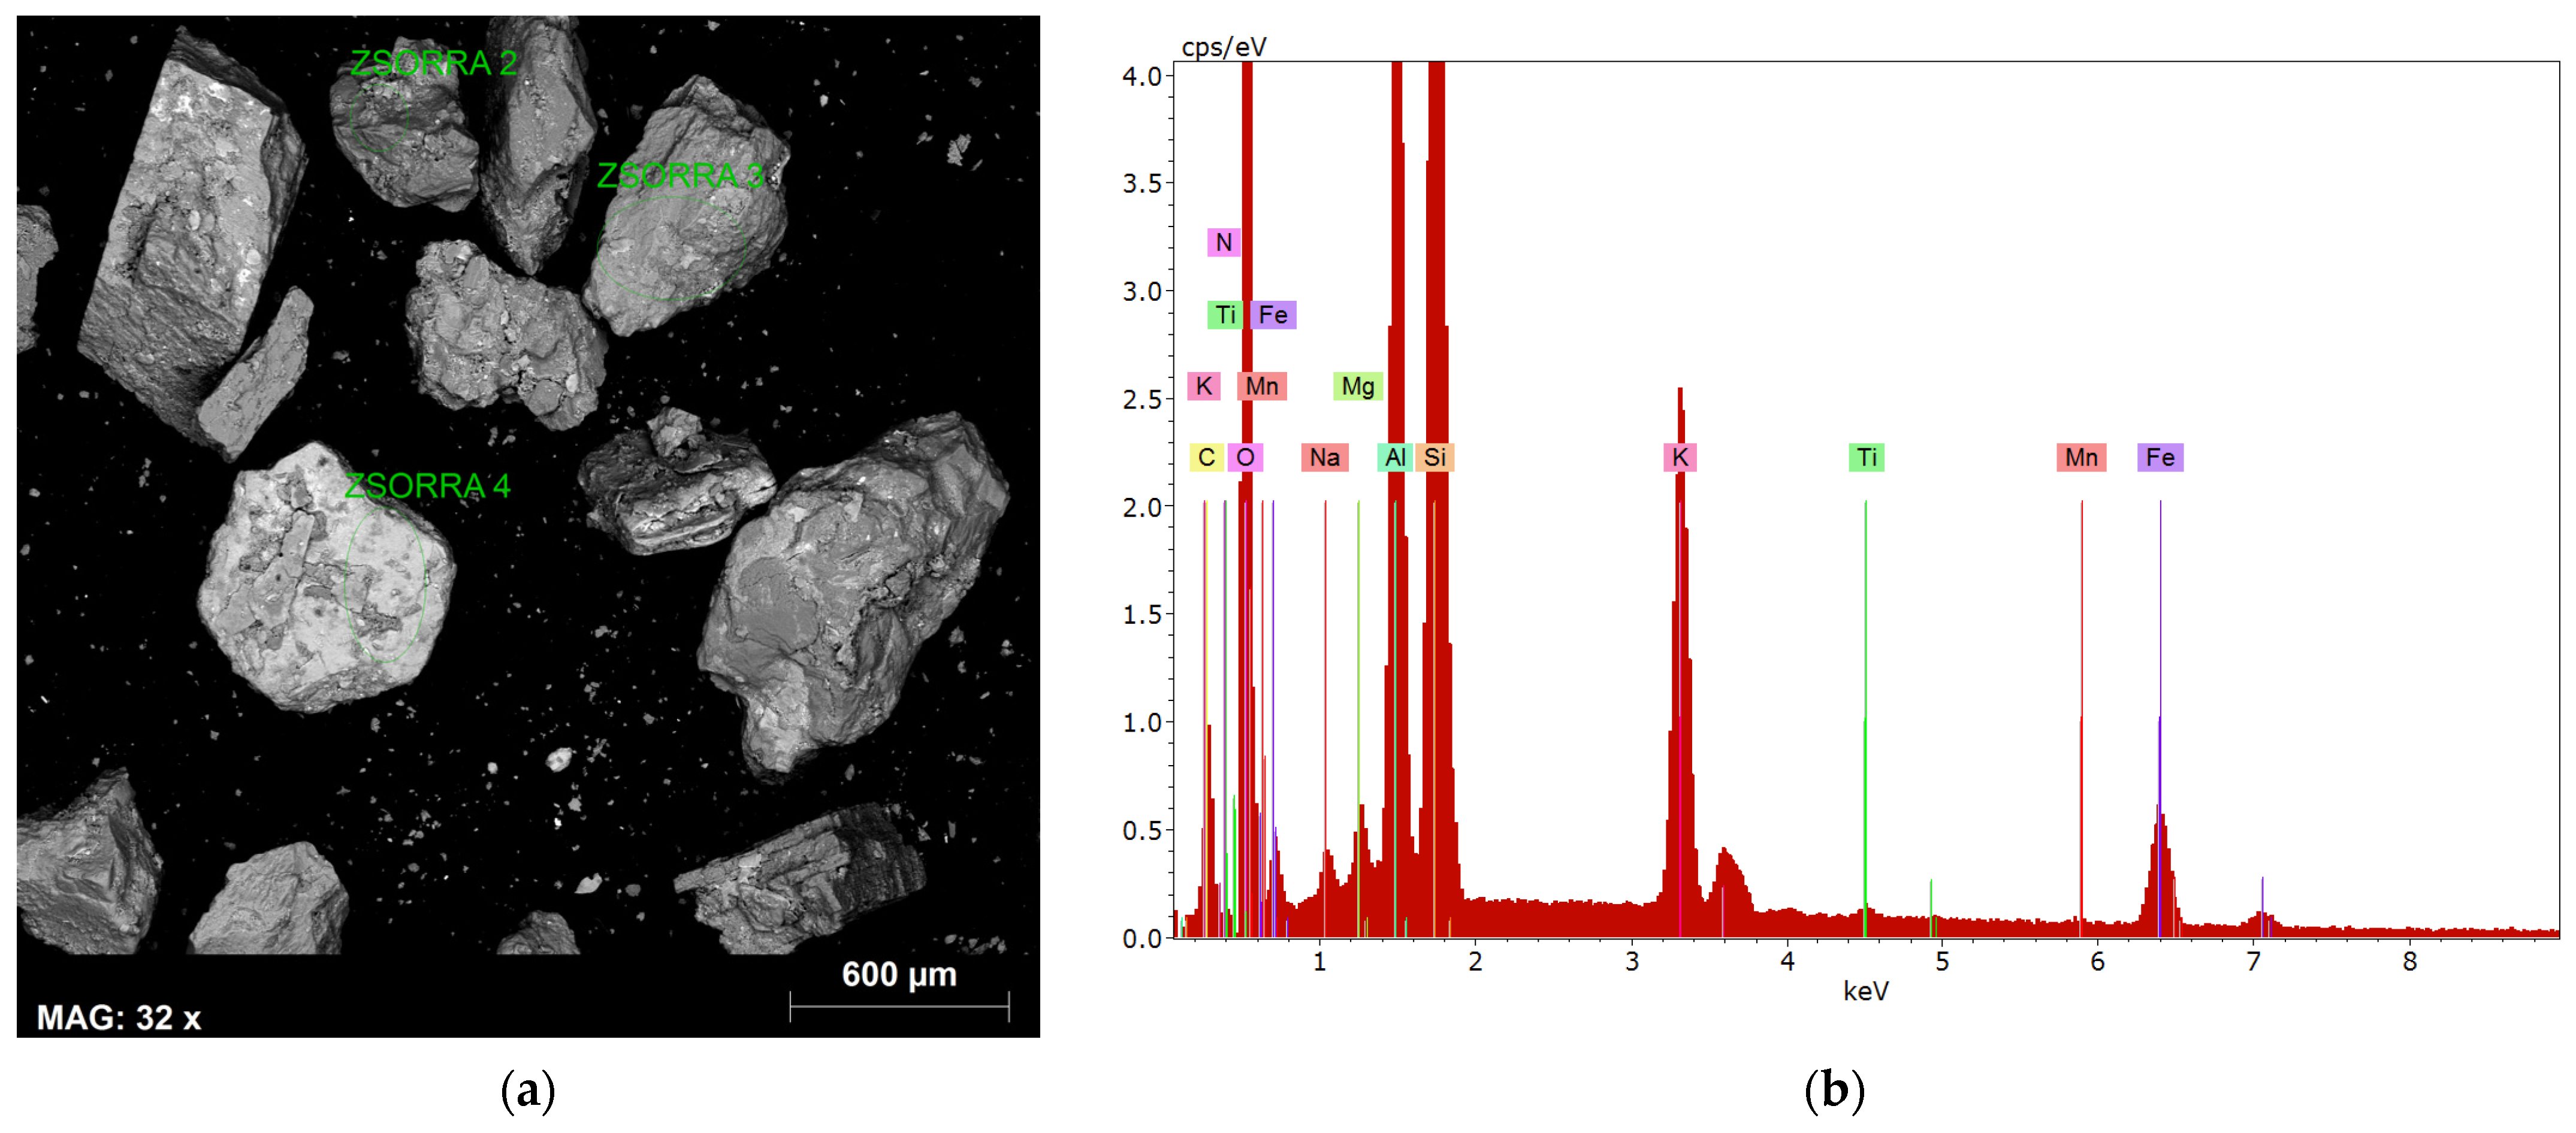
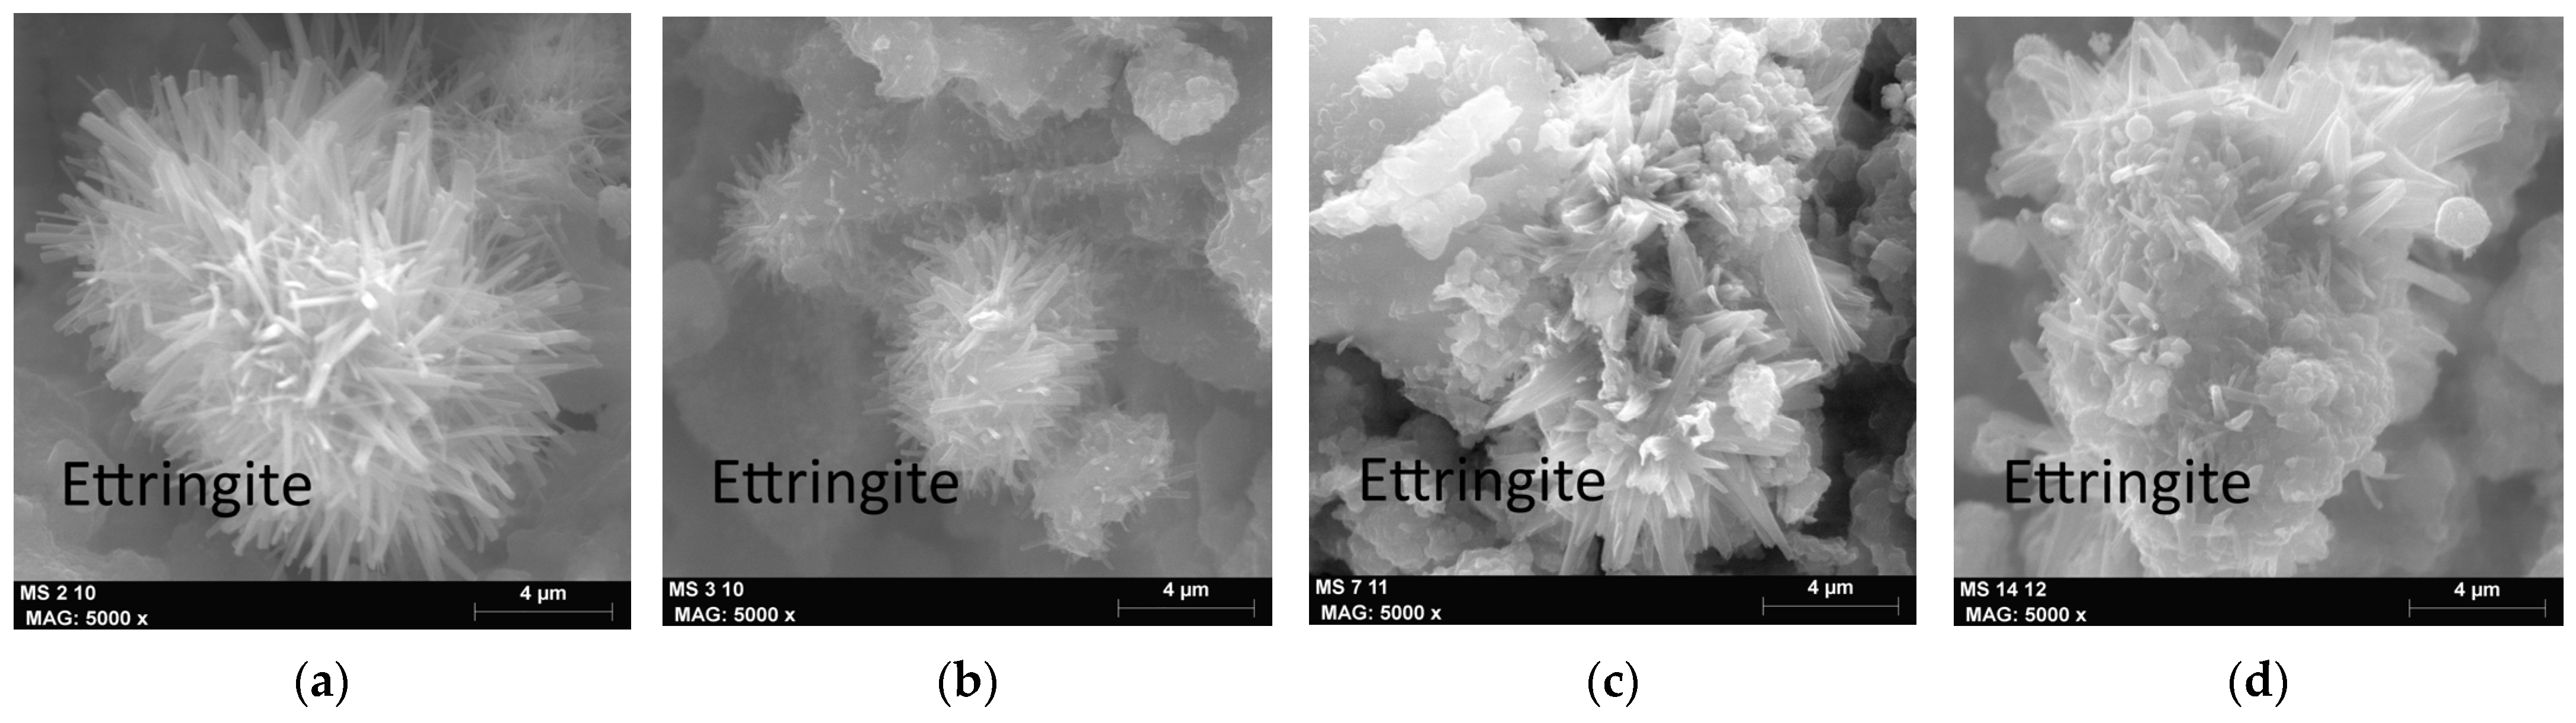
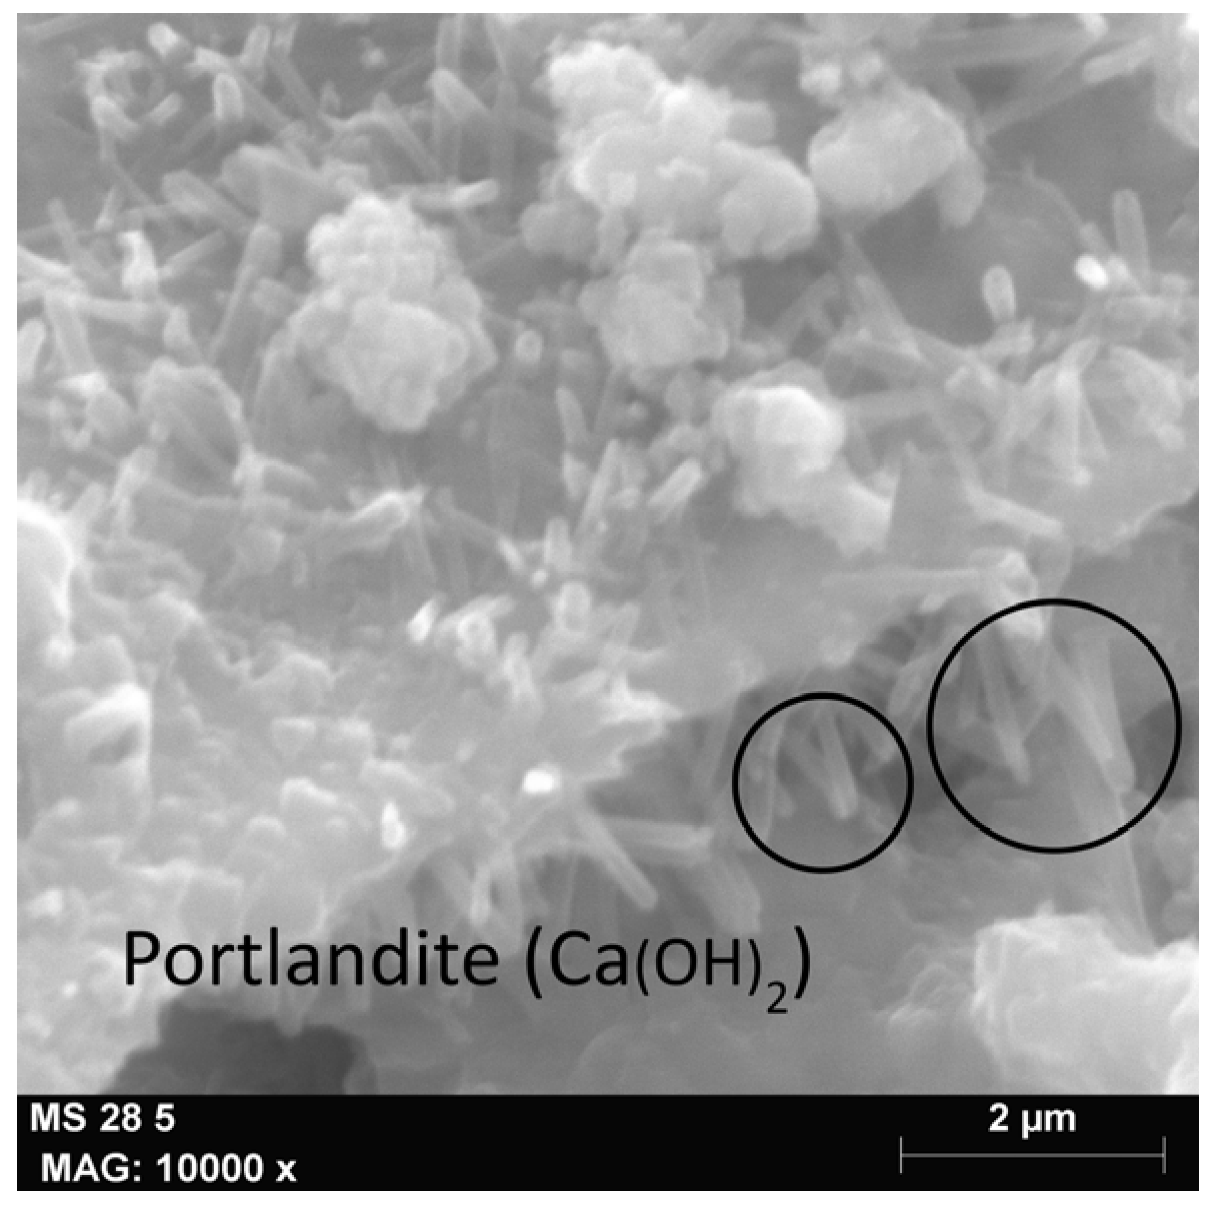
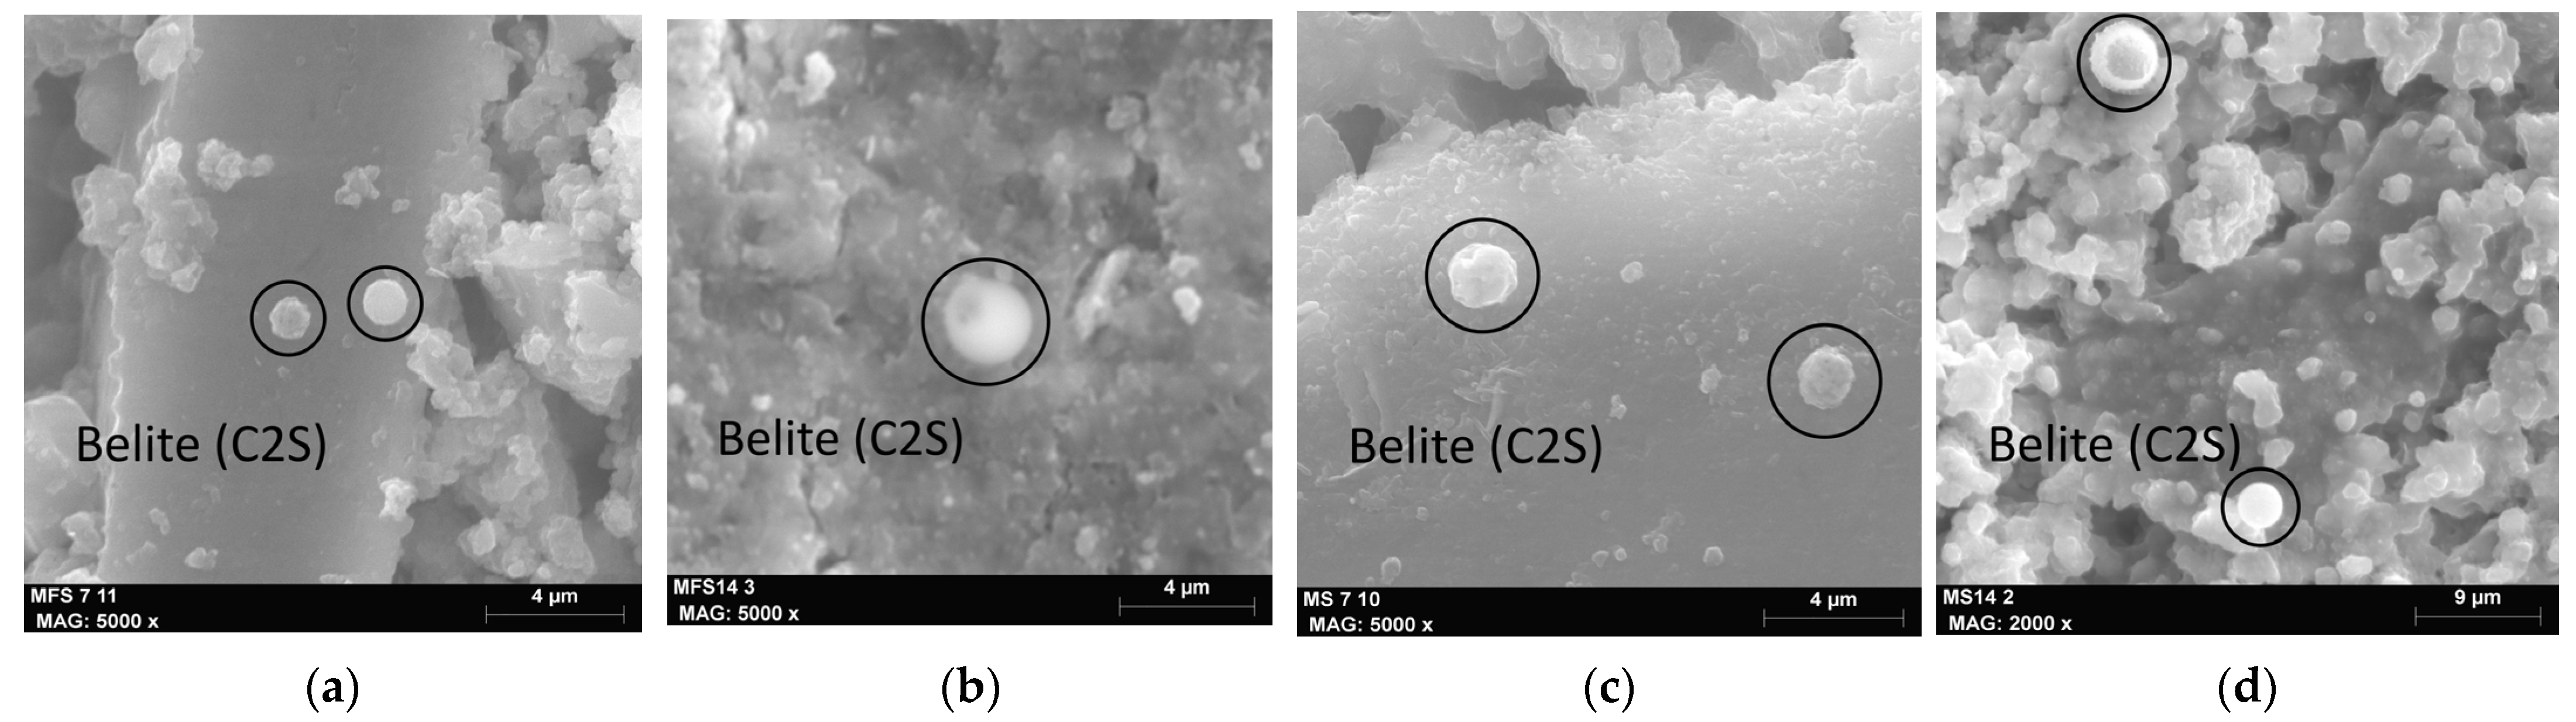
The XRD patterns of M and MF samples at 2, 3, 7, 14, and 28 days are shown in Figure 6. The main hydration products of Portland cement mortar were ettringite, monosulphate (Ms), portlandite, quartz, and some poorly crystallized C(A)SH. At the early ages, an important amount of ettringite appeared and reacted with C3A to form the stable monosulphate phase. The addition of natural fibers in the Portland cement mortar could accelerate the transformation of ettringite, but in this study, Ms could not be detected in the XRD patterns (10.2 2θ), as shown in Figure 6. As mentioned, when analyzing the TGA/dTGA curves, ettringite started to decrease slightly due to its transformation into monosulphate after 7 days and the important change occurred after 14 days. This decrease at later ages was related to the type of cement used, since the sulphate resistant cement had a low amount of aluminum oxide and delayed the formation of monosulphate [56,57].
The C2S and C3S detected at 32–33° 2θ in the XRD patterns gradually decreased with time, as can be shown in the loss of peak intensity [63]. The highest peak appeared at 14 days, both in the samples with and without fibers (Figure 6). This behavior demonstrates that Portland cement continued to hydrate and generate C(A)SH and portlandite (18.08 and 34.08° 2θ). Focusing on the content of non-hydrated C2S-C3S products, it can be observed, as shown in the TGA/dTGA curves, that there was a greater amount (higher peaks) in the samples without fibers, which indicated a higher degree of hydration in these samples. This pattern was very clear after 7 days, since at two days, the amount of non-hydrated products was similar, as observed through a thermogravimetric analysis. Especially for the samples with fibers, the peak intensity of portlandite decreased with age (Figure 6b) because the fibers retained water. Thus, the amount of portlandite was lower than in the samples without fibers at all ages (Figure 6).
As for the calcite formation, it can be observed in Figure 6 that it continued to grow up to 14 days in both types of samples. It can be observed that it appeared in a greater quantity in the samples without fibers until 14 days, where the tendency was reversed, and in the samples with fibers, the production of calcite increased as higher peaks appeared. The increase in calcite production in the samples with fibers could be attributed to the composition of fibers, in which the main components were carbon, oxygen, and calcium. This led to an increase in the formation of calcite (CO3Ca), contributing to an increase in carbon dioxide sequestration, reducing the environmental impact of the mortar with fibers compared to the one without fibers [64]. This increment in calcite production could indicate a higher degree of hydration in the mortar with fibers in this phase but as it had a reduced incidence on the degree of hydration (see Equation (1)), this did not manifest itself in the total loss of water, and had a slight effect on the final degree of hydration.
The high quartz content in all of the mortar samples, as shown in the diffractograms (Figure 6), is due to the use of a silica-rich sand.

3.3. SEM–EDX

The morphologies of the hydration products at different ages were evaluated using an SEM–EDX analysis. The apparition of ettringite was detected at the early ages since the cement used had a low percentage of C3A. This ettringite gradually disappeared over time to become monosulphate. Although this transformation did not appear clearly in the XRD, it could be perfectly observed in the thermogravimetric analysis (Figure 5) and was corroborated by the images obtained through SEM. Figure 7a–d shows the formation of ettringite at 2, 3, 7, and 14 days, respectively. In Figure 7c,d, the needle-shaped crystals of ettringite are considerably reduced and new crystalline forms appear, which could be attributed to the AFm phase by the reaction of the ettringite with the anhydrous aluminates due to the decrease in the concentration of sulfates in the solution.
Figure 8 presents the SEM images of the formation of another main component in mortar: portlandite. In order to visualize this element, it was necessary to take photographs at high magnification due to its crystalline structure, because the portlandite can crystalize in hexagonal or cubic form and is sometimes difficult to locate as it has a laminar structure. These portlandite crystals are so thin that they are only a few tenths of a micrometer wide, hence the difficulty in locating them using SEM. At this age, the portlandite presented a good crystalline development with perfectly delimited edges [65].
Figure 9 shows the hydration halo of the belite (C2S) at different ages, which indicated whether it was more or less hydrated. A reaction halo was observed that started on the external part of the C2S and moved inwards as its hydration state progressed. The difference in hydration observed across the halo for belite particles at the same age was attributed to the higher water avidity of some grains and selective hydration leading to the faster hydration of some of them [65].
The hydration halo could be observed in the formation of belite in the samples with and without fibers at the age of 7 days (Figure 9a,c), which indicated the principle of hydration of this compound. Moreover, after 14 days, the halo had practically disappeared (Figure 9b,d), suggesting that belite was completely hydrated in agreement with the existing literature [65]. As can be seen in Figure 9d, the hydration of belite varied from one particle to another in mortar of similar age. The upper particle was in process of hydration while the lower particle was fully hydrated. The difference in hydration observed across the halo for belite particles at the same age is attributable to the higher water avidity of some grains and selective hydration leading to the faster hydration of some of them.

4. Conclusions

This manuscript analyzed the hydration degree, hydration products, and microstructure of OPC mortar with and without untreated natural hemp fibers to explore the effect of fibers in mortar composite. The main findings are listed below:
The addition of untreated natural hemp fibers in OPC mortar increased the degree of hydration by about 9–9.5% at all ages of samples.
The fibers increased the formation of monosulphate but not ettringite. Ettringite transformed into monosulphate after 7 days and this did not depend on the presence of fibers in the OPC mortar.
In general, the presence of fibers implied a lower portlandite content generating C(A)SH in the samples, as could be observed in the XRD pattern. This point could be associated with water retention in the fibers.
Finally, the samples with fibers presented a higher level of calcite for every age. This point would confirm that the presence of fibers in the cement composites results in a higher amount of CO2, improving the sustainable footprint.
This study was focused to understand, from a qualitative analysis, the influence of the untreated natural fibers in the hydration process of the OPC mortar composites. Despite these results, the effect of untreated natural hemp fibers on the hydration degree and the evolution of the microstructure are still unclear. Further studies will be necessary for its understanding. In addition, other parameters, such as the influence of fiber treatments to improve durability, fiber type, and characteristics such as length, the optimization of the microstructure of fiber cement composite for strength and durability, among others, should be analyzed in future lines of research.

Author Contributions

Conceptualization, M.À.C. and J.L.; methodology, M.À.C.; software, F.J. and F.X.E.; validation, M.À.C. and F.J.; formal analysis, E.G., investigation, J.S.; resources, E.G. and J.S.; data curation, F.J., F.X.E. and M.À.C.; writing—original draft preparation, M.À.C.; writing—review and editing, J.L.; visualization, F.X.E.; supervision, M.À.C. and J.L. All authors have read and agreed to the published version of the manuscript.

Funding

This research received no external funding.

Data Availability Statement

The data presented in this study are available in the article.

Conflicts of Interest

The authors declare no conflict of interest.

References

  1. Riofrio, A.; Cornejo, M.; Baykara, H. Environmental performance of bamboo fibers and sugarcane bagasse reinforced metakaolin-based geopolymers. Case Stud. Constr. Mater. 2022, 17, e01150. [Google Scholar] [CrossRef]
  2. Claramunt, J.; Ardanuy, M.; García-Hortal, J.A.; Filho, R.D.T. The hornification of vegetable fibers to improve the durability of cement mortar composites. Cem. Concr. Compos. 2011, 33, 586–595. [Google Scholar] [CrossRef]
  3. Gioffré, M.; Navarra, G.; Cavalagli, N.; Lo Iacono, F.; Gusella, V.; Pepi, C. Effect of hemp bio composite strengthening on masonry barrel vaults damage. Constr. Build. Mater. 2023, 367, 130100. [Google Scholar] [CrossRef]
  4. Verma, S.K.; Dwivedi, V.K.; Dwivedi, S.P. Utilization of Reinforced Palm Fibers Used for Composite Materials—A Review. In Advances in Mechanical and Energy Technology; Springer: Singapore, 2023; pp. 187–196. [Google Scholar]
  5. Martinelli, F.R.B.; Ribeiro, F.R.C.; Marvila, M.T.; Monteiro, S.N.; Filho, F.D.C.G.; Azevedo, A.R.G.D. A Review of the Use of Coconut Fiber in Cement Composites. Polymers 2023, 15, 1309. [Google Scholar] [CrossRef] [PubMed]
  6. Guizzardi, G.Z.; da Silva Machado, M.; Michelon, W.; Vicente Filipak Vanin, D. On the mechanical behaviour of natural sisal fibre reinforced cement paste. Proc. Inst. Civ. Eng. Constr. Mater. 2022. [Google Scholar] [CrossRef]
  7. Azevedo, A.R.G.; Lima, T.E.S.; Reis, R.H.M.; Oliveira, M.S.; Candido, V.S.; Monteiro, S.N. Guaruman fiber: A promising reinforcement for cement-based mortars. Case Stud. Constr. Mater. 2022, 16, e01029. [Google Scholar] [CrossRef]
  8. Mydin, M.A.O.; Nawi, M.N.M.; Odeh, R.A.; Salameh, A.A. Potential of Biomass Frond Fiber on Mechanical Properties of Green Foamed Concrete. Sustainability 2022, 14, 7185. [Google Scholar] [CrossRef]
  9. Morán, J.I.; Alvarez, V.A.; Cyras, V.P.; Vázquez, A. Extraction of cellulose and preparation of nanocellulose from sisal fibers. Cellulose 2008, 15, 149–159. [Google Scholar] [CrossRef]
  10. Poletto, M.; Júnior, H.L.O.; Zattera, A.J. Thermal Decomposition of Natural Fibers: Kinetics and Degradation Mechanisms. In Reactions and Mechanisms in Thermal Analysis of Advanced Materials; 2015; pp. 515–545. Available online: https://onlinelibrary.wiley.com/doi/10.1002/9781119117711.ch21 (accessed on 1 January 2022).
  11. Popescu, M.-C.; Popescu, C.-M.; Lisa, G.; Sakata, Y. Evaluation of morphological and chemical aspects of different wood species by spectroscopy and thermal methods. J. Mol. Struct. 2011, 988, 65–72. [Google Scholar] [CrossRef]
  12. Slopiecka, K.; Bartocci, P.; Fantozzi, F. Thermogravimetric analysis and kinetic study of poplar wood pyrolysis. Appl. Energy 2012, 97, 491–497. [Google Scholar] [CrossRef]
  13. Pickering, K.L.; Efendy, M.G.A.; Le, T.M. A review of recent developments in natural fibre composites and their mechanical performance. Spec. Issue Biocompos. 2016, 83, 98–112. [Google Scholar] [CrossRef] [Green Version]
  14. Rong, M.Z.; Zhang, M.Q.; Liu, Y.; Yang, G.C.; Zeng, H.M. The effect of fiber treatment on the mechanical properties of unidirectional sisal-reinforced epoxy composites. Compos. Sci. Technol. 2001, 61, 1437–1447. [Google Scholar] [CrossRef]
  15. Wei, J.; Ma, S.; Thomas, D.G. Correlation between hydration of cement and durability of natural fiber-reinforced cement composites. Corros. Sci. 2016, 106, 1–15. [Google Scholar] [CrossRef]
  16. Bilba, K.; Arsene, M.-A. Silane treatment of bagasse fiber for reinforcement of cementitious composites. Compos. Part Appl. Sci. Manuf. 2008, 39, 1488–1495. [Google Scholar] [CrossRef]
  17. Cooke, A.M. Durability of Autoclaved Cellulose Fiber Cement Composites; Building Materials and Technology Pty Ltd.: Sydney, NSW, Australia, 2007. [Google Scholar]
  18. Pehanich, J.L.; Blankenhorn, P.R.; Silsbee, M.R. Wood fiber surface treatment level effects on selected mechanical properties of wood fiber–cement composites. Cem. Concr. Res. 2004, 34, 59–65. [Google Scholar] [CrossRef]
  19. Toledo Filho, R.D.; de Andrade Silva, F.; Fairbairn, E.M.R.; de Almeida Melo Filho, J. Durability of compression molded sisal fiber reinforced mortar laminates. Constr. Build. Mater. 2009, 23, 2409–2420. [Google Scholar] [CrossRef]
  20. de Andrade Silva, F.; Melo Filho, J.A.; Toledo Filho, R.D.; Fairbairn, E.M.R.; Hegger, J.; Brameshuber, W.; Will, N. Mechanical Behavior and Durability of Compression Moulded Sisal Fiber-Cement Mortar Laminates (SFCML). In Proceedings of the 1st International RILEM Conference on Textile Reinforced Concrete, Aachen, Germany, 6–7 September 2006; Rilem Publications S.A.R.L.: Paris, France; pp. 171–180. [Google Scholar]
  21. de Gutiérrez, R.M.; Díaz, L.N.; Delvasto, S. Effect of pozzolans on the performance of fiber-reinforced mortars. Nat. Fibre Reinf. Cem. Compos. 2005, 27, 593–598. [Google Scholar] [CrossRef]
  22. Mohr, B.J.; Biernacki, J.J.; Kurtis, K.E. Supplementary cementitious materials for mitigating degradation of kraft pulp fiber-cement composites. Cem. Concr. Res. 2007, 37, 1531–1543. [Google Scholar] [CrossRef]
  23. Agopyan, V.; Savastano, H.; John, V.M.; Cincotto, M.A. Developments on vegetable fibre–cement based materials in São Paulo, Brazil: An overview. Nat. Fibre Reinf. Cem. Compos. 2005, 27, 527–536. [Google Scholar] [CrossRef]
  24. Savastano, H.; Warden, P.G.; Coutts, R.S.P. Potential of alternative fibre cements as building materials for developing areas. Infrastruct. Dev. 2003, 25, 585–592. [Google Scholar] [CrossRef]
  25. Fu, T.; Montes, F.; Suraneni, P.; Youngblood, J.; Weiss, J. The Influence of Cellulose Nanocrystals on the Hydration and Flexural Strength of Portland Cement Pastes. Polymers 2017, 9, 424. [Google Scholar] [CrossRef] [PubMed]
  26. Reixach, R.; Claramunt, J.; Chamorro, M.A.; Llorens, J.; Pareta, M.M.; Tarrés, Q.; Mutjé, P.; Delgado-Aguilar, M. On the path to a new generation of cement-based composites through the use of lignocellulosic micro/nanofibers. Materials 2019, 12, 1584. [Google Scholar] [CrossRef] [PubMed] [Green Version]
  27. Hwang, C.-L.; Tran, V.-A.; Hong, J.-W.; Hsieh, Y.-C. Effects of short coconut fiber on the mechanical properties, plastic cracking behavior, and impact resistance of cementitious composites. Constr. Build. Mater. 2016, 127, 984–992. [Google Scholar] [CrossRef]
  28. Barbhuiya, S.; Bhusan Das, B. A comprehensive review on the use of hemp in concrete. Constr. Build. Mater. 2022, 341, 127857. [Google Scholar] [CrossRef]
  29. Sáez-Pérez, M.P.; Brümmer, M.; Durán-Suárez, J.A. A review of the factors affecting the properties and performance of hemp aggregate concretes. J. Build. Eng. 2020, 31, 101323. [Google Scholar] [CrossRef]
  30. Awwad, E.; Mabsout, M.; Hamad, B.; Farran, M.T.; Khatib, H. Studies on fiber-reinforced concrete using industrial hemp fibers. Constr. Build. Mater. 2012, 35, 710–717. [Google Scholar] [CrossRef]
  31. Pantawee, S.; Sinsiri, T.; Jaturapitakkul, C.; Chindaprasirt, P. Utilization of hemp concrete using hemp shiv as coarse aggregate with aluminium sulfate [Al2(SO4)3] and hydrated lime [Ca(OH)2] treatment. Constr. Build. Mater. 2017, 156, 435–442. [Google Scholar] [CrossRef]
  32. Alarcon-Ruiz, L.; Platret, G.; Massieu, E.; Ehrlacher, A. The use of thermal analysis in assessing the effect of temperature on a cement paste. Cem. Concr. Res. 2005, 35, 609–613. [Google Scholar] [CrossRef]
  33. Sha, W.; O’Neill, E.A.; Guo, Z. Differential scanning calorimetry study of ordinary Portland cement. Cem. Concr. Res. 1999, 29, 1487–1489. [Google Scholar] [CrossRef]
  34. Monteagudo, S.M.; Moragues, A.; Gálvez, J.C.; Casati, M.J.; Reyes, E. The degree of hydration assessment of blended cement pastes by differential thermal and thermogravimetric analysis. Morphological evolution of the solid phases. Thermochim. Acta 2014, 592, 37–51. [Google Scholar] [CrossRef]
  35. Bullard, J.W.; Jennings, H.M.; Livingston, R.A.; Nonat, A.; Scherer, G.W.; Schweitzer, J.S.; Scrivener, K.L.; Thomas, J.J. Mechanisms of cement hydration. Cem. Concr. Res. 2011, 41, 1208–1223. [Google Scholar] [CrossRef]
  36. Barakat, S. Foreword. In Handbook of Thermal Analysis of Construction Materials; Ramachandran, V.S., Paroli, R.M., Beaudoin, J.J., Delgado, A.H., Eds.; William Andrew Publishing: Norwich, NY, USA, 2002; pp. vii–viii. ISBN 978-0-8155-1487-9. [Google Scholar]
  37. Bhatty, J.I. Hydration versus strength in a portland cement developed from domestic mineral wastes—A comparative study. Thermochim. Acta 1986, 106, 93–103. [Google Scholar] [CrossRef]
  38. Loukili, A.; Khelidj, A.; Richard, P. Hydration kinetics, change of relative humidity, and autogenous shrinkage of ultra-high-strength concrete. Cem. Concr. Res. 1999, 29, 577–584. [Google Scholar] [CrossRef]
  39. Pane, I.; Hansen, W. Investigation of blended cement hydration by isothermal calorimetry and thermal analysis. Cem. Concr. Res. 2005, 35, 1155–1164. [Google Scholar] [CrossRef]
  40. Mounanga, P. Experimental Study of the Behavior of Cement Pastes at Very Young Age: Hydration, Shrinkage, Thermophysical Properties. Ph.D. Thesis, University of Nantes, Nantes, France, 2003. [Google Scholar]
  41. Kim, T.; Olek, J. Effects of Sample Preparation and Interpretation of Thermogravimetric Curves on Calcium Hydroxide in Hydrated Pastes and Mortars. Transp. Res. Rec. 2012, 2290, 10–18. [Google Scholar] [CrossRef]
  42. Wei, J.; Meyer, C. Improving degradation resistance of sisal fiber in concrete through fiber surface treatment. Appl. Surf. Sci. 2014, 289, 511–523. [Google Scholar] [CrossRef]
  43. Xie, X.; Gou, G.; Wei, X.; Zhou, Z.; Jiang, M.; Xu, X.; Wang, Z.; Hui, D. Influence of pretreatment of rice straw on hydration of straw fiber filled cement based composites. Constr. Build. Mater. 2016, 113, 449–455. [Google Scholar] [CrossRef]
  44. Delhomme, F.; Prud’homme, E.; Julliot, C.; Guillot, T.; Amziane, S.; Marceau, S. Effect of hemp on cement hydration: Experimental characterization of the interfacial transition zone. Results Chem. 2022, 4, 100440. [Google Scholar] [CrossRef]
  45. UNE-EN 196-1:2018; Methods of Testing Cement—Part 1: Determination of Strength. AENOR: Madrid, Spain, 2018.
  46. UNE 146901:2018; Aggregates. Designation. AENOR: Madrid, Spain, 2018.
  47. Ardanuy, M.; Claramunt, J.; Toledo Filho, R.D. Cellulosic fiber reinforced cement-based composites: A review of recent research. Constr. Build. Mater. 2015, 79, 115–128. [Google Scholar] [CrossRef] [Green Version]
  48. Amran, M.; Fediuk, R.; Abdelgader, H.S.; Murali, G.; Ozbakkaloglu, T.; Lee, Y.H.; Lee, Y.Y. Fiber-reinforced alkali-activated concrete: A review. J. Build. Eng. 2022, 45, 103638. [Google Scholar] [CrossRef]
  49. Sanjuán, M.; Cristina, A. La nueva norma europea de especificaciones de cementos comunes UNE-EN 197-1:2011. Mater. Constr. 2012, 62, 425–430. [Google Scholar] [CrossRef] [Green Version]
  50. UNE-EN 197-1:2011; Cement—Part 1: Composition, Specifications and Conformity Criteria for Common Cements. AENOR: Madrid, Spain, 2011.
  51. UNE-EN 1015-11:2020; Methods of Test for Mortar for Masonry—Part 11: Determination of Flexural and Compressive Strength of Hardened Mortar. AENOR: Madrid, Spain, 2020.
  52. ASTM E1131-20; Standard Test Method for Compositional Analysis by Thermogravimetry. ASTM: West Conshohocken, PA, USA, 2020.
  53. Kim, W.-K.; Hong, G.; Kim, Y.-H.; Kim, J.-M.; Kim, J.; Han, J.-G.; Lee, J.-Y. Mechanical Strength and Hydration Characteristics of Cement Mixture with Highly Concentrated Hydrogen Nanobubble Water. Materials 2021, 14, 2735. [Google Scholar] [CrossRef] [PubMed]
  54. Zhang, S.; Zhang, M. Hydration of cement and pore structure of concrete cured in tropical environment. Cem. Concr. Res. 2006, 36, 1947–1953. [Google Scholar] [CrossRef]
  55. Collet, F.; Pretot, S. Experimental investigation of moisture buffering capacity of sprayed hemp concrete. Constr. Build. Mater. 2012, 36, 58–65. [Google Scholar] [CrossRef]
  56. Zhao, Y.; Gao, J.; Xu, Z.; Li, S.; Luo, X.; Chen, G. Combined effect of slag and clay brick powder on the hydration of blended cement. Constr. Build. Mater. 2021, 299, 123996. [Google Scholar] [CrossRef]
  57. Davila, F.J.; John, V.M. Formación de etringita tardía en elementos de construcción. Rev. Colomb. Mater. 2014, 231–237. [Google Scholar] [CrossRef]
  58. Saillio, M.; Baroghel-Bouny, V.; Pradelle, S.; Bertin, M.; Vincent, J.; d’Espinose de Lacaillerie, J.-B. Effect of supplementary cementitious materials on carbonation of cement pastes. Cem. Concr. Res. 2021, 142, 106358. [Google Scholar] [CrossRef]
  59. Peschard, A.; Govin, A.; Grosseau, P.; Guilhot, B.; Guyonnet, R. Effect of polysaccharides on the hydration of cement paste at early ages. Cem. Concr. Res. 2004, 34, 2153–2158. [Google Scholar] [CrossRef] [Green Version]
  60. Cruz, L.; Herrera Penagos, S.; Gómez, L.; Alvarez, K.; Arcila, J. Efecto del SiC en el Comportamiento a Oxidación de un Material Compuesto Carbono-Carbono. Rev. Prospect. Univ. Autónoma Caribe 2011, 9, 7–13. [Google Scholar]
  61. Gauna, A. Relaciones entre lo carbonatación del cemento portland, el grado de cocción del clínker y algunos fenómenos expansivos en el ensayo de autoclave. Mater. Constr. 2013, 26, 89–100. [Google Scholar] [CrossRef] [Green Version]
  62. Pavlenko, V.I.; Gorodov, A.I.; Yastrebinsky, R.N.; Cherkashina, N.I.; Karnauhov, A.A. Increasing the Adherence of Metallic Copper to the Surface of Titanium Hydride. ChemEngineering 2021, 5, 72. [Google Scholar] [CrossRef]
  63. Chung, S.-Y.; Kim, J.-S.; Lehmann, C.; Stephan, D.; Han, T.-S.; Elrahman, M.A. Investigation of phase composition and microstructure of foamed cement paste with different supplementary cementing materials. Cem. Concr. Compos. 2020, 109, 103560. [Google Scholar] [CrossRef]
  64. Yadav, M.; Saini, A. Opportunities & challenges of hempcrete as a building material for construction: An overview. Int. Conf. Adv. Constr. Mater. Struct. 2022, 65, 2021–2028. [Google Scholar] [CrossRef]
  65. Giraldo, M.M.A.; Tobón, J.I. Evolución mineralógica del cemento portland durante el proceso de hidratación. DYNA 2006, 73, 69–82. [Google Scholar]
Figure 1. SEM–EDX of CEM I 42.5/N-SR5, x500: (a) SEM image with the 4 points in the cement composition that was analyzed; (b) EDS plot with the peaks of the detected chemical elements.
Sustainability 15 09388 g001
Figure 2. SEM–EDX of sand A/F-0/2-T-G-L, x32: (a) SEM image with the 3 points in the sand composition that was analyzed; (b) EDS plot with the peaks of the detected chemical elements.
Sustainability 15 09388 g002
Figure 3. SEM–EDX of the untreated hemp fibers, x32: (a) SEM image of the fiber composition that was analyzed; (b) EDX plot with the peaks of the detected chemical elements.
Sustainability 15 09388 g003
Figure 4. Difference in the weight loss (Wloss) between mortar samples with (MF) and without (M) natural fibers at different ages.
Sustainability 15 09388 g004
Figure 5. TGA/DTGA heating curves at 2, 3, 7, 14, and 28 days: (a) heating curves of mortar; (b) heating curves of mortar and fibers.
Sustainability 15 09388 g005aSustainability 15 09388 g005b
Figure 6. XRD patterns of (a) mortar without fibers; (b) mortar with fibers at 2, 7, 14, and 28 days.
Sustainability 15 09388 g006
Figure 7. SEM images of the formation of ettringite at (a) 2 days, ×5000; (b) 3 days, ×5000; (c) 7 days, ×5000; and (d) 14 days, ×5000.
Sustainability 15 09388 g007
Figure 8. SEM images of portlandite at 28 days, ×10,000 in a mortar without fibers.
Sustainability 15 09388 g008
Figure 9. SEM images of belite (C2S) at different ages in the samples with fibers: (a) 7 days, ×5000; (b) 14 days, ×5000; and samples without fibers: (c) 7 days, ×5000; (d) 14 days, ×2000.
Sustainability 15 09388 g009
Table 1. Ldh, Ldx, and Ldc range values from the literature.
AuthorsRange Values
LdhLdxLdc
Bhatty [37]105–440 °C440–580 °C580–1000 °C
Pane et al. [39]140–440 °C440–520 °C520–1100 °C
Monteagudo et al. [34]105–430 °C430–530 °C530–1100 °C
Table 2. Elemental chemical composition of Portland cement, sand, and fibers in the % of weight.
ElementAverage %
CementSandFiber
C4.0015.3465.99
O48.3447.7432.34
Mg0.661.73-
Al1.367.18-
Si5.4713.75-
Ca35.380.261.20
K0.833.750.47
Na0.260.20-
S0.45--
Fl0.80--
Cl-0.010.01
Fe2.468.69-
Ti-0.67-
Mn-0.10-
Ni-0.60-
Table 3. Relative values from the TGA test on mortar: weight losses, chemically bound water, and hydration degree (Bhatty’s method: Tref. 105 °C).
SpecimenCuring Time (Days)Weight Losses %Chemically Bound WaterHydration
Degree
LdhLdxLdcLtotal(WB) % ( α )   %
M228.02871.63335.240814.902811.810749.21
M338.37711.93065.079515.387212.390351.63
M778.52371.90354.692715.119912.351251.46
M14148.45002.02005.443215.913212.701752.92
M28288.02772.12185.429215.578712.375551.56
MF228.35051.59655.442815.389812.178550.74
MF339.03481.80115.205416.041312.970154.04
MF779.35612.00335.400316.759713.573556.56
MF14149.63062.09855.776417.505514.097458.74
MF28288.71871.93616.466317.121113.306055.44
Disclaimer/Publisher’s Note: The statements, opinions and data contained in all publications are solely those of the individual author(s) and contributor(s) and not of MDPI and/or the editor(s). MDPI and/or the editor(s) disclaim responsibility for any injury to people or property resulting from any ideas, methods, instructions or products referred to in the content.

