
A Framework for Mooring and Anchor Design in Sand Considering Seabed Trenches Based on Floater Hydrodynamics
by
 ,
,
Shengjie Rui
1,2,
Hang Xu
1,
Long Teng
1,
Chen Xi
1,
Xingye Sun
1,
Haojie Zhang
1 and
Kanmin Shen
3,* 1
Key Laboratory of Offshore Geotechnics and Material Engineering of Zhejiang Province, College of Civil Engineering and Architecture, Zhejiang University, Hangzhou 310058, China
2
Norwegian Geotechnical Institute, 0484 Oslo, Norway
3
PowerChina Huadong Engineering Corporation Limited, Hangzhou 311122, China
*
Author to whom correspondence should be addressed.
Sustainability 2023, 15(12), 9403; https://doi.org/10.3390/su15129403
Submission received: 21 May 2023
/
Revised: 8 June 2023
/
Accepted: 8 June 2023
/
Published: 12 June 2023
(This article belongs to the Special Issue Promoting Sustainable Marine Development: Geotechnical Engineering Problems and Environmental Guarantee Technology in Marine Space, Energy and Resource Development)
Abstract
:Seabed trenches reduce anchor capacity. However, the adverse influence is not considered in the current design, and no guideline is found in engineering practice. This paper presents a framework for mooring and anchor design in sand considering seabed trenches based on floater hydrodynamics. First, a hydrodynamic calculation of the studied floater coupled with the mooring system was conducted. Then, the potential trench profile was assessed using a mooring line–seabed dynamic model. Third, after assessing the suction anchor performance based on its installation and capacity, a refined anchor, caisson–plate gravity anchor (CPGA), was proposed, and the capacity mechanisms were analyzed. It was found that the tensions of mooring lines l1 and l2 resist maximum loads under a 45° load condition. Due to the sand’s high strength, a trench is difficult to form in this mooring type. The suction anchor is not suitable as an anchor for the carbonate sand, considering its installation and capacity. The analyses indicate that the increase in soil stress and soil mobilized range in front of the caisson promotes the capacity of CPGA. This paper provides a framework/example to design moorings and anchors considering potential trenches and provides a solution to the anchor design in carbonate sand.
1. Introduction
Offshore floating structures developed rapidly with marine oil & gas exploitations [1,2]. Recently, floating wind turbines have shown their significant potential in 60 m water depth, and they have been widely applied in Europe, Australia, and East Asia [3,4]. To position the floating structures, mooring systems are adopted, including mooring lines and anchors [5,6,7]. Mooring lines are the structures transferring the load from the floaters to the anchors [8,9,10,11,12]. The anchors are bottom structures to resist the load transferred by the mooring lines, and their bearing capacity is one main concern in the anchor design [13,14]. For the floating wind turbines, multiline anchors have been proposed to reduce the total costs of the mooring system [15].
Seabed trenches near the moor lines and pipelines have an ignorable influence on these structures [16]. In some semi-taut mooring systems, the upper floaters drive the mooring line to repeatedly penetrate the soil, which remolds and degrades the surficial seabed soil [17,18,19]. Then, the soil particles are eroded by the seabed flow/turbulence, which leads to seabed trenches near the mooring chain touchdown area, as shown in Figure 1 [20]. The first case reported in 2014 indicated that obvious trenches were formed in front of the anchor in soft clay [19]. Then, some trenches were found in the North Sea [21]. The latest report presented three-dimensional trench profiles [22].
2. Literature Review
The above reports presented that the seabed trenches existing near the chain touchdown area in front of the anchors led to a reduction in anchor capacity. Considering the trench influences, some finite element (FE) simulations were carried out [23,24,25,26,27,28]. Hernandez-Martinez [23] used an FE model to study the holding capacity considering a trench close to a suction anchor and found that the calculated capacity was reduced by 20–45% depending on the inclined loading angle. Arslan [24] utilized a 3D finite element method to estimate the suction anchor holding capacity and discussed the influence of the trench and loading conditions on failure modes. Alderlieste [25] recommended a downward movement of the padeye to account for possible trench formation, but it may lead to a larger trench after a long-term period. Feng [26] investigated the effect of the trench width on the anchor capacity and verified that the anchor capacity has an apparent reduction when the trench width reaches the anchor diameter. The above analyses were mainly based on finite element calculations and were not verified with model tests/field data.
Based on the centrifuge model tests, more verifications about the trench influence on the anchor capacity were carried out [29,30]. Sassi [29] verified the mobilization of the reverse-end bearing (passive suction) capacity in the trench cases. Wang [31] pointed out that seabed trenches not only affect the anchor capacity but also make the loading direction turn to be more horizontal. For sand seabed, Rui [30] conducted centrifuge model tests to investigate the trench influence on the anchor capacity and found that trenches change the failure mode and reduce the anchor bearing capacity. It is agreed that seabed trenches near the anchors reduce anchor capacity. However, the adverse influences are not well considered in anchor design, and no analysis procedure/example can be referenced for mooring and anchor design.
3. Objective and Novelty
This paper developed a framework for analysis procedure considering potential seabed trenches, which includes hydrodynamic calculation of the floater, seabed trenching evaluation, anchor selections, and capacity analyses. The maximum mooring line tension and platform displacement were analyzed. The seabed trench profile was evaluated using the proposed trench prediction method. A new-type anchor, a caisson–plate gravity anchor, was proposed to provide a solution to the anchor design in carbonate sand.
This paper mainly has two contributions to current mooring and anchor design. The first one is to propose an analysis framework to design moorings and anchors considering seabed trenches in sand. The second one is to propose a new anchor type, caisson–plate gravity anchor (CPGA), for anchors in carbonate sand, and reveal its capacity mobilization mechanism.
4. Methodology
The framework proposed in this paper mainly includes three procedures, as shown in Figure 2. The relationship between different procedures and methods is illustrated as follows:
- (1)
- Hydrodynamic calculation of the floater: Based on the AQWA (ANSYS, 2019), the hydrodynamic analyses of a floater coupled with its mooring system were conducted to obtain the frequency and time domain responses. The positioning performances of the mooring system were evaluated, and the cyclic displacement curves of the fairlead were obtained. The outputs, e.g., mooring line tension and fairlead displacement, are the inputs of the seabed trenching evaluation.
- (2)
- Seabed trenching evaluation: Considering the seabed properties, the dynamic calculation of a typical single mooring line was carried out based on COMSOL, and the possible trench profiles were evaluated based on the mooring line–seabed interaction model. The outputs, e.g., trench dimension and tension at anchor padeye, are the inputs of the anchor selection and capacity analyses.
- (3)
- Anchor selections and capacity analyses: The applicability of the suction anchor was first assessed based on its installation and capacity analysis. A refined anchor, the caisson–plate gravity anchor (CPGA), was proposed, and FE analyses based on ABAQUS were adopted to verify whether it meets the design requirements [32].
5. Model Descriptions and Results
5.1. Hydrodynamics of Floating Platform
5.1.1. Design Parameters and Numerical Models
- (1)
- Basic Design Requirements
A floating platform was installed near an island in the South China Sea. The water depth where the floating platform was positioned was about 40 m. According to the China classification society regulations, the floating platform and mooring system must meet the sea states with a 50-year return period, as shown in Table 1. The designed significant wave height Hs was 4 m and the maximum wind speed was 46.2 m/s. The NPD wind spectrum of average wind speed was adopted in the hydrodynamic calculation, and the JONSWAP spectrum was adopted as the wave spectrum. The spectral peak period Tp was determined by the ISSC recommended formula, and the intermediate value was taken respectively. The recommended formula was ≤ Tp ≤ , and the peak enhancement factor was γ = 2.0.
- (2)
- Floating platform
The floating platform was constituted and connected by two semi-submersible modules. The length and width of a single module were 30 m and 25 m, respectively. Each module’s height was 14.2 m, and the draft was 5.5 m. The interval between the two modules was 1 m, and the total length of the floating platform was 63 m. These two modules were hinged by the connecting structure. The total mass of the platform was 1827 t. Table 2 shows the main dimensions of the floating platform.
According to the API specification [33], the calculations of wind and flow force coefficients of floating structures were completed, and the relevant force coefficients were shown in Table 3.
- (3)
- Mooring system design
Based on the sea states and requirements, the mooring system was designed, including the fairlead position, the mooring line composition, and the layout of the mooring lines. Figure 3 presents the mooring system of the floating platform (top view). A 4 × 2 mooring configuration was adopted, and two parallel mooring lines were connected to the fairleads of the floating platform. The origin of the coordinate was the center of gravity of the floating platform. The x axis pointed from the bow module to the stern module, and the y axis pointed to the starboard side of the floating platform. The z axis pointed upwards. The angles between the mooring lines and the x axis were −135°, 135°, 45°, and −45°, respectively. The mooring radius was 170 m.
Table 4 illustrates the position of fairleads and fixed points of the mooring system. The fairlead was located at the column, which is 6 m from the platform baseline, i.e., 0.5 m higher than the water level. The distance between the two parallel mooring lines is 2.6 m. The parallel arrangement of mooring lines can make two lines connected on the same anchor, which can reduce the number of anchors and economic costs, as well as satisfy the accident limit state with one broken mooring line.
Each mooring line consists of four components, and their basic parameters are shown in Table 5. The upper part is a polyethylene cable with a length of 10 m. Following that, nylon cable with a 75 m length is adopted to reduce the line weight. The last part interacting with the seabed is the chain, including a 6 m transition part with a chain nominal diameter of 120 mm and an 88 m ground chain with a chain nominal diameter of 208 mm (nominal diameter, db, refers to the bar diameter where the chain is made).
The hydrodynamic calculation of the floating structures coupled with the mooring system was conducted based on the software AQWA (ANSYS, 2019R3), and the established model is shown in Figure 4.
5.1.2. Hydrodynamic Calculation Results
- (1)
- Frequency Domain Analysis Results
Considering the typical wave loads on the floating platform, three load directions (0°, 45°, and 90° to the x axis) were adopted to calculate the response amplitude operators (RAOs) under different wave periods, as shown in Figure 5. When the wave direction is 0°, the main motion response is surge and pitch. The surge RAO decreases with the increase in the wave frequency, and the response is significant in the low-frequency region. The pitch RAO has two peaks at wave frequencies of 0.46 rad/s and 0.87 rad/s, corresponding to 13.7 s and 7.2 s periods, respectively. When the wave direction is 90°, the sway and roll motions of the platform have a certain increase. The sway RAO gradually decreases with the increase in the wave frequency, and the roll RAO presents a bimodal state. When the wave direction is 45°, the floating platform is subjected to oblique force. As a result, the platform has a certain displacement/rotation in both the x and y directions, which is smaller than the displacement/rotation in a 0° or 90° wave direction. For the heave motion, the platform has similar motions in these three wave directions, though small differences appear when the wave frequency is between 0.5 and 2. In addition, the platform in a 45° wave has a larger yaw RAO compared with that in 0° and 90° waves.
- (2)
- Time domain analysis results
To evaluate the performance of the mooring system, the responses of the floating platform coupled with the mooring system were analyzed in the time domain. The designed sea conditions under the survival condition (shown in Table 2) were adopted as the input parameters. The NPD spectrum with an average wind speed of 46.2 m/s was adopted. The JONSWAP spectrum with a significant wave height of 4 m was utilized. The wave peak period Tp was 9.1 s, and the peak enhancement factor γ was 2.0.
Considering the sea state with a 50-year return period, the directions of wind, wave, and current were assumed to be the same. Three working conditions with different load directions of 0°, 45°, and 90° to the x axis were selected for analyses. The response of the floating platform coupled with the mooring system was analyzed to acquire the movement and mooring line tension in the time domain. The calculation time was 1 h.
For anchor design, it is important to acquire the maximum platform displacement and the mooring line tension under extreme sea states. The calculation results indicated that the platform movement and the mooring line tension in 45° are larger than those in 0° and 90°, which are the inputs in the trench evaluation and anchor design. Thus, the calculation results in 45° are mainly displayed and analyzed.
Figure 6 shows the time–history curve of platform movement when the load direction is 45°. Under this condition, the maximum sway, surge, and heave motions are 5 m, 3.55 m, and 3.11 m, respectively. The sway motion is larger than the surge and heave motions due to its larger loading area. In addition, because of the smaller flatform width, the smaller inertia moment along the x axis needs the maximum pitch of 14.92° to resist the maximum rotational torque. On the contrary, the maximum roll is only 2.43° due to the large inertia moment along the y axis. The maximum yaw angle of 9.46° indicates that the platform has an obvious rotation along the z axis.
Figure 7 shows the time–history curves of the mooring line tension at the fairlead when the load direction is 45°. Under a 45° load direction, mooring lines l1 and l2 are the main mooring lines to resist the loads since the mooring line directions are parallel to the load direction. It is found that the tensions change synchronously, and the difference between the maximum tensions of the two lines is small. This is because the parallel lines are very close and have similar restoring forces acting on the platform. The maximum tensions of l1 and l2 are 2178 kN and 2000 kN, respectively. The difference between the maximum line tensions comes from the counterclockwise rotation of the platform at this moment (see yaw in Figure 6).
Figure 8 presents the time–history curves of chain tension at the seabed fixed point when the load direction is 45°. The maximum tensions of mooring lines l1 and l2 are 1472 kN and 1503 kN, respectively. The tensions at the seabed fixed point are smaller than that at the fairlead because the heavy mooring line also contributes to part of the restoring force of the mooring line. However, the tensions at these two points have a similar variation trend. The results under the extreme sea states can be adopted as the inputs in the anchor design.
Table 6 summarizes the maximum values of the motion components and mooring line tensions under different load directions. The resultant displacement refers to the combination of the maximum surge, sway, and heave. Under a 90° load direction, the maximum resultant displacement reached 7.43 m, which was adopted in the trench profile evaluation. The maximum load appears when the load direction is 45°, which was utilized as the input value to design the anchor.
5.2. Evaluation of Seabed Trench Profile
5.2.1. Calculation Method
To acquire larger anchor capacity, anchors are usually embedded in the seabed; thus, part of the anchor chain is below the mudline. For the suction anchor, the anchor padeye is located at about 2/3 of the embedded depth. Thus, the interaction between the chain and the seabed must be considered to determine the load magnitude and direction at the padeye. This section established a numerical model to evaluate the configurations of the mooring line. Then, the possible trench profiles were evaluated based on the method proposed by [31].
Table 7 lists the main parameters for trench profile assessment. According to the hydrodynamic calculation results (Table 6), the maximum platform motion at 90° is 7.43 m, which was adopted as the displacement amplitude in the numerical model. The typical drift period Tf was taken as 100 s and the mooring radius R was 170 m. The fairlead movement adopted a sine shape, and each mooring line had a total length of 179 m. The anchor padeye was set to be 6 m below the mudline, corresponding to a suction anchor with 9 m in length. The seabed soil was relatively uniform carbonate sand; thus, the variability and reliability of the parameters were not considered in this paper. The sand properties were determined based on the triaxial shear test and interface shear test [34]. The sand had a mean saturated unit weight of 18 kN/m3. The mean sand critical friction angle was 36.2°, and the interface friction angle between the sand and steel surface was 26° [35,36].
5.2.2. Calculation Results
Figure 9a shows the calculated mooring line configurations in the fifth cycle. Under the catenary mooring, there is always a ground chain lying on the seabed. Due to the sand’s high strength, it is difficult for the mooring line to cut into the soil. Since the embedded chain does not cut into the seabed repeatedly, the trenches are difficult to form based on the assumption in [31]. Therefore, the lying chain moves up and down near the mudline. The embedded chain near the padeye always remains in the vertical direction. Figure 9b presents the time–history curve of the tension at the padeye. The inclined loading angle to the horizontal at the padeye maintains 90°. Under this condition, the suction anchor is subjected to pure vertical force.
5.3. Anchor Design and Capacity Analyses
5.3.1. Suction Anchor Evaluation
In this case, two parallel mooring lines are connected to the same anchor at different padeyes, e.g., l1 and l2, to reduce the total costs. The resultant force passes through the central axis of the anchor. Hydrodynamic calculations indicate that the maximum tension of the mooring line at the seabed fixed point is 1503 kN, and the resultant load on the same anchor is 3006 kN. According to [32], the safety factor of the suction pile and gravity anchor is 1.6 under the horizontal load in the permanent mooring. Considering the safety factor of 1.6, the design capacity of the anchor is 4810 kN.
At present, embedded anchors mainly include suction anchors, drag anchors, dynamically installed anchors (DIAs), and other anchor types [37]. Among these anchors, suction anchors are also widely adopted in sand and are easier to install in medium-dense sand by suction. Therefore, suction anchors were first assessed in this case.
Because the catenary mooring system was adopted in this case, a trench was difficult to form as shown in Section 5.2.2. Liu [38,39] proposed an analytical method to calculate the bearing capacity based on the translation movement mode of the suction anchor. The length and diameter of the suction anchor were 9 m and 3 m, respectively. The embedded depth of the padeye was located 6 m below the mudline (2/3 of the embedded depth) [40].
Figure 10 shows the relationship between the calculated anchor capacity and the inclined loading angle. For the fully translational movement mode, the capacity of the suction anchor can reach 27,500 kN. With the increase in inclined loading angle, the anchor capacity decreases rapidly. Therefore, if the design load of 4810 kN is reached, the inclined tension angle at the padeye to the horizontal should not exceed 50°.
The results in Section 5.2.2 indicated that the inclined loading angle that is transferred from the chain to the anchor padeye is 90°. Under this condition, the capacity of the suction anchor is 1570 kN, which accounts for only 5.6% of the maximum horizontal capacity. This value is far lower than the design load of 4810 kN, which cannot meet the design requirements. The suction anchor will always be in the vertical loading state. The bearing capacity mainly depends on the internal and external interface frictions and anchor weight, so its bearing capacity is significantly reduced. In addition, due to the high permeability of carbonate sand, it is difficult for suction anchors to penetrate the sand with the assistance of passive suction [41,42,43]. Therefore, a suction anchor is not suitable as an anchor in carbonate sand considering installation and bearing capacity.
5.3.2. Caisson–Plate Gravity Anchor
Gravity anchors mainly mobilize their resistances from the interface friction between the foundation and the seabed. Since the interface friction coefficient is generally less than 1, gravity anchors are designed in large dimensions, adding costs to transportation and installation. The design capacity is 4810 kN. If the gravity anchor is adopted and the interface friction coefficient is about 0.48, the gravity anchor mass reaches 1000 t.
Gravity anchors with skirts embedded in the seabed are often adopted in shallow water to increase the anchor capacity. In this paper, a new configuration, a caisson–plate gravity anchor (CPGA), is adopted. Figure 11 presents the configuration of CPGA, including the caisson diameter (d), the caisson embedded depth (h), the cover plate diameter (D), and the vertical pressure of the cover plate (Vp). The caisson–plate gravity anchor is designed according to the soil condition and design requirements.
- (1)
- Preliminary size design
According to engineering conditions, the preliminary design of a caisson–plate gravity anchor in a sand seabed was conducted. Its bearing capacity is closely related to its dimensions. Based on the seabed soil parameters, the preliminary sizes of the caisson–plate gravity anchor after some trial calculations were determined, as shown in Table 8. The caisson embedded depth is 3.7 m, and the cover plate diameter is 11.1 m. The outer caisson diameter is 3.7 m, and the wall thickness is 44 mm, according to [32]. The vertical pressure of the cover plate is 16 kPa, and the total anchor weight is 164 t. In this case, the ratio of calculated capacity to weight is 2.92. Compared with the weight of a gravity anchor (1000 t), the weight of the caisson–plate gravity anchor is reduced by 83.6%, and the ratio of capacity to weight increases by more than five times.
- (2)
- Finite element verification
According to the preliminarily designed dimensions, a finite element model was established based on ABAQUS to calculate the anchor capacity, and the sand hypoplastic constitutive model was used [44,45]. The model parameters were based on the results of triaxial shear tests and interface shear tests [30,46,47]. The padeye was set at the mudline. The calculated load–displacement curve is shown in Figure 12.
The bearing capacity calculated by the FE simulation is 5700 kN, and the required anchor capacity in this paper is 4810 kN. The calculated capacity is about 18.5% higher than the designed capacity. The FE results indicate that the preliminary design results are reliable. At the same time, it is found that when the anchor capacity reaches the design capacity of 4810 kN, the anchor displacement is 0.21 m, which is about 5.7% of the caisson diameter. For the suction anchor design, the anchor capacity refers to the load when the displacement reaches 10% of the anchor diameter. According to this criterion, the anchor capacity of CPGA meets the design requirements.
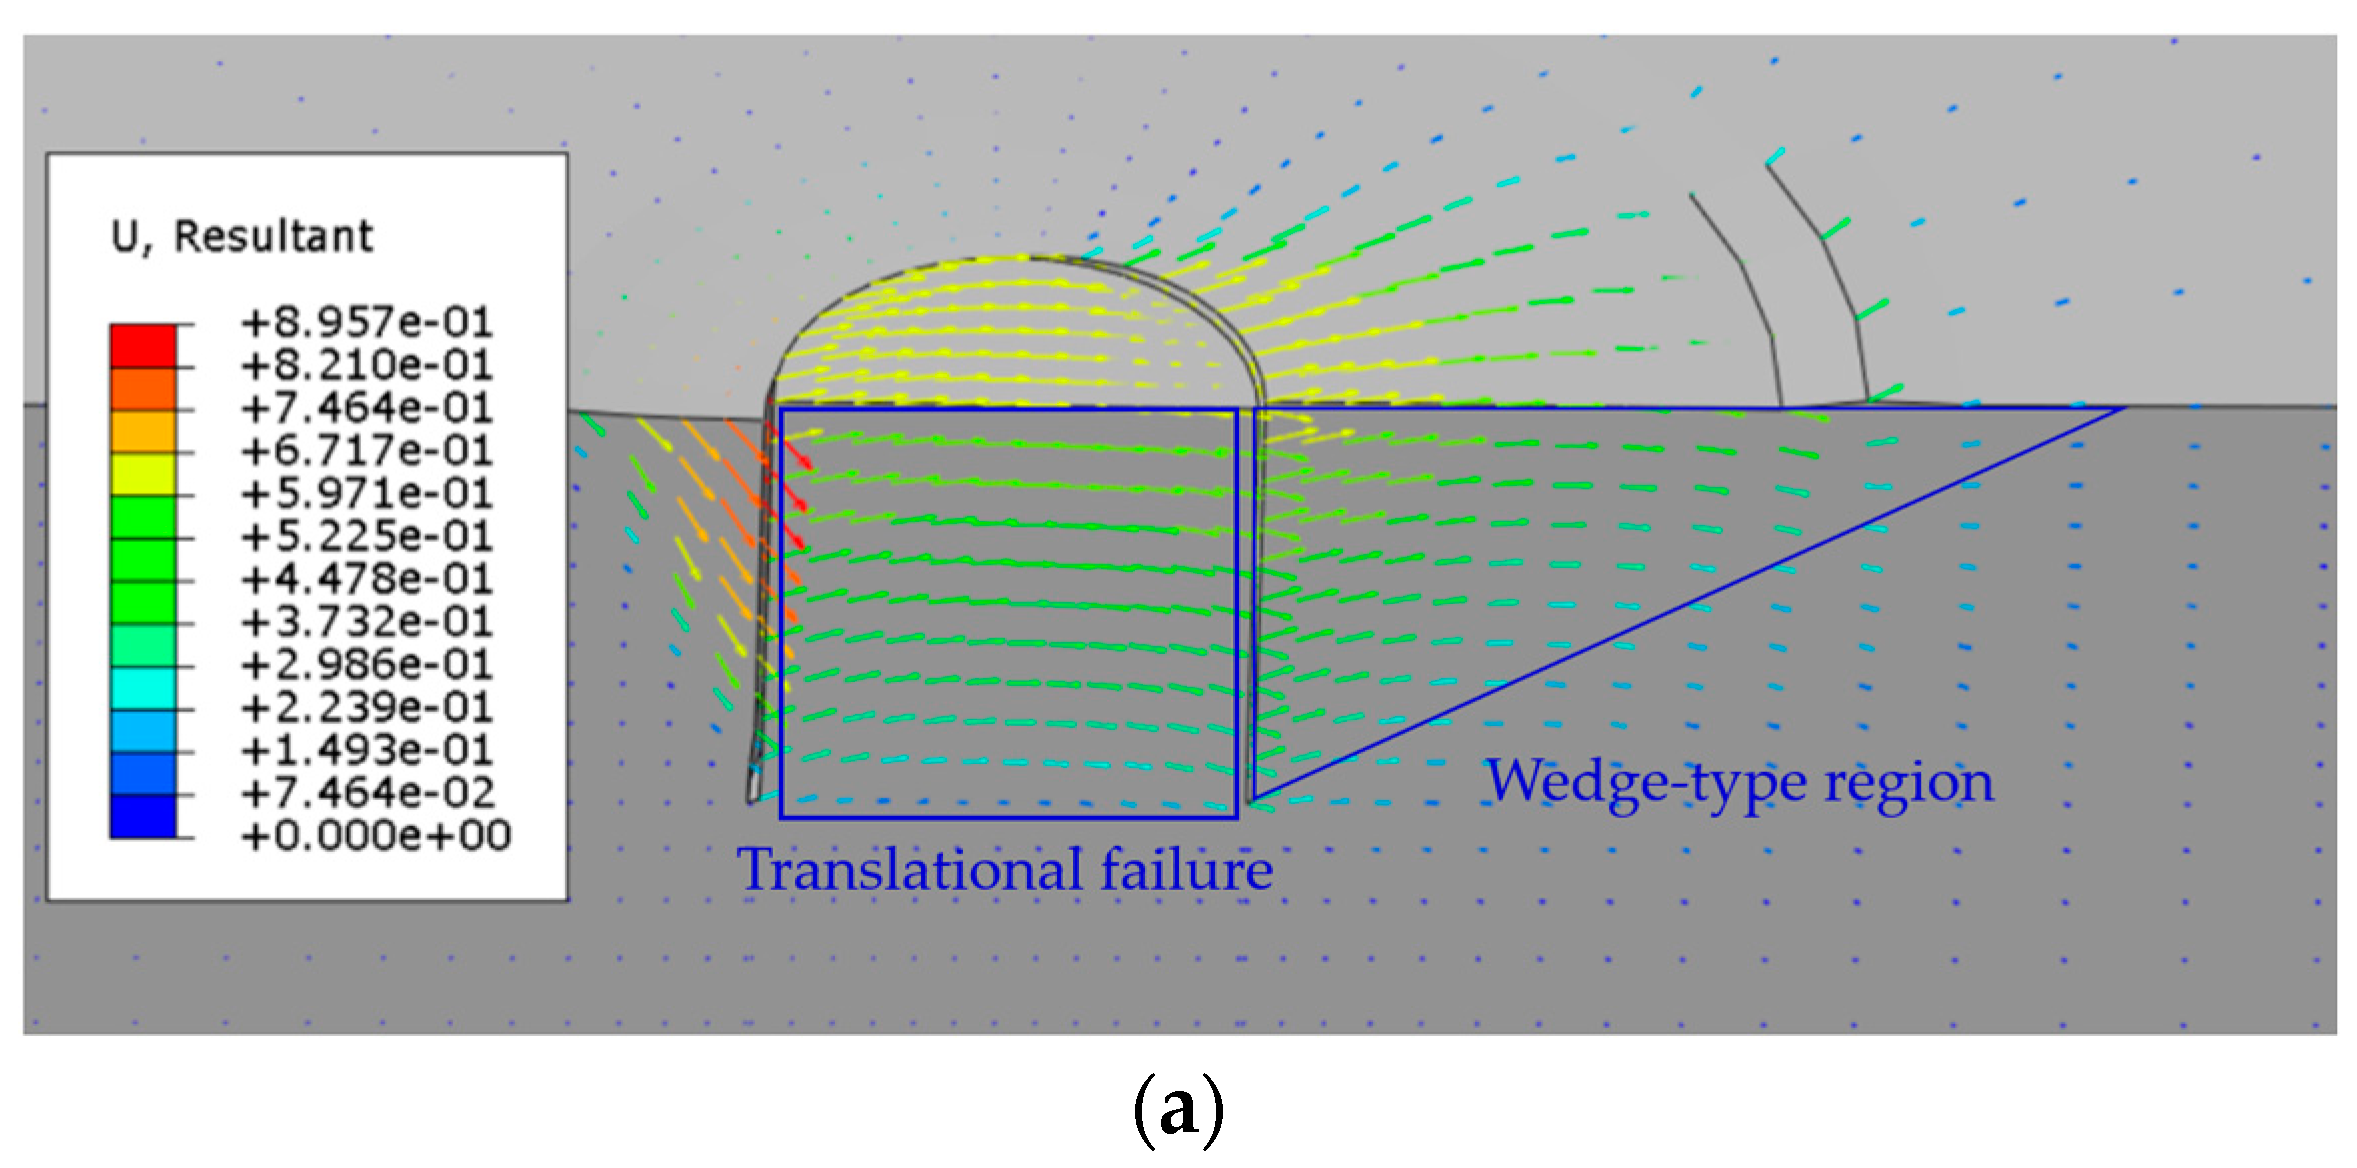
Figure 13a shows the soil displacement field when the caisson–plate gravity anchor reaches the ultimate capacity. It is found that soil displacement in the caisson basically presents a translational failure mode, which means that soil near the caisson tip mainly mobilizes horizontal shear resistance. Two wedge-type regions appear, one in front of the caisson and one at the back of caisson. The wedge-type region in front of the caisson is much larger than the one in the back, and it has a significant increase due to the restriction of the cover plate. The anchor capacity mainly comes from the resistance in the front wedge-type region and soil horizontal shear resistance near the caisson bottom.
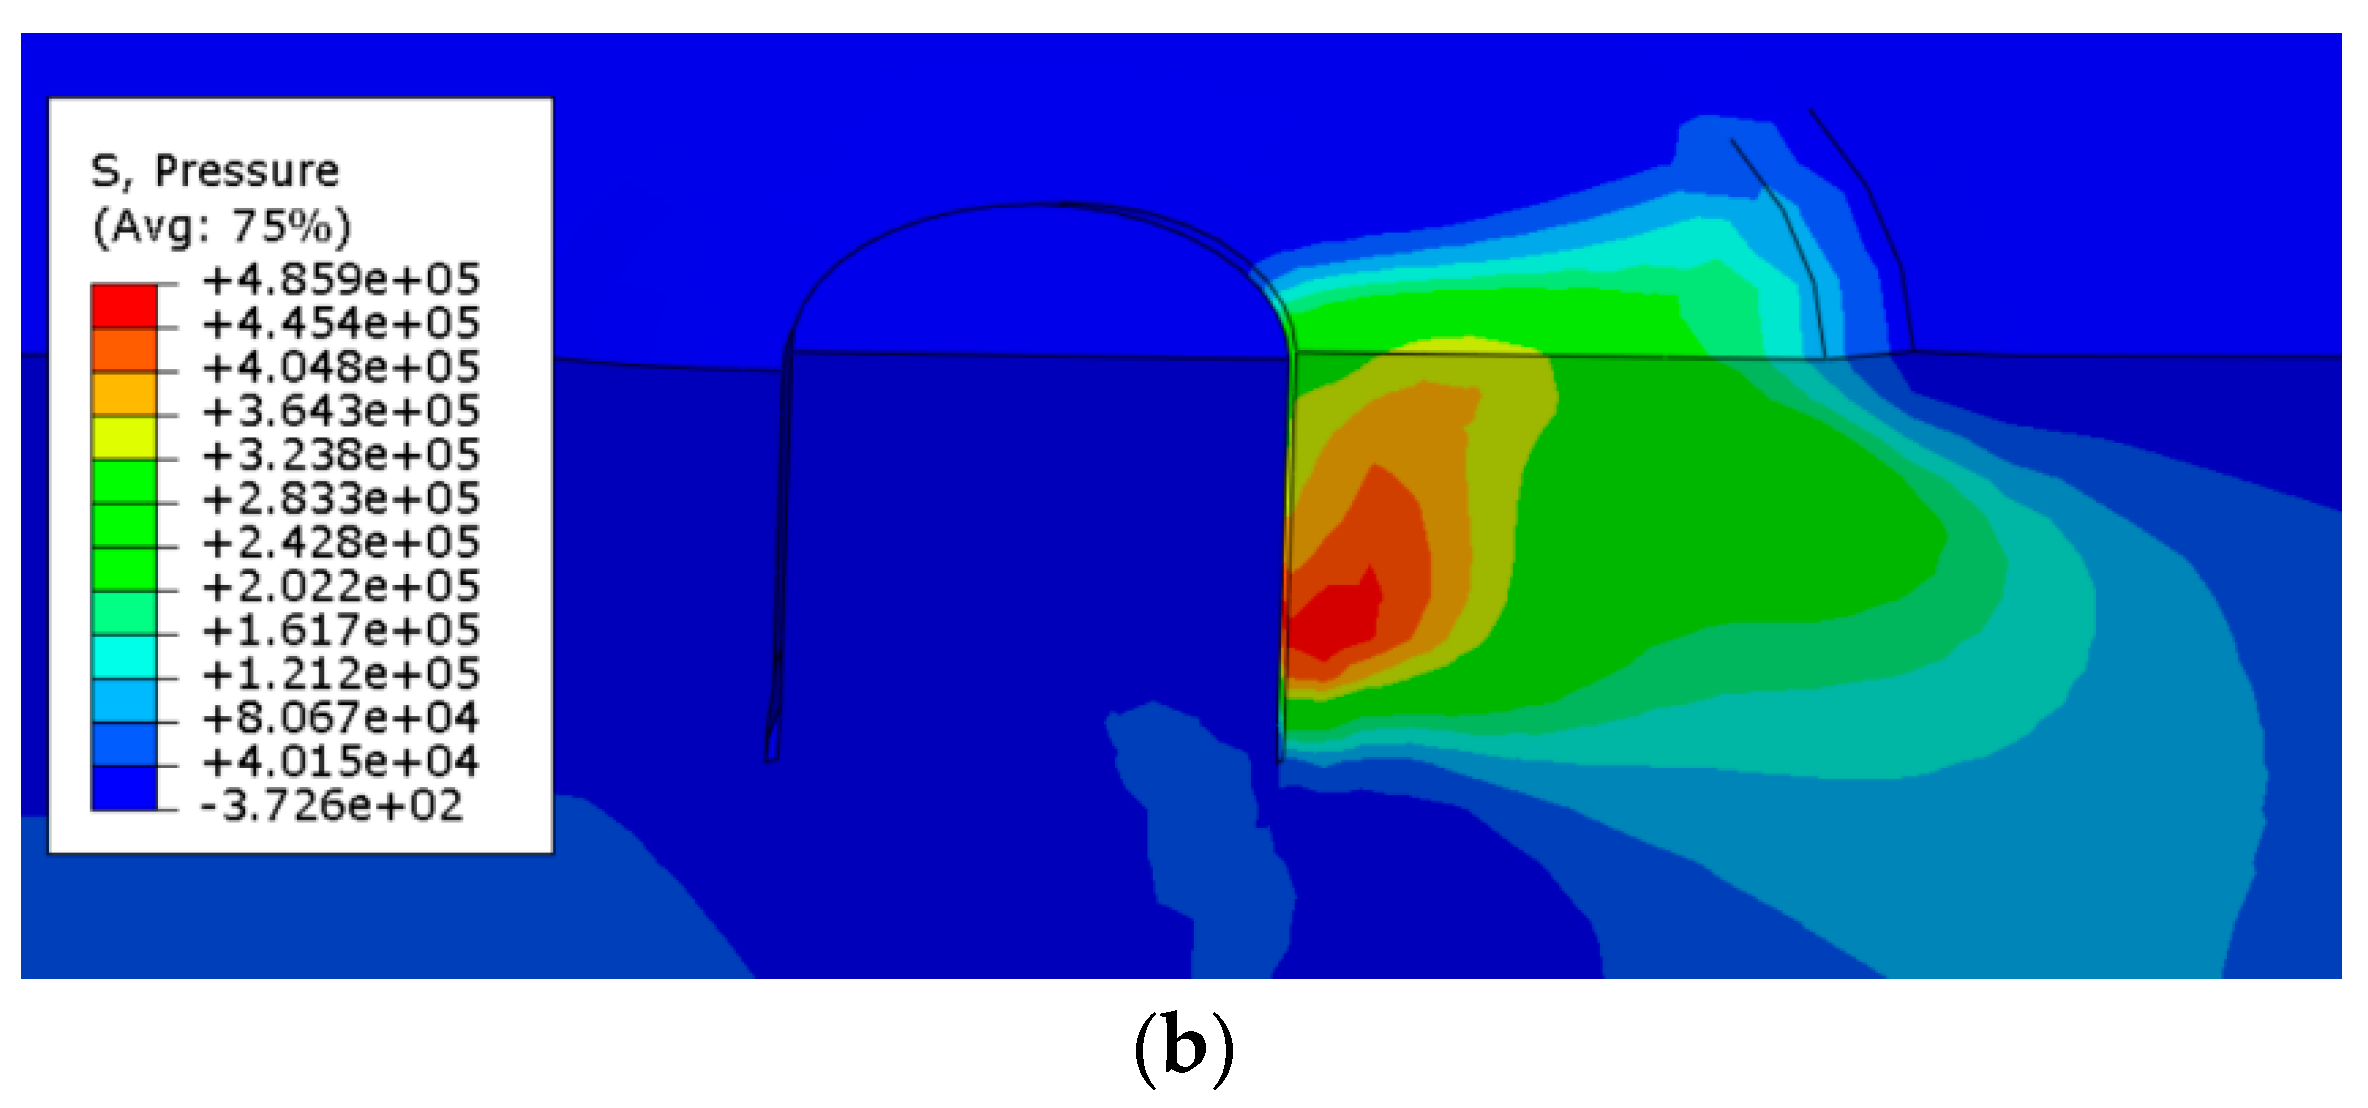
Figure 13b shows the distribution of average soil stress. Under the limit state, the soil stress under the cover plate and in front of the caisson is significantly enhanced. The length of the soil stress region extends to the plate edge, and the depth reaches the caisson bottom. Compared with the soil stress in front of the caisson, the stress in the caisson is much smaller, which indicates that the major resistance mobilizes from the front region. In addition, the stress enhancement area also significantly increases due to the restriction of the cover plate. The results show that the capacity of the caisson–plate gravity anchor mainly benefits from the increase in soil stress and the mobilized range in front of the caisson. After the verification of the finite element calculation, the dimensions of CPGA meet the design requirements.
6. Limitations and Recommendations
This paper mainly focuses on floating platforms for oil and gas exploitation, and the coupling analyses of floating wind turbines should consider the aero–hydro–servo–elastic coupling effect. In addition, the seabed trench analyses do not consider the actual process related to soil erosion, which needs further investigations. Lastly, the anchor capacity analyses adopted the mean values of soil parameters, which do not consider the soil parameter uncertainty. Thus, a reliability study could generate a better understanding of the results. In addition, for the long-term behavior of anchors, whole-life analyses of the anchors should be considered in the design [48,49,50,51].
7. Conclusions
This paper presented a framework for mooring and anchor design in sand considering seabed trenches based on floater hydrodynamics. The framework includes three procedures. First, a hydrodynamic calculation of a floater coupled with a mooring system was conducted to obtain the maximum displacement and mooring line tension. Second, the potential trench profile was assessed using a mooring line–seabed dynamic model based on the fairlead movement. Third, an anchor was designed according to seabed soils and design requirements. The applicability of the suction anchor was assessed using its installation and capacity analyses. Then, a caisson–plate gravity anchor (CPGA) was adopted, and its bearing capacity was calculated using the FE simulation to verify the anchor dimensions. The main conclusions are as follows:
- (1)
- In the hydrodynamic calculation of the floating platform, the tensions of mooring lines l1 and l2 resist the maximum loads under the 45° load condition, and the tension difference between these two mooring lines is small. The maximum load at the seabed fixed point appears under the 45° load condition, which is adopted as the input value to design the anchor. Under a 90° load condition, the resultant displacement reaches the maximum value of 7.43 m, which is adopted in the trench profile evaluation.
- (2)
- In the sand seabed, due to the sand’s high shear strength, it is difficult for the mooring line to penetrate into the soil, especially for the catenary mooring system. Thus, repeatedly disturbing and degrading the shallow soil by the mooring line no longer occurs, and the load direction at the padeye always remains vertical. According to this study, a trench is difficult to form under the condition of the catenary mooring system and sand seabed.
- (3)
- The applications of different anchors were evaluated. A suction anchor is not suitable as an anchor for carbonate sand, considering its installation and bearing capacity. Combined with engineering cases, the caisson–plate gravity anchor (CPGA) was applied and verified with the FE method. The results show that soil displacement in the caisson basically presents a translational failure mode, and two wedge-type regions appear, one in front of the caisson and one at the back of the caisson. Under the limit state, the soil stress under the cover plate and in front of the caisson is significantly enhanced. The length of the soil stress region extends to the plate edge, and the depth reaches the caisson bottom. Compared with the soil stress in front of the caisson, the stress in the caisson is much smaller, which indicates that the major resistance mobilizes from the front region. The finite element calculation indicates that the designed dimensions meet the requirements.
Author Contributions
Conceptualization, S.R.; Methodology, H.X.; Software, L.T.; Validation, C.X.; Formal analysis, X.S.; Investigation, H.X.; Data curation, H.Z.; Writing—original draft, S.R.; Writing—review and editing, K.S. All authors have read and agreed to the published version of the manuscript.
Funding
The authors would like to acknowledge the support from the European Commission (HORIZON-MSCA-2022-PF-01, 101108745), the National Natural Science Foundation of China (52238008, 51939010, 52101334), the Research Council of Norway (SFI BLUES project, 309281), the Natural Science Foundation of Zhejiang Province (LR22E080005), the Fundamental Research Funds for the Central Universities, and the Key Laboratory of Marine Geotechnical Engineering and Materials (OGME22001).
Institutional Review Board Statement
Not applicable.
Informed Consent Statement
Not applicable.
Data Availability Statement
All relevant data are presented in the manuscript.
Conflicts of Interest
The authors declare no conflict of interest.
References
- Randolph, M.F.; Gaudin, C.; Gourvenec, S.M.; White, D.J.; Boylan Cassidy, M.J. Recent advances in offshore geotechnics for deep water oil and gas developments. Ocean. Eng. 2011, 38, 818–834. [Google Scholar] [CrossRef] [Green Version]
- Randolph, M.; Cassidy, M.; Gourvenec, S.; Erbrich, C. Challenges of offshore geotechnical engineering. In Proceedings of the International Conference on Soil Mechanics and Geotechnical Engineering, Buenos Aires, Argentina, 15–18 November 2015; AA Balkema Publishers: Rotterdam, The Netherlands, 2005; Volume 16, p. 123. [Google Scholar]
- Soukissian, T.H.; Denaxa, D.; Karathanasi, F.; Prospathopoulos, A.; Sarantakos, K.; Iona, A.; Mavrakos, S. Marine renewable energy in the Mediterranean Sea: Status and perspectives. Energies 2017, 10, 1512. [Google Scholar] [CrossRef] [Green Version]
- Hemer, M.A.; Manasseh, R.; McInnes, K.L.; Penesis, I.; Pitman, T. Perspectives on a way forward for ocean renewable energy in Australia. Renew. Energy 2018, 127, 733–745. [Google Scholar] [CrossRef]
- Guo, Z.; Wang, L.; Yuan, F. Quasi-static analysis of the multicomponent mooring line for deeply embedded anchors. J. Offshore Mech. Arct. Eng. 2016, 138, 9. [Google Scholar] [CrossRef]
- Rui, S.; Guo, Z.; Wang, L.; Yang, H.; Zhou, W. Axial interaction between anchor chain and sand. Part II: Cyclic loading test. Appl. Ocean. Res. 2021, 114, 102815. [Google Scholar] [CrossRef]
- Rui, S.J.; Wang, L.Z.; Guo, Z.; Zhang, H.J.; Zhou, W.J. Axial interaction between anchor chain and sand. Part I: Monotonic loading test. Appl. Ocean. Res. 2021, 113, 102761. [Google Scholar] [CrossRef]
- Degenkamp, G.; Dutta, A. Soil resistances to embedded mooring line in soft clay. J. Geotech. Geoenviron. Eng. 1989, 115, 1420–1438. [Google Scholar] [CrossRef]
- Wang, L.; Guo, Z.; Yuan, F. Three-dimensional interaction between anchor chain and seabed. Appl. Ocean. Res. 2010, 32, 404–413. [Google Scholar] [CrossRef]
- Wang, L.; Guo, Z.; Yuan, F. Quasi-static three-dimensional analysis of suction anchor mooring system. Ocean. Eng. 2010, 37, 1127–1138. [Google Scholar] [CrossRef]
- Stanier, S.; White, D.; Chatterjee, S.; Brunning, P.; Randolph, M. A tool for ROV-based seabed friction measurement. Appl. Ocean. Res. 2015, 50, 155–162. [Google Scholar] [CrossRef]
- Frankenmolen, S.; White, D.; O’Loughlin, C. Chain-soil interaction in carbonate sand. In Proceedings of the Offshore Technology Conference, Houston, TX, USA, 2–5 May 2011; OnePetro: Richardson, TX, USA, 2016. [Google Scholar]
- Gaudin, C.; Cassidy, M.J.; O’Loughlin, C.D.; Tian, Y.; Wang, D.; Chow, S. Recent advances in anchor design for floating structures. Int. J. Offshore Polar Eng. 2017, 27, 44–53. [Google Scholar] [CrossRef]
- Richardson, M.D. Dynamically Installed Anchors for Floating Offshore Structures. Ph.D. Thesis, University of Western Australia, Perth, Australia, 2008. [Google Scholar]
- Diaz, B.D.; Rasulo, M.; Aubeny, C.P.; Fontana, C.M.; Arwade, S.R.; DeGroot, D.J.; Landon, M. Multiline anchors for floating offshore wind towers. In OCEANS 2016 MTS/IEEE Monterey; IEEE: Piscataway, NJ, USA, 2016; pp. 1–9. [Google Scholar]
- Liang, Z.; Jeng, D.S.; Liu, J. Combined wave–current induced seabed liquefaction around buried pipelines: Design of a trench layer. Ocean. Eng. 2020, 212, 107764. [Google Scholar] [CrossRef]
- Xiong, L.Z.; White, D.J.; Neubecker, S.R.; Zhao, W.H.; Yang, J.M. Anchor loads in taut moorings: The impact of inverse catenary shakedown. Appl. Ocean. Res. 2017, 67, 225–235. [Google Scholar] [CrossRef]
- Xiong, L.Z.; Yang, J.M.; Zhao, W.H. Dynamics of a taut mooring line accounting for the embedded anchor chains. Ocean. Eng. 2016, 121, 403–413. [Google Scholar] [CrossRef]
- Bhattacharjee, S.; Majhi, S.M.; Smith, D.; Garrity, R. Serpentina FPSO mooring integrity issues and system replacement: Unique fast track approach. In Proceedings of the Offshore Technology Conference, Houston, TX, USA, 5–8 May 2014. OTC-25449-MS. [Google Scholar]
- Sassi, K.; Kuo, M.Y.H.; Versteele, H.; Cathie, D.N.; Zehzouh, S. Insights into the Mechanisms of Mooring line Trench Formation. In Proceedings of the Presented at the Offshore Site Investigations and Geotechnics Conference, London, UK, 10–12 September 2017; Society for Underwater Technology: London UK, 2017. [Google Scholar]
- Hess, 2015. Ivanhoe and Rob Roy Fields Decommissioning Programmes. No. ABD-DCO-RPT_01000 Issued December 2015. Available online: https://assets.publishing.service.gov.uk/government/uploads/system/uploads/attachment_data/file/586257/IVRR_Close_out_Report.pdf (accessed on 1 May 2023).
- Colliat, J.L.; Safinus, S.; Boylan, N.; Schroeder, K. Formation and Development of Seabed Trenching from Subsea Inspection Data of Deepwater Gulf of Guinea Moorings. In Proceedings of the Offshore Technology Conference, Houston, TX, USA, 30 April–3 May 2018. OTC-29034-MS. [Google Scholar]
- Hernandez-Martinez, F.G.; Saue, M.; Schroder, K.; Jostad, H.P. Trenching Effects on Holding Capacity for in-Service Suction Anchors in High Plasticity Clays. In Proceedings of the SNAME 20th Offshore Symposium, Houston, TX, USA, 17 February 2015; OnePetro: Richardson, TX, USA, 2015. [Google Scholar]
- Arslan, H.; Peterman, B.R.; Wong, P.C.; Bhattacharjee, S. Remaining capacity of the suction pile due to seabed trenching. In Proceedings of the Presented at the International Ocean and Polar Engineering Conference, Kona, HI, USA, 21–26 June 2015. [Google Scholar]
- Alderlieste, E.; Romp, R.; Kay, S.; Lofterød, A. Assessment of seafloor trench for suction pile moorings: A field case. In Proceedings of the Offshore Technology Conference, Houston, TX, USA, 2–5 May 2016. OTC-27035-MS. [Google Scholar]
- Feng, X.; Gourvenec, S.; White, D.J. Load capacity of caisson anchors exposed to seabed trenching. Ocean. Eng. 2019, 171, 181–192. [Google Scholar] [CrossRef] [Green Version]
- Randolph, M.F. A Lifetime of Offshore Geotechnics-Career Reflections and Lessons Learned; University of Western Australia: Perth, Australia, 2020. [Google Scholar]
- Cathie, D.; Sassi, K.; Blanc, M.; Thorel, L.; Wallerand, R. Holding capacity of suction anchors with trench-centrifuge test results and interpretation. In Proceedings of the 4th International Symposium on Frontiers in Offshore Geotechnics, Austin, TX, USA, 28–31 August 2022; Deep Foundation Institute-DFI: Hawthorne, NJ, USA, 2020; p. 352. [Google Scholar]
- Sassi, K.; Zehzouh, S.; Blanc, M.; Thorel, L.; Cathie, D.; Puech, A.; Colliat-Dangus, J.L. Effect of seabed trenching on the holding capacity of suction anchors in soft deepwater Gulf of Guinea clays. In Proceedings of the Offshore Technology Conference, Houston, TX, USA, 2–5 May 2011; OnePetro: Richardson, TX, USA, 2018. [Google Scholar]
- Rui, S.J.; Guo, Z.; Wang, L.Z.; Wang, H.; Zhou, W.J. Inclined loading capacity of caisson anchor in South China Sea carbonate sand considering the seabed soil loss. Ocean. Eng. 2022, 260, 111790. [Google Scholar] [CrossRef]
- Wang, L.; Rui, S.; Guo, Z.; Gao, Y.; Zhou, W.; Liu, Z. Seabed trenching near the mooring anchor: History cases and numerical studies. Ocean. Eng. 2020, 218, 108233. [Google Scholar] [CrossRef]
- Hibbitt, K. Sorensen; ABAQUS User’s Manual Inc.: Pawtucket, RI, USA, 2008. [Google Scholar]
- American Petroleum Institute. Recommended Practice for Design and Analysis of Station Keeping Systems for Floating Structures; American Petroleum Institute: Washington, WA, USA, 2005. [Google Scholar]
- He, S.H.; Goudarzy, M.; Ding, Z.; Sun, Y.; Xia, T.D. The effect of loading frequency on the long-term cyclic behavior of dense calcareous sand. Can. Geotech. J. 2022, 59, 1285–1291. [Google Scholar] [CrossRef]
- He, S.H.; Shan, H.F.; Xia, T.D.; Liu, Z.J.; Ding, Z.; Xia, F. The effect of temperature on the drained shear behavior of calcareous sand. Acta Geotech. 2021, 16, 613–633. [Google Scholar] [CrossRef]
- Rui, S.J.; Guo, Z.; Si, T.L.; Li, Y.J. Effect of particle shape on the liquefaction resistance of calcareous sands. Soil dyn. Earthq. Eng. 2020, 137, 106302. [Google Scholar] [CrossRef]
- Zhang, W.; Zhou, Z.; Pradhan, D.L.; Wang, P.; Jin, H. Design considerations of drag anchors in cohesive soil for floating facilities in the South China sea. Mar. Struct. 2022, 81, 103101. [Google Scholar] [CrossRef]
- Liu, H.X.; Peng, J.S.; Zhao, Y.B. Analytical study of the failure mode and pullout capacity of suction anchors in sand. Ocean Syst. Eng. 2015, 5, 279–299. [Google Scholar] [CrossRef]
- Liu, H.X.; Wang, C.; Zhao, Y.B. Analytical study of the failure mode and pullout capacity of suction anchors in clay. Ocean Syst. Eng. 2013, 3, 79–95. [Google Scholar] [CrossRef] [Green Version]
- Guo, Z.; Jeng, D.S.; Guo, W.; Wang, L. Failure mode and capacity of suction caisson under inclined short-term static and one-way cyclic loadings. Mar. Georesour. Geotechnol. 2018, 36, 52–63. [Google Scholar] [CrossRef] [Green Version]
- Guo, Z.; Jeng, D.S.; Guo, W.; He, R. Simplified approximation for seepage effect on penetration resistance of suction caissons in sand. Ships Offshore Struct. 2017, 12, 980–990. [Google Scholar] [CrossRef]
- Guo, Z.; Wang, L.; Yuan, F.; Li, L. Model tests on installation techniques of suction caissons in a soft clay seabed. Appl. Ocean. Res. 2012, 34, 116–125. [Google Scholar] [CrossRef]
- Liu, X.; Wu, W.; El Naggar, M.H.; Wang, K.; Mei, G.; Liu, H.; Wang, L.; Sun, J. A simplified non-axisymmetric pile-soil interaction model for pile integrity testing analysis. Appl. Math. Model. 2023, 119, 137–155. [Google Scholar] [CrossRef]
- Wu, W.; Bauer, E. A simple hypoplastic constitutive model for sand. Int. J. Numer. Anal. Methods Geomech. 1994, 18, 833–862. [Google Scholar] [CrossRef]
- Liang, J.; Du, X.; Fang, H.; Du, M.; Shi, M.; Gao, X.; Han, Y. Numerical and experimental study of diffusion law of foamed polymer grout in fracture considering viscosity variation of slurry. Tunn. Undergr. Space Technol. 2022, 128, 104674. [Google Scholar] [CrossRef]
- Rui, S.J.; Wang, L.Z.; Guo, Z.; Cheng, X.M.; Wu, B. Monotonic behavior of interface shear between carbonate sands and steel. Acta Geotech. 2021, 16, 167–187. [Google Scholar] [CrossRef]
- Rui, S.J.; Wang, L.Z.; Guo, Z.; Zhou, W.J.; Li, Y.J. Cyclic behavior of interface shear between carbonate sand and steel. Acta Geotech. 2021, 16, 189–209. [Google Scholar] [CrossRef]
- Zhou, Z.; O’Loughlin, C.D.; White, D.J.; Stanier, S.A. Improvements in plate anchor capacity due to cyclic and maintained loads combined with consolidation. Géotechnique 2020, 70, 732–749. [Google Scholar] [CrossRef]
- Zhou, Z.; White, D.J.; O’Loughlin, C.D. An effective stress framework for estimating penetration resistance accounting for changes in soil strength from maintained load, remoulding and reconsolidation. Géotechnique 2019, 69, 57–71. [Google Scholar] [CrossRef] [Green Version]
- Rui, S.; Zhang, H.; Xu, H.; Zha, X.; Xu, M.; Shen, K. Seabed structures and foundations related to deep-sea resource development: A review based on design and research. Deep. Undergr. Sci. Eng. 2023, 1–18. [Google Scholar] [CrossRef]
- Zhou, Z.; White, D.J.; O’Loughlin, C.D. The changing strength of carbonate silt: Parallel penetrometer and foundation tests with cyclic loading and reconsolidation periods. Can. Geotech. J. 2020, 57, 1664–1683. [Google Scholar] [CrossRef]
Figure 1.
Seabed trench in front of anchor due to mooring line repeatedly cutting.

Figure 2.
A framework for mooring and anchor design in sand considering seabed trenches.

Figure 3.
Mooring system of floating platform (top view).
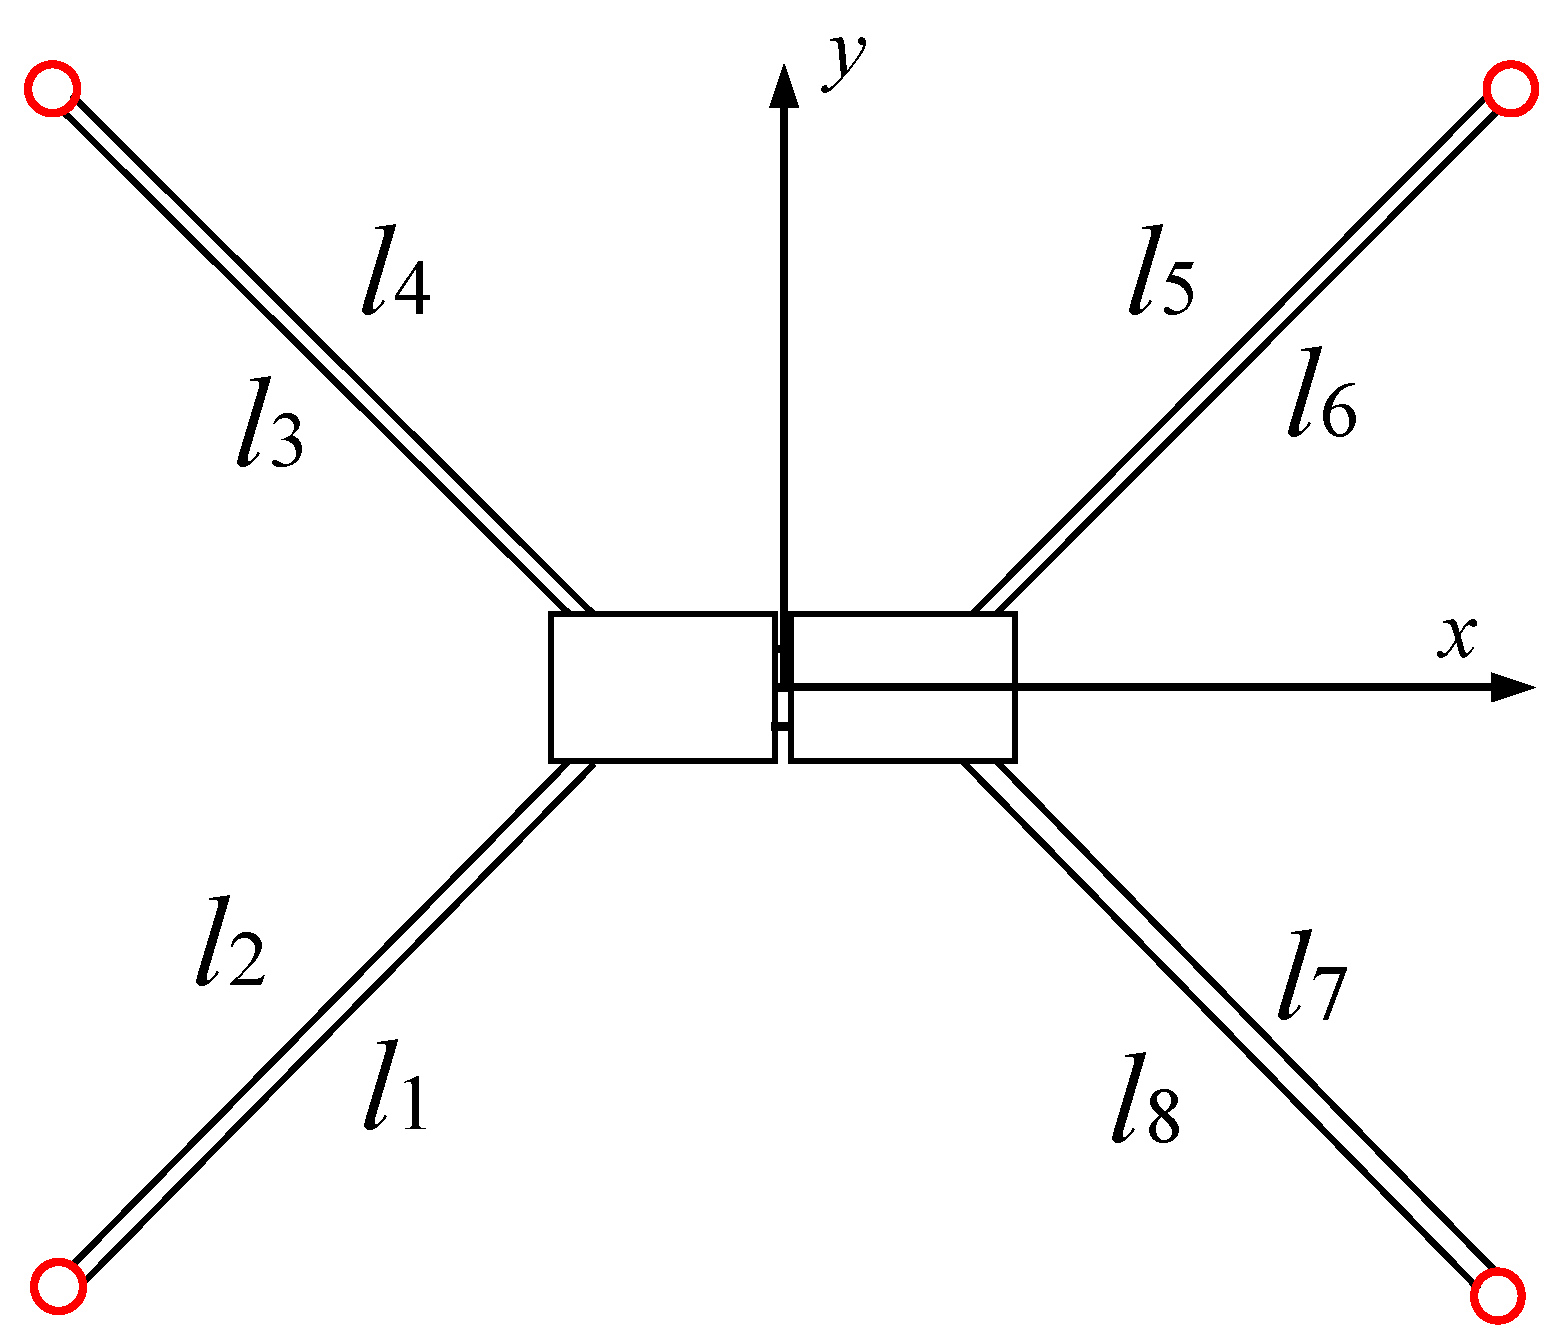
Figure 4.
Hydrodynamic calculation model of floating platform in AQWA.

Figure 5.
Response amplitude operators in different wave periods and directions.

Figure 6.
Time–history curves of the platform motion under the load direction of 45°.
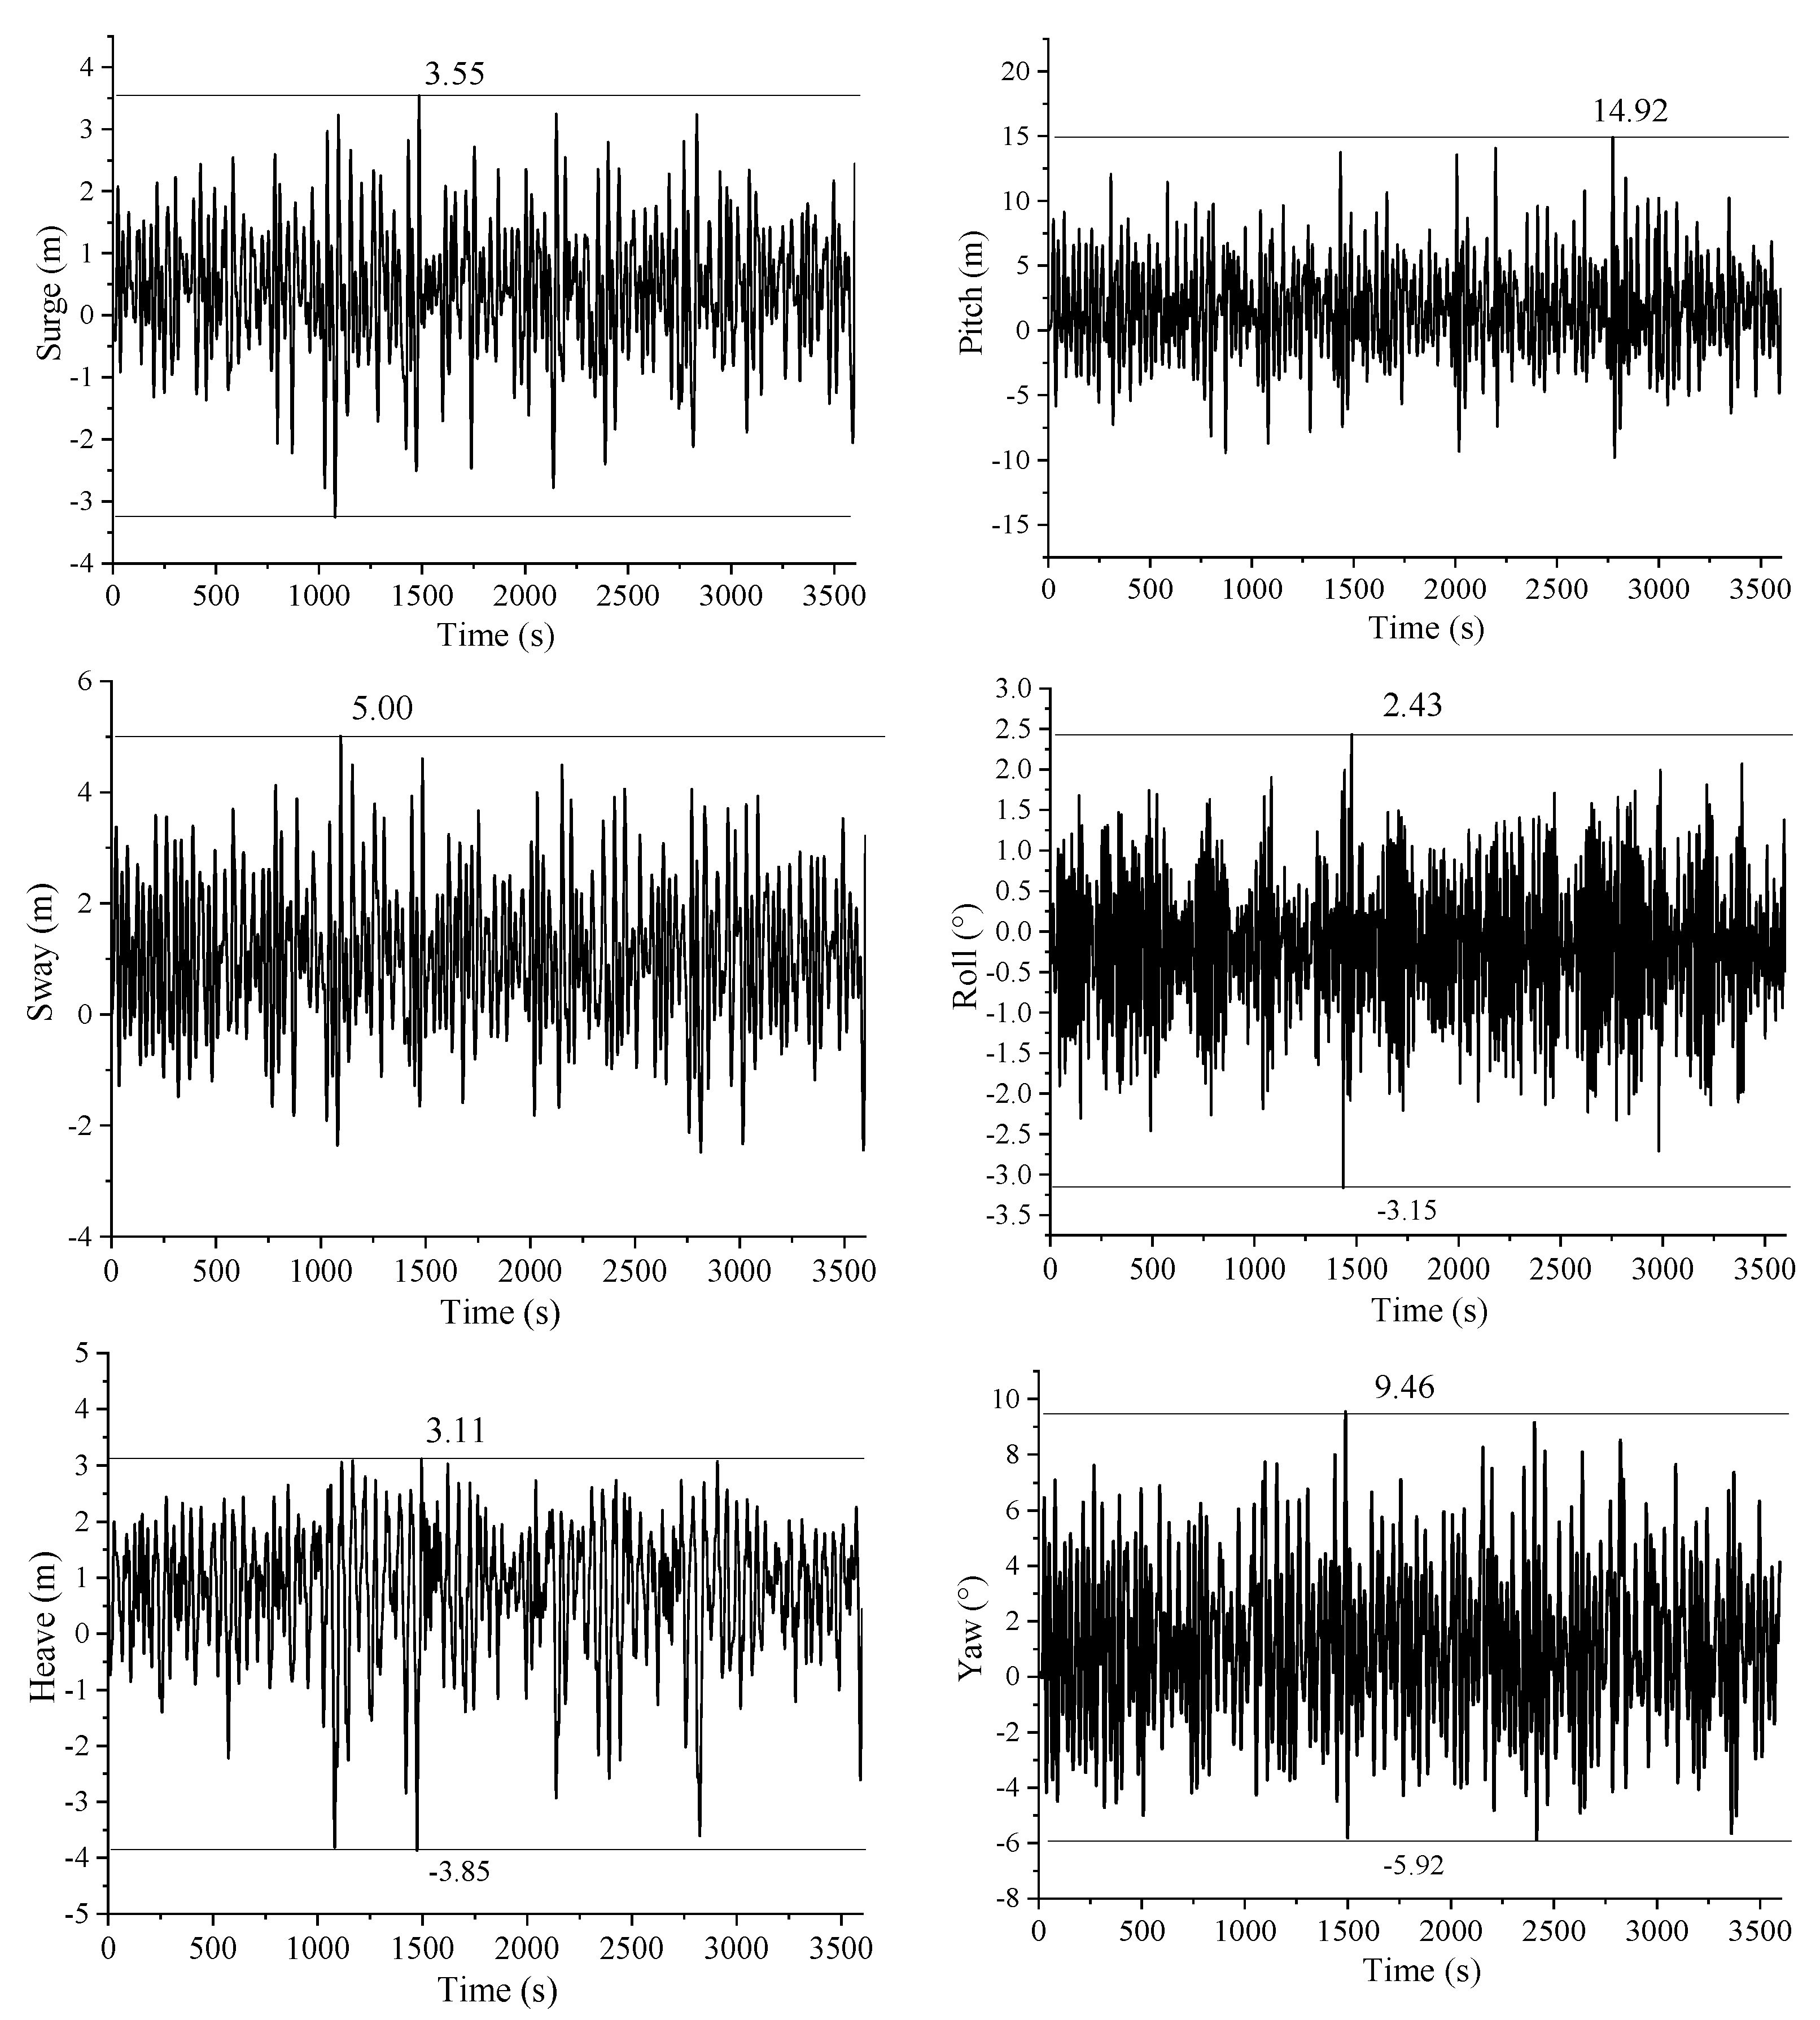
Figure 7.
Time–history curve of chain tension at the fairlead. (a) Mooring line l1; (b) mooring line l2.
Figure 7.
Time–history curve of chain tension at the fairlead. (a) Mooring line l1; (b) mooring line l2.

Figure 8.
Time–history curve of chain tensions at seabed fixed point. (a) Mooring line l1; (b) mooring line l1.
Figure 8.
Time–history curve of chain tensions at seabed fixed point. (a) Mooring line l1; (b) mooring line l1.

Figure 9.
Mooring line configurations and inclined loading angle at the padeye. (a) Mooring line configurations in the fifth cycle; (b) inclined loading angle at the padeye.
Figure 9.
Mooring line configurations and inclined loading angle at the padeye. (a) Mooring line configurations in the fifth cycle; (b) inclined loading angle at the padeye.

Figure 10.
Calculated capacity of suction anchor versus inclined loading angle.

Figure 11.
Configuration of the caisson–plate gravity anchor.

Figure 12.
Load displacement curve of the caisson–plate gravity anchor.
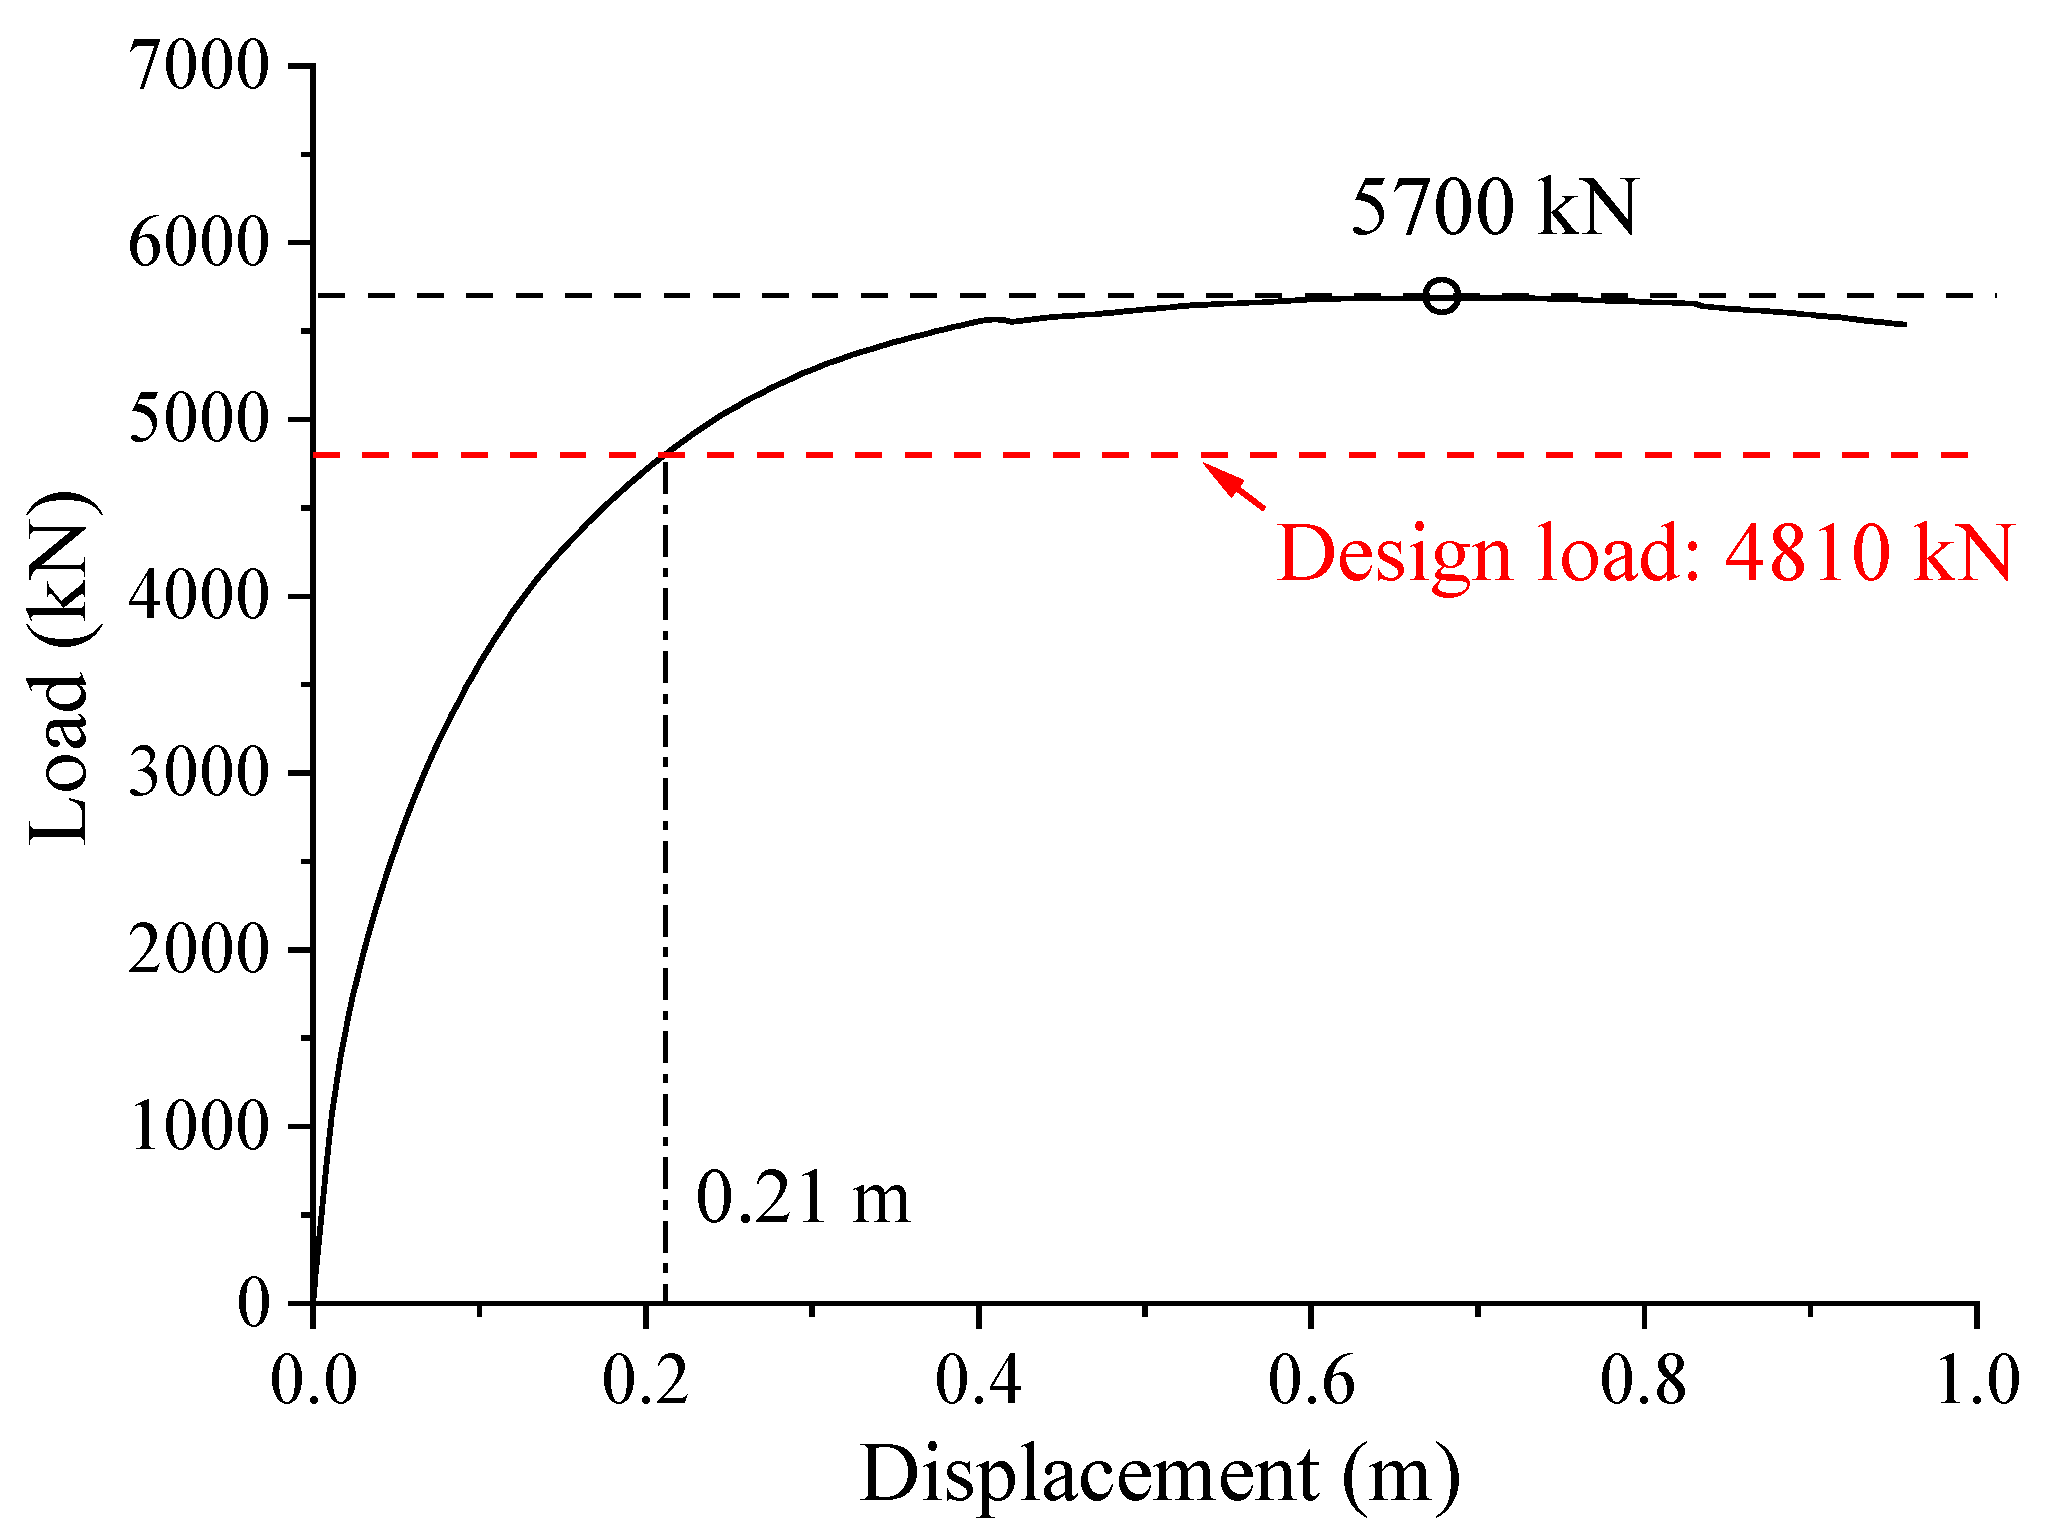
Figure 13.
Finite element calculation results of the caisson–plate gravity anchor. (a) Soil displacement field (unit: m); (b) soil average stress field (unit: Pa).
Figure 13.
Finite element calculation results of the caisson–plate gravity anchor. (a) Soil displacement field (unit: m); (b) soil average stress field (unit: Pa).

Table 1.
Designed sea conditions with the 50-year return period.
| Average Wind Speed Vw (m/s) | Significant Wave Height Hs (m) | Spectral Peak Period Tp (s) | Current Velocity Vc (m/s) | |
|---|---|---|---|---|
| Survival condition | 46.2 | 4.0 | 9.1 | 1.0 |
| Operational condition | 8.0 | 1.0 | 4.5 | 0.3 |
Table 2.
Main dimensions of the floating platform.
| Parameters | Values |
|---|---|
| Total length | 63 m |
| Total width | 25 m |
| Single module length | 30 m |
| Module height | 14.2 m |
| Module draft | 5.5 m |
| Total displacement | 1827 t |
Table 3.
Wind and flow coefficients of a single module.
| Wind | Current | |||
|---|---|---|---|---|
| x | y | x | y | |
| Area (m2) | 137.7 | 152.7 | 109.5 | 116.5 |
| Force coefficient (N/(m/s)2) | 105.7 | 117.2 | 66,781.3 | 71,050.4 |
Table 4.
Position of fairleads and fixed points in the mooring system.
| Codes | Fairlead on the Platform | Fixed Point on the Seafloor | ||||
|---|---|---|---|---|---|---|
| x (m) | y (m) | z (m) | x (m) | y (m) | z (m) | |
| l1 | −26.4 | −12.5 | 0.5 | −146.6 | −132.7 | −40.0 |
| l2 | −29 | −12.5 | 0.5 | −149.2 | −132.7 | −40.0 |
| l3 | −29 | 12.5 | 0.5 | −149.2 | 132.7 | −40.0 |
| l4 | −26.4 | 12.5 | 0.5 | −146.6 | 132.7 | −40.0 |
| l5 | 26.4 | 12.5 | 0.5 | 146.6 | 132.7 | −40.0 |
| l6 | 29 | 12.5 | 0.5 | 149.2 | 132.7 | −40.0 |
| l7 | 29 | −12.5 | 0.5 | 149.2 | −132.7 | −40.0 |
| l8 | 26.4 | −12.5 | 0.5 | 146.6 | −132.7 | −40.0 |
Table 5.
Parameters of each mooring line.
| Mooring Line Position | Components | Length (m) | Feature Diameter (mm) | Breaking Force (kN) | Mass (kg/m) |
|---|---|---|---|---|---|
| Upper part | Polyethylene | 10 | 194 | 19,600 | 17.2 |
| Middle part | Nylon | 75 | 259 | 19,600 | 46.8 |
| Transition part | Chain | 6 | 120 (db) | 13,573 | 288 |
| Ground part | Chain | 88 | 208 (db) | 34,619 | 862 |
Table 6.
Maximum values of platform motions and mooring line tensions.
| Parameters | Incident Load Direction | ||
|---|---|---|---|
| 0° | 90° | 45° | |
| Surge (m) | 4.78 | 0.19 | 3.55 |
| Sway (m) | 0 | 6.19 | 5 |
| Heave (m) | 3.6 | 4.1 | 3.11 |
| Resultant displacement (m) | 5.98 | 7.43 | 6.88 |
| Pitch (°) | 0 | 17.69 | 14.92 |
| Rolling (°) | 4.29 | 0.74 | 2.43 |
| Yaw (°) | 0 | 1.39 | 9.46 |
| Tension at fixed point (kN) | 878.25 | 1141.5 | 1503 |
Table 7.
Calculation parameters for the trench profile assessment.
| Parameter Types | Parameters | Values |
|---|---|---|
| Floating platform displacement | Motion amplitude, Af | 7.43 m |
| Balance position distance, R | 170 m | |
| Cyclic period, Tf | 100 s | |
| Mooring line | Anchor padeye depth, de | 6 m |
| Mooring line length, L | 179 m | |
| Seabed soil | Saturated unit weight, γs | 18 kN/m3 |
| Sand critical friction angle, φ | 36.2° | |
| Interface friction angle, δ | 26° |
Table 8.
Designed dimensions of the caisson–plate gravity anchor.
| Parameters | Values |
|---|---|
| Caisson outer diameter, d | 3.7 m |
| Caisson embedded depth, h | 3.7 m |
| Caisson wall thickness, t | 44 mm |
| Cover plate diameter, D | 11.1 m |
| Vertical pressure of the cover plate, Vp | 16 kPa |
| Anchor total weight, W | 164.3 t |
Disclaimer/Publisher’s Note: The statements, opinions and data contained in all publications are solely those of the individual author(s) and contributor(s) and not of MDPI and/or the editor(s). MDPI and/or the editor(s) disclaim responsibility for any injury to people or property resulting from any ideas, methods, instructions or products referred to in the content. |
© 2023 by the authors. Licensee MDPI, Basel, Switzerland. This article is an open access article distributed under the terms and conditions of the Creative Commons Attribution (CC BY) license (https://creativecommons.org/licenses/by/4.0/).
Share and Cite
MDPI and ACS Style
Rui, S.; Xu, H.; Teng, L.; Xi, C.; Sun, X.; Zhang, H.; Shen, K. A Framework for Mooring and Anchor Design in Sand Considering Seabed Trenches Based on Floater Hydrodynamics. Sustainability 2023, 15, 9403. https://doi.org/10.3390/su15129403
AMA Style
Rui S, Xu H, Teng L, Xi C, Sun X, Zhang H, Shen K. A Framework for Mooring and Anchor Design in Sand Considering Seabed Trenches Based on Floater Hydrodynamics. Sustainability. 2023; 15(12):9403. https://doi.org/10.3390/su15129403
Chicago/Turabian StyleRui, Shengjie, Hang Xu, Long Teng, Chen Xi, Xingye Sun, Haojie Zhang, and Kanmin Shen. 2023. "A Framework for Mooring and Anchor Design in Sand Considering Seabed Trenches Based on Floater Hydrodynamics" Sustainability 15, no. 12: 9403. https://doi.org/10.3390/su15129403
Note that from the first issue of 2016, this journal uses article numbers instead of page numbers. See further details here.