Article

Prediction of Groundwater Quality Index Using Classification Techniques in Arid Environments

by
Abdessamed Derdour
1,2,
Hazem Ghassan Abdo
3,
Hussein Almohamad
4,
Abdullah Alodah
5,*,
Ahmed Abdullah Al Dughairi
4,
Sherif S. M. Ghoneim
6 and
Enas Ali
7
1
Artificial Intelligence Laboratory for Mechanical and Civil Structures and Soil, University Center of Naama, P.O. Box 66, Naama 45000, Algeria
2
Laboratory for the Sustainable Management of Natural Resources in Arid and Semi-Arid Zones, University Center of Naama, P.O. Box 66, Naama 45000, Algeria
3
Geography Department, Faculty of Arts and Humanities, Tartous University, Tartous P.O. Box 2147, Syria
4
Department of Geography, College of Arabic Language and Social Studies, Qassim University, Buraydah 51452, Saudi Arabia
5
Department of Civil Engineering, College of Engineering, Qassim University, Buraydah 51452, Saudi Arabia
6
Department of Electrical Engineering, College of Engineering, Taif University, Taif 21944, Saudi Arabia
7
Faculty of Engineering and Technology, Future University in Egypt, New Cairo 11835, Egypt
*
Author to whom correspondence should be addressed.
Sustainability 2023, 15(12), 9687; https://doi.org/10.3390/su15129687
Submission received: 23 May 2023 / Revised: 10 June 2023 / Accepted: 12 June 2023 / Published: 16 June 2023

Abstract

:
Assessing water quality is crucial for improving global water resource management, particularly in arid regions. This study aims to assess and monitor the status of groundwater quality based on hydrochemical parameters and by using artificial intelligence (AI) approaches. The irrigation water quality index (IWQI) is predicted by using support vector machine (SVM) and k-nearest neighbors (KNN) classifiers in Matlab’s classification learner toolbox. The classifiers are fed with the following hydrochemical input parameters: sodium adsorption ratio (SAR), electrical conductivity (EC), bicarbonate level (HCO3), chloride concentration (Cl), and sodium concentration (Na). The proposed methods were used to assess the quality of groundwater extracted from the desertic region of Adrar in Algeria. The collected groundwater samples showed that 9.64% of samples were of very good quality, 12.05% were of good quality, 21.08% were satisfactory, and 57.23% were considered unsuitable for irrigation. The IWQI prediction accuracies of the classifiers with the standardized, normalized, and raw data were 100%, 100%, and 90%, respectively. The cubic SVM with the normalized data develops the highest prediction accuracy for training and testing samples (94.2% and 100%, respectively). The findings of this work showed that the multiple regression model and machine learning could effectively assess water quality in desert zones for sustainable water management.

1. Introduction

Groundwater is a crucial resource for many different purposes, including drinking water, agriculture, and industrial uses [1,2]. Assessing and monitoring the quality of groundwater, however, has consistently been a major challenge that needs to be overcome to ensure the long-term sustainability of already depleted water resources. While some groundwater is a renewable resource that can be replenished through rainwater and snowmelt, it can be depleted if consumed faster than naturally recharged [3,4]. On the other hand, non-renewable groundwater resources that have been stored for thousands of years are finite and can be drained if overexploited. Farmers in arid areas usually irrigate their crops with groundwater more than other sources such as surface water. Therefore, improvements in water resource quality may significantly reduce irrigation treatment costs and increase agricultural yields [5,6]. However, groundwater quality in arid areas is a complex and dynamic issue [7]. Groundwater in arid regions is often degraded due to various factors, including drought, overexploitation, irrigation fertilizers, geology, wastewater discharge, and climate change. This can lead to declining water quantity and quality, with severe consequences for people’s health and livelihoods as a result [8,9].
Nevertheless, evaluating water quality involves several challenges, including massive sample collection, laboratory testing, and data processing. These are typically time-consuming operations with high costs in terms of equipment, chemical solutions, and human resources [10]. Monitoring and assessing groundwater quality regularly is crucial to ensure it remains safe for human consumption and irrigation uses [11]. It should be noted that laboratories in several countries have suffered from a lack of chemical analysis reactors due to the COVID-19 pandemic in the last three years [12]. Therefore, it is necessary to find cost-effective and time-efficient methods to assess water quality precisely and overcome the circumstances above. To do so, there are various methods, including water quality sampling and analysis, remote sensing, and modeling. Recently, there has been an increasing interest in artificial intelligence (AI) and its potential applications for water quality monitoring and management [10,13,14]. AI has been used for various water quality-related tasks, including data collection, analysis, and decision-making. Many AI technologies can be used for water quality applications [10,15]. The most common type of AI technology is machine learning, which can be used for data classification and prediction tasks [16]. Other types of AI technologies that have been applied to water quality include rule-based systems, evolutionary computation, and artificial neural networks. The use of AI techniques is prevalent in different water-related studies around the world, including random forests (RF), artificial neural networks (ANN), and support vector machines (SVM) [17,18,19,20,21,22]. Several studies have focused on assessing and monitoring groundwater quality in arid regions, particularly in the context of irrigation water quality management. The availability and suitability of groundwater for irrigation and drinking purposes are critical factors for enhancing agricultural productivity in arid areas. Researchers have employed various artificial intelligence (AI) techniques to predict the irrigation water quality index (IWQI) based on specific input parameters [23,24]. Abdel-Fattah et al. [25] used a neural network to evaluate the appropriateness of quality of water for irrigation in Egypt. In the Algerian Illizi region, Mokhtar et al. [26] forecast irrigation water quality indices using machine learning models and regression analyses. Ahmed et al. [27] predicted the irrigation water quality index for irrigation purposes in Bangladesh by using ANN and SVR models. M’nassri et al. [28] estimated IWQI using ANN and multiple linear regression (MLR) models in Sidi El Hani in Tunisia. Haider et al. [29] proposed a hierarchical-based fuzzy technique to address the uncertainties associated with the absence of long observations and inaccurate measurements of groundwater data in Qassim, Saudi Arabia. These studies demonstrate the potential of AI in water quality assessment, providing valuable tools for stakeholders and decision-makers to evaluate groundwater suitability for irrigation and drinking purposes. AI technologies offer several potential benefits for water quality monitoring and management. First, AI can automate repetitive tasks such as data collection and analysis. As a result, it can free up staff time for other fieldwork or public outreach activities. Second, AI can provide decision support by generating recommendations or alerts based on data analysis. Finally, AI can help to better understand complex water quality problems by providing insights that would not be possible with traditional methods. Despite the potential benefits of using AI for water quality applications, some challenges need to be addressed. First, there is a lack of standardization among AI tools and methods, which makes it difficult to compare results across studies [16]. Second, using AI requires access to high-quality datasets, which may not be available in some areas [30].
To address these challenges, this research aims to assess and monitor groundwater quality in the arid region of Adrar, Algeria, utilizing AI algorithms to predict IWQI based on key input parameters and subsequently support effective water resource management decisions for irrigation and drinking purposes in the study area. This will make it easier to identify problems early and take steps to protect this vital resource. Artificial intelligence algorithms are employed to predict the irrigation water quality index (IWQI) of the study area based on the input parameters of water electrical conduction (EC), sodium concentration (Na), sodium adsorption ratio (SAR), chloride concentration (Cl), and the percentage of bicarbonate (HCO3), and the output parameter is IWQI. These parameters were computed based on the analysis of 166 samples collected from an arid desert. Using the study’s findings, farmers in arid areas can boost agricultural productivity through enhanced irrigation water quality management, and policymakers and stakeholders can make reasonable choices on water resource management. The implications of the proposed methods are two-fold. Firstly, for irrigation purposes, the IWQI provides a valuable tool for stakeholders and farmers to assess the suitability of groundwater for agricultural uses. By comparing the predicted IWQI with the recommended standards, decision-makers can determine whether the groundwater is suitable for irrigation or if additional treatment measures are necessary. This information is essential for optimizing crop production, minimizing the negative impact of poor water quality on agricultural yields, and ensuring sustainable water resource management. Secondly, in terms of drinking water, the predicted IWQI allows for an evaluation of the groundwater’s suitability for human consumption. By comparing the calculated IWQI with the World Health Organization (WHO) drinking water standards, decision-makers can also assess the potential health risks associated with the consumption of the groundwater. This information is crucial for ensuring the provision of safe drinking water to communities, as it helps identify the need for appropriate treatment measures or the implementation of alternative water sources. By providing stakeholders and decision-makers with a reliable and efficient tool to evaluate groundwater quality, our study empowers them to make informed decisions regarding water resource management and safeguarding the health and well-being of communities reliant on groundwater for irrigation and drinking purposes.

2. Materials and Methods
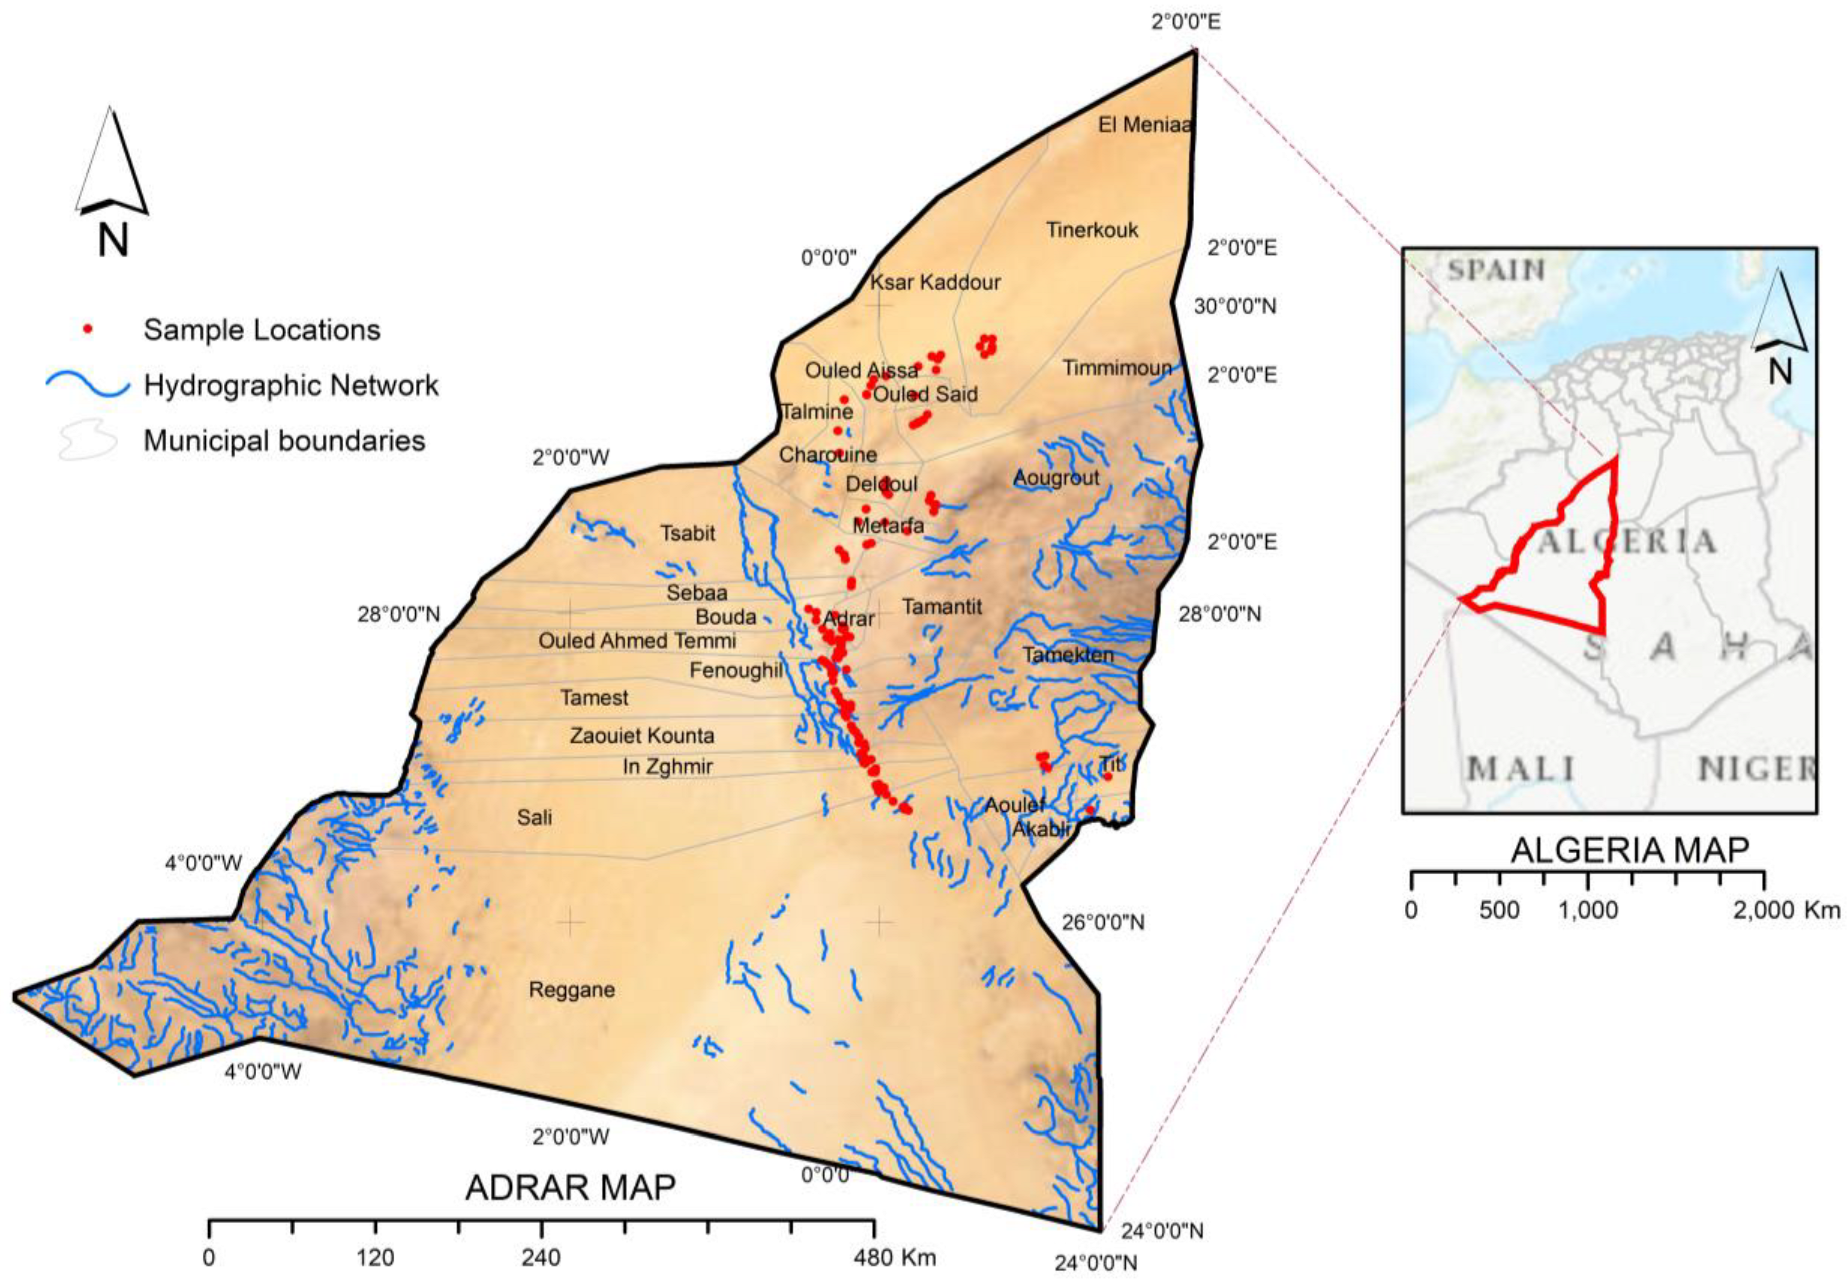
2.1. Study Area

The investigated area, located in the southwestern part of Algeria between 5°38′38″ W and 2°6′30″ E latitudes and 24°53′30″ N and 31°42′27″ N longitudes, covers a total area of 297,790 km2, which constitutes approximately 18% of the area of Algeria. Figure 1 illustrates the location of the study area. The study area belongs to the Algerian Sahara, one of the world’s driest and hottest areas [31]. The summers are long and hot, and the winters are short and warm. Adrar is characterized by scarce rainfall, where the annual average is about 15 mm yearly, and the evaporation rate is about 4500 mm yearly [32]. Temperatures in the summer are consistently high and can exceed 45 °C [33]. The study area often experiences a scorching, dusty southerly wind called the Sirocco in the summer [34]. During this time, the northern part of the country can be soaked for as long as 40 days [21]. Geographically, Adrar is bounded by Erg Chech in the west, Tadmait in the east, the occidental Erg in the north, and Tanezrouft in the south. This area comprises four natural Saharan regions: Gourara, Touat, Tidikelt, and Tanezrouft. In the study region, the hydrographic network is represented by Wadi Messaoud, which is the continuity of Wadi Saoura towards the north (the latter drained from the Saharan Atlas), and Oued Tillia and its tributaries, which drain the plateau of Tademaït towards the southeast at the level of Zaouïet Kounta from Baamer to Reggane. At the eastern end of the Touat depression, an intense hydrographic network of small distinct ravines drains the plateau of Tademait. Adrar is mainly an agricultural region characterized by its traditional irrigation system, named “foggara” [35]. Hydrogeologically, the study area is part of the transboundary Northern Saharan Aquifer System (SASS) [36]. Many of these deposits are deeply buried, and their thickness can reach at least 2000 m [37]. In addition to siliciclastic sandstone, some parts of the aquifer are karstic and evaporite [36]. Aquifers in this area tend to be highly productive. Over the centuries, foggaras (water galleries) have exploited the aquifer of Continental Intercalaire (CI) around its edges in the Sahara [38].

2.2. Data Collection

For this study, 166 water samples from the research area were provided by the national water resources agency (ANRH). The samples were provided from boreholes and the foggara system. The data for each sample consisted mainly of chemical elements represented by pH, cations such as magnesium (Mg), calcium (Ca), sodium (Na), and potassium (K), and anions such as chloride (Cl), sulfate (SO4), and bicarbonate (HCO3). Pollution indicators such as nitrate (NO3) and other physical elements are represented by electrical conductivity (EC) and temperature (°C). The assessment of the suitability of groundwater in the region of Adrar for irrigation was established with the international standard provided by the Food and Agriculture Organization (FAO). Therefore, this database adequately represents groundwater quality in the study area. A summary of the collected data is given in Table 1.

2.3. Irrigation Water Quality Criteria

2.3.1. Suitability Indices for Irrigation

A great deal of variation exists in irrigation water’s quality depending on the type and quantity of its salts. Groundwater irrigation waters contain NaCl as their predominant salt [39]. Consequently, the sodium adsorption ratio (SAR) played an important role in determining the effects of the application of irrigation water on soil structural behavior in earlier research [40]. The USDA’s salinity lab defined SAR as [41]:
S A R = N a + C a 2 + + M g 2 + 2
where concentrations of cations ( N a + , C a 2 + + M g 2 + ) are expressed in milliequivalents per liter (mEq/L).

2.3.2. Irrigation Water Quality Index (IWQI)

Depending on the crop pattern, soil type, and climate, irrigation quality requirements may vary from one field to another [42]. Hence, a spatially distributed assessment of individual quality parameters is possible through irrigation water quality mapping. GIS can therefore be used to visualize such maps and make comparative evaluations. Nowadays, groundwater has been assessed for its suitability for irrigation and drinking purposes using the Irrigation Water Quality Index (IWQI) in many regions worldwide [27,43]. For this study, the IWQI model, developed by Meireles et al. [44], was used to analyze the data. First, it was necessary to identify the most relevant irrigation parameters. Second, aggregation weights (wi) and quality measurement values (qi) were defined. According to the irrigation water quality characteristics required by the Food and Agriculture Organization (FAO) for agricultural uses, proposed by Ayers and Westcot [45], values of (qi) were calculated based on every chemical parameter, as shown in Table 2. Equation (2) is used in this model to calculate the irrigation water quality parameter (qi), which is determined by the tolerance limits of the parameters listed in Table 2:
q i = q i m a x x i j x i n f × q i a m p X a m p
where q i is the quality of each parameter, q i m a x stands for the maximum value of qi for every class, x i j stands for every parameter’s observed value, x i n f represents the lower limit class of the parameter, q i a m p is the amplitude of quality measurement class, and X a m p is the amplitude class. X a m p was evaluated based on the highest value determined in the analysis of the physicochemical properties of groundwater. According to Table 3, the parameter weights in the IWQI were calculated, as suggested by Meireles et al. [44]. Finally, the IWQI is calculated using Equation (3).
I Q W I = i = 1 n q i w i

2.4. Classification Learner

Using classification and prediction methods of machine learning can minimize time-consuming efforts by avoiding using many underlying calculations to predict a specific output [21]. When fed with reliable data, machine learning can predict appropriate categories (patterns), while an untrusted data source could inversely affect machine learning results. Therefore, it is vital to prepare the collected data and randomly divide them into two groups, one for training and the other for testing to assess the data quality. The latter group is essential to determine the accuracy of the constructed machine learning model. As soon as the machine learning algorithm is run on the input dataset, the model determines the outputs, so it is necessary to choose a model that is relevant to the task and the information presented and related to it [26,46]. Multiple models are suitable for many tasks, such as recognizing and processing images. Hence, the classification learner tool in Matlab is used to predict the irrigation water quality index (IWQI).
The input parameters to the classification learner toolbox in this study are water electrical conduction (EC), sodium concentration (Na), sodium adsorption ratio (SAR), chloride concentration (Cl), and the percentage of bicarbonate (HCO3), while the output parameter is IWQI. These parameters were computed based on the analysis of 166 groundwater samples. The samples were divided into 156 samples for training all classification learner models, and the remaining samples were used as testing data to identify the accuracy of the models. The IWQI state was defined based on specified range limits, as illustrated in Table 4. As shown in Table 5, training and testing data are distributed by water state based on training and testing processes.
The classification learner toolbox was used with the trained data to select the best-performing classifier. Then, the raw, standardized, and normalized data were applied for all classifiers to investigate the best way to obtain a high-accuracy classifier. Some samples of the raw data of the five inputs to all classifiers are illustrated in Table 6.
Next, the data are standardized and normalized to enhance the classifiers’ accuracies. In order to standardize the data, each column was divided by the standard deviation of the parameter column and then subtracted from the average of the column. The new parameter values ( X n e w ) can be determined as follows:
X n e w = X i μ σ
where μ refers to the mean and σ is the standard deviation of each variable of the five input variables of the trained data. The normalization can be developed using the maximum value of all data for each parameter. Therefore, the new transformation ratios become Equation (5):
X n e w = X i M a x X i

2.4.1. Support Vector Machine (SVM) Classifier

SVM is a machine learning tool that splits data into two classes via the hyperplane. The main objective of SVM is to reduce errors by customizing the hyperplane, which increases the tolerance limit. Since the optimization problem is convex rather than linear, SVM offers a unique solution compared with ANN models containing many local minima [26,47]. First, it must satisfy the maximum distance between points for each category. After that, the exact classification can happen. The hyperplane classifies all points outside its margin as different. Larger features make it difficult to categorize them. Good classification can occur with a large margin, as shown in Figure 2 [48,49].
The hyperplane mathematical representation in SVM is as follows:
W T · x = 0
where x and W are the vectors. The vector W refers to the weight vector. The training data can be simulated as:
x 1 , y 1 , x 2 , y 2 , x 3 , y 3 , . . , x n , y n R n
This means that ordered pairs can represent our data x n , y n , where xn refers to features and yn refers to the label of the xn. The classification function can be expressed as:
y = f x : R n 1 , 1
where the f(x) function will learn from the training data we feed it, and it will then be able to perform the classification process for future data or unseen data outside the original range of datasets. The training process is carried out to find the maximum amount of margin (M) that can be obtained. The margin is mathematically represented as follows:
M = 2 W
The relationship between M and W is inverse. The main equation for the SVM, which this work is based on, takes the following form:
min w , b 1 2 w 2   s u b j e c t   t o   y i w . x + b 1   f o r   a n y   i = 1 , . . , n

2.4.2. Weighted K-Nearest Neighbors (KNN) Classifier

For classification and regression, the KNN algorithm is used (most commonly) as a supervised learning algorithm. Datasets can be resampled, and this algorithm can calculate missing magnitudes. This method uses the k closest neighbors (data points) to predict the class of a new variable. Unlike model-based algorithms, instance-based learning uses whole training cases to predict the output of unseen data instead of learning by weights from training data. Based only on the number of points closest to a new point, the k-nearest neighbors method neglects much information. The steps of this method are summarized as follows:
  • The value of the variable k, which expresses the number of neighbors, is determined.
  • The distances between a new point and those in the dataset are calculated.
  • After arranging the points according to the minimum distance calculated in the previous step, the number of adjacent ones is calculated.
  • The class for the neighbors is defined.
  • Finally, the class with the most neighbors is the expected class for this point.
Figure 3 shows an example with the two classes represented in the red hexagon and the other in the green triangle. The new data point, represented by the question mark in the small circle, can be classified based on number of the red hexagons and green triangles. As the red hexagon class is dominant in the inner circle in this example, the new data point here must be classified to be in the red hexagon class.

3. Results

3.1. Chemical Composition of the Study Area

The FAO’s standards for agricultural purposes proposed by Ayers and Westcot [45] are compared with all physicochemical parameters in this study. Groundwater in the study area shows significant differences in chemical composition. The values of pH ranged from 7.35 to 8.19, averaging 7.71. For the electrical conductivity (EC), the values varied from 620.00 µδ/cm to 5920.00 µδ/cm with an average of 2475.75 µδ/cm, where the acceptable level of EC is 3000 µδ/cm according to FAO guidelines [45]. Therefore, 80.72% of Adrar’s electrical conductivity (EC) values are within the acceptable limits for irrigation purposes. Groundwater in the research area contains calcium concentrations ranging from 1.07 to 15.10 mEq/L. Consequently, all samples are within the permissible range of the FAO recommendations, which set a maximum value of 20 mEq/L [45]. It was observed that magnesium values varied from 0.65 to 14.63 mEq/L with a mean value of 4.90 mEq/L. So, about 50.6% of samples are within the standards stipulated by the FAO (<5 mEq/L) [45]. Sodium levels range from 1.52 mg/L to 38.70 mg/L, within FAO standard limits (<40 mEq/L) [45]. About 97.59% of the potassium values of Adrar are within the acceptable limits for irrigation purposes stipulated by the FAO (<2 mEq/L) [45]. Throughout this study, the sulfate value ranged from 2.08 to 20.83 mEq/L. The FAO guidelines stipulate a maximum value of 20 mEq/L for samples, which is met by 98.79% of samples. With a mean concentration of 0.77 mEq/L, the nitrate concentration in groundwater samples ranges from 0.12 to 3.02 mEq/L. About of 98.19% of chloride values respect the FAO guidelines. The concentration of bicarbonate ranges from 0.75 to 4.35 mEq/L. Observations show that all samples are in the permissible range of 10 mEq/L, stipulated by the FAO [45].

3.2. Irrigation Water Quality Results

Calculated SAR values range from 1.01 to 13.71, with a mean and standard deviation of 5.45 and 1.95, respectively. Generally, every sample whose SAR value ranges between 0 and 18 qualifies as an excellent or good irrigated area, as in our study [50,51,52]. Results of the calculated IWQI for the region of Adrar are presented in Table 7 and Figure 4. There was a wide range of IWQI values, ranging from 3.64 to 93.77, with an average of 41.81. According to Meireles et al. [44], the IWQI was divided into four categories: (i) excellent or very good, when IWQI is more than 70; (ii) good, when IWQI is between 55 and 70; (iii) satisfactory, when IWQI is between 40 and 55; and (iv) inappropriate or unsuitable, when IWQI is below 40. In our study area, the analysis concluded that 16 samples fell into the very good category, representing 9.64% of the total sample set. There were approximately 12.05% of samples deemed good, and there were approximately 21.08% deemed satisfactory. In addition, 95 samples were categorized as unsuitable, accounting for 57.23% of all samples examined.

3.3. Artificial Intelligence

In this section, the classification learners’ prediction accuracy results are reported. First, the input and output data were specified in the workspace in the MATLAB learner toolbox, and then the command Classification Learner was written in the command box. The input and output files must be identified from the workspace on a new session page. The input parameters were determined, and the last column was kept as the output. A 10-fold cross-validation was selected to ensure a good training process leading to a stable classification model.
When all of the classification learners were used with the raw, standardized, or normalized data, the SVM and KNN developed the highest prediction accuracy for the trained data, so the results of the SVM and KNN are reported here.

3.3.1. SVM Results for Standardized Data

The standardized data can be obtained using Equation (1). For the standardized data, the cubic SVM gave the highest prediction accuracy of 92.9%. Figure 5 shows data samples’ distribution with correct and incorrect prediction as a scatter plot of cubic SVM. In this plot, the name of the trained file appears as input_av with 156 observations. Five parameters are used as predictors. The incorrectly predicted points are marked with colored crosses (x). The codes 1, 2, 3, and 4 on the x and y axes in Figure 5 refer to very good, good, satisfactory, and unsuitable IWQI states, respectively. Figure 6 illustrates the confusion matrix of the cubic SVM. As can be seen from Figure 6a, 14 observations exhibit very good IWQI. The cubic SVM classifier correctly predicts thirteen out of fourteen samples; one sample is incorrect and belongs to the good IWQI state. Correct diagnoses are highlighted in green, while incorrect diagnoses are highlighted in red. For the good IWQI state, the cubic SVM correctly predicts 15 of 18 samples, with three incorrect samples, one for satisfactory and two samples for the very good IWQI state. Therefore, the prediction accuracy of the good IWQI state is 83% as shown in Figure 6b. The highest prediction accuracy is for the unsuitable IWQI state where the cubic SVM correctly predicts 91 from 92 samples, with an accuracy of 99%. The total accuracy of the cubic SVM is 92.9% for all trained data samples.
A receiver operating characteristic (ROC) is shown in Figure 7. ROC plots show the current classifier performance with the true positive rate (TPR) on the y-axis and false positive rate (FPR) on the x-axis. Based on the figure mentioned above, 1% of the observations were incorrectly assigned to the positive category based on an FPR of 0.01, while 93% of the observations are correctly classified as positive by the classifier, as indicated by the TPR of 0.93. It is considered a poor classification result when the ROC curve makes a 45° angle, as opposed to a perfect classification result when it makes an acute angle. A classifier’s accuracy can be measured by its area under the curve (AUC). Classifier accuracy increases with increasing AUC. It can be seen from Figure 7 that the AUC is 100%, meaning that the classifier performed better than expected.
Finally, the results of all classifiers are presented in Table 8, explaining the accuracy of all classifiers with the trained (raw, standardized, and normalized) data. The results of applying all classifiers on the trained data indicated that the best performance for the raw data is with the linear support vector machine (SVM) where the prediction accuracy was 92.9%. High accuracy can be obtained through the cubic SVM (92.9%) when applying all classifiers with the standardized data. In addition, the cubic SVM (94.2%) can develop high accuracy for the normalized data. The weighted k-nearest neighbors (KNN) classifier generates the second-best prediction accuracy with raw, standardized, and normalized data of 92.3%, 92.3%, and 92.9%, respectively. Therefore, the two classifiers SVM and KNN are presented in the following section since they develop higher prediction accuracy for the trained data.

3.3.2. SVM Results for Normalized Data

The normalized data can be obtained using Equation (2). For the normalized data, the cubic SVM gave the highest prediction accuracy of 94.2%. Figure 8 shows the confusion matrix of the cubic SVM with a prediction accuracy of 94.2%. Figure 8a shows that the number of observations expressing very good IWQI is 14 samples, which are correctly predicted. For good IWQI, 15 of 18 samples were correctly predicted, two incorrect samples were predicted as very good, and one sample was satisfactory. The prediction accuracy for good IWQI was 83% as presented in Figure 8b. For the satisfactory state, the prediction accuracy was 88%, where 28 of 32 samples were correctly predicted and the other four incorrect samples were unsuitable. A total of 90 out of 92 samples were correctly predicted in the case of unsuitable IWQI, and two samples were incorrectly predicted as the satisfactory IWQI state.
An FPR of 0.01, which indicates that 1% of the observations were classified incorrectly, can be seen in Figure 9. The TPR is 1.0, indicating that the classifier correctly assigns 100% of the observations to the positive class. This figure shows a classifier that performs better due to the 100% AUC.

3.3.3. SVM Results for Raw Data

When applying all classifiers on the raw data of the inputs (EC, Na, SAR, Cl, HCO3), the linear SVM developed the highest prediction accuracy of 92.9%. Figure 10 shows the distribution of the correct and incorrect samples with linear SVM. The incorrectly predicted samples appear as colored crosses. Figure 11 shows the confusion matrix of the linear SVM. The prediction accuracies for IWQI state were 79% (11/14), 83% (15/18), 91% (29/32), and 98% (90/92) for very good, good, satisfactory, and unsuitable IWQI, respectively. The inaccurate predictions were 21% (3/14), 17% (3/18), 9% (3/32), and 2% (2/92) for very good, good, satisfactory, and unsuitable IWQI, respectively. For example, for the satisfactory IWQI state, the linear SVM predicts 29 samples as the satisfactory IWQI state, one as the good IWQI state, and two as the unsuitable IWQI state.

3.3.4. KNN Results for Normalized Data

The KNN classifier developed 94.2% prediction accuracy with the normalized data as in Equation (2). Figure 12 shows the results of the KNN classifier with 94.2% prediction accuracy. Figure 12 illustrates that the prediction accuracies were 100% (14/14), 83% (15/18), 81% (26/32), and 100% (92/92) for the very good, good, satisfactory, and unsuitable IWQI states, respectively. As seen in Figure 13, both positive and negative predictive values are shown. Based on Figure 13, we can determine the positive and negative predictive values. According to the figure, the predicted class 3 for satisfactory appears 29 times; 26 of these are correct, with an accuracy of 90% for the satisfactory IWQI state (class 3), with a 10% error rate for the good IWQI state (class 2).
The constructed SVM with standardized, normalized, and raw data was tested with ten samples to verify the accuracy of the constructed model. Table 9 shows the results of applying the classifiers with different data. The prediction accuracies of the classifiers with the standardized, normalized, and raw data were 100%, 100%, and 90%, respectively. The cubic SVM with the normalized data develops the highest prediction accuracy for training and testing samples (94.2% for training, 100% for testing).

4. Conclusions

Groundwater is an essential resource for drinking and irrigation in many parts of the world, particularly in arid regions. However, in many areas of the world, groundwater is unsafe to drink and can negatively affect crop production due to high concentrations of contaminants such as industrial chemicals or agricultural pesticides. This study aimed to assess the water quality for irrigation purposes in the region of Adrar and to develop a classification model to predict the irrigation water quality index (IWQI) class. Additionally, the sodium adsorption ratio (SAR) was assessed to determine the effects of water on soil structural behavior. Analyzing irrigation water quality can improve agricultural productivity and prevent plant damage. The calculation of SAR for the groundwater samples in the study area showed that they belong to the “very good” and “good” classes. Based on available data, it can be observed that most physicochemical parameters are within the Food and Agriculture Organization (FAO) criterion for agricultural purposes. Results for the calculated IWQI in the study area ranged from 3.64 to 93.77, with an average of 41.81. Based on the IWQI results, over 57.23% of the study area falls within the unsuitable category, mainly in the south and northeast parts of the study area. On the other hand, approximately 12.05% of samples were deemed good, and about 21.08% were considered satisfactory. The rest of the study area, about 9.64%, falls within the “high restriction” category, which is dominant in the western parts of the study area.
Artificial intelligence was used to predict groundwater quality for irrigation in the study area. SVM with the normalized data emerged as the optimal model for predicting the IWQI, where the accuracy for training and testing samples was 94.2% and 100%, respectively. This study has successfully developed an accurate SVM model for IWQI in arid areas. By combining physicochemical data, SAR, IWQI, and GIS, we can comprehensively understand water quality and its governing mechanisms in the study area. In this study, the methodology used to summarize the monitoring data could be an efficient and valuable tool for reporting the data to decision-makers. According to our findings, artificial intelligence techniques can enhance groundwater quality management plans in Adrar. By predicting the irrigation water quality index (IWQI) using hydrochemical parameters and machine learning techniques, the study provides a means to evaluate the suitability of groundwater for irrigation and potentially drinking purposes. Furthermore, the model may be adopted in other desert regions where the costs of estimating several water quality variables are high and might be restrictive. Further improvements may also be achieved by including more hydrochemical parameters and applications in different climate regimes.

Author Contributions

Methodology, A.D., H.G.A. and H.A.; writing—original draft preparation, A.D., S.S.M.G., E.A., A.A., A.A.A.D. and H.G.A.; writing—review and editing, A.D., S.S.M.G., H.A., A.A., E.A. and H.G.A. All authors have read and agreed to the published version of the manuscript.

Funding

Researchers would like to thank the Deanship of Scientific Research, Qassim University for funding the publication of this project.

Institutional Review Board Statement

Not applicable.

Informed Consent Statement

Not applicable.

Data Availability Statement

The data are available on request to the first author.

Acknowledgments

The authors would like to thank the editor and the four reviewers for their thoughtful and detailed comments on our paper.

Conflicts of Interest

The authors have no conflict of interest to declare.

References

  1. Rao, N.S.; Dinakar, A.; Sravanthi, M.; Kumari, B.K. Geochemical characteristics and quality of groundwater evaluation for drinking, irrigation, and industrial purposes from a part of hard rock aquifer of South India. Environ. Sci. Pollut. Res. 2021, 28, 31941–31961. [Google Scholar] [CrossRef] [PubMed]
  2. Hrudey, S.E.; Hrudey, E.J.; Pollard, S.J. Risk management for assuring safe drinking water. Environ. Int. 2006, 32, 948–957. [Google Scholar] [CrossRef] [PubMed] [Green Version]
  3. Edmunds, W.M. Renewable and non-renewable groundwater in semi-arid and arid regions. In Developments in Water Sciece; Elsevier: Amsterdam, The Netherlands, 2003; Volume 50, pp. 265–280. [Google Scholar]
  4. Mays, L.W. Groundwater resources sustainability: Past, present, and future. Water Resour. Manag. 2013, 27, 4409–4424. [Google Scholar] [CrossRef]
  5. Oweis, T.; Hachum, A. Water harvesting and supplemental irrigation for improved water productivity of dry farming systems in West Asia and North Africa. Agric. Water Manag. 2006, 80, 57–73. [Google Scholar] [CrossRef]
  6. Akhtar, S.S.; Li, G.; Andersen, M.N.; Liu, F. Biochar enhances yield and quality of tomato under reduced irrigation. Agric. Water Manag. 2014, 138, 37–44. [Google Scholar] [CrossRef]
  7. Besser, H.; Mokadem, N.; Redhouania, B.; Rhimi, N.; Khlifi, F.; Ayadi, Y.; Omar, Z.; Bouajila, A.; Hamed, Y. GIS-based evaluation of groundwater quality and estimation of soil salinization and land degradation risks in an arid Mediterranean site (SW Tunisia). Arab. J. Geosci. 2017, 10, 350. [Google Scholar] [CrossRef]
  8. Jiang, Y.; Wu, Y.; Groves, C.; Yuan, D.; Kambesis, P. Natural and anthropogenic factors affecting the groundwater quality in the Nandong karst underground river system in Yunan, China. J. Contam. Hydrol. 2009, 109, 49–61. [Google Scholar] [CrossRef]
  9. Panneerselvam, B.; Ravichandran, N.; Kaliyappan, S.P.; Karuppannan, S.; Bidorn, B. Quality and Health Risk Assessment of Groundwater for Drinking and Irrigation Purpose in Semi-Arid Region of India Using Entropy Water Quality and Statistical Techniques. Water 2023, 15, 601. [Google Scholar] [CrossRef]
  10. Tung, T.M.; Yaseen, Z.M. A survey on river water quality modelling using artificial intelligence models: 2000–2020. J. Hydrol. 2020, 585, 124670. [Google Scholar]
  11. Babiker, I.S.; Mohamed, M.A.; Hiyama, T. Assessing groundwater quality using GIS. Water Resour. Manag. 2007, 21, 699–715. [Google Scholar] [CrossRef]
  12. Patrinley, J.R.; Berkowitz, S.T.; Zakria, D.; Totten, D.J.; Kurtulus, M.; Drolet, B.C. Lessons from operations management to combat the COVID-19 pandemic. J. Med. Syst. 2020, 44, 1–2. [Google Scholar] [CrossRef]
  13. Xiang, X.; Li, Q.; Khan, S.; Khalaf, O.I. Urban water resource management for sustainable environment planning using artificial intelligence techniques. Environ. Impact Assess. Rev. 2021, 86, 106515. [Google Scholar] [CrossRef]
  14. Jha, K.; Doshi, A.; Patel, P. Intelligent irrigation system using artificial intelligence and machine learning: A comprehensive review. Int. J. Adv. Res. 2018, 6, 1493–1502. [Google Scholar] [CrossRef] [Green Version]
  15. Ibrahim, H.; Yaseen, Z.M.; Scholz, M.; Ali, M.; Gad, M.; Elsayed, S.; Khadr, M.; Hussein, H.; Ibrahim, H.H.; Eid, M.H. Evaluation and prediction of groundwater quality for irrigation using an integrated water quality indices, machine learning models and GIS approaches: A representative case study. Water 2023, 15, 694. [Google Scholar] [CrossRef]
  16. Lowe, M.; Qin, R.; Mao, X. A review on machine learning, artificial intelligence, and smart technology in water treatment and monitoring. Water 2022, 14, 1384. [Google Scholar] [CrossRef]
  17. Singh, B.; Sihag, P.; Singh, K. Modelling of impact of water quality on infiltration rate of soil by random forest regression. Model. Earth Syst. Environ. 2017, 3, 999–1004. [Google Scholar] [CrossRef]
  18. Leong, W.C.; Bahadori, A.; Zhang, J.; Ahmad, Z. Prediction of water quality index (WQI) using support vector machine (SVM) and least square-support vector machine (LS-SVM). Int. J. River Basin Manag. 2021, 19, 149–156. [Google Scholar] [CrossRef]
  19. Tan, G.; Yan, J.; Gao, C.; Yang, S. Prediction of water quality time series data based on least squares support vector machine. Procedia Eng. 2012, 31, 1194–1199. [Google Scholar] [CrossRef] [Green Version]
  20. Wu, W.; Dandy, G.C.; Maier, H.R. Protocol for developing ANN models and its application to the assessment of the quality of the ANN model development process in drinking water quality modelling. Environ. Model. Softw. 2014, 54, 108–127. [Google Scholar] [CrossRef]
  21. Derdour, A.; Jodar-Abellan, A.; Pardo, M.Á.; Ghoneim, S.S.; Hussein, E.E. Designing Efficient and Sustainable Predictions of Water Quality Indexes at the Regional Scale Using Machine Learning Algorithms. Water 2022, 14, 2801. [Google Scholar] [CrossRef]
  22. Gaagai, A.; Aouissi, H.A.; Bencedira, S.; Hinge, G.; Athamena, A.; Haddam, S.; Gad, M.; Elsherbiny, O.; Elsayed, S.; Eid, M.H. Application of Water Quality Indices, Machine Learning Approaches, and GIS to Identify Groundwater Quality for Irrigation Purposes: A Case Study of Sahara Aquifer, Doucen Plain, Algeria. Water 2023, 15, 289. [Google Scholar] [CrossRef]
  23. Samtio, M.S.; Rajper, K.H.; Mastoi, A.S.; Sadaf, R.; Rajper, R.H.; Hakro, A.A.; Agheem, M.H.; Lanjwani, M.F. Hydrochemical assessment of groundwater from taluka Dahili, Thar Desert, Pakistan, for irrigation purpose using water quality indices. Int. J. Environ. Anal. Chem. 2023, 103, 2368–2384. [Google Scholar] [CrossRef]
  24. Pham, H.; Rahman, M.M.; Nguyen, N.C.; Le Vo, P.; Le Van, T.; Ngo, H. Assessment of surface water quality using the water quality index and multivariate statistical techniques—A case study: The upper part of Dong Nai river basin, Vietnam. J. Water Sustain. 2017, 7, 225–245. [Google Scholar]
  25. Abdel-Fattah, M.K.; Mokhtar, A.; Abdo, A.I. Application of neural network and time series modeling to study the suitability of drain water quality for irrigation: A case study from Egypt. Environ. Sci. Pollut. Res. 2021, 28, 898–914. [Google Scholar] [CrossRef]
  26. Mokhtar, A.; Elbeltagi, A.; Gyasi-Agyei, Y.; Al-Ansari, N.; Abdel-Fattah, M.K. Prediction of irrigation water quality indices based on machine learning and regression models. Appl. Water Sci. 2022, 12, 76. [Google Scholar] [CrossRef]
  27. Ahmed, M.T.; Hasan, M.Y.; Monir, M.U.; Biswas, B.K.; Quamruzzaman, C.; Junaid, M.; Samad, M.A.; Rahman, M.M. Evaluation of groundwater quality and its suitability by applying the geospatial and IWQI techniques for irrigation purposes in the southwestern coastal plain of Bangladesh. Arab. J. Geosci. 2021, 14, 233. [Google Scholar] [CrossRef]
  28. M’nassri, S.; El Amri, A.; Nasri, N.; Majdoub, R. Estimation of irrigation water quality index in a semi-arid environment using data-driven approach. Water Supply 2022, 22, 5161–5175. [Google Scholar] [CrossRef]
  29. Haider, H.; Al-Salamah, I.S.; Ghumman, A.R. Development of groundwater quality index using fuzzy-based multicriteria analysis for Buraydah, Qassim, Saudi Arabia. Arab. J. Sci. Eng. 2017, 42, 4033–4051. [Google Scholar] [CrossRef]
  30. Li, L.; Rong, S.; Wang, R.; Yu, S. Recent advances in artificial intelligence and machine learning for nonlinear relationship analysis and process control in drinking water treatment: A review. Chem. Eng. J. 2021, 405, 126673. [Google Scholar] [CrossRef]
  31. Zoui, M.A.; Bentouba, S.; Bourouis, M. The Potential of Solar Thermoelectric Generator STEG for Implantation in the Adrar Region. Alger. J. Renew. Energy Sustain. Dev 2020, 2, 17–27. [Google Scholar] [CrossRef]
  32. Bassoud, A.; Khelafi, H.; Mokhtari, A.M.; Bada, A. Evaluation of summer thermal comfort in arid desert areas. Case study: Old adobe building in Adrar (South of Algeria). Build. Environ. 2021, 205, 108140. [Google Scholar] [CrossRef]
  33. Hadidi, A.; Saba, D.; Benmedjahed, M.; Blal, M. An overview on the development of the irrigation system in the province of Adrar (Algeria). Arab. J. Geosci. 2022, 15, 854. [Google Scholar] [CrossRef]
  34. Djamai, M.; Merzouk, N.K. Wind farm feasibility study and site selection in Adrar, Algeria. Energy Procedia 2011, 6, 136–142. [Google Scholar] [CrossRef] [Green Version]
  35. Nasri, B.; Kalloum, S.; Benhamza, M.; Taha, A.; Benatiallah, D. Water quality study of the foggaras in the Adrar region (southwest Algeria) using WQI and GIS. Arab. J. Geosci. 2022, 15, 1758. [Google Scholar] [CrossRef]
  36. Hakimi, Y.; Orban, P.; Deschamps, P.; Brouyere, S. Hydrochemical and isotopic characteristics of groundwater in the Continental Intercalaire aquifer system: Insights from Mzab Ridge and surrounding regions, North of the Algerian Sahara. J. Hydrol. Reg. Stud. 2021, 34, 100791. [Google Scholar] [CrossRef]
  37. Al-Gamal, S.A. An assessment of recharge possibility to North-Western Sahara Aquifer System (NWSAS) using environmental isotopes. J. Hydrol. 2011, 398, 184–190. [Google Scholar] [CrossRef]
  38. Boualem, R.; Bachir, A.; Rabah, K. The foggara: A traditional system of irrigation in arid regions. GeoScience Eng. 2014, 60, 32–39. [Google Scholar] [CrossRef] [Green Version]
  39. Muyen, Z.; Moore, G.A.; Wrigley, R.J. Soil salinity and sodicity effects of wastewater irrigation in South East Australia. Agric. Water Manag. 2011, 99, 33–41. [Google Scholar] [CrossRef]
  40. Derdour, A.; Guerine, L.; Allali, M. Assessment of drinking and irrigation water quality using WQI and SAR method in Maâder sub-basin, Ksour Mountains, Algeria. Sustain. Water Resour. Manag. 2021, 7, 8. [Google Scholar] [CrossRef]
  41. Wilcox, L. Classification and Use of Irrigation Waters; US Department of Agriculture: Washington, DC, USA, 1955.
  42. Musa, A.I.; Tsubo, M.; Ali-Babiker, I.-E.A.; Iizumi, T.; Kurosaki, Y.; Ibaraki, Y.; El-Hag, F.; Tahir, I.S.; Tsujimoto, H. Relationship of irrigated wheat yield with temperature in hot environments of Sudan. Theor. Appl. Climatol. 2021, 145, 1113–1125. [Google Scholar] [CrossRef]
  43. Şener, Ş.; Varol, S.; Şener, E. Evaluation of sustainable groundwater utilization using index methods (WQI and IWQI), multivariate analysis, and GIS: The case of Akşehir District (Konya/Turkey). J. Environ. Sci. Pollut. Res. 2021, 28, 47991–48010. [Google Scholar] [CrossRef] [PubMed]
  44. Meireles, A.C.M.; Andrade, E.M.d.; Chaves, L.C.G.; Frischkorn, H.; Crisostomo, L.A. A new proposal of the classification of irrigation water. Rev. Ciência Agronômica 2010, 41, 349–357. [Google Scholar] [CrossRef] [Green Version]
  45. Ayers, R.; Westcot, D. Food, agriculture organization of the United Nations (FAO), water quality for agriculture. Irrig. Drain. Rome Pap. 1994, 29, 77044-2. [Google Scholar]
  46. El Bilali, A.; Taleb, A. Prediction of irrigation water quality parameters using machine learning models in a semi-arid environment. J. Saudi Soc. Agric. Sci. 2020, 19, 439–451. [Google Scholar] [CrossRef]
  47. Kouadri, S.; Elbeltagi, A.; Islam, A.R.M.; Kateb, S. Performance of machine learning methods in predicting water quality index based on irregular data set: Application on Illizi region (Algerian southeast). Appl. Water Sci. 2021, 11, 190. [Google Scholar] [CrossRef]
  48. Benmahamed, Y.; Kherif, O.; Teguar, M.; Boubakeur, A.; Ghoneim, S.S. Accuracy improvement of transformer faults diagnostic based on DGA data using SVM-BA classifier. Energies 2021, 14, 2970. [Google Scholar] [CrossRef]
  49. Zhang, Y.; Li, J.; Fan, X.; Liu, J.; Zhang, H. Moisture prediction of transformer oil-immersed polymer insulation by applying a support vector machine combined with a genetic algorithm. Polymers 2020, 12, 1579. [Google Scholar] [CrossRef]
  50. Asadi, E.; Isazadeh, M.; Samadianfard, S.; Ramli, M.F.; Mosavi, A.; Nabipour, N.; Shamshirband, S.; Hajnal, E.; Chau, K.-W. Groundwater quality assessment for sustainable drinking and irrigation. Sustainability 2019, 12, 177. [Google Scholar] [CrossRef] [Green Version]
  51. Hamdi, L.; Defaflia, N.; Merghadi, A.; Fehdi, C.; Yunus, A.P.; Dou, J.; Pham, Q.B.; Abdo, H.G.; Almohamad, H.; Al-Mutiry, M. Ground Surface Deformation Analysis Integrating InSAR and GPS Data in the Karstic Terrain of Cheria Basin, Algeria. Remote Sens. 2023, 15, 1486. [Google Scholar] [CrossRef]
  52. Reddy, N.M.; Saravanan, S.; Almohamad, H.; Al Dughairi, A.A.; Abdo, H.G. Effects of Climate Change on Streamflow in the Godavari Basin Simulated Using a Conceptual Model including CMIP6 Dataset. Water 2023, 15, 1701. [Google Scholar] [CrossRef]
Figure 1. Study area.
Sustainability 15 09687 g001
Figure 2. SVM algorithm indicates the margin separating two classes.
Sustainability 15 09687 g002
Figure 3. KNN classifier based on k-parts where the red hexagon and the green triangle represent class 1 and 2, respectively.
Sustainability 15 09687 g003
Figure 4. Geospatial distribution of IWQI in the study area.
Sustainability 15 09687 g004
Figure 5. Scatter plot of cubic SVM with standardized data.
Sustainability 15 09687 g005
Figure 6. Confusion matrices: (a) the number of correct and incorrect observations, (b) true positive rate/false negative rate for cubic SVM based on standardized data, where the green and red cells refer to the correct and incorrect prediction, respectively.
Sustainability 15 09687 g006
Figure 7. The ROC result of cubic SVM for standardized data.
Sustainability 15 09687 g007
Figure 8. Confusion matrices: (a) the number of correct and incorrect observations, (b) normalized cubic SVM true positive rate/false negative rate, where the green and red cells refer to the correct and incorrect prediction, respectively.
Sustainability 15 09687 g008
Figure 9. The ROC result of cubic SVM for normalized data.
Sustainability 15 09687 g009
Figure 10. Scatter plot of linear SVM with raw data.
Sustainability 15 09687 g010
Figure 11. Confusion matrices: (a) the number of correct and incorrect observations, (b) linear SVM true positives/false negatives based on raw data, where the green and red cells refer to the correct and incorrect prediction, respectively.
Sustainability 15 09687 g011
Figure 12. The confusion matrix of KNN with normalized data.
Sustainability 15 09687 g012
Figure 13. KNN confusion matrix for positive predictive values and negative predictive values. The green-colored cells represent the correct prediction while the red-colored cells represent incorrect prediction.
Sustainability 15 09687 g013
Table 1. Descriptive statistics of physicochemical parameters of irrigation water.
ParameterUnitMinMaxMeanSD
C a + + mEq/L1.0715.104.902.11
M g + + mEq/L0.6514.635.522.56
N a + mEq/L1.5238.7013.035.93
K + mEq/L0.155.260.650.47
C l mEq/L1.9735.2112.376.06
S O 4 2 mEq/L2.0820.838.353.59
H C O 3 mEq/L0.754.352.600.49
N O 3 mEq/L0.123.020.740.41
ECµδ/cm620.005920.002475.75927.00
pH--7.358.197.710.19
T°C21.324.823.42.62
Table 2. Limiting values for parameters used in quality assessments (qi).
ParametersLimiting Values
q i 0–3535–6060–8585–100
H C O 3 H C O 3 < 1   o r   H C O 3 8.5 4.5 H C O 3 < 8.5 1.5 H C O 3 < 4.5 1 H C O 3 < 1.5
E C ( u S   c m 1 ) E C < 750   o r
E C 3000
1500 E C < 3000 750 E C < 1500 200 E C < 750
S A R S A R < 2   o r   S A R 12 6 S A R < 12 3 S A R < 6 2 S A R < 3
N a + N a < 2   o r   N a 12 6 N a < 12 3 N a < 6 2 N a < 3
C l C l < 1   o r   C l 10 7 C l < 10 4 C l < 7 1 C l < 4
Table 3. Relative weights used to calculate IWQI.
ParametersSARECClNaHCO3Total
w i 0.1890.2110.1940.2040.2021
Table 4. The state of irrigation water based on IWQI limits.
Range of IWQIIrrigation Water State
70–100Very good
55–70Good
40–55Satisfactory
0–40Unsuitable
Table 5. Distribution of the collected data based on the irrigation water state.
Irrigation Water StateVery GoodGoodSatisfactoryUnsuitableTotal
Training14183292156
Testing223310
Table 6. Computed input parameters and IWQI state of some of the trained data samples.
ECNaHCO3ClSARIWQIIWQI State
83.33122.2575.9092.6194.9693.77Very Good
88.55119.7170.0092.6194.5893.08Very Good
63.3371.5947.5080.5488.0269.82Good
69.6772.6843.6171.3987.9768.81Good
51.1740.4350.3339.5875.4551.15Satisfactory
43.6730.2958.0027.8477.0247.07Satisfactory
40.1712.1737.0527.8473.3637.71Unsuitable
36.671.3062.6227.8460.9937.58Unsuitable
Table 7. IWQI results of the study area.
NameIWQITypeNameIWQITypeNameIWQITypeNameIWQIType
TAA93.77VGSAID52.25StRH38.32UsSALI30.78Us
TAZ93.08VGKDR52.00StBKR38.12UsTAAT29.92Us
TAB84.95VGTAMT51.15StHMM38.00UsALF229.67Us
TIN84.15VGMNSR47.07StBHH37.90UsISSA229.42Us
ASDI83.41VGRSL46.32StFNL237.81UsRGN28.82Us
TIL81.16VGAMR46.18StTILL37.71UsCHM28.59Us
TIM80.21VGTITAF45.60StRBT37.58UsFAT28.49Us
KSRH73.22VGKBL45.52StGHRT37.10UsABR227.80Us
TIL73.05VGTMT245.36StKSN36.98UsCHRW27.55Us
ABD72.27VGKNN44.99StHDJD36.82UsDRA27.55Us
TIL272.13VGYCF44.74StBAAM36.61UsAITM27.12Us
TIB71.86VGABN44.35StTEBN36.51UsIGOS27.01Us
OUF71.04VGFNGL43.75StSHL36.44UsTIMA26.66Us
SNLGZ70.95VGRTB43.63StBOR36.40UsLAGH26.61Us
AERO70.51VGRCHD43.28StWHB36.12UsAJIR26.53Us
BGM70.25VGMHD42.96StGBR35.81UsGDM25.43Us
TIL369.82GdTIMI242.82StZGL35.57UsNOM24.77Us
TAA68.81GdTID42.27StSYCF35.44UsBKRI24.36Us
GUR68.42GdAZO41.75StSHL35.34UsSML23.76Us
MHD66.80GdTIMO41.68StABBO35.13UsTKK23.40Us
AKBR65.87GdBSL41.48StYHIA34.91UsHJMH21.67Us
TZA65.72GdBHH41.19StCHTB34.90UsBRL21.23Us
ATAR65.70GdAIAN41.18StFNFL34.69UsTWT21.11Us
BARB65.66GdADM41.09StFTH34.61UsAWM20.96Us
MAIZ65.36GdCHRF40.57StLHMR34.37UsTSFT20.39Us
SBAA65.35GdBNZT40.56StTGH34.35UsNEFS19.06Us
SLM65.06GdCHKH40.53StZKNT34.23UsZKKR18.28Us
TIL464.75GdTNRT40.25StMSS34.05UsAZRF16.21Us
TIL564.53GdTIMI340.10StTLB34.04UsAMS15.77Us
LAA64.23GdMNC39.90UsHFR33.79UsCHRW14.88Us
TMR63.96GdZGH39.84UsTMR33.60UsAWLF14.65Us
TYB60.48GdIKKIS39.84UsNZA33.54UsDGHA14.65Us
YAK57.47GdMHD39.77UsKID33.50UsTLAL13.26Us
KORT57.13GdAKR39.67UsSMD33.43UsARR11.94Us
ISSA56.55GdTKN39.60UsTIAF33.29UsTSAM10.34Us
TIMI55.89GdAWLF39.59UsABB232.60UsHBL9.68Us
KABR54.93StMSTR39.47UsABLI32.54UsTLH9.68Us
MRG54.43StALM39.14UsMCN32.36UsMLK8.73Us
ARPT253.66StRKIA38.91UsZGLF32.33UsLAAR7.48Us
BLKB52.83StTRR38.83UsSALI32.04UsTRR3.64Us
BALI52.78StMLD38.63UsAGHIL31.19Us
TIT52.76StTDM38.46UsBGL30.90Us
VG: Very good, Gd: Good, St: Satisfactory, Us: Unsuitable.
Table 8. Accuracies of all classifiers.
Training Data
ClassifierRaw DataStandardizedNormalized
Cubic KNN84.685.985.3
Fine KNN89.189.191
Medium KNN 86.585.987.2
Cosine KNN82.78483.3
Corase KNN595959
Weighted KNN92.392.392.9
Corase tree89.186.589.1
Medium tree 86.58487.2
Quadratic discriminant88.585.388.5
Linear discriminant88.588.589.7
Ensemble bagged trees87.889.790.4
Ensemble boosted trees595959
Ensemble subspace KNN86.585.388.5
Ensemble subspace discriminant87.887.287.2
Linear SVM92.99192.3
Ensemble RUSBoosted trees88.587.889.7
Fine Gaussian SVM76.375.675.6
Cubic SVM92.392.994.2
Medium Gaussian SVM92.390.492.9
Quadratic SVM92.389.191.7
Coarse Gaussian SVM83.382.182.1
Table 9. Prediction of the SVM classifier with standardized, normalized, and raw data.
ECNaHCO3ClSARIWQIActual Water Type1*2*3*
69.3367.6161.1578.4385.4372.13Very GoodVery GoodVery GoodVery Good
72.3359.2865.5086.8076.3771.86Very GoodVery GoodVery GoodVery Good
60.6757.4649.0080.3181.2165.35GoodGoodGoodGood
70.0052.0348.8583.1272.3965.06GoodGoodGoodGood
53.0026.6764.0051.3170.5252.83SatisfactorySatisfactorySatisfactorySatisfactory
56.3328.4889.6727.8461.2352.78SatisfactorySatisfactorySatisfactorySatisfactory
52.6741.1658.6933.7178.5852.76SatisfactorySatisfactorySatisfactorySatisfactory
48.3319.4234.1027.8467.1639.14UnsuitableUnsuitableUnsuitableUnsuitable
40.00−13.1970.0027.8472.0738.91UnsuitableUnsuitableUnsuitablesatisfactory
44.6712.1742.9527.8467.9838.83UnsuitableUnsuitableUnsuitableUnsuitable
1* Cubic SVM with standardized data, 2* Cubic SVM with normalized data, 3* Linear SVM with raw data.
Disclaimer/Publisher’s Note: The statements, opinions and data contained in all publications are solely those of the individual author(s) and contributor(s) and not of MDPI and/or the editor(s). MDPI and/or the editor(s) disclaim responsibility for any injury to people or property resulting from any ideas, methods, instructions or products referred to in the content.

