
Alteration in Hydrologic Regimes and Dominant Influencing Factors in the Upper Heilong-Amur River Basin across Three Decades
1
Yunnan Key Laboratory of International River and Transboundary Eco-Security, Kunming 650091, China
2
Institute of International Rivers and Eco-Security, Yunnan University, Kunming 650091, China
*
Author to whom correspondence should be addressed.
Sustainability 2023, 15(13), 10391; https://doi.org/10.3390/su151310391
Submission received: 23 May 2023
/
Revised: 28 June 2023
/
Accepted: 28 June 2023
/
Published: 30 June 2023
(This article belongs to the Special Issue The 13th International Symposium on Cold Region Development Conference (ISCORD 2023))
Abstract
:The Heilong-Amur river basin (HARB) is the largest transboundary river in Asia and is primarily located in its cold region. With global warming and geopolitical cooperation strengthening between Russia and China, the hydrology change and water security risks are receiving increasing attention. This study utilized the linear regression, Mann–Kendall, and cumulative anomaly methods to analyze changes observed in the upper HARB’s streamflow and water levels over 30 years. The collation of outcomes derived from the methods mentioned above, the indicators of the hydrological alterations process, and the range of variability approach method (IHA–RVA), coupled with results gleaned from the double cumulative curve method, facilitate a thorough evaluation of the perturbations in hydrologic indicators, as well as the impacts of anthropogenic activities. The results showed that the overall hydrological regimes of both streamflow and water levels at the Luoguhe (LGH), the Shangmachang (SMC), and the Kalunshan (KLS) displayed a mild decrease from 1988 to 2017. The streamflow decreased by 58%, 42%, and 38%, and water levels decreased by 48%, 53%, and 59%, respectively, at each station after the mutations. LGH station recorded the highest decrease rate in streamflow at 8.28 × 10⁸ m3/a, whereas the steepest rate of decline in water levels was observed at KLS station at 0.05 m/a. Despite the decreasing trend in the high pulse count of streamflow across the three stations, a slight increase in the high pulse duration of streamflow was noted at SMC and KLS. Precipitation changes were the primary driving force behind runoff alterations, contributing 62%, 84%, and 90% at LGH, SMC, and KLS, respectively, significantly higher than the contribution from anthropogenic activities (38%, 16%, and 10%, respectively). These findings also underscore the suitability of the methodologies employed in this study for application in cold regions.
1. Introduction
The imminent threats of climate change, contributing to intensified water security risks in transboundary basins due to disrupted hydrological processes, have been highlighted in the 2020 UN World Water Development Report and the 2021 State of Climate Services—Water Report issued by the World Meteorological Organization (WMO) [1,2]. The evolving climate change landscape has instigated noticeable shifts in the hydrological processes of the cold regions, primarily owing to the steady contraction of permafrost and snow cover regions in the Northern Hemisphere [3]. Alterations in the cryosphere catalyze climate change and induce modifications in the surface hydrological processes, with rivers at high latitudes in the Northern Hemisphere showing heightened sensitivity [4,5]. China serves as the source for numerous transboundary rivers in Asia; this has given rise to a growing recognition of the water security challenges confronting these basins, as they are influenced by climate change and anthropogenic activities. These challenges have gradually magnified, evolving into national water security issues within China [6,7]. Among these challenges, regional response patterns and quantitative expressions of changes in the hydro-ecological processes in these transboundary basins have become key scientific topics within the study of transboundary water resources [8].
The Heilong-Amur river basin (HARB), positioned in northern Asia and recognized as the largest transboundary basin in Asia, falls within this high-latitude cold region, and its hydrological processes are experiencing substantial climate change impacts [9,10]. Furthermore, the strengthening geopolitical cooperation between China and Russia underscores the pressing need for an intensified focus on the water security risks in the HARB. The HARB is rich in water resources and provides sufficient water for industrial and agricultural production in northeastern China. Cooperation between China and Russia in addressing transboundary river challenges occurs across various facets, including integrated water resources planning, collaboration within the management and conservation of fisheries, water pollution prevention, water bodies monitoring, and flood control [11,12]. Within the context of climate change, there has been increasing scientific attention focusing on the water security risks and water ecology of the HARB [13]. Because the transboundary meteorological and hydrological data are difficult to obtain, the analysis of the characteristics of the hydrological regime alteration in the whole basin is still unclear.
Climate change and anthropogenic activities as two pivotal drivers of the hydrological alterations and variations in water quantity. Climate change affects the distribution of regional water resources mainly by changing the spatial and temporal distributions of temperature, evapotranspiration, and precipitation [14]. Construction of water engineering facilities and changes in land use/land cover are the primary anthropogenic activities affecting hydrological processes [15]. In their 1321 global watershed runoff, Wang et al. [16] identified a significant average decrease of 11.9 mm/a over the past decade. A study by Su et al. [17] on the annual mean runoff trends of 916 rivers (1948–2004) highlighted fluctuating trends across 503 and 408 basins, with the Northern Hemisphere’s mid and high-latitude basins showing more pronounced decreases. Zhang et al. [18], through a novel framework using data from 9505 relatively pristine watersheds, predicted a significant future reduction of runoff for the Northern Hemisphere’s mid- to high-latitude watersheds. Significant decreases trend in the annual mean runoff of major rivers in northern China between 1995 and 2018, including in the Songhua, Liao, Hai, and Yellow Rivers. However, there were significant increases in the annual mean runoff of rivers in southern China, including the Huai, Yangtze, and Pearl Rivers [19,20]. A slight decreasing trend in the runoff was observed at the Khabarovsk station in the lower HARB between 1897 and 2005, and there was also apparent interannual variation in the runoff stages and an uneven intra-annual runoff distribution, with the summer and autumn runoffs accounting for 76% of the annual runoff [21]. Therefore, an analysis of the changes in the hydrology of the HARB can further support the sustainable use of water resources to ensure the water security of the wetlands, farmland, and residential areas. The alterations in hydrological conditions effectively reflect the influence of climate change on hydrological processes within a basin. Furthermore, this study can serve as a valuable reference for water resource management and risk assessment of water security in transboundary basins.
Numerous studies have utilized the Indicators of Hydrological Alterations (IHA) [22] and the Range of Variability Approach (RVA) method to assess hydrological changes in various river basins, identifying significant influences from land use changes, construction of hydraulic infrastructure, and anthropogenic activities. Although the original IHA method included 32 indicators, the number increased to 33 in 1998, divided into five indicator groups. The resulting RVA was thus proposed to better quantify the degrees of variability of the hydrological indicators [23,24]. Tian et al. [25] applied the IHA–RVA method to analyze the hydrological changes in the Wuding River basin in northern China between 1960 and 2016. Their results found an overall hydrological change of 69%, and the primary drivers of these changes were identified as the changes in land use/land cover and the construction of hydraulic infrastructure. A study by Xu et al. [26] analyzed the changes in the hydrological conditions in the middle and upper reaches of the Yellow River between 1961 and 2022, and they identified anthropogenic activities and the construction of water conservancy facilities as having had significant impacts on the hydrology. Li et al. [27] applied the IHA–RVA method to comprehensively assess the changes in the hydrology of the Wei River basin, as well as the influence of anthropogenic activities on these hydrological changes. Their results showed a moderate change in hydrology, with anthropogenic activities as the main factor. The Heilong-Amur River, significantly impacted by its tributary, the Zeya River, has been historically prone to large-scale flooding events, notably in 2013 and 2019 [28,29]. Hence, it is necessary to analyze the characteristics of the alterations in the hydrologic regimes of the HARB, and applying the IHA-RVA method would provide a robust and practical approach. In contrast to previous studies, the study area is characterized by unique international basins and cold region rivers.
This study primarily aims to scrutinize the upper HARB’s hydrological conditions by applying the IHA–RVA method. Furthermore, we employ the cumulative anomaly method, a general approach for detecting the hydrological mutation year within hydrological series data. We also utilize the double cumulative curve method to quantify the impacts of both annual average precipitation and anthropogenic activities on changes in the upper HARB’s annual average runoff. The results of the present study offer a reference to water security risks assessment in the HARB and the response of the hydrological processes to climate change.
2. Materials and Methods
2.1. Study Area
The HARB covers an area of 208.33 × 10⁴ km2 and is shared by four countries: China, Russia, Mongolia, and North Korea [30]. The river originates in the Kent Mountains of Mongolia and joins the Ergun River via the Kerulen River, with the Heilong-Amur River constituting the reaches below the confluence with the Shilka River at Luoguhe (Pokrov in Russia) Village in China. The mouth of the river is at the Tatar Strait near Nikolaevsk, Russia, and the river has a length of 5498 km [31]. Within the HARB, the upper, middle, and lower reaches refer to the area of the basin upstream of the confluence of the Ergun and Shilka Rivers to the intersection of the Zeya River, the Zeya River mouth to the Ussuri River, and below the mouth of the Ussuri River, respectively.
The upper catchment area of HARB is 93.58 × 10⁴ km2, accounting for 44.92% of the entire basin (Figure 1). The elevation in the basin ranges between 116 and 2499 m and decreases from west to east. The basin receives seasonal rainfall, with summer (June–August) accounting for ±60% of the annual precipitation, and spring is affected by snowmelt-driven ice floods. Therefore, the basin receives bimodal seasonal runoff [32,33]. The climate in the basin with a dry and windy spring, warm and rainy summer, sunny and cool autumn, and cold and long winter impacted by the cold Siberian air. Runoff in the basin is also seasonal and is mainly concentrated between May and October, accounting for ±90% of the annual runoff [34].
2.2. Data Sources
The hydrological data used in the present study were mainly obtained from the hydrological data of the Heilong River basin (Annual Hydrological Report of the People’s Republic of China), consisting of the daily monitored streamflow and water levels for 1988–2017 at the Luoguhe (LGH), Shangmachang (SMC), and Kalunshan (KLS) hydrological stations in the mainstream of the HARB. Owing to the specificity of international rivers, this study employed runoff distance average series data to illustrate the runoff variation attributes at the three stations. Moreover, to analyze the water level variation characteristics, we used comparative elevation data relative to an assumed datum. The hydrological year was defined based on the hydrological characteristics of the study area from 1 April to 31 March of the following year. The meteorological data were mainly downloaded from the United States Global Historical Climatology Network-daily (GHCNd, https://www.ncei.noaa.gov, accessed on 20 December 2022) [35] and included daily precipitation data from 1988–2017 for 75 stations in the study area. Although the present study excluded stations with long periods of missing data, short periods of missing data in other stations were infilled with data collected from adjacent stations using the multiple regression difference method. The digital elevation model (DEM) for the upper HARB was downloaded from the National Aeronautics and Space Administration (NASA) and had a spatial resolution of 90 m (https://srtm.csi.cgiar.org/srtmdata/, accessed on 10 December 2022). National boundaries data came from the Resource and Environmental Science Data Center at the Chinese Academy of Science (RESDC, http://www.resdc.cn, accessed on 10 December 2022). The database information is shown in Table 1.
2.3. Methods
The flowchart of this study is depicted in Figure 2. We utilized the Mann–Kendall method to analyze trends in meteorological and hydrological data in the HARB. Then, we employed the IHA-RVA method for a more detailed analysis of hydrological regime changes. Lastly, based on the rainfall–runoff double cumulative curve method, we quantitatively assessed the impacts of climate change and human activities on runoff alterations.
2.3.1. Statistical Analysis Methods
- (1)
- Mann–Kendall non-parametric text
The Mann–Kendall (M-K) method is often used in trend analyses of hydrological and meteorological series [36,37,38,39], mainly because it does not must require the data to follow a normal distribution [40,41,42]:
In the formula:
where is the symbolic function; and are the time series values of and . Variance is calculated as
where is the number of relationships in the range . The statistic is calculated as:
At the levels of explicitness and 0.01, and 2.58, respectively. At the start, assume that the trend of the random number series does not change. At , the trend becomes more pronounced with the rejection of the null hypothesis [43].
- (2)
- Cumulative anomaly method
The method is frequently used in hydrological and meteorological research for analyzing the mutation characteristics of hydrological data [44]. The normalized cumulative outliers are calculated as:
A gradual increase in indicates that the data have an increasing trend; if gradually decreases showing series data is less than the mean value. Therefore, the points at which the trends change are mutation points.
The method is used to supplement the Mann–Kendall method to examine the mutation points of the data series, using a combination of the two methods to finally confirm the mutation points.
2.3.2. IHA-RVA Method
- (1)
- Indicators of hydrological alteration
The indicators of hydrological alteration (IHA) incorporate 33 indicators and are divided into 5 groups [45,46]. Table 2 shows the content of 5 groups and the 33 indicators details are shown in Appendix A, Table A1. The IHA can compare different periods in the hydrological record and identify changes in the hydrological regime attributable to influencing factors, such as dam construction or climate changes. We performed the calculations using the officially recommended and freely available software, Indicators of Hydrological Alteration version 7.1, which can be accessed at http://www.conservationgateway.org (accessed on 5 March 2023).
- (2)
- Degree of change in hydrological regime
Richter et al. [23] proposed the range of variability approach (RVA) method based on the indicators of hydrological alterations (IHA) method. The average of each indicator plus or minus the standard deviation or 75% and 25% frequency as the upper and lower limits.
- (3)
- Hydrological variation
The hydrological change degree is calculated as follows [47,48]:
where represents the year’s number during which the is in 25–75% after the mutation; is the duration (years) before the indicator represents that falls under the threshold; represents the proportion of the pre-impact indicators within the threshold; and is the number of years after the mutation.
The degree of variation in the hydrological regime is expressed as low, moderate, and high when , , and , respectively.
The overall degree of hydrological change after an abrupt change is calculated as
2.3.3. Runoff Change Attribution Decomposition Method
- (1)
- Rainfall–runoff double cumulative curve
Rainfall–runoff double cumulative curves are commonly used in statistical hydrology studies to analyze the runoff mutation’s characteristics [49,50]. In the process, the X- and Y-axes represent the cumulative rainfall and runoff, respectively. The change in the slope of the curve shows a sudden change is identified as a runoff mutation points [51]. The slope of the curve can be used to calculate changes in runoff before and after mutation. The rainfall–runoff double cumulative curve is calculated as
where represents the accumulated precipitation (mm); represents the cumulative runoff (m3), is the data time; and is the value of the year .
- (2)
- Quantitative estimation of runoff change
The mutation point of the rainfall–runoff double accumulation curve is used to divide into the baseline and impact periods, where the baseline period is the natural state and the impact period is more influenced [52,53].
By establishing the regression equation of rainfall–runoff in the baseline period, the average of the unaffected runoff in the impact period is and calculated by the equation. The total change in runoff is , the impact period average runoff is , and the baseline period runoff is , the runoff change caused by rainfall is , and the anthropogenic activities are , calculated as follows:
The contribution of rainfall to runoff change is , and anthropogenic activities is , calculated as follows:
3. Results
3.1. Evolution Characteristics of the Hydrological Factors
3.1.1. Trend Analysis
The catchment area above LGH represents the headwaters of the HARB, whereas the upper reaches extend above KLS. The annual mean precipitation between 1988 and 2017 in the headwaters was 285 mm, showing a pronounced decreasing trend of 2.37 mm/a. In contrast, the annual mean precipitation of the upper reaches was 386 mm, with a weak decreasing trend of 0.81 mm/a, and on the Mann–Kendall method tested the changing trend is insignificant (failed 95% significance test). As shown in Figure 3, there were similar trends in precipitation between the headwaters and upper reaches, with both showing decreasing trends. In Figure 4, the precipitation in the upper HARB varied between 113 and 698 mm from 1988 to 2017, with that in the headwaters and the Zeya River basin at between 300–400 mm and 450–550 mm, respectively. The results showed a significant difference in precipitation from east to west in the upper of HARB.
There were decreasing trends in the annual mean runoff at all three hydrological stations between 1988 and 2017, with significant decreases at LGH and SMC (|Z| > 1.96). In Figure 4, LGH showed the fastest reduction of annual mean runoff at 8.28 × 10⁸ m3/a, whereas that at SMC and KLS were 7.35 × 10⁸ m3/a and 3.6 × 10⁸ m3/a, respectively. The results indicated a gradual decrease in the rate of decline in the annual mean runoff of the HARB from upstream to midstream. While LGH had the lowest annual mean runoff, KLS had the highest after receiving water from the Zeya River, exceeding that of LGH and SMC by factors of three and two, respectively. Variation in the annual mean runoff at KLS can reflect the extreme flood of 2013 that mainly originated from the Zeya River [54].
Figure 5 shows significant decreasing trends in the annual water level data at all three stations (|Z| > 1.96). The fastest decrease in the annual mean water levels occurred at LGH at 0.05 m/a, followed by SMC and KLS at 0.03 m/a and 0.02 m/a, respectively, consistent with the spatial trend in the annual mean runoff. Therefore, the annual mean water levels decreased gradually along the main stream of the HARB from upstream to the middle reaches. The individual hydrological stations showed consistent annual mean runoffs and annual mean water levels. For example, the water levels at LGH in 1994 exceeded that in 1995, whereas the annual mean runoff in 1994 was similar to that in 1995. These higher water levels could be attributed to a large-scale ice dam in May 1994 [55].
3.1.2. Mutation Analysis
Figure 6 shows the cumulative distance-level curves of annual mean runoff in the upper HARB at LGH, SMC, and KLS between 1988–2017. LGH and SMC showed similar annual mean runoff accumulation distance-level curves, with an upward trend before 1998, a declining trend after that, and an abrupt change in 1998. The curve of KLS increased significantly between 1988–1994, with a clear decreasing trend after 1995. However, the flood in 2013 resulted in the curve again growing, with an abrupt change occurring in 1995. The direction of the cumulative distance-level curve of water levels at each station was consistent with the curve of annual mean runoff, with identical years of abrupt change between the two types of curves. The hydrological time series were divided into baseline and impact periods, with the years of abrupt change regarded as the dividing points. The baseline period was regarded as a period of hydrology with relatively less influence by anthropogenic activities, whereas anthropogenic activities more influenced the impact period.
3.2. Hydrological Variation
3.2.1. Degree of Overall Hydrologic Change
The present study applied mutation characteristics in runoff to divide the periods of hydrological change at LGH and SMC into pre-change (1988–1997) and post-change (1998–2017) periods, whereas those at KLS were 1988–1994 and 1995–2017, respectively. Table 3 shows the hydrological variability in the streamflow and water levels at hydrological stations in the upper HARB. Results showed moderate decreasing trends in the streamflow and water levels at all stations between 1988 and 2017, whereas there were decreases in all five groups of hydrological indicators. The highest degree of streamflow reduction was 58% at LGH, followed by SMC and LKS at 42% and 38%, respectively. This result indicated that the headwaters experienced the highest streamflow reduction with a medium–high variation, with a slightly lower decrease in the upper reaches with a medium–low variation. The decline in streamflow in the upper reaches of the HARB gradually decreased from upstream to downstream. This result could be related to the gradual increase in the streamflow. Changes in the streamflow at the SMC and KLS stations indicated that the impact of the Zeya River on the changes in the streamflow in the Heilong-Amur River was not significant.
KLS showed the most significant decrease with the annual mean water level of 59%, followed by SMC and LGH at 53% and 48%, respectively. Ice dams are readily formed in spring at LGH due to the high latitude of the area and the influence of the river topography. These ice dams result in congestion of the river water levels and affect the degree of water level change. The reduction of the annual mean water levels in the upper HARB gradually increased from upstream to downstream, with the most significant decrease at KLS after the confluence of the Zeya River.
As shown in Figure 7, most hydrological indicators showing significant changes in streamflow were at LGH, with 25% of indicators showing strong changes and 53% showing moderate changes after the abrupt change in 1998. No substantial changes in the 32 hydrological indicators occurred at SMC, whereas 63% of indicators showed moderate changes. Most hydrological indicators that showed significant changes in the annual mean water levels were at KLS with 28%, whereas 59% showed mild changes. The fewest hydrological indicators showing substantial changes occurred at LGH with 13%, whereas 38% showed moderate changes. LGH and KLS showed the highest and lowest degrees of alteration in the streamflow, respectively.
3.2.2. Degree of Change in Hydrologic Indicators
The IHA–RVA method was used to analyze the changes in the 32 hydrological indicators and calculate each indicator’s degree of change (Table 4). Since no stations showed zero streamflow during the study period, the zero streamflow (water levels) days hydrological indicator was removed. Figure 8 shows the degree of change of each indicator at the three hydrological stations.
- (1)
- As shown in Figure 8, there were decreasing trends in monthly median streamflow variability at all three hydrological stations, with those during the wet season (June–October) and dry season (November–February) significant at 28% and 26%, respectively. The monthly average decreases during the wet and dry seasons at LGH exceeded 39% and 35%, respectively. KLS showed the slightest monthly median variation at 19% and 15% in the wet and dry seasons, respectively. There were significantly decreasing trends in the monthly median water levels at all three hydrological stations at 2%, particularly during the flood water period when the water levels decreased significantly, and each water level indicator showed a medium change.
- (2)
- There were varying degrees of decrease in the extreme annual changes in streamflow (water levels) among the three hydrological stations, and that at LGH was the most obvious at 32%. However, only LGH showed a moderately decreasing trend in the baseflow index, whereas SMC and KLS showed increasing trends with low variability. The three hydrological stations showed clear decreasing trends in the median annual extreme water levels, with several indicators showing high decreases, and the decrease in the 30 d minimum streamflow of SMC reached 100%.
- (3)
- There were different advancements in the timing of annual extreme streamflow (water levels) among the other stations, with the annual minimum and maximum streamflow occurring 9 d and 3 d earlier at LGH, respectively; further, that for SMC was 14 d and 36 d, respectively, while that for KLS was 12 d and 13 d, respectively. In addition, KLS showed the most significant change in the annual extreme streamflow. The annual maximum streamflow at all three stations occurred from late June to early July, whereas the yearly minimum streamflow occurred from mid-to-late March at LGH and SMC and from early-to-mid October at KLS. The different stations showed different trends in the timing of the annual extreme water levels, with the timing of the minimum water levels delayed by 27 d at LGH, whereas the timing of the maximum water levels did not change; the timings of the minimum and maximum water levels at SMC were delayed and advanced by 6 d and 7 d, respectively and KLS was 14 d and 15 d, respectively.
- (4)
- LGH showed significant changes in streamflow pulse and duration, respectively, with a 100% change in the degree of low streamflow duration. There were also substantial increases in the duration of high streamflow at SMC and KLS, whereas they showed decreases in the frequency of high streamflow pulses. LGH and KLS showed prominent decreasing trends in the frequency of high magnitude streamflow of 100%, with moderate changes in the frequency of high water levels and duration.
- (5)
- All three stations showed decreasing trends in the streamflow rate and frequency after the mutation, and that at LGH was the highest, where the change in the degree of rising frequency index was 100%. LGH and SMC showed significant decreasing trends in streamflow reversal indices. The results showed an upward trend in the number of reversals at LGH with a low degree of change, whereas there were decreasing trends at SMC and KLS with a high degree of change.
3.3. Analysis of the Driving Factors of the Hydrologic Regime Alteration
The present study applied the double cumulative curve method to quantify the degrees to which precipitation and anthropogenic activities influence the hydrology of the upper HARB. As shown in Figure 9, runoff at LGH, SMC, and KLS changed in 1998, 1998, and 1995, respectively. The change at LGH was more prominent, whereas there were only marginal changes at SMC and KLS. The study calculated the difference in runoff and the contributions of precipitation and anthropogenic activities for the three hydrological stations in baseline and impact periods, respectively (Table 5). There were gradual decreases in the rate of change in the measured runoff at LGH, SMC, and KLS from upstream to downstream (36%, 28%, and 14%, respectively). The Mongolian plateau dominates the catchment area above LGH, with less annual mean precipitation and lower runoff than in the midstream and downstream reaches. Therefore, the headwaters experienced a more significant decrease trend in runoff and the degree of hydrological alteration.
Precipitation and anthropogenic activities contributed to 62% and 38% of the changes in runoff at LGH, respectively. This result indicated that the variation of runoff was mainly influenced by precipitation. In contrast, the impact of anthropogenic activities manifested in the headwaters was primarily due to human influences that changed the environment, such as changes to land cover/land use. The contributions of precipitation at SMC and KLS at 84% and 90% far exceeded those of anthropogenic activities at 16% and 10%, respectively. These results may be influenced by the fact that the upper reaches contain extensive forests and grasslands with good vegetation cover and anthropogenic activities mainly concentrated in several important cities.
Since the reservoir operated generally between 1988 and 2017, the reservoir’s impact on the river’s hydrology during this period could not be analyzed. Although the Zeya Reservoir in the Zeya River has some impact, the study period extended over the standard operation period of the reservoir, and thus, the current study could not analyze the reservoir’s impact on the river’s hydrology.
4. Discussion
The headwaters of the HARB occur mainly in the eastern part of the Mongolian Plateau, characterized by widely distributed forests and grasslands and a concentration of anthropogenic activities in the Ergun River and its tributary, the Hailar River Basin. And the region is dominated by grasslands in Mongolia, with over half of the inhabitants (65%) engaged in livestock farming between 1990 and 2010. Consequently, overgrazing represented several environmental challenges that resulted in ecological damage and changes to land use/land cover [56]. Implementing a series of projects to return farmland to forests and the Three North Protected Forests Program in the eastern part of the region has led to significant changes in land use patterns, with substantial increases in the areas of forests and grasslands [57]. The Hailar River Basin contains areas of concentrated anthropogenic activities, with large volumes of water consumed for industrial, agricultural, and residential use compared to other places in the region. Several large- and medium-sized reservoirs have been constructed along the tributaries of the Hailar River to meet the water demands of the surrounding cities, including the Honghuaerji, Zhaluomude, and Zhadun reservoirs [58,59]. Therefore, although headwaters above the LGH are sparsely populated, changes in land use and water resource use have some impacts on the runoff process. In contrast, anthropogenic activities significantly influenced the streamflow in the headwaters, exceeding the contribution of anthropogenic activities in SMC and KLS stations.
Changes in river runoff are directly related to changes in regional precipitation. The climate trends in the HARB are generally consistent with global trends, with a significant upward trend in temperature [60]. Meteorological observations in Khabarovsk show an increased frequency and intensity of flooding in the HARB and the frequency of extreme meteorological events [61]. Analysis of the meteorological data from the HARB revealed an overall weak downward trend in precipitation in the basin and a significant upward trend in temperature. In contrast, precipitation and temperature exhibited important interdecadal cyclical characteristics [62,63]. The HARB encompasses a large area and is shared by several countries. Therefore, most previous basin studies used a limited number of meteorological stations to analyze climate changes in the region. The selection of a large number of weather stations can significantly increase the workload of a study. In addition, guaranteeing the quality of meteorological data is difficult. Consequently, the application of remote sensing meteorological data represents one of the most effective approaches for analyzing climate change in areas with insufficient data.
The present study analyzed changes in precipitation in the upper HARB from 1988 to 2017 to identify changes in the hydrology of the upper reaches and briefly explored the contributions of precipitation and anthropogenic activities across two periods in the runoff. However, this study did not consider the basin’s changes in land use/land cover, future related studies should combine the simulation of runoff processes with an analysis of the impact of land use changes. In addition, the interaction between climate change and anthropogenic activities is influenced by diverse scale factors, rendering their mechanisms complex. The employment of rainfall–runoff double cumulative curves for quantifying respective impact contributions primarily relies on the examination of dominant factors. Other impacts, including flooding and agricultural production, among other multifaceted factors, require enhanced methodologies for further region-specific exploration. The 32 hydrological indicators used within the IHA–RVA method influence hydrological alteration differently. Therefore, future studies should select several hydrological indicators with more significant influence for further analysis. The results of the analysis on the alteration in hydrological regimes may provide references for the neighboring basins of the upper HARB. However, further comprehensive verification is required, including additional hydrological data and land surface characteristic data. Therefore, it is recommended to conduct further exploration of this aspect.
5. Conclusions
In this study, we investigated precipitation alterations in the upper HARB from 1988 to 2017, assessed the dynamics of streamflow and water levels utilizing observational hydrological data, and performed an attribution analysis of runoff changes. The findings not only validate the applicability of the adopted methodologies in cold regions, but they also offer a valuable reference for understanding alterations in hydrological regimes and guiding water resource management within the HARB:
- (1)
- During the period of 1987 to 2017, the annual mean precipitation in the upper HARB was 386 mm, decreasing slightly at 0.81 mm/a. Notably, all three hydrological stations registered decreasing trends in annual mean streamflow, with the LGH station observing the most substantial decrease at 8.28 × 10⁸ m3/a. There was also a significant decreasing trend in the annual mean water levels, with the most pronounced decline recorded at KLS station at a rate of 0.02 m/a.
- (2)
- The annual mean streamflow and water levels at LGH and SMC exhibited abrupt changes in 1998, while KLS experienced this shift in 1995. The degrees of reduction of streamflow following these changes were 58%, 42%, and 38% at LGH, SMC, and KLS, respectively, indicating moderate alterations. Correspondingly, alterations in water levels were registered at 48%, 53%, and 59%, respectively, also reflecting moderate changes.
- (3)
- Among the 32 hydrological indicators of the IHA–RVA method, there were significantly decreasing monthly trends in median streamflow and water levels, with the rate of change in the wet season (28%) slightly exceeding that in the dry season (26%). Significant decreasing trends existed in the frequencies of high and low streamflow and water levels. There were insignificant increasing trends in the high pulse duration of streamflow at SMC and KLS.
- (4)
- The contribution of precipitation in runoff variability far exceeds that of anthropogenic activities, with 62%, 84%, and 90% from precipitation and 38%, 16%, and 10% from anthropogenic activities at LGH, SMC, and KLS three hydrological stations, respectively. Precipitation is the primary factor influencing runoff in the HARB.
Author Contributions
Conceptualization, K.Z. and D.H.; methodology, K.Z.; software, K.Z. and J.L.; validation, D.H. and K.M.; formal analysis, K.Z.; investigation, J.L.; resources, K.M.; data curation, K.Z. and J.L.; writing—original draft preparation, K.Z.; visualization, J.L.; supervision, K.M.; funding acquisition, D.H. All authors have read and agreed to the published version of the manuscript.
Funding
The paper was supported by the Yunnan Scientist Workstation on International River Research (KXJGZS-2019-005), the National Natural Science Foundation of China (No.42201040), the Yunnan Provincial Key Laboratory of International Rivers and Transboundary Ecological Security Open Fund (NO.2022KF03), and the Yunnan University Graduate Research Innovation Fund Project (NO. KC-22221269).
Data Availability Statement
No new data were created or analyzed in this study. Data sharing is not applicable to this article.
Conflicts of Interest
The authors declare no conflict of interest.
Appendix A

Table A1.
The content of 33 IHA indicators.
| IHA Parameter Group | Hydrologic Parameters | Ecosystem Influences |
|---|---|---|
| Group 1 Magnitude of monthly water conditions | Median streamflow (water level) for each hydrological month (subtotal 12 parameters) | Habitat availability for aquatic organisms. Soil moisture availability for plants. Availability of water for terrestrial animals. Availability of food/cover for fur-bearing mammals. Reliability of water supplies for terrestrial animals. Access by predators to nesting sites. Influences water temperature, oxygen levels, and photosynthesis in water column. |
| Group 2 Magnitude and duration of annual extreme water conditions | 1-day minimum 3-day minimum 7-day minimum 30-day minimum 90-day minimum 1-day minimum 3-day minimum 7-day minimum 30-day minimum 90-day minimum Zero streamflow (water level) days Base flow index (subtotal 12 parameters) | Balance of competitive, ruderal, and stress-tolerant organisms. Creation of sites for plant colonization. Structuring of aquatic ecosystems by abiotic vs. biotic factors. Structuring of river channel morphology and physical habitat conditions. Soil moisture stress in plants. Dehydration in animals. Anaerobic stress in plants. Volume of nutrient exchanges between rivers and floodplains. Duration of stressful conditions such as low oxygen and concentrated chemicals in aquatic environments. Distribution of plant communities in lakes, ponds, and floodplains. Duration of high flows for waste disposal and aeration of spawning beds in channel sediments. |
| Group 3 Timing of annual extreme water conditions | Maximum streamflow (water level) date Minimum streamflow (water level) date (subtotal 2 parameters) | Compatibility with life cycles of organisms. Predictability/voidability of stress for organisms. Access to special habitats during reproduction or to avoid predation. Spawning cues for migratory fish. Evolution of life history strategies, behavioral mechanisms. |
| Group 4 Frequency and duration of high and low pulses | Low pulse count Low pulse duration High pulse count High pulse duration (subtotal 4 parameters) | Frequency and magnitude of soil moisture stress for plants. Frequency and duration of anaerobic stress for plants. Availability of floodplain habitats for aquatic organisms. Nutrient and organic matter exchanges between river and floodplain. Soil mineral availability. Access for waterbirds to feeding, resting, and reproduction sites. Influences bedload transport, channel sediment textures, and duration of substrate disturbance (high pulses). |
| Group 5 Rate and frequency of water condition changes | Rise rates Fall rates Number of hydrologic reversals (subtotal 3 parameters) | Drought stress on plants (falling levels). Entrapment of organisms on islands and floodplains (rising levels). Desiccation stress on low-mobility stream edge (variable zone) organisms. |
References
- UNESCO. UN-Water: United Nations World Water Development Report 2020: Water and Climate Change, Paris, UNESCO. 2020. Available online: https://unhabitat.org (accessed on 1 April 2023).
- WMO. 2021 State of Climate Service (WMO-NO. 1278). 2021. Available online: https://earthobservations.org (accessed on 1 April 2023).
- IPCC. Climate Change 2021: The Physical Science Basis. In Contribution of Working Group I to the Sixth Assessment Report of the Intergovernmental Panel on Climate Change; Cambridge University Press: Cambridge, UK, 2021. [Google Scholar] [CrossRef]
- Qin, D.H.; Ding, Y.J.; Zhai, P.M.; Song, L.C.; Luo, Y.; Jiang, K.J. Evolution of Climate and Ecological Environment in China 2021; China Science Press: Beijing, China, 2020; pp. 26–27. [Google Scholar]
- Ding, Y.; Zhang, S.; Wu, J.; Zhao, Q.; Li, X.; Jia, K. Recent progress on studies on cryospheric hydrological progress changes in China. Adv. Water Sci. 2020, 31, 690–702. [Google Scholar] [CrossRef]
- Kuang, Y.; Li, H.; Xia, J.; Yang, Z.C. Impacts of climate change on transboundary water resources and adaptation management framework. Clim. Change Res. 2018, 14, 67–76. [Google Scholar] [CrossRef]
- Xia, J.; Shi, W. Perspective on water security issue of changing environment in China. Shui Li Xue Bao 2016, 47, 292–301. [Google Scholar] [CrossRef]
- He, D.M.; Liu, C.M.; Feng, Y.; Hu, J.M.; Ji, X.; Li, Y.G. Progress and perspective of international river researches in China. Acta Geogr. Sin. 2016, 27, 928–934. [Google Scholar] [CrossRef]
- Song, Y.Y.; Song, C.C. An Introduction to National Key Research and Development Project: “Research on the Response of Wetland Ecosystems in Mid-high Latitudes toon the Response of Wetland Ecosystems in Mid-high Latitudes to Climate Change Climate Change” (No. 20162016YFAYFA06023000602300). Wetl. Sci. 2016, 14, 750–754. [Google Scholar] [CrossRef]
- Chen, H. Hydrological Processes and Wetlands Distribution under Climate Change in the Amur River Basin: Impacts and Predictions. Ph.D. Thesis, Aerospace Information Research Institute, Chinese Academy of Sciences, Beijing, China, 2020. [Google Scholar] [CrossRef]
- Zhong, S.J.; Mao, X.Y.; Huang, X.J. Water resources exploitation and utilization of international rivers in China from the perspective of geo-security. World Reg. Stud. 2022, 31, 466–477. [Google Scholar] [CrossRef]
- Chen, J.W. Cooperation and prospective on transboundary rivers between China and its neighboring countries. J. Bound. Ocean Stud. 2019, 4, 60–70. [Google Scholar]
- Guo, L.D.; Jing, P.R.; Zhang, Y.K. Visualization analysis on the research hotspots and frontiers of China’s international rivers. World Reg. Stud. 2022, 31, 490–502. [Google Scholar] [CrossRef]
- Bao, Z.X.; Zhang, J.Y.; Wang, G.Q.; Chen, Q.W.; Guan, T.S.; Yan, X.L.; Liu, C.S.; Liu, J.; Wang, J. The impact of climate variability and land use/cover change on the water balance in the Middle Yellow River Basin, China. J. Hydrol. 2019, 577, 123942. [Google Scholar] [CrossRef]
- Wang, H.X.; Ma, Y.C.; Hong, F.T.; Yang, H.; Huang, L.T.; Jiao, X.Y.; Guo, W.X. Evolution of Water–Sediment Situation and Attribution Analysis in the Upper Yangtze River, China. Water 2023, 15, 574. [Google Scholar] [CrossRef]
- Wang, S.P.; McVicar, T.R.; Zhang, Z.Q.; Brunner, T.; Strauss, P. Globally partitioning the simultaneous impacts of climate-induced and human-induced changes on catchment streamflow: A review and meta-analysis. J. Hydrol. 2020, 590, 125387. [Google Scholar] [CrossRef]
- Su, L.; Miao, C.Y.; Kong, D.X.; Duan, Q.Y.; Lei, X.H.; Hou, Q.Q.; Li, H. Long-term trends in global river flow and the causal relationships between river flow and ocean signals. J. Hydrol. 2018, 563, 818–833. [Google Scholar] [CrossRef]
- Zhang, Y.Q.; Zheng, H.X.; Zhang, X.Z.; Leung, L.R.; Liu, C.M.; Zheng, C.M.; Guo, Y.H.; Francis, H.S.; David, P.; Kong, D.D.; et al. Future global streamflow declines are probably more severe than previously estimated. Nat. Water 2023, 1, 261–271. [Google Scholar] [CrossRef]
- Yang, L.; Zhao, G.J.; Tian, P.; Mu, X.M.; Tian, X.J.; Feng, J.H.; Bai, Y.P. Runoff changes in the major river basins of China and their responses to potential driving forces. J. Hydrol. 2022, 607, 127536. [Google Scholar] [CrossRef]
- Li, F.P.; Zhang, G.X.; Xu, J.Y. Spatiotemporal variability of climate and streamflow in the Songhua River Basin, northeast China. J. Hydrol. 2014, 514, 53–64. [Google Scholar] [CrossRef]
- Yan, B.; Xia, Z.Q.; Zhou, Y.X.; Wang, J.C.; Chen, Q.C. Variation of runoff at Khabarovsk Station on Heilongjiang River. Water Resour. Prot. 2013, 29, 29–33. [Google Scholar] [CrossRef]
- Richter, B.D.; Baumgartner, J.V.; Powell, J.; Braun, D.P. A method for assessing hydrologic alteration within ecosystems. Conserv. Biol. 1996, 10, 1163–1174. [Google Scholar] [CrossRef] [Green Version]
- Richter, B.D.; Baumgartner, J.V.; Braun, D.P.; Powell, J. A spatial assessment of hydrologic alteration within a river network. Regul. Rivers-Res. Manag. 1998, 14, 329–340. [Google Scholar] [CrossRef]
- Richter, B.D.; Baumgartner, J.V.; Wigington, R.; Braun, D. How much water does a river need? Freshw. Biology 1997, 37, 231–249. [Google Scholar] [CrossRef] [Green Version]
- Tian, X.J.; Zhao, G.J.; Mu, X.M.; Zhang, P.F.; Tian, P.; Gao, P.; Sun, W.Y. Hydrologic alteration and possible underlying causes in the Wuding River, China. Sci. Total Environ. 2019, 693, 133556. [Google Scholar] [CrossRef]
- Xu, M.Z.; Wang, G.H.; Wang, Z.J.; Hu, H.C.; Kumar Singh, D.; Tian, S.M. Temporal and spatial hydrological variations of the yellow river in the past 60 years. J. Hydrol. 2022, 609, 127750. [Google Scholar] [CrossRef]
- Li, H.W.; Zhao, G.J.; Mu, X.M.; Tian, P.; Zhang, S.S. Alteration of Hydrological Regime and Analysis on Its Diving Factors of the Weihe River Basin. Reach. Soil Water Conserv. 2022, 30, 1–7. [Google Scholar] [CrossRef]
- Liu, Z.R.; Zhou, H.W.; Hu, X.Q. Multi-period and multi-layer cooperation mechanism of cross-border flood prevention in Heilongjiang Basin. China Popul. Resour. Environ. 2015, 25, 163–168. [Google Scholar] [CrossRef]
- Wang, R.; Yin, Z.J.; Zhu, C.Z. Analysis of Rainstorms and Floods Occurred in Heilongjiang and Songhuajiang River Basins in 2013. J. China Hydrol. 2014, 36, 67–71+76. [Google Scholar]
- Huang, Y.F.; Li, T.J.; Lv, E.Z.; Li, J.Y.; Bai, R.; Liu, C.; Shi, R.X. Boundary Data of the Amur River Basin. J. Glob. Change Data Discov. 2017, 1, 114. [Google Scholar] [CrossRef]
- Dai, C.L.; Wang, S.C.; Li, Z.J.; Gao, Y.; Li, C. Review on hydrological geography in Heilongjiang River Basin. Acta Geogr. Sin. 2015, 70, 1823–1834. [Google Scholar] [CrossRef]
- Guo, J. Hydrography of the Heilongjiang River Basin; New Knowledge Press: Shanghai, China, 1958; pp. 45–53. [Google Scholar]
- Luo, F. Introduction to the Hydrology of the Heilongjiang River Basin; Academy Press: Beijing, China, 1996; pp. 45–53. [Google Scholar]
- Dai, C.L.; Yu, C.G.; Lin, L.; Xiao, D.F.; Li, H.Y. Analysis of Characteristics of Hydrology and Water Resources of the Heilong (Amur) River Basin. Adv. Mater. Res. 2012, 550–553, 2525–2532. [Google Scholar] [CrossRef]
- Menne, M.J.; Williams, C.N.; Gleason, B.E.; Rennie, J.J.; Lawrimore, J.H. The global historical climatology network monthly temperature dataset, version 4. J. Clim. 2018, 31, 9835–9854. [Google Scholar] [CrossRef]
- Mann, H.B. Nonparametric tests against trend. Econometrica 1945, 13, 245–259. [Google Scholar] [CrossRef]
- Kendall, M.G. Rank Correlation Methods; Charles, Griffin: New York, NY, USA, 1975. [Google Scholar]
- Lv, X.Z.; Zuo, Z.G.; Ni, Y.X.; Sun, J.; Wang, H.N. The effects of climate and catchment characteristic change on streamflow in a typical tributary of the yellow river. Sci. Rep. 2019, 9, 14535. [Google Scholar] [CrossRef] [Green Version]
- Serrano, A.; Mateos, V.L.; Garcia, J.A. Trend analysis of monthly precipitation over the iberian peninsula for the period 1921–1995. Phys. Chem. Earth 1999, 24, 85–90. [Google Scholar] [CrossRef]
- Yue, S.; Pilon, P.; Phinney, B.; Cavadias, G. The influence of autocorrelation on the ability to detect trend in hydrological series. Hydrol. Process 2002, 16, 1807–1829. [Google Scholar] [CrossRef]
- Hamed, K.H.; Rao, A.R. A modified Mann-Kendall trend test for autocorrelated data. J. Hydrol. 1998, 204, 182–196. [Google Scholar] [CrossRef]
- Hamed, K.H. Trend detection in hydrologic data: The Mann-Kendall trend test under the scaling hypothesis. J. Hydrol. 2008, 349, 350–363. [Google Scholar] [CrossRef]
- Kumar, S.; Merwade, V.; Kam, J.; Thurner, K. Streamflow trends in Indiana: Effects of long term persistence, precipitation and subsurface drains. J. Hydrol. 2009, 374, 171–183. [Google Scholar] [CrossRef]
- Berger, W.H.; Labeyrie, L.D. Abrupt Climatic Change: Evidence and Implications; Springer Science & Business Media: Berlin/Heidelberg, Germany, 1987. [Google Scholar]
- Shah, S.A.; Jehanzaib, M.; Lee, J.H.; Kim, T.W. Exploring the factors affecting streamflow conditions in the Han River basin from a regional perspective. Water Resour. Hydrol. Eng. 2021, 25, 4931–4941. [Google Scholar] [CrossRef]
- Wen, X.; Liu, Z.H.; Lei, X.H.; Lin, R.J.; Fang, G.H.; Tan, Q.F.; Wang, C.; Tian, Y.; Quan, J. Future changes in Yuan River ecohydrology: Individual and cumulative impacts of climates change and cascade hydropower development on runoff and aquatic habitat quality. Sci. Total Environ. 2018, 633, 1403–1417. [Google Scholar] [CrossRef]
- Allan, J.D.; Castillo, M.M. Stream 3cology: Structure and Function of Running Waters, 2nd ed.; Springer: Dordrecht, The Netherlands, 2007; pp. 40–43. [Google Scholar]
- Zuo, D.P.; Xu, Z.X.; Wu, W.; Zhao, J.; Zhao, F.F. Identification of streamflow response to climate change and human activities in the Wei River Basin, China. Water Resour. Manag. 2014, 28, 833–851. [Google Scholar] [CrossRef]
- Jehanzaib, M.; Shah, S.A.; Kwon, H.H.; Kim, T.W. Investigating the influence of natural events and anthropogenic activities on hydrological drought in South Korea. Terr. Atmos. Ocean. Sci. 2020, 31, 85–96. [Google Scholar] [CrossRef] [Green Version]
- Jehanzaib, M.; Shah, S.A.; Yoo, J.Y.; Kim, T.W. Investigating the impacts of climate change and human activities on hydrological drought using non-stationary approaches. J. Hydrol. 2020, 588, 125–152. [Google Scholar] [CrossRef]
- Wei, X.; Wang, N.; Zhou, M.T.; Guo, Y.C. Combined Impact of Climate Change and Human Activities on Runoff in the Kriya River. J. Irrig. Drain. 2022, 41, 80–86. [Google Scholar] [CrossRef]
- Zhang, S.L.; Wang, Y.H.; Yu, P.T.; Zhang, H.J.; Tu, X.W. Impact of human activities on the spatial and temporal variation of runoff of Jinghe Basin, Northwest China. J. Arid Land Resour. Environ. 2011, 25, 66–72. [Google Scholar] [CrossRef]
- Ma, K.; Huang, X.R.; Liang, C.; Zhao, H.B.; Zhou, X.Y.; Wei, X.Y. Effect of land use/cove changes on runoff in the Min River watershed. River Res. Appl. 2020, 36, 749–759. [Google Scholar] [CrossRef]
- Bellevenkiel, E.; Zuo, Z.A.; Zhao, Q.Y. The role of Russian two hydropower stations in the flood of 2013. Express Water Resour. Hydropower Inf. 2014, 35, 23–27. [Google Scholar] [CrossRef]
- Song, C.S.; Zhu, X.Y.; Han, H.W.; Lin, L.B.; Yao, Z. The influence of riverway characteristics on the generation and dissipation of ice dam in the upper reaches of Heilongjiang River. Shui Li Xue Bao 2020, 51, 1256–1266. [Google Scholar] [CrossRef]
- Simonov, E.A.; Dahmer, T.D. Amur-Heilong River Basin Reader; Ecosystems Ltd.: Hong Kong, China, 2008; pp. 150–175. [Google Scholar]
- Zhang, Y.Q.; Li, C.C. The research progress on the influence of vegetation changes on regional hydrological processes in Northern China. J. Northwest Univ. 2020, 50, 420–426. [Google Scholar] [CrossRef]
- Zhang, J.Z.; Song, L.R. Research on water resources development and water allocation measures in the Hailar River Basin. Water Resour. Hydropower 2010, 28, 34–35. [Google Scholar] [CrossRef]
- Guo, H.D. Study on the Sustainable Use of Water Resources in the Hailar River Basin. Inn. Mong. Water Resour. 2008, 115, 71–73. [Google Scholar]
- Makhinov, A.; Kim, V. Effect of climate changes on the hydrological regime of the Amur river. Pac. Geogr. 2020, 1, 30–39. [Google Scholar] [CrossRef]
- Novorotskii, P. Climate changes in the amur river basin in the last 115 years. Russ. Meteorol. Hydrol. 2007, 2, 102–109. [Google Scholar] [CrossRef]
- Tishchenko, V.A.; Khan, V.M.; Kruglova, E.N.; Kulikova, I.A. Monthly and Seasonal Prediction of Precipitation and Air Temperature in the Amur River Basin. Russ. Meteorol. Hydrol. 2019, 44, 169–179. [Google Scholar] [CrossRef]
- Yu, L.L.; Xia, Z.Q.; Li, S.; Li, J.K.; Cai, T. Climate change characteristics of Amur River. Water Sci. Eng. 2013, 6, 131–144. [Google Scholar] [CrossRef]
Figure 1.
Location of the upper Heilong-Amur River Basin.

Figure 2.
The flowchart of the analysis of driving factors and hydrological regime alteration of this study.
Figure 2.
The flowchart of the analysis of driving factors and hydrological regime alteration of this study.
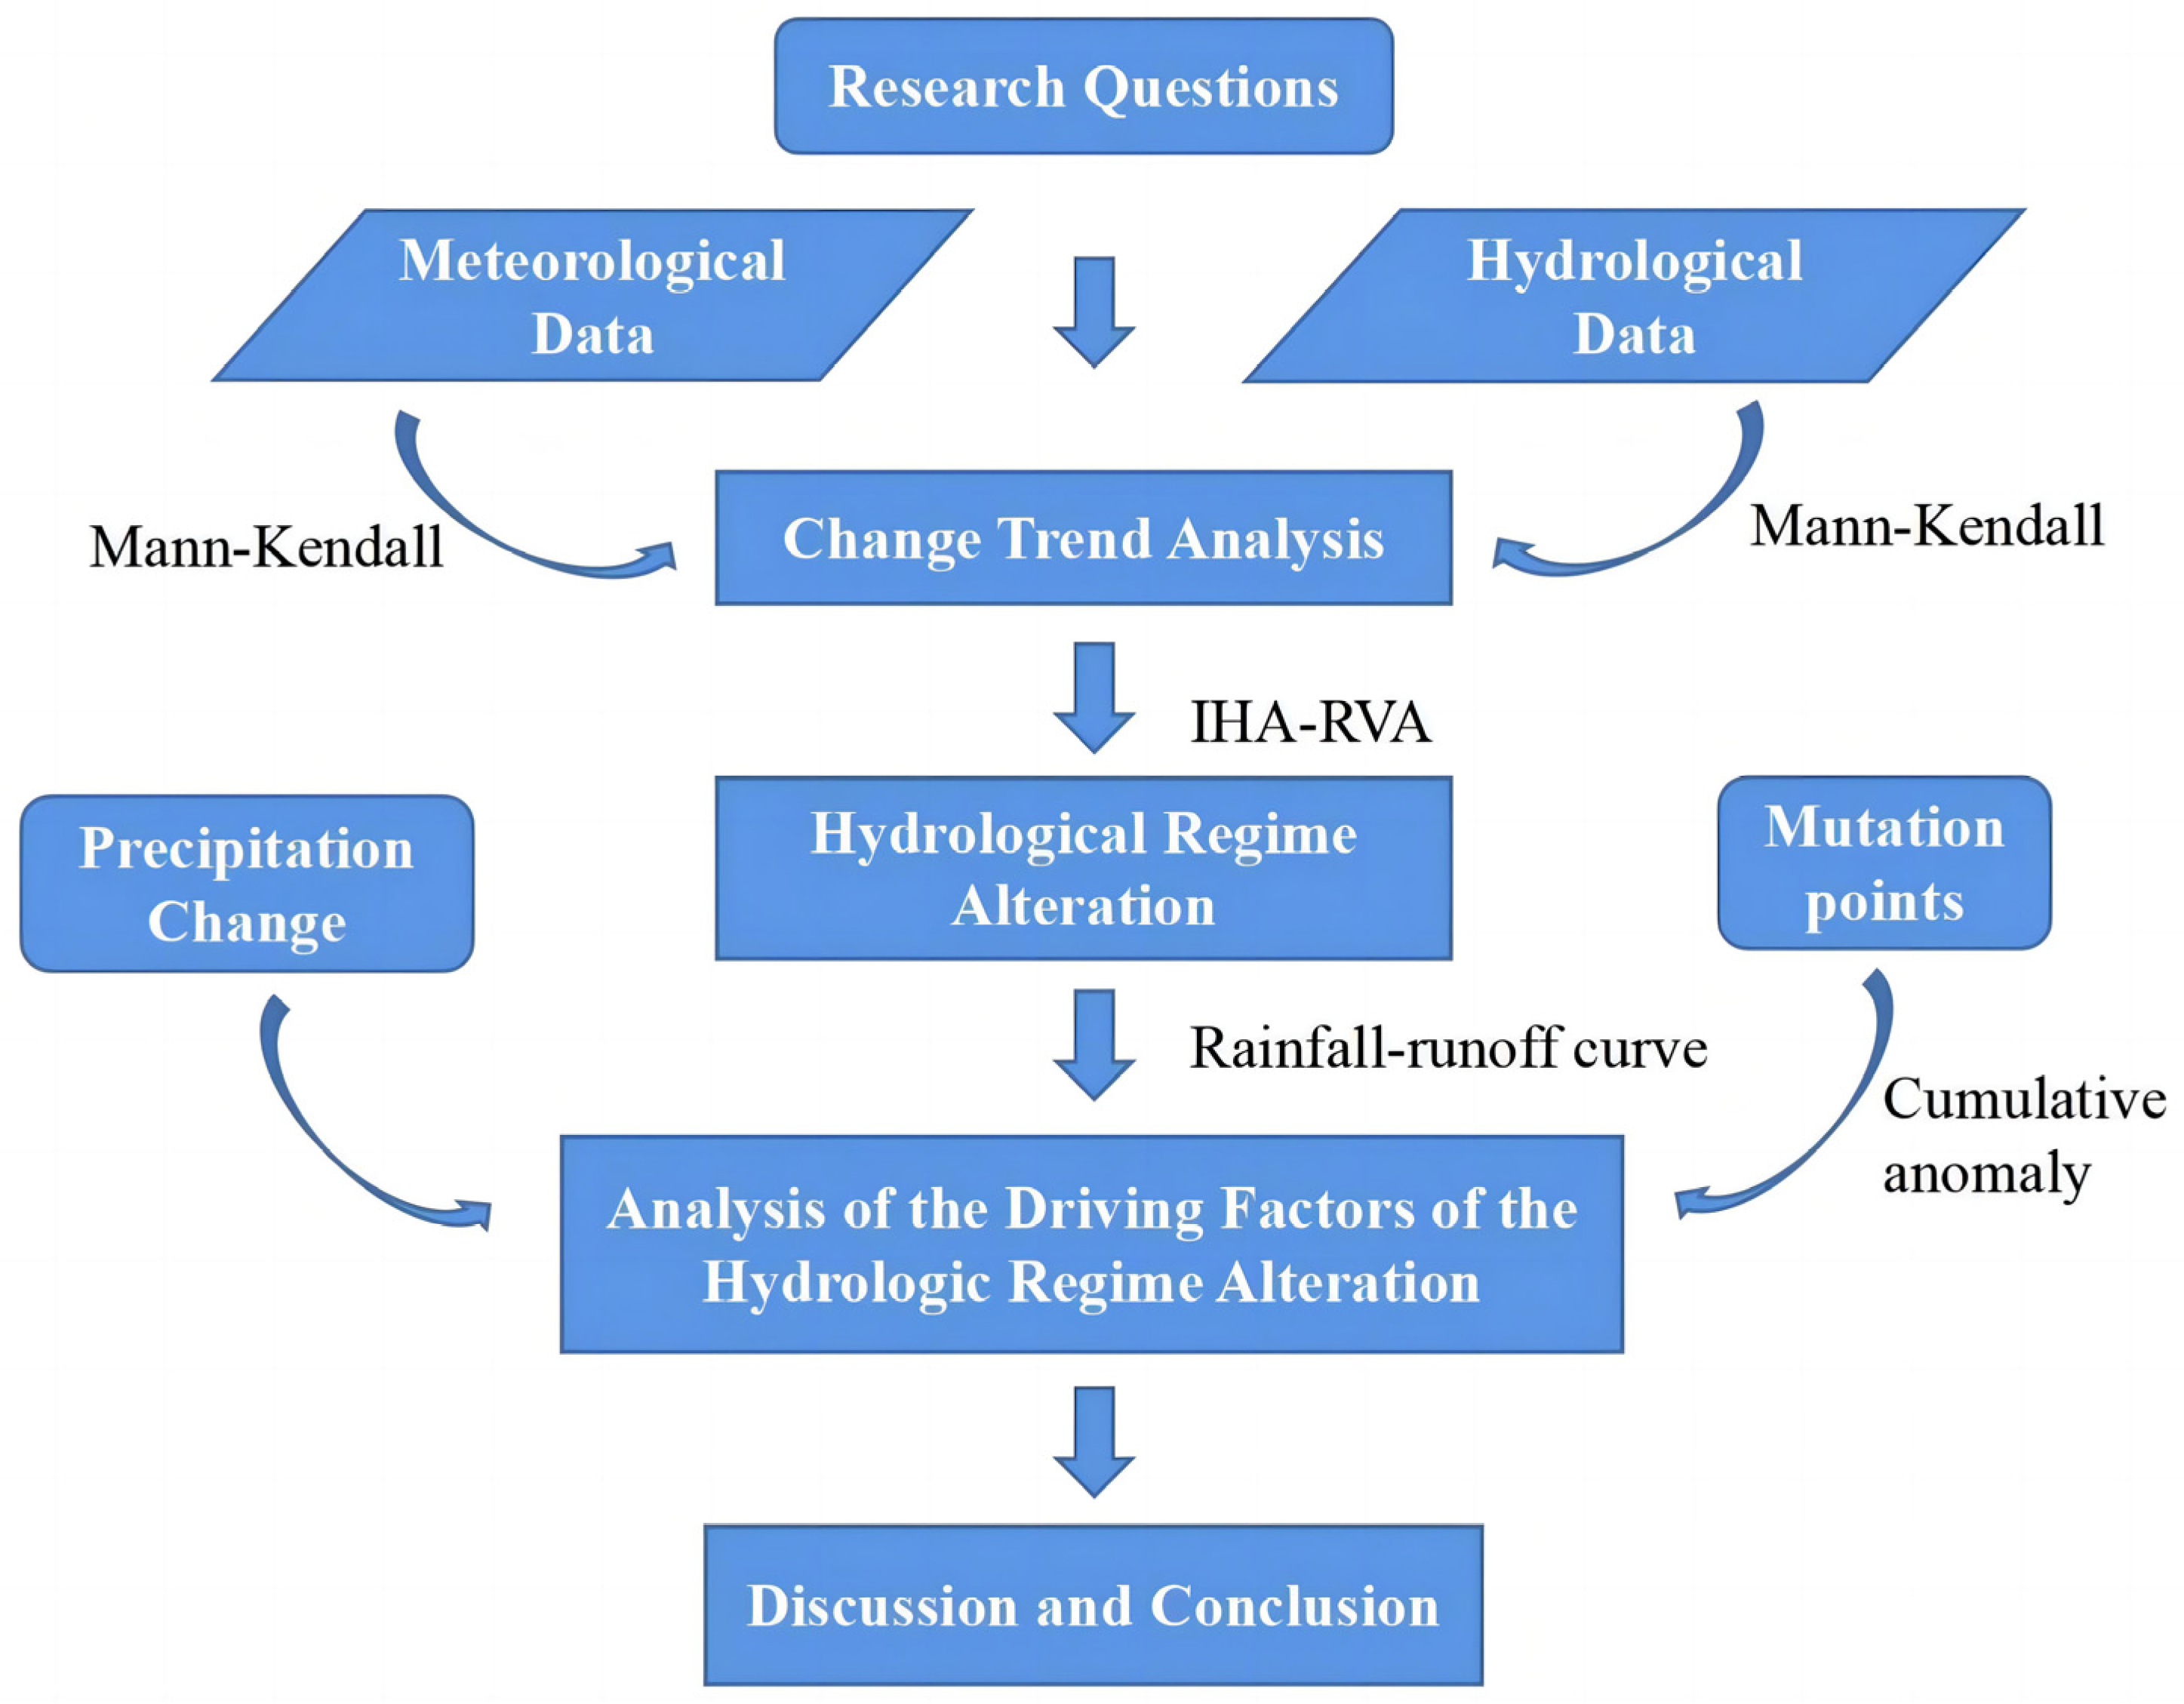
Figure 3.
Temporal trends in precipitation of the study area.
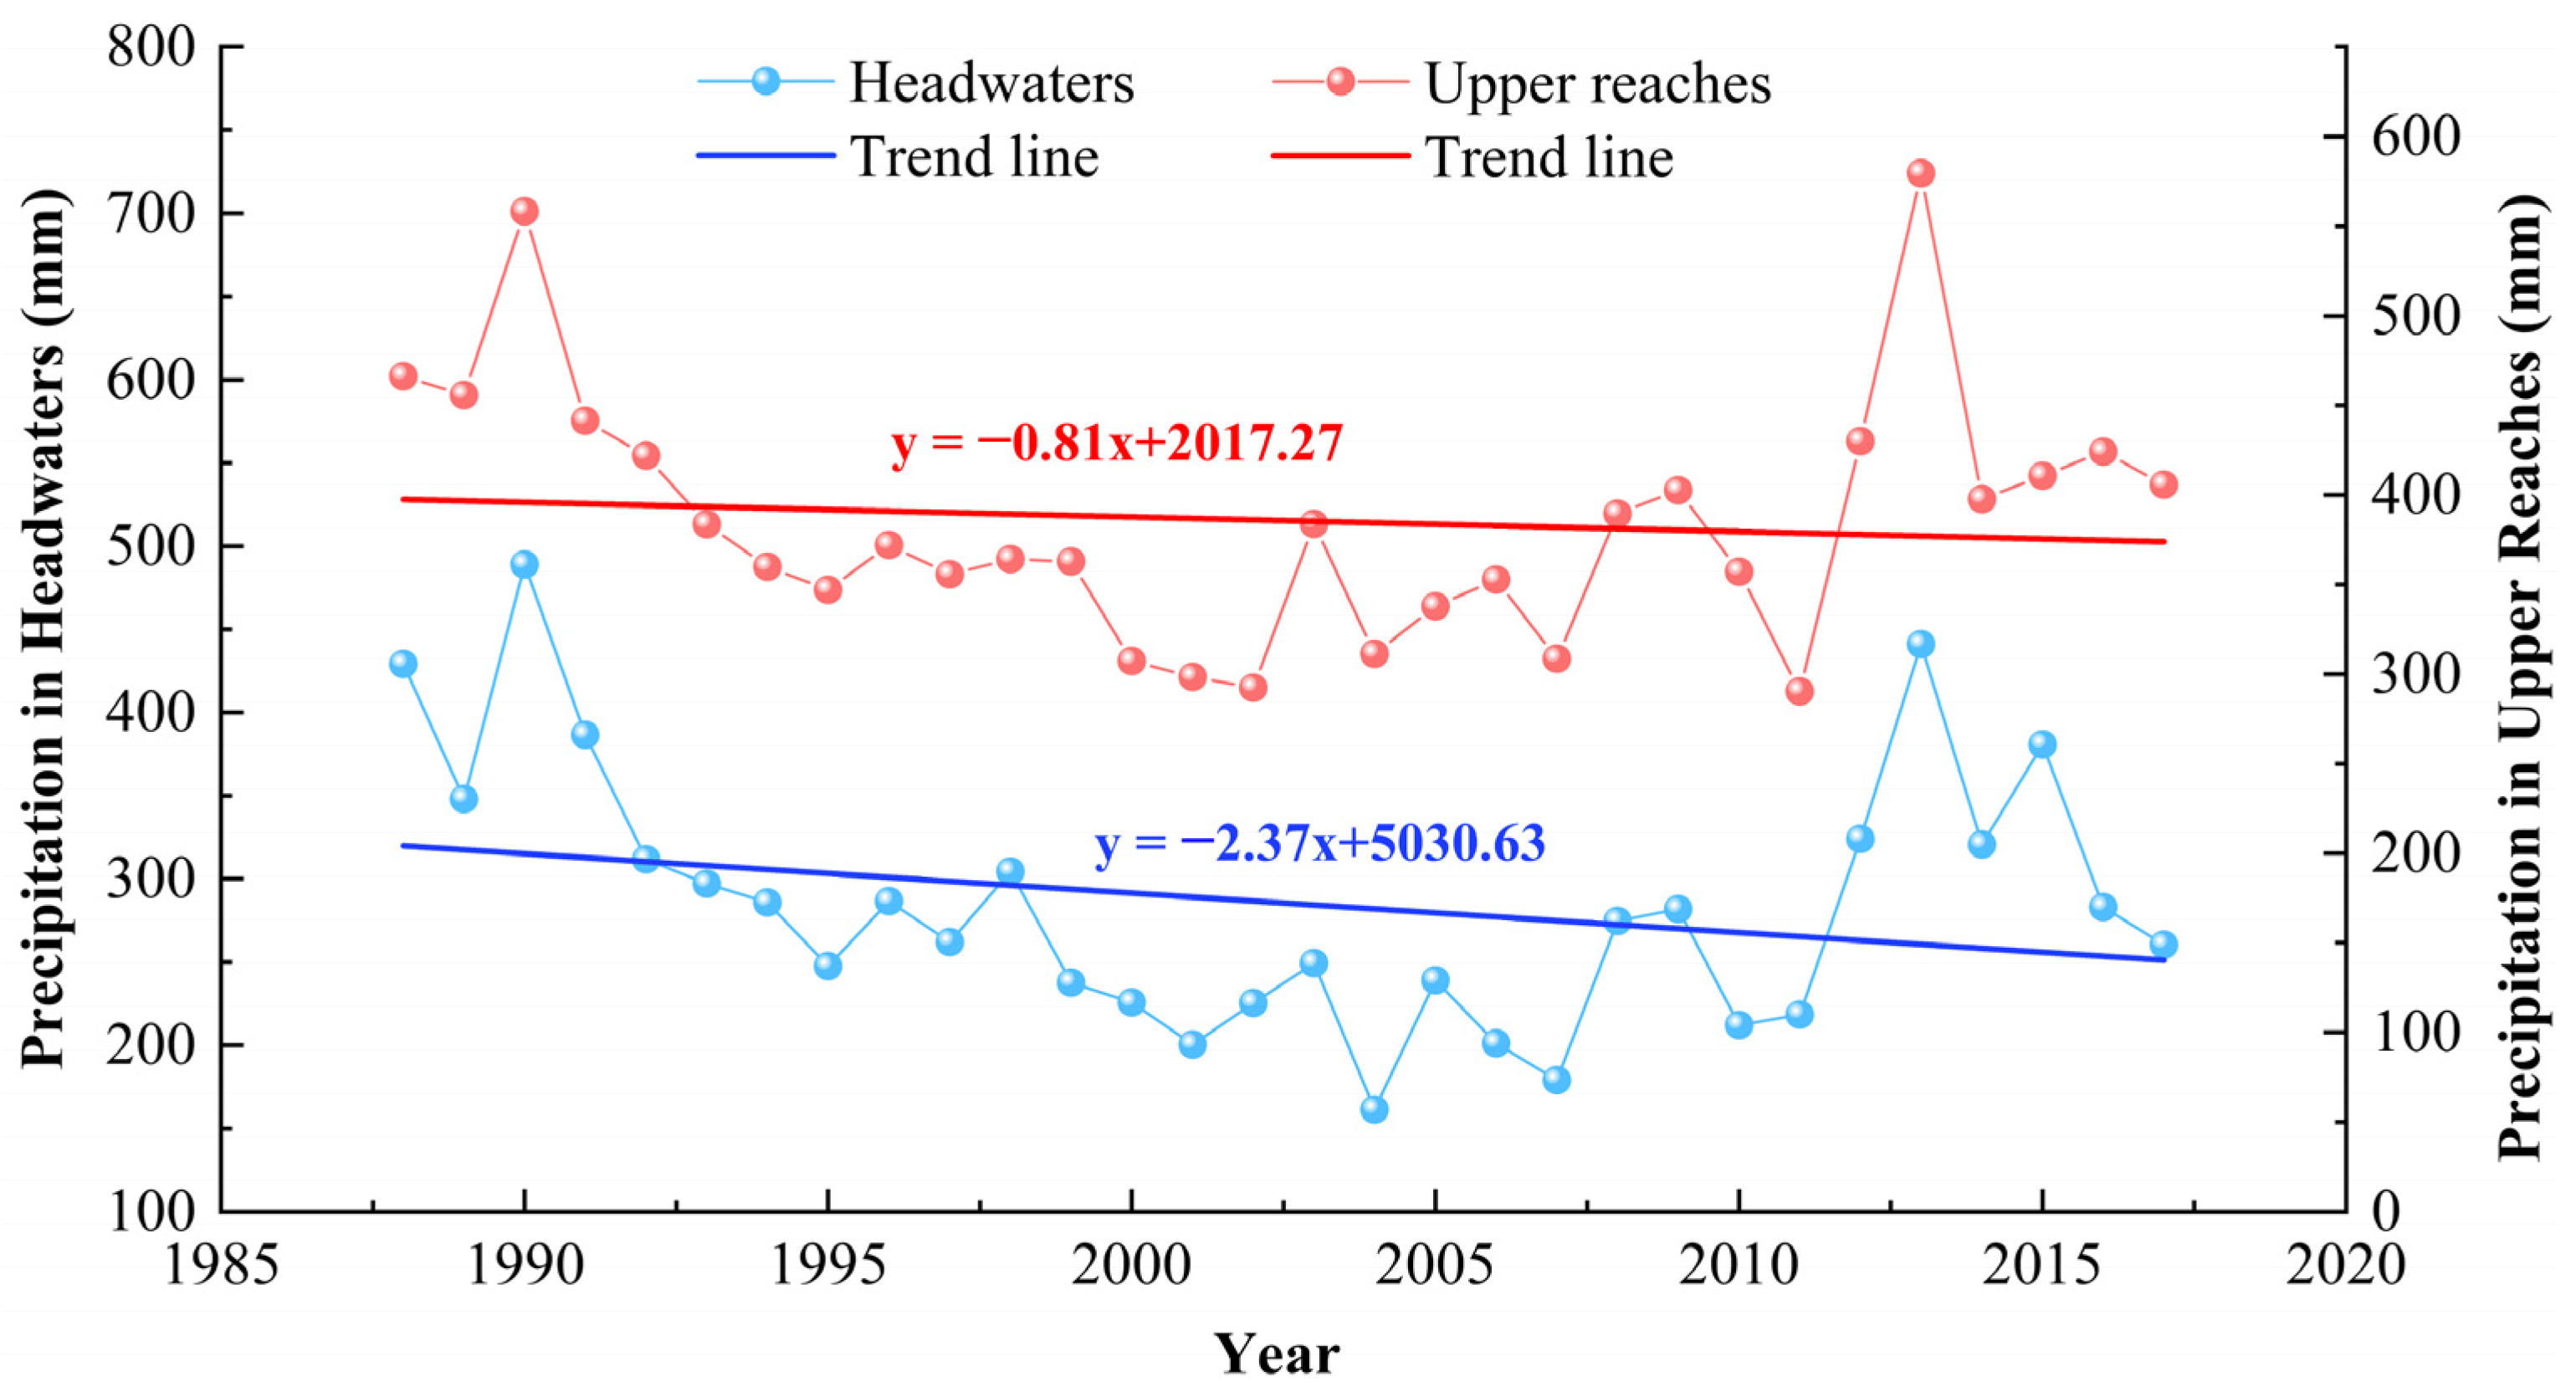
Figure 4.
Spatial distribution of precipitation of the study area.
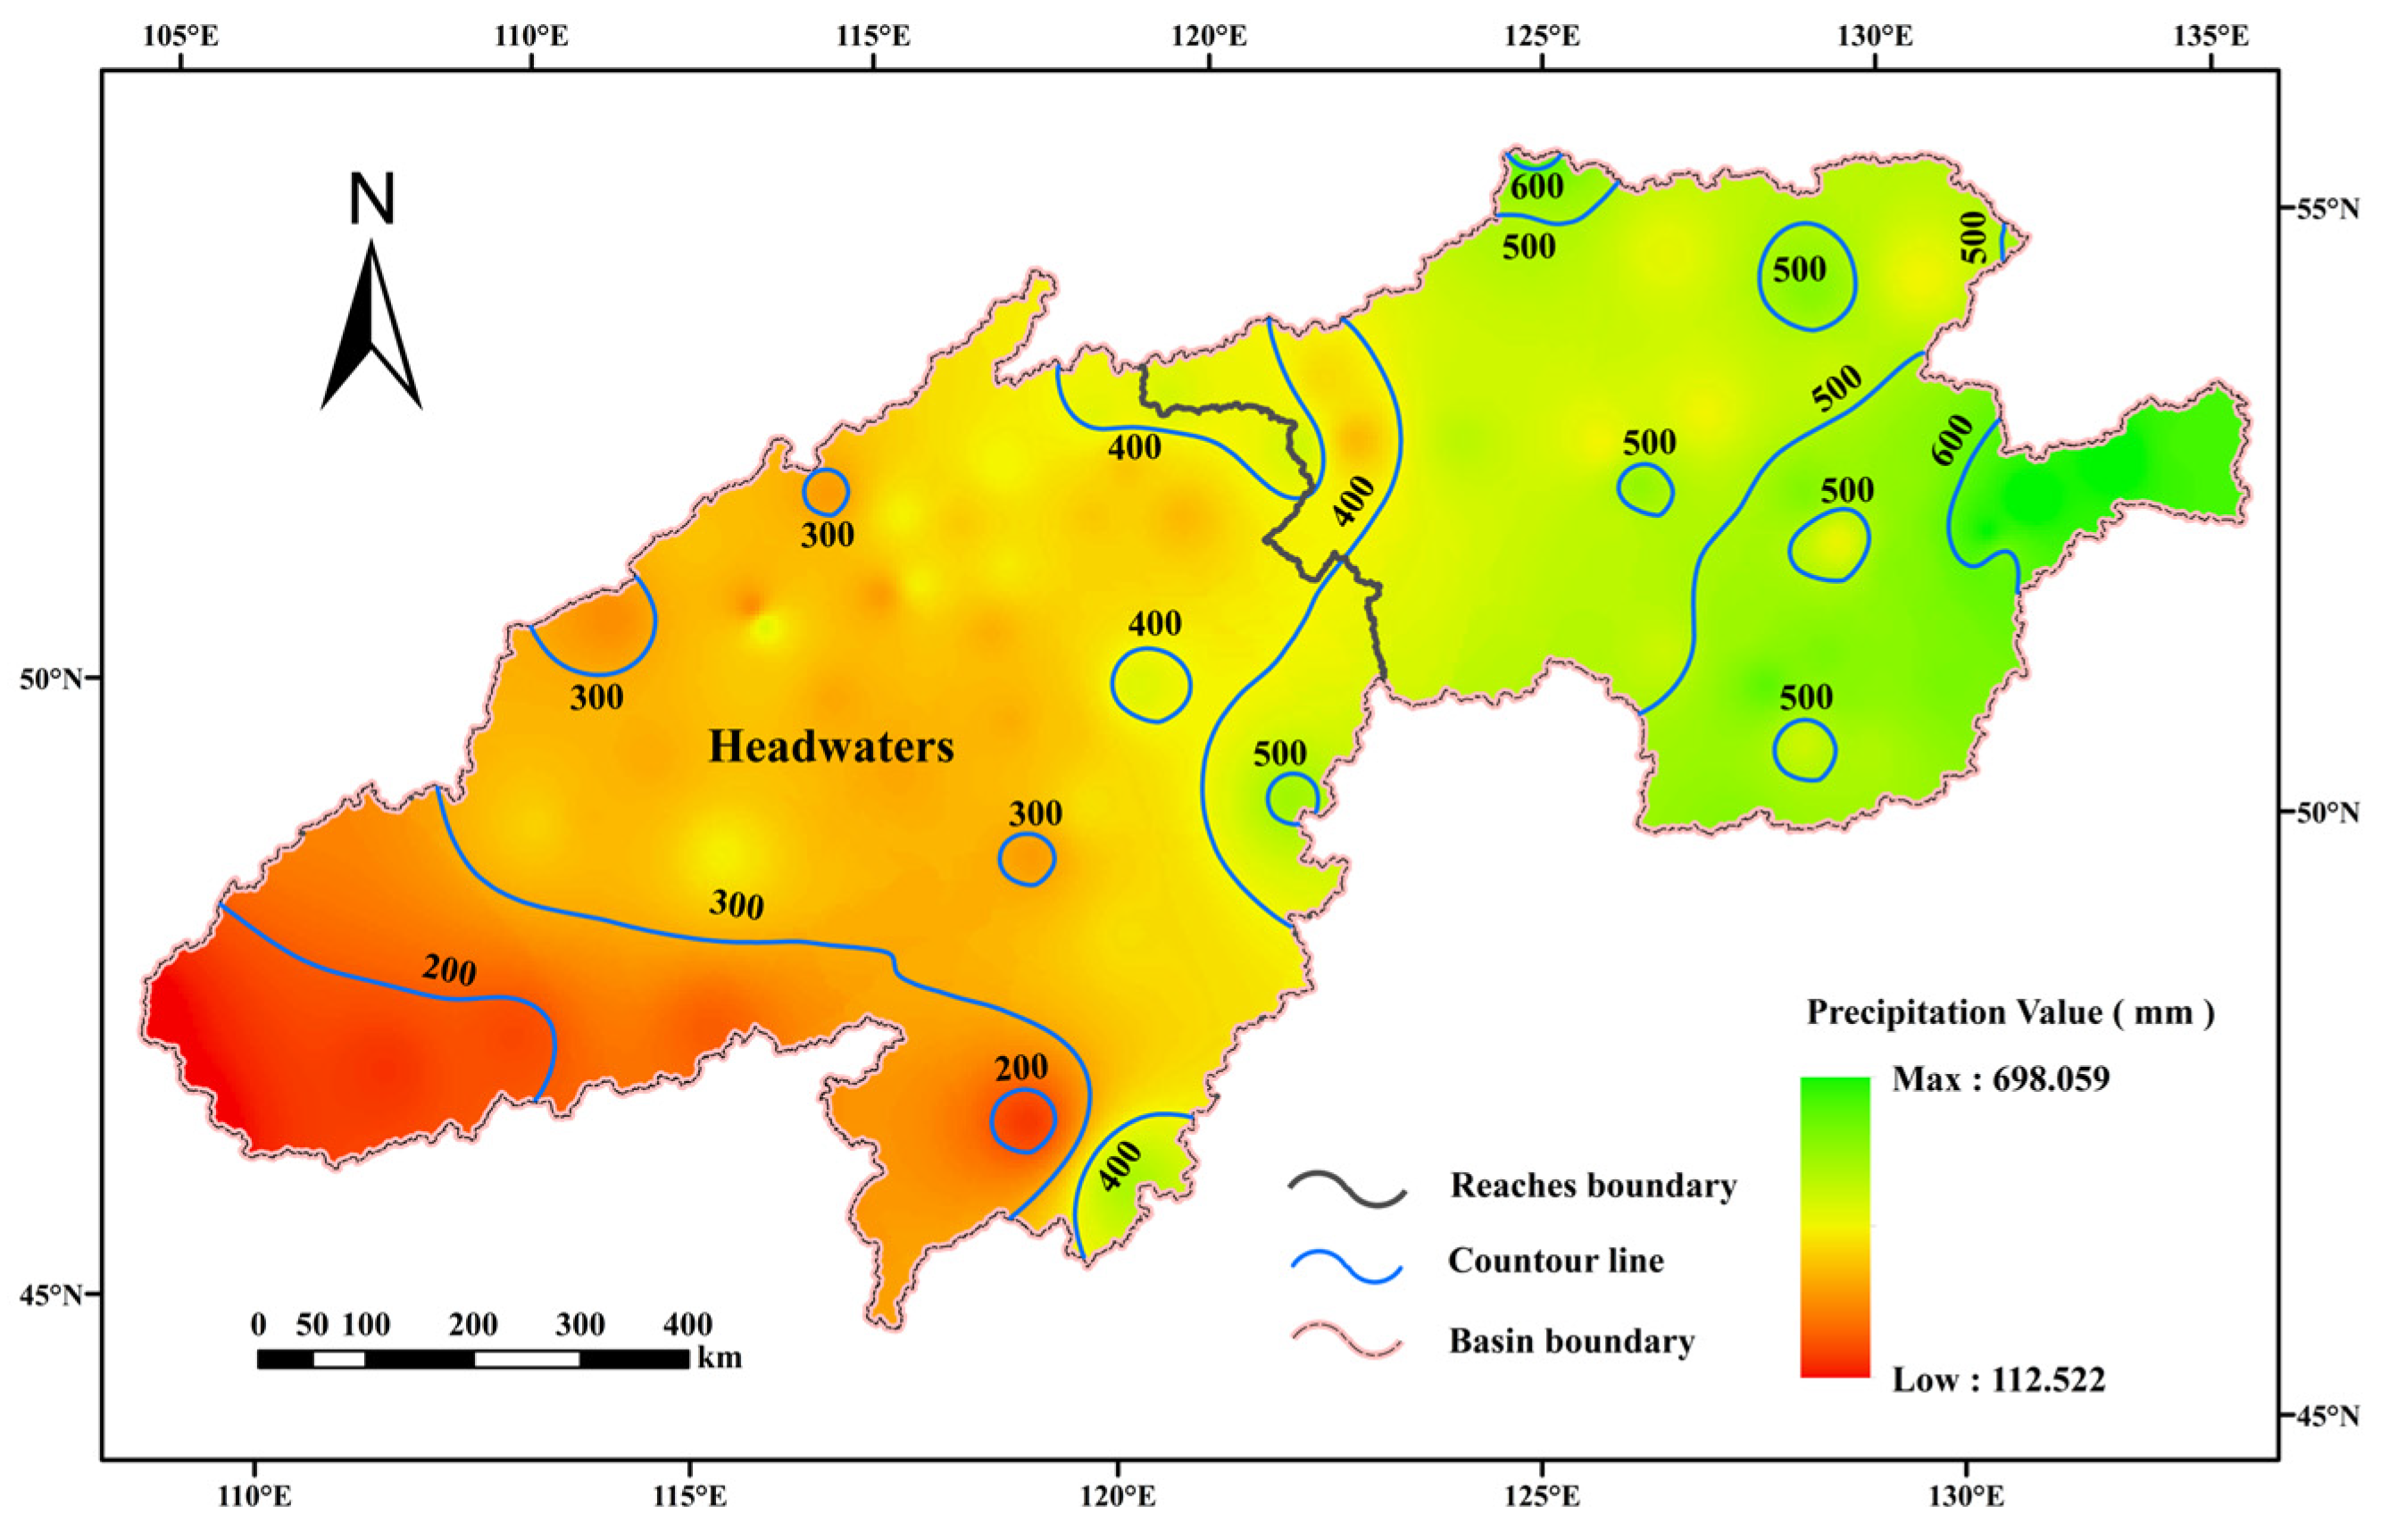
Figure 5.
Trends in the annual runoffs and water levels at three stations: (a) Luoguhe Station; (b) Shangmachang Station; and (c) Kalunshan Station.
Figure 5.
Trends in the annual runoffs and water levels at three stations: (a) Luoguhe Station; (b) Shangmachang Station; and (c) Kalunshan Station.


Figure 6.
Cumulative distance level of runoff at three stations: (a) Luoguhe Station; (b) Shangmachang Station; (c) and Kalunshan Station.
Figure 6.
Cumulative distance level of runoff at three stations: (a) Luoguhe Station; (b) Shangmachang Station; (c) and Kalunshan Station.
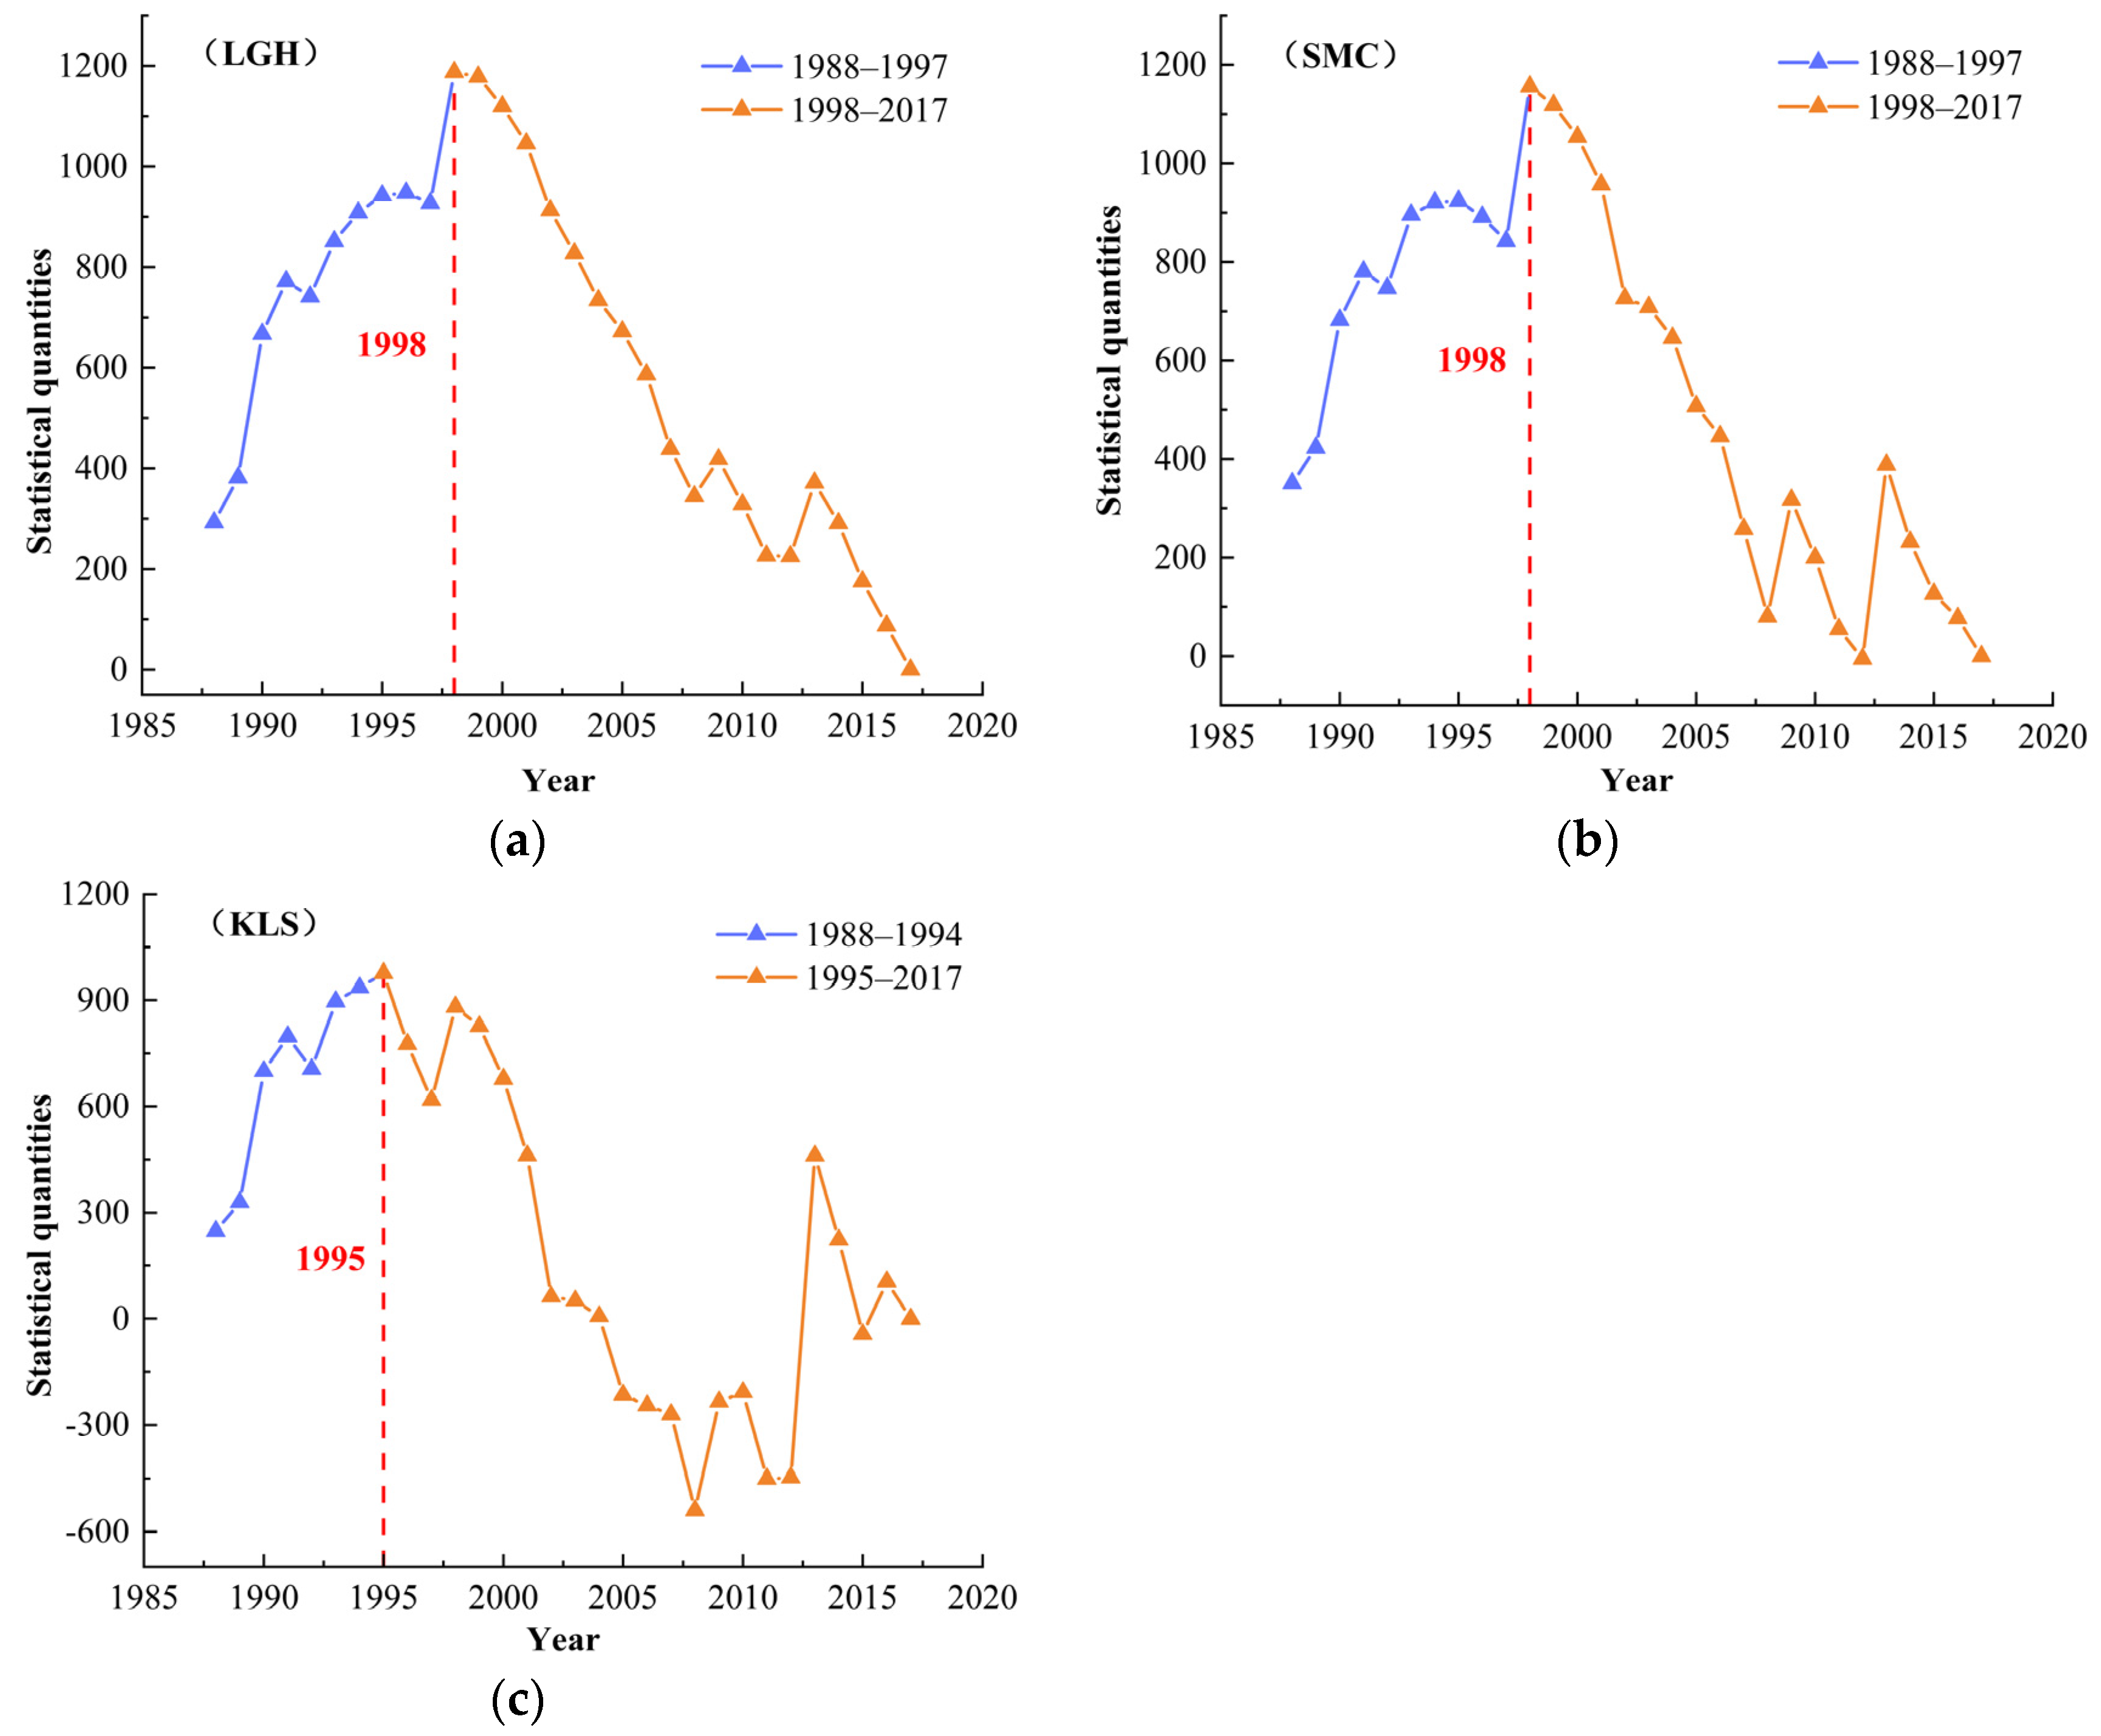
Figure 7.
Percentage of the different levels of hydrological change at the three stations.

Figure 8.
Values of hydrological indicators at three stations.
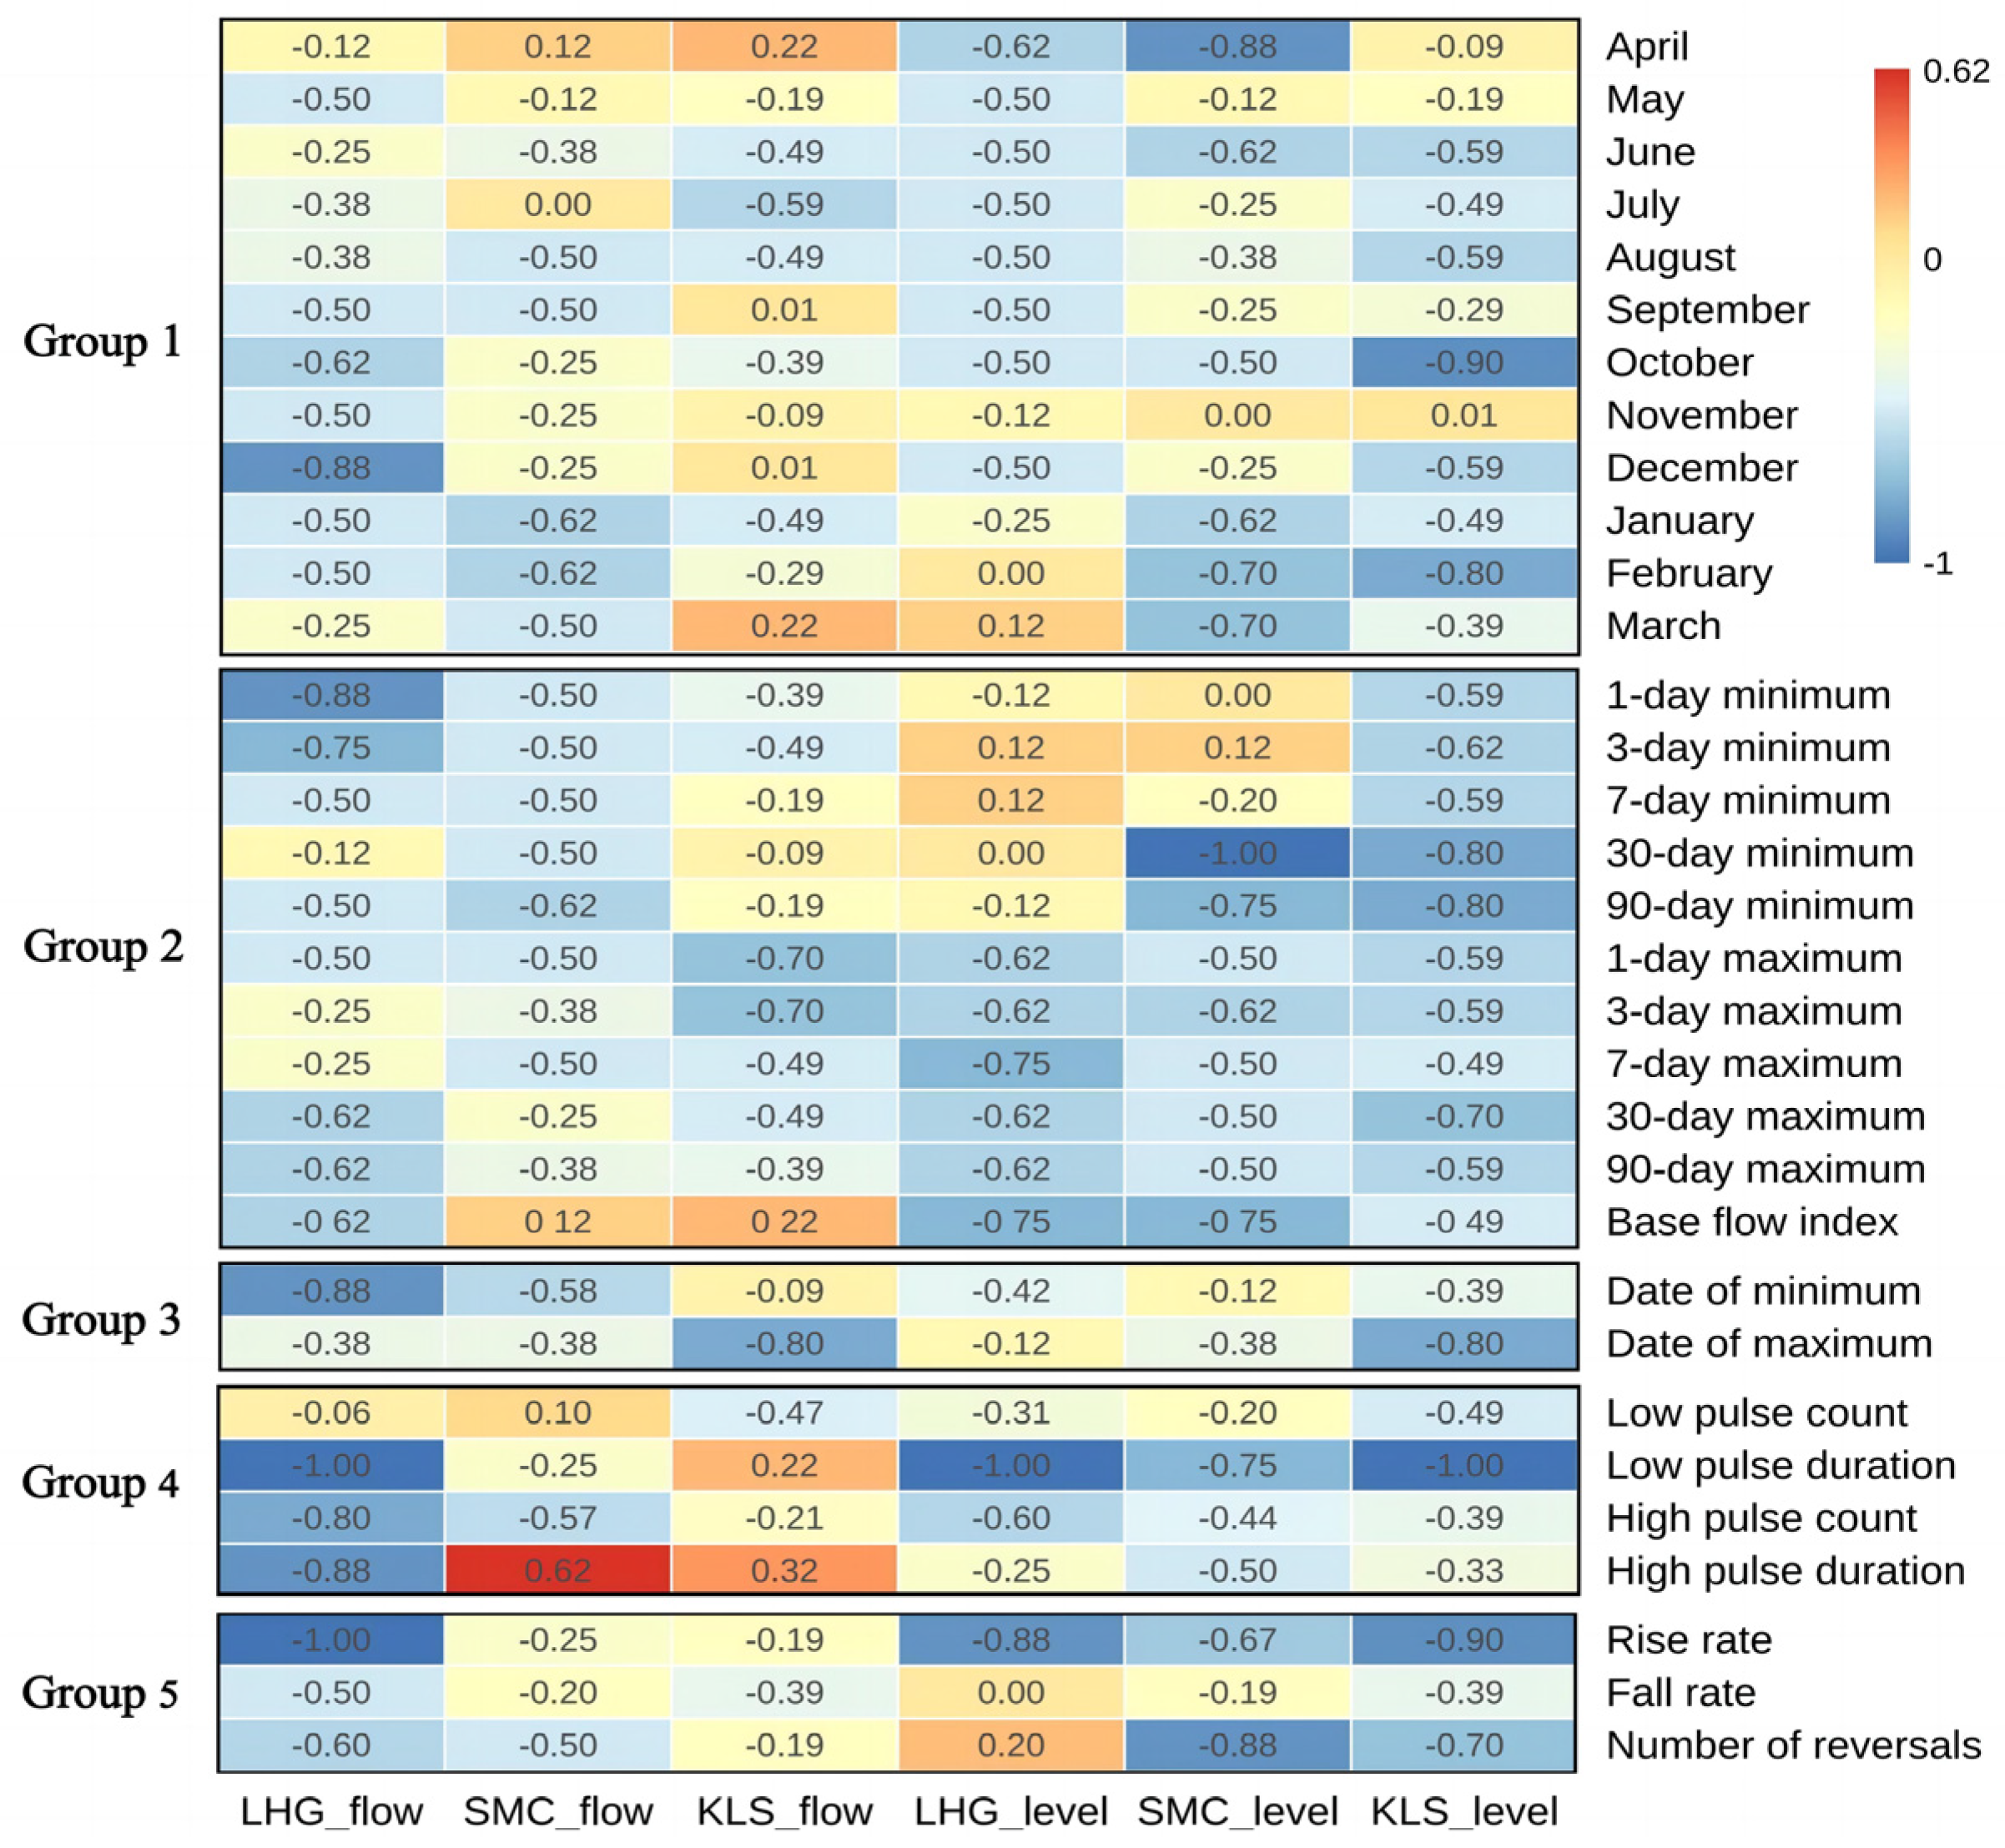
Figure 9.
Rainfall–runoff double accumulation curves: (a) Luoguhe Station; (b) Shangmachang Station; and (c) Kalunshan Station.
Figure 9.
Rainfall–runoff double accumulation curves: (a) Luoguhe Station; (b) Shangmachang Station; and (c) Kalunshan Station.
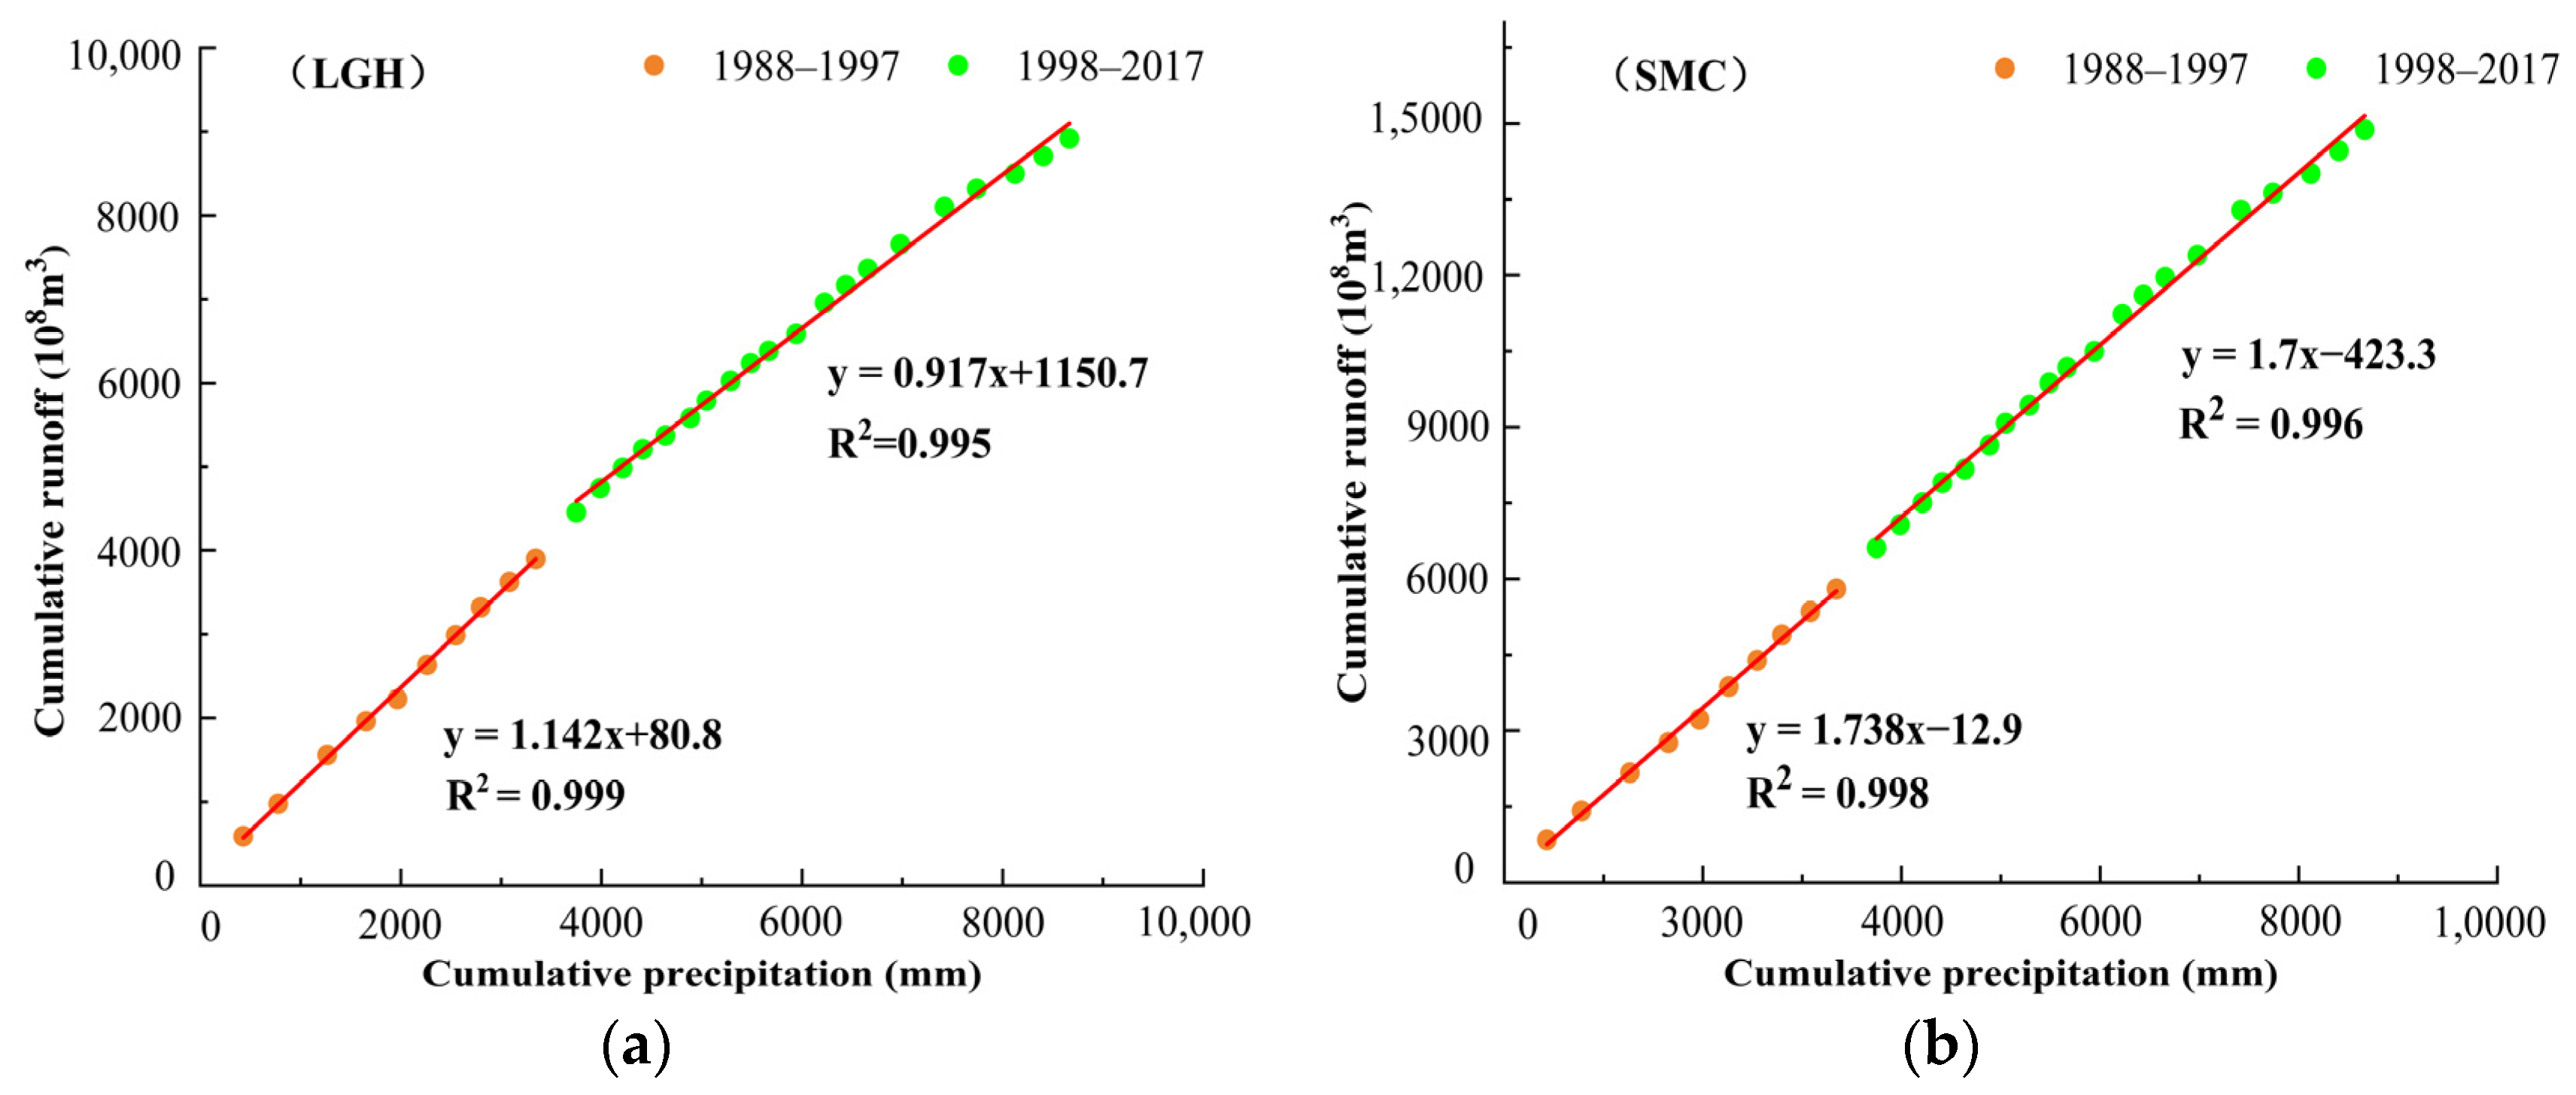
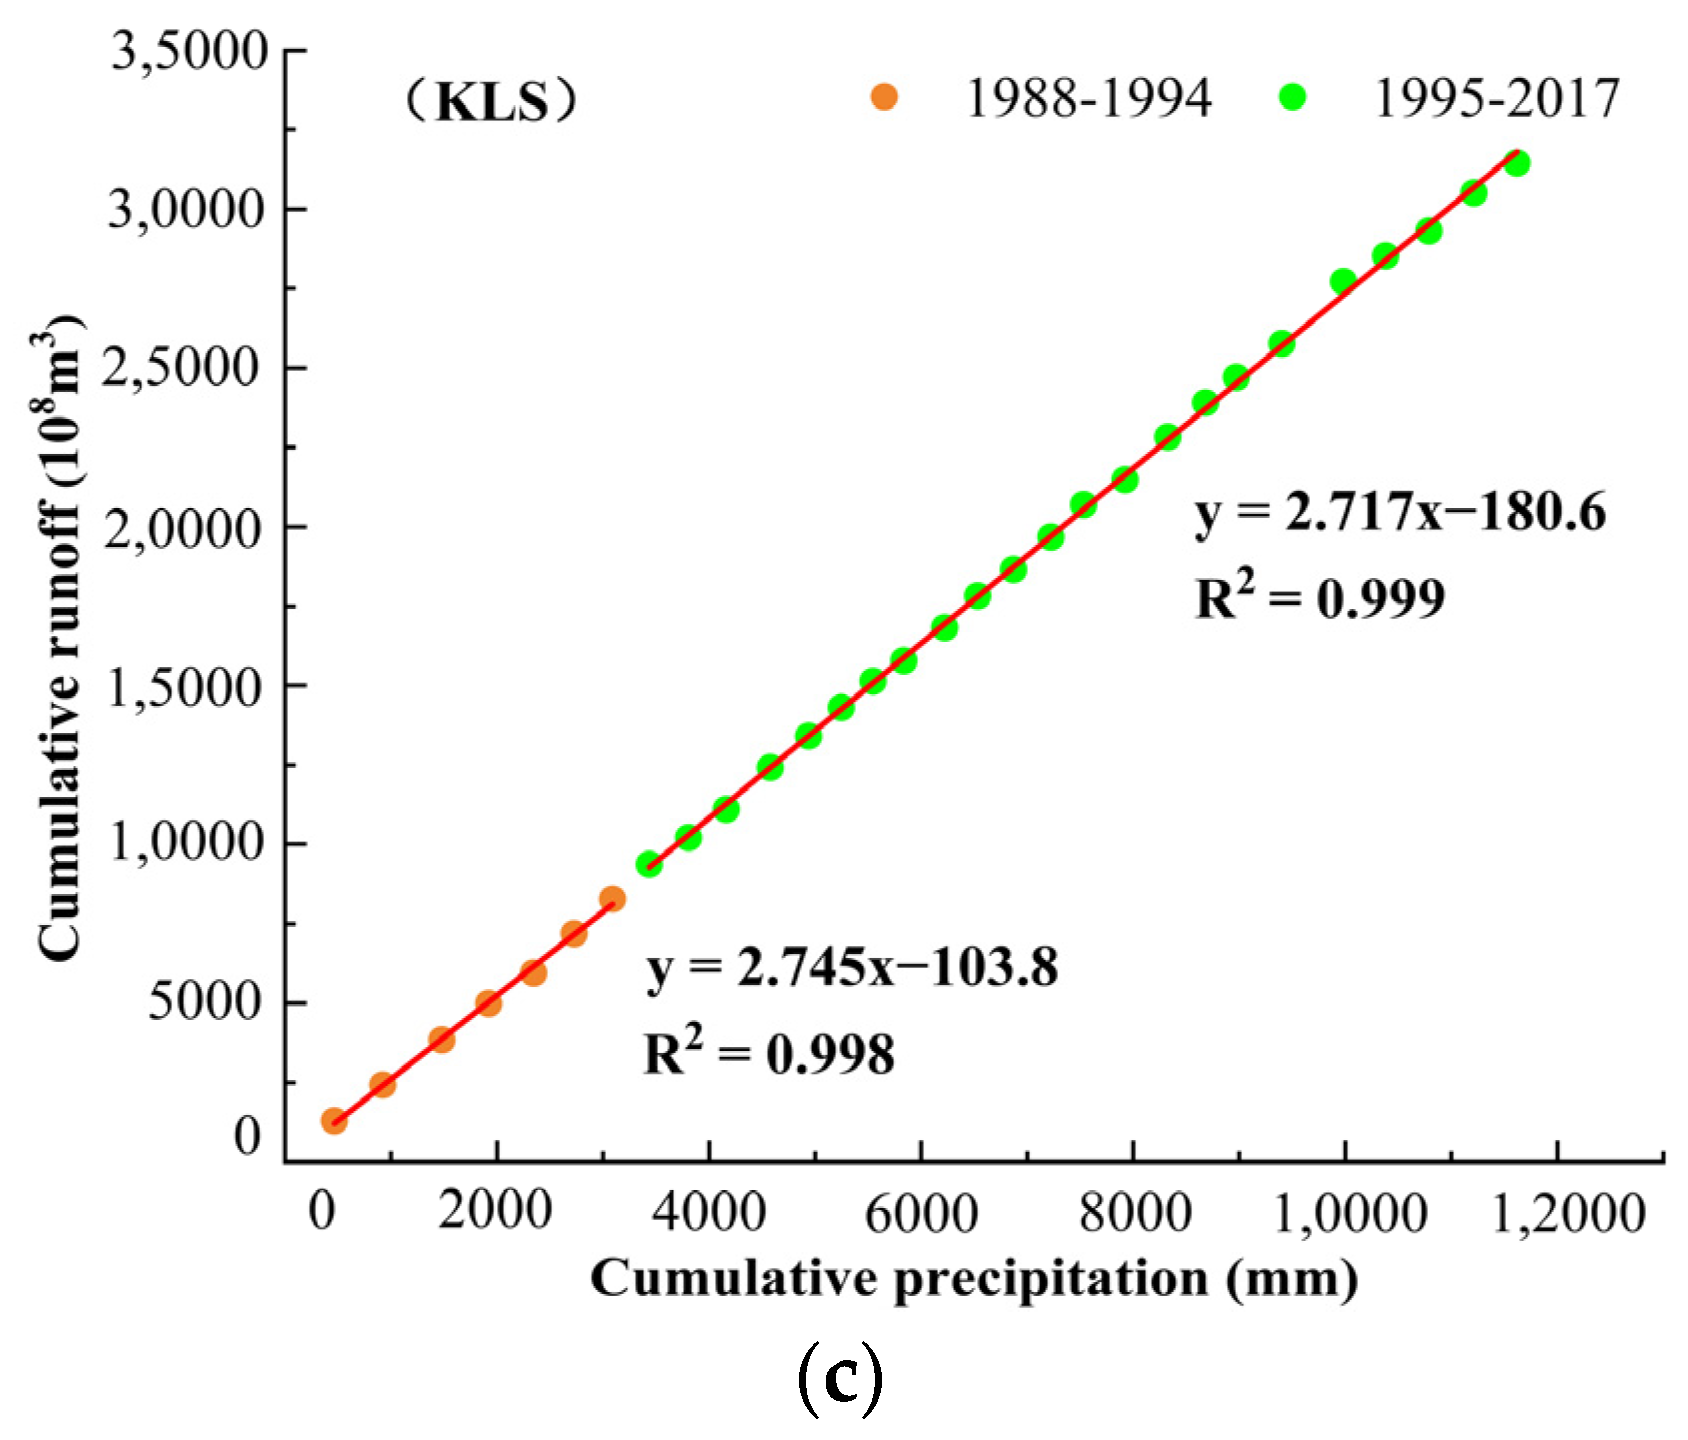
Table 1.
Database information.
| Data Format | Contents | Data Scale | Source |
|---|---|---|---|
| Hydrological data | The streamflow and water level at Luoguhe, Shangmachang, and Kalunshan hydrological stations. | Daily monitored data for the period 1988–2017. | The Hydrological Report of Heilongjiang River Basin, China. |
| Meteorological data | Precipitation data from 75 meteorological stations in the study area. | Daily monitored data for the period 1988–2017. | The United States Global Historical Climatology Network. |
| Digital elevation model | The digital elevation model data in the study area. | 90 m spatial resolution. | The United States National Aeronautics and Space Administration. |
| Geographic data | The State Borders | The ESRI Shapefile. | The Resource and Environmental Science Data Center at the Chinese Academy of Science. |
Table 2.
The 5 groups of IHA indicators.
| IHA Parameter Group | Content | Hydrologic Parameters |
|---|---|---|
| Group 1 | Magnitude of monthly water conditions (subtotal 12 parameters) | Median streamflow (water levels) for each hydrological month |
| Group 2 | Magnitude and duration of annual extreme water conditions (subtotal 12 parameters) | Annual maximum (minimum) 1, 3, 7, 30, 90 d streamflow (water levels) Zero streamflow (water levels) days Base flow index |
| Group 3 | Time of annual extreme water conditions (subtotal 2 parameters) | Maximum streamflow (water levels) date Minimum streamflow (water levels) date |
| Group 4 | Frequency and duration of high and low pulses (subtotal 4 parameters) | High (low) pulse count High (low) pulse duration |
| Group 5 | Rate and frequency of water condition changes (subtotal 3 parameters) | Rise rates Fall rates Number of hydrologic reversals |
Table 3.
Hydrological alteration degree of five groups’ indicators.
| Hydrology Index | Stations | Hydrological Change Degree of Five Groups (%) | |||||
|---|---|---|---|---|---|---|---|
| Group 1 | Group 2 | Group 3 | Group 4 | Group 5 | |||
| Stream Flow /(m3/s) | LGH | 45 (M) | 51 (M) | 63(M) | 68 (H) | 70 (H) | 58 (M) |
| SMC | 33 (M) | 41 (M) | 48 (M) | 2 (L) | 32(L) | 42 (M) | |
| KLS | 21 (L) | 35 (M) | 44 (M) | 4 (L) | 26(L) | 38 (M) | |
| Level /(m) | LGH | 36 (M) | 36 (M) | 27 (L) | 54 (M) | 23 (L) | 48 (M) |
| SMC | 44 (M) | 47 (M) | 25 (L) | 47 (M) | 58 (M) | 53 (M) | |
| KLS | 45 (M) | 64 (M) | 44 (M) | 67 (H) | 54 (M) | 59 (M) | |
Remarks: H represents high degree; M represents middle degree; L represents low degree. LGH—Luoguhe station; SMC—Shangmachang station; and KLS—Kalunshan station.
Table 4.
Hydrological alteration degree of each station.
| Group | Serial Number | IHA Indicators | Change Rate of Streamflow (%) | Change Rate of Water Levels (%) | ||||
|---|---|---|---|---|---|---|---|---|
| LGH | SMC | KLS | LGH | SMC | KLS | |||
| Group 1 | 1 | Median in April | 52 | 41 | 23 | 6 | 1 | 1 |
| 2 | Median in May | 11 | −2 | −7 | 5 | 0 | 0 | |
| 3 | Median in June | 32 | 25 | 17 | 6 | 1 | 1 | |
| 4 | Median in July | 51 | 36 | 29 | 7 | 1 | 1 | |
| 5 | Median in August | 36 | 19 | 11 | 7 | 1 | 1 | |
| 6 | Median in September | 40 | 26 | 18 | 6 | 1 | 1 | |
| 7 | Median in October | 38 | 27 | 22 | 6 | 1 | 1 | |
| 8 | Median in November | 36 | 13 | 5 | 6 | 1 | 1 | |
| 9 | Median in December | 47 | 31 | 17 | 6 | 1 | 1 | |
| 10 | Median in January | 33 | 35 | 20 | 6 | 0 | 1 | |
| 11 | Median in February | 24 | 28 | 17 | 5 | 0 | 1 | |
| 12 | Median in March | 13 | 20 | 4 | 5 | 0 | 1 | |
| Group 2 | 13 | 1-day minimum | 44 | 27 | 16 | 5 | 0 | 1 |
| 14 | 3-day minimum | 44 | 28 | 13 | 5 | 0 | 1 | |
| 15 | 7-day minimum | 45 | 29 | 7 | 5 | 0 | 1 | |
| 16 | 30-day minimum | 18 | 23 | 10 | 5 | 0 | 1 | |
| 17 | 90-day minimum | 28 | 24 | 15 | 5 | 0 | 1 | |
| 18 | 1-day maximum | 27 | 9 | 13 | 7 | 1 | 1 | |
| 19 | 3-day maximum | 28 | 10 | 13 | 8 | 1 | 1 | |
| 20 | 7-day maximum | 29 | 9 | 12 | 7 | 1 | 1 | |
| 21 | 30-day maximum | 30 | 11 | 9 | 7 | 1 | 1 | |
| 22 | 90-day maximum | 34 | 17 | 14 | 67 | 1 | 1 | |
| 23 | Base index | 10 | 5 | −7 | −6 | −1 | −1 | |
| Group 3 | 24 | Date of minimum | 12 | 13 | 12 | −34 | −2 | −5 |
| 25 | Date of maximum | 2 | 6 | 7 | 0 | 1 | 7 | |
| Group 4 | 26 | Low pulse count | −4 | −29 | 23 | −102 | −13 | 20 |
| 27 | Low pulse duration | −16 | 12 | −63 | 23 | 2 | −133 | |
| 28 | High pulse count | 44 | 30 | 22 | 53 | 9 | 26 | |
| 29 | High pulse duration | −54 | 19 | −24 | −5 | 14 | 30 | |
| Group 5 | 30 | Rise rate | 46 | 36 | 28 | 1 | 10 | 17 |
| 31 | Fall rate | 47 | 22 | 23 | 783 | 3 | 18 | |
| 32 | Number of reversals | −24 | −11 | 3 | 7 | −4 | 5 | |
Table 5.
Analysis of the impacts of precipitation and anthropogenic activities on the runoff at different periods.
Table 5.
Analysis of the impacts of precipitation and anthropogenic activities on the runoff at different periods.
| Stations | Period | Measured Values /(108 m3) | Calculated Values/(108 m3) | Measured Runoff Variation | Precipitation Impact | Anthropogenic Activities Impact | |||
|---|---|---|---|---|---|---|---|---|---|
| Change Amount/(108 m3) | Percent | Change Amount/(108 m3) | Percent | Change Amount/(108 m3) | Percent | ||||
| LGH | 1988–1997 | 390.02 | - | - | - | - | - | - | - |
| 1998–2017 | 250.94 | 303.81 | 139.08 | 35.66% | 86.21 | 61.99% | 52.87 | 38.01% | |
| SMC | 1988–1997 | 601.11 | - | - | - | - | - | - | - |
| 1998–2017 | 435.15 | 462.48 | 165.95 | 27.61% | 138.63 | 83.53% | 27.33 | 16.47% | |
| KLS | 1988–1994 | 1170.59 | - | - | - | - | - | - | - |
| 1995–2017 | 1004.11 | 1021.12 | 166.48 | 14.22% | 149.47 | 89.78% | 17.01 | 10.22% | |
Disclaimer/Publisher’s Note: The statements, opinions and data contained in all publications are solely those of the individual author(s) and contributor(s) and not of MDPI and/or the editor(s). MDPI and/or the editor(s) disclaim responsibility for any injury to people or property resulting from any ideas, methods, instructions or products referred to in the content. |
© 2023 by the authors. Licensee MDPI, Basel, Switzerland. This article is an open access article distributed under the terms and conditions of the Creative Commons Attribution (CC BY) license (https://creativecommons.org/licenses/by/4.0/).
Share and Cite
MDPI and ACS Style
Zhang, K.; Ma, K.; Leng, J.; He, D. Alteration in Hydrologic Regimes and Dominant Influencing Factors in the Upper Heilong-Amur River Basin across Three Decades. Sustainability 2023, 15, 10391. https://doi.org/10.3390/su151310391
AMA Style
Zhang K, Ma K, Leng J, He D. Alteration in Hydrologic Regimes and Dominant Influencing Factors in the Upper Heilong-Amur River Basin across Three Decades. Sustainability. 2023; 15(13):10391. https://doi.org/10.3390/su151310391
Chicago/Turabian StyleZhang, Kaiwen, Kai Ma, Jiwei Leng, and Daming He. 2023. "Alteration in Hydrologic Regimes and Dominant Influencing Factors in the Upper Heilong-Amur River Basin across Three Decades" Sustainability 15, no. 13: 10391. https://doi.org/10.3390/su151310391
Note that from the first issue of 2016, this journal uses article numbers instead of page numbers. See further details here.