
Research on Green Consumption Based on Visual Evaluation Method—Evidence from Stone Flooring Industry

School of Fine Arts, Huaqiao University, Quanzhou 362000, China
*
Author to whom correspondence should be addressed.
Sustainability 2023, 15(13), 10453; https://doi.org/10.3390/su151310453
Submission received: 25 May 2023
/
Revised: 26 June 2023
/
Accepted: 27 June 2023
/
Published: 3 July 2023
(This article belongs to the Special Issue Circular Economy in Green Supply Chain and Digital Manufacturing)
Abstract
:Blind consumption discovered in the real application of flooring does not produce the visually anticipated impression, leading to additional time costs and stone flooring waste. Consumers cannot clearly articulate their visual imaging needs when purchasing stone flooring. Due to consumers’ lack of understanding of the visual imagery style of decorative stone flooring, manufacturers are unable to produce more visual styles of stone flooring in response to consumer demand, which leads to an unorganized production process and the wasting of stone resources. Additionally, manufacturers are unable to receive feedback on market demand, which makes communication links between sales teams difficult. A total of 40 adjectives were considered the most appropriate in a pool of 110 adjectives for the visual imagery evaluation of stone after ten interior design professionals with experience in decorative stone applications had narrowed the selection. Following this, a general consumer semantic difference method questionnaire survey and questionnaire data factor analysis statistics were used to create 10 sets of visual imagery adjectives for marble flooring, which were then divided into 10 different types of marble flooring. Following the computer simulation drawing with the 10 groups of visual imagery adjectives design questionnaire, the consumers completed the visual imagery evaluation questionnaire survey. They received a 304-question valid questionnaire, and using the triangular fuzzy number operation in fuzzy theory, they arrived at 10 marble floors in the visual imagery evaluation score. In order to clarify the current consumer demand for stone floor imagery, the high sales volume of stone flooring on the market for visual style division, which can guide consumers according to their visual needs for an efficient choice, can enhance the efficiency of communication between consumers and sellers. It can also help enterprises clarify the market consumer demand for orderly production to achieve the purpose of green consumption and to ensure the sustainable development of the decorative stone flooring market.
1. Introduction and Background
In order to meet the enormous market demand for decorative stone, decorative stone production companies have been increasing production volumes blindly, which has worsened the situation with stone waste, stone quality decline, stone defects and cracks, etc. In the mining process, 60% to 70% of the stone is wasted, and some of the waste is also accounted for because the quarried marble pattern cannot satisfy the market demand for decoration. The producers lowered the price to increase sales due to the disordered manufacturing, which led to severe competition in the marble market, creating a perverse style of selling marble. In addition, there are issues with resource waste and environmental degradation throughout the marble mining process.
Although consumers’ opinions on the value of the feelings generated by the marble and the designer differ, these feelings will affect consumers’ design preferences to judge the standard; the consumers and designers with the same objective of choosing marble will help both sides. For designers and consumers in the docking interior design, designers can use the stone’s shape, color, and material to meet the design needs of consumers and explain the design concept. The standardization of green consumption in the market should be improved in order to promote consumption efficiency while reducing resource waste at the same time that consumer awareness of environmental protection has grown and the demand for green services has increased [1]. The purpose of this study is to examine consumer demand for visual representations of ornamental stone flooring and to promote green flooring production and consumption. Then, it becomes difficult to effectively choose the right marble flooring products for their own needs, often causing consumer distress. Using objective research on different stone flooring and different visual psychological feelings of people, research, and analysis to explore the visual imagery in the consumer evaluation of this material, will help close the gap between designers and consumers on the perception of stone flooring materials, and enhance the sustainability of stone flooring consumption.
In order to accomplish the sustainability of the mining environment, several studies have begun by enhancing the production process for stone flooring and lowering the production of stone waste stones [2]. No scholars have begun their research from a green consumer perspective, looking at the consumer visual imagery evaluation of clear marble color and texture style to meet the market consumer choice and improve market sales. There is some research from the stone texture classification perspective that examines the quality of marble texture, improves the quality of stone production, meets consumer marble preferences, and improves the sustainability of market sales.
2. Literature Review
Consumers’ own values—which encompass four facets: functional, perceptual, social, and emotional values—have an impact on the choices they make. According to several studies, those who are more concerned with social effects and social responsibility are more inclined to support sustainable development and purchase environmentally friendly items [3]. Young people’s environmental awareness and their ability to embrace digital lifestyles are the key drivers of green consumption [4]. These values can be further broadened into environmental, ethical, and health values in the context of green consumption [5]. Although customers are aware of the advantages of green products for the environment and their health, there is some hesitancy and ambiguity when it comes to making a purchase [6]. On the other hand, consumer purchase behavior is primarily influenced by environmental beliefs, environmental education, and family factors [7]. Consumer green consumption behavior has emerged as a key component of marketing research because it is primarily motivated by consumers’ desires to protect the environment and achieve harmony between humans and nature. Green consumption is crucial to the operations of business and production units, and it may be encouraged through increasing environmental awareness among consumers as well as the pursuit of environmental protection during the consumption process [8,9]. Therefore, stone flooring production and sales should be tailored to consumer consumption needs in order to ensure that sustainable production and consumption are mutually reinforcing [10]. This will help to better balance and coordinate consumption and production. Green design must be incorporated into the production of stone decorative flooring under the direction of sustainable development, starting with the clarification of the real needs in order to support the sustainability of the subsequent links, achieving efficient resource and energy use, and lessening the environmental impact [11]. The green consumption idea, environmental awareness feedback to customers so that customers can accept the green consumption concept designed under the beautiful stone flooring, can produce positive guidance on the attitude and subjective norms of customers regarding green consumption products [12]. When ecologically friendly ornamental stone flooring is produced, consumers may become more aware of the need for environmental protection and may even demand it [13]. As a result, they may choose to make more environmentally responsible purchases.
Scholars have given the study of sustainability in the stone industry more consideration. Robichaud et al. suggested incorporating the idea of sustainability into the manufacture and use of construction materials such as ornamental stone [14]. According to Luodes et al., the exploitation of waste rock can lead to sustainable usage of the material [15]. Remanufactured goods, according to Abbey et al., have a wide market potential and significant economic and environmental benefits in the closed-loop supply chain of consumer goods. They can conserve resources, cut costs, boost profits, and decrease waste production and environmental pollution, all of which have significant environmental and sustainable development implications [16]. According to Rebello et al., recycling decorative stone waste through processing is a resource-saving and sustainable way to lessen the impact on the environment [17,18]. Remanufactured products in the market feedback research show that they are more acceptable to consumers with high ambiguity tolerance; if manufacturers can strengthen the quality control and certification of remanufactured products, they can be recognized by green consumers [19,20]. Green consumers frequently favor natural building materials in architectural design. Man-made materials can provide users with the same visual experience as natural materials [21], and can also lower production, operation, and maintenance costs, as well as reduce carbon emissions while promoting environmental sustainability [22,23,24]. This is due to a shared orientation towards sustainability and the scarcity of natural resources. In the same way that new technologies can increase the efficiency of energy use to achieve environmentally sustainable production processes, it is proposed that the use of ultrafast laser surface technology in the process of processing stone can prevent environmental pollution issues such as wastewater, waste rock, and harmful chemical waste [25,26]. In order to advance environmental technology planning, Ikram M. et al. proposed a new hybrid decision model that integrates qualitative and quantitative analysis techniques as well as the requirements, advantages, costs, and risks of technology development for various stakeholders. This model is intended to assist decision makers in making more thorough and scientific decisions in green technology planning [27]. The fundamental idea behind encouraging green consumption is to protect the safety and attractiveness of the things people buy. This experimental model can be used to test the safety of different stones. There is an experimental model that proves the difference in the quantity of radioactive elements in the sample granite and the overall compliance with the requirements of the use of ornamental stone [28].
Through the aforementioned study, we have gained insight into how many experts and academics take into account green behavior and sustainability from production, material, and process perspectives, with the goal of minimizing environmental damage from production and conserving marble resources. The research findings offer theoretical support and feasibility analysis for production improvement of businesses. However, the high cost of technological advancements such as equipment replacement does not clearly define consumer preferences, and regulatory constraints may prevent their adoption [29]. Through research, it was discovered that there were no scholars at the consumer level to guide the green consumption of decorative stone research, which is very important for study. This means that manufacturers’ efforts to tackle the issue of their manufacturers’ chaotic production are ineffective. According to a preliminary study, consumers of marble flooring make their decisions mostly based on their own personal perceptions of marble flooring’s color, texture, and degree of roughness, as well as their needs for clear consumer visual images and feedback on demand for manufacturing, sales, and other factors. Continuously optimizing and upgrading according to market changes, strengthening the support and assistance among relevant stakeholders, and realizing the business exchange model are important for promoting sustainable development and environmental protection [30], as well as promoting the green consumption of marble flooring.
3. Visual Imagery Evaluation Methods
Imagery is a mental representation that imitates actual sensory experiences; for instance, humans may visualize the appearance, color, and texture of an apple. The emulation of non-sensory information, such as emotion, context, and memory, can also occur in imagery. The emulation of sensory information includes visual, aural, and tactile information. Imagery’s qualities include steadiness, accuracy, and detail [31]. Through the input of human behavioral perception and aesthetic and perceptual output, the cognition of materials transforms into a process of emotional imagery. According to Peng Mingling, imagery is the depiction of things that do not yet exist and that have distinct perceptual properties. It represents the output of certain objects and events to the outside world. According to the many ways to stimulate people and the various sensory channels, imagery is divided into visual imagery, auditory imagery, tactile imagery, gustatory imagery, olfactory imagery, and motor imagery. Because visual imagery plays such a significant role in daily living, it is typically the primary focus of research when imagery is studied in psychology [32]. According to the experimental findings on preferred imagery, 97% of participants preferred visual imagery, 93% preferred auditory imagery, 74% preferred motor imagery, and 70% preferred tactile imagery. A total of 67% favor savory imagery and 66% preferred smell-based visuals [33].
Stone color, texture, and other design elements can influence the space atmosphere, visual effects, and the way the human eye perceives directionality. They depend on how the stone is arranged, the space atmosphere it creates, and the material texture direction, which affects the optical illusion of space size [34]. Nakamura et al. evaluated the visual impression of texture patterns at the borders of various printed pictures using sensory evaluation [35]. Stone, as a part of urban building materials, can have a profound emotional, sensory, and affective impact due to its sound, tactile, and visual qualities [36]. The process of a consumer choosing stone flooring is actually the process of their brain consciousness extracting and summarizing the qualities of marble, followed by their conscious preference to actively match the sample characteristics they have extracted to complete their selection of decorative stone flooring. Using binary space division, Gonçalves et al. developed a hierarchical neuro-fuzzy classification approach for classifying macroscopic rock textures [37]. The images can be transformed to HSV color space, a small number of representative colors are quantified, and texture characteristics are retrieved based on the uniform pattern of rotated RLBP (rotated local binary pattern) [38]. Lepistö et al. used a non-uniform texture image, partitioned into several regions of the texture features derived by the co-occurrence matrix, to distinguish the rock texture as a color parameter [39]. It has been noted that using different scales of the RGB and HIS color spaces, and Gaussian filtering of the color channels of images to obtain low-dimensional feature vectors, can improve the accuracy of stone classification. The accuracy of extracted features influences the accuracy of feature extraction [40]. A fuzzy model technique based on perceived texture can reflect the imprecision associated with texture attributes and achieve the selection of the most suitable computational metric for each attribute since there is a certain bias in the accuracy values [41]. Using a grayscale co-occurrence matrix, Haralick et al. present an alternative approach for classifying stone textures. They describe the computation process and feature extraction method in depth and suggest an updated method to increase the method’s accuracy and stability. In addition, the essay describes how to identify the retrieved texture characteristics using classifiers such as SVM. Experiments are used, in the article, to demonstrate the method’s efficacy and viability [42]. While there is some novelty and viability in these studies’ use of various software and hardware tools for stone texture categorization research, putting the application into actual usage is more expensive and challenging. We think that to produce a feature classification approach that ignores the application of the crowd, which is lacking in practical importance, the classification of marble texture features must be based on customer demand.
Before extracting stone texture, image-processing algorithms can be used to extract stone texture and color features, providing a quick and accurate way to evaluate the sample image quality. The use of mathematical models can provide complex perceptual imagery to visual data and clear intuition to feel the difference between the samples [43], Thomas et al. summarize the features of texture images by developing a physiologically relevant computational model of texture perception combined with modulation mechanisms to detect the brightness, orientation, spatial frequency, and color of texture images [44]. The brightness, grain direction, and color of the decorative stone samples will be adjusted to the best of their ability in the following research study in order to lessen the subjective influence that the samples’ presentation state has on the respondents. This method can accurately reflect the overall characteristics of the samples. Semantics is used to provide people’s evaluations of stone flooring images, and the evaluation dimension includes sensory, emotional, and assessment dimensions [45]. Yan et al. used discriminant analysis, cluster analysis, multidimensional scaling, and semantic differencing to study the material texture image experiment, and established a digital model by neural network to accurately describe the texture image and establish the quantitative relationship between objective parameters and subjective perception of the material, taking plastic materials as an example [46]. This study, which quantifies consumer impressions of materials, is applicable to other material studies. The scholars Guo et al. point out that when evaluating for texture, the more adjectives there are, the better the understanding of the characteristics of the texture [47]. Respondents are able to more clearly understand the subjective imagery that the adjectives may relate to as a result of the renaming of the imagery adjectives used in this study using the findings of factor analysis research, which allows them to assess the adequacy of the sample.
The AHP-TOPSIS technique was employed by Ahmed et al. to identify the sorts of stones that contribute to economic, environmental, and sustainable development. The study’s findings revealed that stones that are ideal for use as building materials should have superior usability, physical qualities, and decorative look [48]; we contend that this research methodology places too much emphasis on theoretical application, whereas, in reality, consumer behavior can clarify which stone has better physical characteristics and aesthetic adornment. The surface roughness, color, and texture of marble samples can have a significant impact on visual imagery studies [46]. Some studies have shown that surface roughness will have an impact on color brightness, saturation, and hue changes; the greater the stone’s surface roughness, the lower the stone’s color brightness; the smaller the stone’s surface roughness, the greater the stone’s color brightness. Different surface treatment methods will have a significant impact on the surface quality of marble, producing different visual characteristics [49,50]. Additionally, when conducting research and analysis, different lighting conditions in the space where the samples are displayed will affect how people perceive the color of various marbles. As a result, when observing various marble samples, you should do so in a setting with lighting that can reflect the slabs’ colors as accurately as possible [51]. One study found that respondents’ perception of space received the influence of material texture, and that the influence on material texture associations varied by room size. The effects of subjectivity and ecology become more pronounced in larger rooms [52]. Summarizing the aforementioned, we will select a somewhat bright room for the interview process because it can effectively restore the color and texture of stone. In order to evaluate the quality of wood flooring using color, texture, brightness, and other indicators, Chen et al. developed an evaluation model based on fuzzy logic. The method can more objectively evaluate the visual imagery of wood flooring, can take into account the consumers’ subjective feelings, and can clearly display the texture style of wood flooring to encourage effective green consumption [53]. To assist consumers in understanding decorative stone styles, no prior research had merged visual imagery evaluation with decorative stone.
4. Research Methodology
4.1. Research Processes
This study aims to investigate the visual imagery evaluation of various decorative stone flooring, first gathering adjectives related to the semantics of the visual imagery of stone, the collected adjectives set, through the interior designer to filter out the set of 40 appropriate adjectives for describing marble flooring; then, the general consumer semantic difference method questionnaire survey, the results of which are then statistically analyzed using factor analysis. Figure 1 shows the flow chart of this study.
The study chose to interview domestic market sales of high-end decorative flooring producers because of the broad variety of decorative stone flooring available. The top 10 marble flooring kinds, as determined by the turnover provided by the stone flooring producers, are listed below. This research investigation included 10 different types of decorative stone flooring as its sample.
With the aid of the 3ds Max software, 10 renamed decorative stone flooring visual imagery evaluation adjectives, 10 different types of decorative stone flooring visual imagery evaluation questionnaire design surveys of consumers, and a questionnaire survey simulation screen, Table 1 collected 10 different types of decorative stone flooring product images (see Figure 2). The surveying activities are carried out to make sure that the hue of the stone decorative flooring picture is normal and to carry out tasks in a comfortable setting with good lighting. Following the examination of the utility value of each imagery evaluation word and the visual imagery evaluation adjectives corresponding to the marble species, the imagery evaluation questionnaire data are applied to fuzzy theory triangular fuzzy number operations.
4.2. Factor Analysis
A multivariate statistical analysis technique known as factor analysis is used to isolate factors or latent variables that are similar to a group of variables and then combine them into fewer explainable factors. The main goal of factor analysis is to discover the inherent structure in the data in order to better understand the data and infer the underlying reasons behind the data. It is frequently used in areas such as data dimensionality reduction, data compression, data visualization, and model building. These factors explain the common variance of the original variables, thus reducing the number of original variables and revealing the underlying structure among the variables [54].
In the social sciences, factor analysis is frequently used to describe relationships between variables, and validating factor analysis confirms the degree of difference between two factors [55]. The majority of the original data’s content can be retrieved thanks to factor analysis, which can represent the original data with fewer vectors.
4.3. Fuzzy Logic
After L.A. Zadeh, a cybernetics specialist at the University of California, published Fuzzy Sets in 1965, fuzzy mathematics was initially put forward as a new field of mathematics. According to Zadeh, there is ambiguity in people’s subjective thoughts and inferences about how they perceive the objects around them, and that precision in real life is not always perfect. Zadeh also suggested that using fuzzy logic appropriately will make it convenient for people to assess the extent to which something is in their lives. This results from the basic distinction between how the human brain and machines operate. Forcing a conceptual delineation for a concept that is not rigorously bounded using the correct and incorrect criteria would undoubtedly result in fallacies [56].
Binary logic (also known as true or false or two must select one) is an absolute thought that abandoned the ambiguity of the object itself and the abstract predisposition of certain extreme features in order to accomplish the goal of accuracy. In order to quantify fuzzy ideas so that the subordination of the elements to the set is controlled to any value in the range (0, 1), conclusions with a certain degree of precision can be formed from the data while dealing with subjectively inaccurate non-quantitative fuzzy phenomena [57].
Fuzzy research techniques that are frequently employed in the semantic analysis include the triangular fuzzy number, the trapezoidal fuzzy number, and the normal fuzzy number, with the triangular fuzzy number being the most popular. Figure 3 shows a plot of the trigonometric fuzzy number affiliation function.
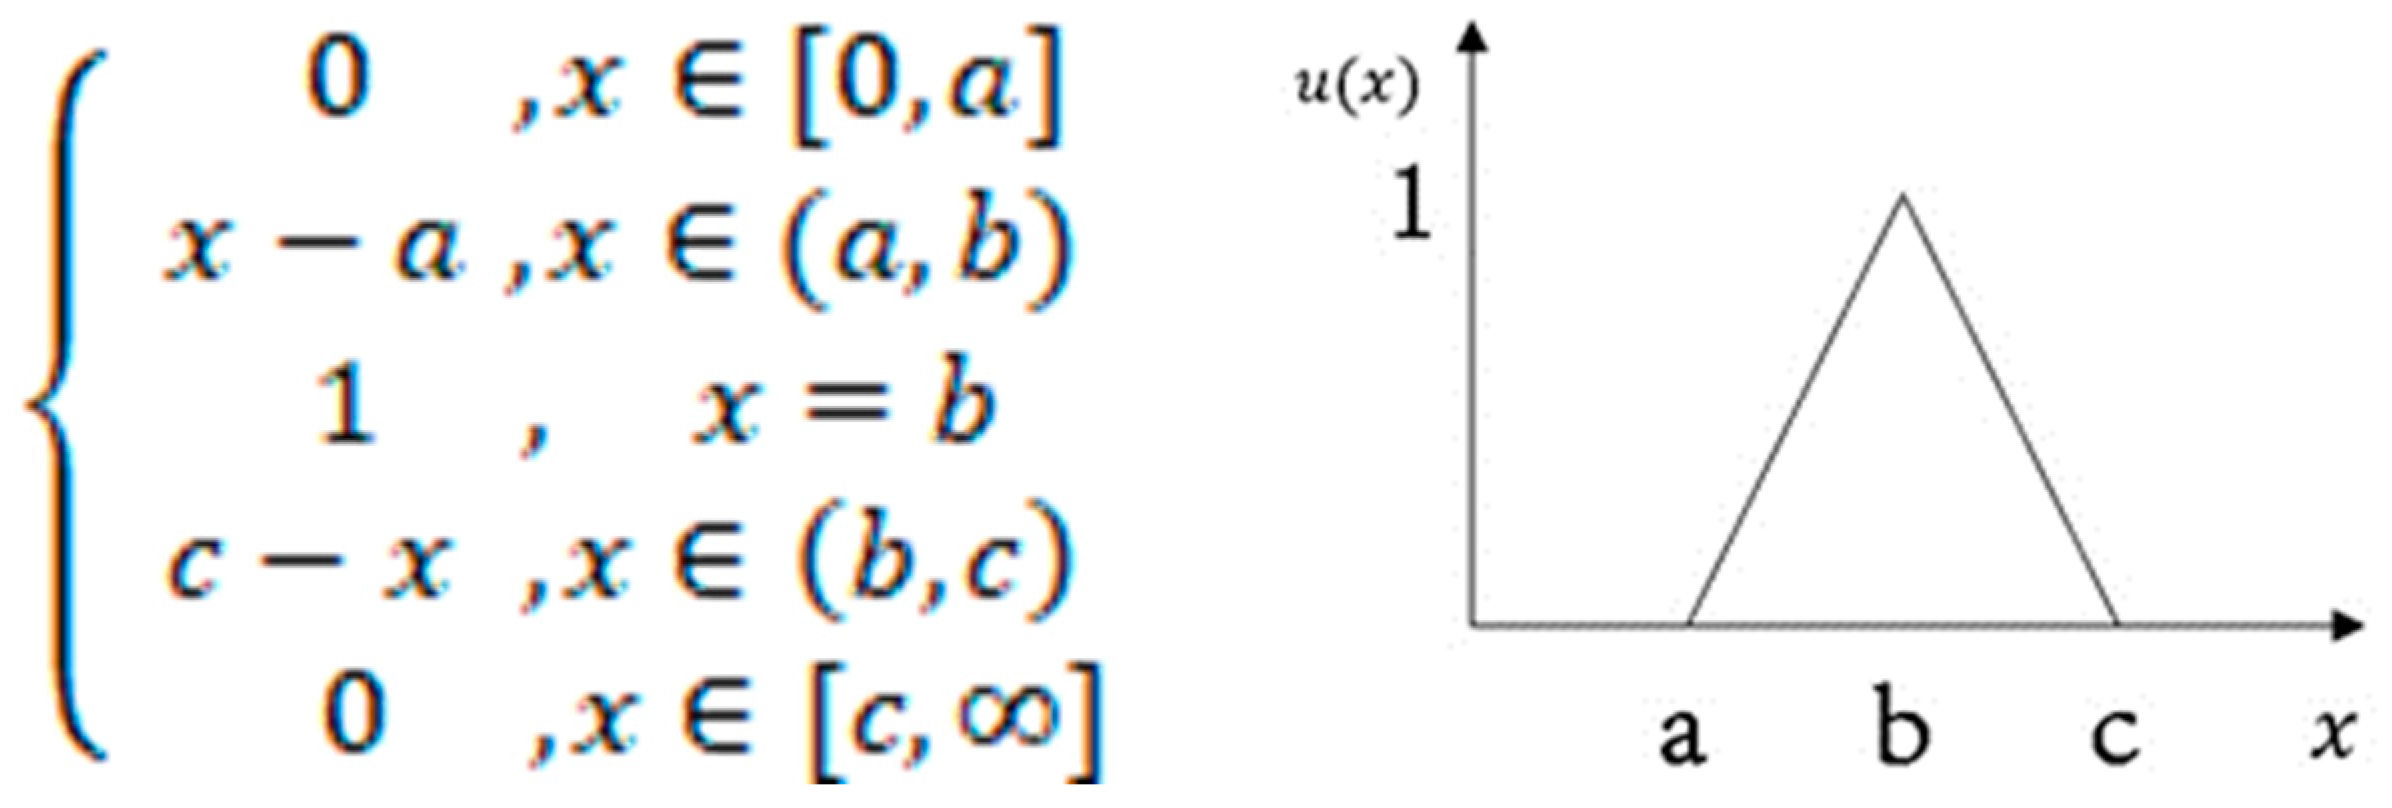
4.4. Triangular Fuzzy Numbers and Semantic Variables
Information on the affiliation function’s data possibilities in the triangle-shaped fuzzy number formed by its coordinates. Suppose s a triangular fuzzy number in the affiliation function , which is denoted as = (, , ), when , , are real numbers and ≤ ≤ , then this affiliation function can be expressed as in Figure 4 [58].
Semantic variables are employed as an evaluation approach to ascertain the relative relevance of user needs and the ranking of product options, as indicated in Table 2 for the seven levels, in order to assist consumers and associated practitioners in more easily and accurately expressing their judgments: very low (VL), low (L), medium-low (ML), medium (M), medium-high (MH), high (H), and very high (VH). Figure 5 shows a plot of the values of the affiliation of the triangular fuzzy function. It enables users to subjectively assess the diversity between various meanings of the research item. The relationship between the possible features and semantic affiliation of the study item is described by the triangular fuzzy numerical representation that corresponds to the semantic variables table.
4.5. Total Utility Value
The affiliation function’s triangular fuzzy number can be defuzzified to become a collection of precise values. The center of gravity approach, maximal subordination method, maximizing set and minimizing set method, etc., are some of the ways frequently used to solve fuzzy processing. The most popular techniques among them are the shrinking set method and the maximizing set method. In this study, Chen (1985)’s maximizing set and minimizing set method was used to calculate the triangular fuzzy numbers’ total utility value by calculating their weights [59]. The n alternatives were then ranked, and the total utility value of the fuzzy numbers was then calculated as follows:
Suppose the triangular fuzzy number affiliation function has n triangular fuzzy numbers, which will be defined as = (, , , = 1, 2, ……, n, so the minimum affiliation function and the maximum affiliation function can be derived as and , respectively, then the total utility value is of the triangular fuzzy number . The formula is:
The study uses a questionnaire survey based on fuzzy semantic theory to understand consumers’ evaluation of 10 different types of marble flooring visual imagery. The results of the above fuzzy theory’s numerical formula are used to calculate the total utility value of each evaluation of the visual imagery of each marble floor, and the values are then plotted on a chart for 10 different types of stone flooring visual imagery’s comparative analysis. The study’s conclusions can be provided in pros and cons.
4.6. Factor Analysis Result Renaming
As the primary resource for filtering image descriptors, this study looked at stone decoration-related interior design periodicals (La Vie, ARCH, INTERIOR, etc.). After finally extracting visual imagery adjectives appropriate for decorative stone floors, excluding repeated low-frequency adjectives, compiling and summarizing the resulting 110 adjectives (see Table 3), and using these 110 imagery adjectives as the questionnaire for this study, the first quick experiment in extracting imagery adjectives was carried out.
The 110 imagery adjectives were turned into a questionnaire and identified by 10 highly respected individuals with experience with ornamental stone in interior design. Five men and five women, aged between 35 and 45, with extensive design experience were asked to choose 40 to 50 adjectives from the list that best fit their individual expectations of the best adjectives to describe the imagery of decorative stone flooring. The top 40 adjectives were then determined using a collated count of the findings (see Table 4).
A total of 304 responses were obtained in the second stage of the questionnaire’s administration, which used a five-point Likert scale (very low, low, medium-low, medium, medium-high, high, and very high). Consumers who are shopping for ornamental stones between the ages of 25 and 50 make up the target audience for the study, which takes the form of questionnaire visits. The collected data from the 304 valid questionnaires were then subjected to factor analysis.
The 40 adjectives with a discriminatory degree after the T-test evaluation are shown in Table 5. The 40 indicators were subjected to first-factor analysis, as shown in Table 6, and through the results of principal component analysis, the absolute value of factor loading was taken. The data of the questionnaire survey results were analyzed by SPSS statistical software for factor analysis. The second-factor analysis was carried out when there were 22 factors greater than 0.6, as can be seen in Table 6.
Table 7 displays the KMO and Bartlett test findings following the factor analysis. The KMO value is 0.593, suggesting that the analysis information is appropriate.
Table 8 displays the overall variation that is explained. According to the rotational matrix, Table 7, there were 11 components with initial eigenvalues greater than 1 that collectively explained 60.022% of the total variance. Each of the second-factor analysis’s 11 components was quite distinct and did not overlap any of the other components; as a result, the second-factor analysis’s 22 adjectives’ 10 components were available.
In this study, the first step is to obtain the adjective set for the evaluation of visual imagery of wooden flooring. As a result, factor analysis was used to select, from a pool of 40 adjectives, 22 adjective clusters with a total of 10 factors. The next step is to rename the factors using the appropriate adjective set characteristics in each factor cluster. The data characteristics of the 22 factors are shown in Table 9. The results are displayed in Table 10.
4.7. Visual Image Evaluation of Decorative Stone Floors
Based on the 10 decorative stone floorings renumbered in Table 1 as Table 11, the material images of each species were collected, and the simulated realistic scenes were drawn by 3ds Max computer software, with the aforementioned renaming of the 10 visual imagery adjectives, and the triangular fuzzy number scale of Table 2 (very low (VL), low (L), medium-low (ML), medium (M), medium-high (MH), high (H), very high (VH)) to design a scale questionnaire to conduct a questionnaire survey of consumers’ evaluation of the visual imagery of 10 kinds of decorative stone flooring. The resulting statistics obtained 103 valid samples, according to the results of the questionnaire, organized into triangular fuzzy numbers to describe the relationship between potential traits and semantic wording affiliation; the specific results are shown in Table 12. The triangle fuzzy value plots of 10 beautiful stone floorings together with each visual imagery assessment are shown in Figure 6.
Based on the data in Table 12, the absolute utility value of the triangular fuzzy number is calculated by the formula
where = (4.3, 6.1, 7.6), = 3.6, and = 7.6.
The exact results are displayed in Table 13 following the sequential calculation of the 10 materials’ decorative stone flooring visual imaging evaluation usefulness table.
5. Results and Discussion
- With the exception of the LS, where the evaluation of factors 6, 8, 9, and 10 is significantly lower than that of other decorative stone flooring, there are not many differences in how various types of stone are evaluated as decorative stone flooring.
- GW scored highest for factors 3 and 9, while BW scored highest for factors 4 and 8, with factor 8 having the highest evaluation value. FW scored highest for factors 1, 6, and 10, with factor 10 having the highest evaluation value. SW scored highest for factor 2. For factor 5, RT scored the highest, while for factor 7, SF scored the highest.
Following a thorough comparison of each material, the visual imagery evaluation scores for 10 different types of decorative stone flooring are further plotted by radar diagram. As can be seen in Figure 7, the overall comprehensive visual imagery evaluation is more evenly distributed throughout each visual imagery evaluation word.
Different types of decorative stone flooring have distinctive visual texture effects and will cause different types of visual imagery evaluation. Consumers can match the expected effect of decoration more effectively with clear consumer visual imagery styles of decorative stone flooring, which also enhances the effectiveness of communication between buyers and sellers and encourages environmentally friendly decorative stone flooring consumption by preventing the waste of decorative stone resources and environmental pollution.
6. Conclusions
According to preliminary market research, the most favored stone flooring types are French wood grain, Silver White Dragon, Guizhou wood grain, Black and White Root, Roman Travertine, Black gold pattern, Wood grain jade, Legend of the Star River, Snowflake White, and Black Crystal Jade. Additionally, we compiled 110 adjectives that frequently appear in images of ornamental stone flooring from the research literature on stone decorating and interior design publications. By researching ten of the top interior designers in the business, the number of adjectives was further lowered.
To better understand and analyze consumers’ attitudes and preferences for green consumption of decorative stone flooring, the most crucial factors for green consumers can be identified through factor analysis of a large amount of visual imagery evaluation data. Fuzzy logic can then be used to convert consumers’ fuzzy evaluations into numerical results. Researchers can quantify green consumption traits by combining triangular fuzzy analysis and component analysis. A quantifiable indicator system for the green consumption characteristics of decorative stone flooring can be built by establishing weights and scores. A valid basis for customer decision-making, such a system of indicators, can be used to evaluate and compare the environmental performance of various stone flooring products. Researchers can make conclusions and recommendations about decorative stone flooring’s green consumption based on the findings of factor analysis and triangulation fuzzy analysis. These recommendations can be used to create product improvement strategies and marketing strategies to support the growth and promotion of green consumption behavior.
The purpose of this study is to examine consumer demand for visual representations of ornamental stone flooring and to promote green flooring production and consumption. The study developed a quantitative statistical method for gauging consumers’ opinions of the visual representation of stone flooring using the statistical methods of factor analysis and the semantic scalar scale of triangular fuzzy theory. The study’s findings highlight the visual textural impacts of various decorative stone floors as well as the various visual imagery evaluations generated, offering suggestions for further study and application in relation to the creation of stone floors.
In a managerial sense, the study provides insight into the consumer needs and preferences. Manufacturers can design and create for various market segments to avoid blind production that results in stagnant flooring and resource loss by correctly matching consumer imagery of stone flooring. This specialized production model helps the stone flooring industry move in the direction of sustainable development while also catering to consumer preferences and reducing the production of waste stone.
The findings of the research demonstrate that various decorative stone floorings have a distinctive visual texture effect and will elicit various evaluations of visual imagery. Customers typically decide on the best flooring style before buying stone flooring based on their individual aesthetic preferences and space design requirements. However, the flooring purchased frequently does not produce the desired effects due to poor communication or faulty information transfer between customers and sellers. Consumers are inconvenienced by this condition, which also wastes resources and pollutes the environment.
The essential component of this strategy is to define the textural style of each decorative stone floor in order to effectively match the consumer’s mental image of the stone floor in order to enhance the effectiveness of communication between customers and sellers and to avoid discrepancies with the expected results. Stone flooring producers may create and produce stone flooring for various market segments by gathering and evaluating data on consumer demands and preferences. This specialized production process not only prevents flooring production standstill, but also minimizes the production of stone waste. Manufacturers may limit resource waste, lessen negative environmental effects, and move the stone flooring sector toward sustainability by accurately satisfying consumer expectations. Consumers that identify as “green” are more concerned than ever with sustainability and environmental protection, and they favor goods that are less harmful to the environment. Manufacturers can obtain an advantage in the cutthroat market and draw in more ecologically conscious customers by providing stone flooring that is in line with consumer imagery. As a result, green consumption will grow even more, and society as a whole will advance in a more sustainable direction.
There are certain restrictions on this study, though. First of all, the study’s sample size is constrained and might not be entirely representative of the overall customer population. The second issue is that the research approach is mostly centered on research and statistical analysis, which might not account for all pertinent elements. Additionally, since the study’s focus is on visual imagery requirements, it is possible that it will not cover other consumer preferences and demand elements. Therefore, while analyzing the study’s findings and putting them to use, these limitations must be taken into full account.
Future research can measure consumers’ gaze habits, including whether they follow a linear or point trajectory when examining pattern details, and identify the characteristics of patterns that draw customers to ornamental stone. Researching consumer requirements and industry trends also requires an understanding of emerging technology and methodologies. In terms of ornamental materials, for instance, virtual reality (VR) and augmented reality (AR) technology can provide customers with a more intuitive and immersive experience. Future studies can examine how these technologies can be used to forecast market trends and better understand consumer wants.
Author Contributions
Conceptualization, H.C.; Methodology, H.L. and H.C.; Validation, H.L.; Formal analysis, H.L.; Investigation, H.L.; Writing—original draft, H.L. and H.C.; Writing—review & editing, H.C.; Visualization, H.C. All authors have read and agreed to the published version of the manuscript.
Funding
This research received no external funding.
Institutional Review Board Statement
This study does not involve any ethical issues.
Informed Consent Statement
Informed consent was obtained from all subjects involved in the study.
Data Availability Statement
The data used to support the findings of this study are available from the corresponding author upon request.
Conflicts of Interest
The authors declare no conflict of interest.
References
- Berger, I.E.; Corbin, R.M. Perceived consumer effectiveness and faith in others as moderators of environmentally responsible behaviors. J. Public Policy Mark. 1992, 11, 79–89. [Google Scholar] [CrossRef]
- Howlett, R.J.; Jain, L.C.; Adelaide ML, C. Smart Innovation, Systems and Technologies; Springer: Cham, Switzerland, 2012; p. 22. [Google Scholar] [CrossRef]
- Otterbring, T.; Folwarczny, M. Firstborns buy better for the greater good: Birth order differences in green consumption values. Pers. Individ. Differ. 2022, 186, 111353. [Google Scholar] [CrossRef]
- Liang, J.; Li, J.; Lei, Q. Exploring the influence of environmental values on green consumption behavior of apparel: A chain multiple mediation model among Chinese Generation Z. Sustainability 2022, 14, 12850. [Google Scholar] [CrossRef]
- Lin, P.-C.; Huang, Y.-H. The influence factors on choice behavior regarding green products based on the theory of consumption values. J. Clean Prod. 2012, 22, 11–18. [Google Scholar] [CrossRef]
- Biswas, A.; Roy, M. Green products: An exploratory study on the consumer behaviour in emerging economies of the East. J. Clean Prod. 2015, 87, 463–468. [Google Scholar] [CrossRef]
- Xie, C.; Wang, R.; Gong, X. The influence of environmental cognition on green consumption behavior. Front. Psychol. 2022, 13, 988585. [Google Scholar] [CrossRef]
- Chan, R.Y.; Lau, L.B. Explaining green purchasing behavior. J. Int. Consum. Mark. 2002, 14, 9–40. [Google Scholar] [CrossRef]
- Tan, T.M.; Makkonen, H.; Kaur, P.; Salo, J. How do ethical consumers utilize sharing economy platforms as part of their sustainable resale behavior? The role of consumers’ green consumption values. Technol. Forecast. Soc. Chang. 2022, 176, 121432. [Google Scholar] [CrossRef]
- Lorek, S.; Spangenberg, J.H. Sustainable consumption within a sustainable economy—Beyond green growth and green economies. J. Clean Prod. 2014, 63, 33–44. [Google Scholar] [CrossRef]
- Tseng, M.-L.; Tan, R.R.; Siriban-Manalang, A.B. Sustainable consumption and production for Asia: Sustainability Through Green Design and practice. J. Clean Prod. 2013, 40, 1–5. [Google Scholar] [CrossRef]
- Chen, S.-C.; Hung, C.-W. Elucidating the factors influencing the acceptance of green products: An extension of theory of planned behavior. Technol. Forecast. Soc. Change 2016, 112, 155–163. [Google Scholar] [CrossRef]
- De Luca, P.; Carbone, I.; Nagy, J.B. Green building materials: A review of state of the art studies of innovative materials. J. Green Build. 2017, 12, 141–161. [Google Scholar] [CrossRef]
- Robichaud, L.B.; Anantatmula, V.S. Greening project management practices for sustainable construction. J. Manag. Eng. 2011, 27, 48–57. [Google Scholar] [CrossRef]
- Luodes, H.; Kauppila, P.M.; Luodes, N.; Aatos, S.; Kallioinen, J.; Luukkanen, S.; Aalto, J. Characteristics and the environmental acceptability of the natural stone quarrying waste rocks. Bull. Eng. Geol. Environ. 2012, 71, 257–261. [Google Scholar] [CrossRef]
- Abbey, J.D.; Meloy, M.G.; Guide, V.D.R., Jr.; Atalay, S. Remanufactured products in closed-loop supply chains for consumer goods. Prod. Oper. Manag. 2015, 24, 488–503. [Google Scholar] [CrossRef]
- Rebello, T.A.; Zulcão, R.; Calmon, J.L.; Gonçalves, R.F. Comparative life cycle assessment of ornamental stone processing waste recycling, sand, clay and limestone filler. Waste Manag. Res. 2019, 37, 186–195. [Google Scholar] [CrossRef] [PubMed]
- Galetakis, M.; Soultana, A. A review on the utilisation of quarry and ornamental stone industry fine by-products in the construction sector. Constr. Build. Mater. 2016, 102, 769–781. [Google Scholar] [CrossRef]
- Hazen, B.T.; Overstreet, R.E.; Jones-Farmer, L.A.; Field, H.S. The role of ambiguity tolerance in consumer perception of remanufactured products. Int. J. Prod. Econ. 2012, 135, 781–790. [Google Scholar] [CrossRef]
- Souza, A.J.; Pinheiro, B.C.A.; Holanda, J.N.F. Processing of floor tiles bearing ornamental rock-cutting waste. J. Mater. Process. Technol. 2010, 210, 1898–1904. [Google Scholar] [CrossRef]
- Soliman, O.A. Perception of building materials in architecture. J. Eng. Appl. Sci. 2013, 60, 1–23. [Google Scholar]
- Yuan, Y.; Yu, X.; Yang, X.; Xiao, Y.; Xiang, B.; Wang, Y. Bionic building energy efficiency and bionic green architecture: A review. Renew. Sust. Energ. Rev. 2017, 74, 771–787. [Google Scholar] [CrossRef]
- Gomes, M.L.P.M.; Carvalho, E.A.S.; Barreto, G.N.S.; Rodriguez, R.J.S.; Monteiro, S.N.; Vieira, C.M.F. Development of Sustainable Artificial Stone Using Granite Waste and Biodegradable Polyurethane from Castor Oil. Sustainability 2022, 14, 6380. [Google Scholar] [CrossRef]
- Vagnon, F.; Dino, G.A.; Umili, G.; Cardu, M.; Ferrero, A.M. New developments for the sustainable exploitation of ornamental stone in Carrara basin. Sustainability 2020, 12, 9374. [Google Scholar] [CrossRef]
- López, A.J.; Ramil, A.; Pozo-Antonio, J.S.; Rivas, T.; Pereira, D. Ultrafast laser surface texturing: A sustainable tool to modify wettability properties of marble. Sustainability 2019, 11, 4079. [Google Scholar] [CrossRef] [Green Version]
- Du, K.; Li, P.; Yan, Z. Do green technology innovations contribute to carbon dioxide emission reduction? Empirical evidence from patent data. Technol. Forecast. Soc. Chang. 2019, 146, 297–303. [Google Scholar] [CrossRef]
- Ikram, M.; Sroufe, R.; Awan, U.; Abid, N. Enabling progress in developing economies: A novel hybrid decision-making model for green technology planning. Sustainability 2021, 14, 258. [Google Scholar] [CrossRef]
- Abd El-Ghafour, N.G.; Khalil, M.H.; Gharib, M.E.; Latif, M.L.A. Mineralogical and radioactive properties of some Egyptian granitoid rocks and their suitability for ornamental stones. HBRC J. 2012, 8, 64–68. [Google Scholar] [CrossRef] [Green Version]
- Joyram, H. A critical evaluation on the factors impacting the adoption of eco-block as a green construction material: From a Mauritian perspective. J. Build. Eng. 2019, 25, 100789. [Google Scholar] [CrossRef]
- Rizos, V.; Behrens, A.; Van der Gaast, W.; Hofman, E.; Ioannou, A.; Kafyeke, T.; Flamos, A.; Rinaldi, R.; Papadelis, S.; Hirschnitz-Garbers, M.; et al. Implementation of circular economy business models by small and medium-sized enterprises (SMEs): Barriers and enablers. Sustainability 2016, 8, 1212. [Google Scholar] [CrossRef] [Green Version]
- Peng, M. Linguistic Psychology; Beijing Normal University Press: Beijing, China, 2000. [Google Scholar]
- Kosslyn, S.M.; Ganis, G.; Thompson, W.L. Neural foundations of imagery. Nat. Rev. Neurosci. 2001, 2, 635–642. [Google Scholar] [CrossRef]
- Mckellar, P. Imagery from the Standpoint of Introspection; Sheehan, P.W., Ed.; Academic Press: New York, NY, USA, 1972; pp. 36–61. [Google Scholar]
- Yamada, M.; Shiraishi, T. The Orientaion and Height of the Wood Used for Wall Affect the Apparent Space Size. In Proceedings of the 53rd Annual Conference of JSSD. Japanese Society for the Science of Design, Kanazawa, Japan, 30 June–2 July 2006; p. 25. [Google Scholar]
- Nakamura, M.; Miyake, Y.; Nakano, T. Effect of image characteristics of edge-grain patterns on visual impressions. J. Wood Sci. 2012, 58, 505–512. [Google Scholar] [CrossRef] [Green Version]
- Edensor, T. The affective and sensory potencies of urban stone: Textures and colours, commemoration and geologic convivialities. Thesis Elev. 2022, 172, 16–35. [Google Scholar] [CrossRef]
- Gonçalves, L.B.; Leta, F.R. Macroscopic rock texture image classification using a hierarchical neuro-fuzzy class method. Math. Probl. Eng. 2010, 2010, 163635. [Google Scholar] [CrossRef] [Green Version]
- Sajjad, M.; Ullah, A.; Ahmad, J.; Abbas, N.; Rho, S.; Baik, S.W. Integrating salient colors with rotational invariant texture features for image representation in retrieval systems. Multimed. Tools Appl. 2018, 77, 4769–4789. [Google Scholar] [CrossRef]
- Lepistö, L.; Kunttu, I.; Autio, J.; Visa, A. Rock image classification using non-homogenous textures and spectral imaging. In Proceedings of the 11th International Conference in Central Europe on Computer Graphics, Visualization and Computer Vision (WSCG 2003), Plzen, Czech Republic, 3–7 February 2003. [Google Scholar]
- Lepistö, L.; Kunttu, I.; Visa, A. Rock image classification using color features in Gabor space. J. Electron. Imaging 2005, 14, 040503. [Google Scholar] [CrossRef]
- Martínez-Jiménez, P.M.; Chamorro-Martinez, J.; Soto-Hidalgo, J.M. Perception-based fuzzy partitions for visual texture modeling. Fuzzy Sets Syst. 2018, 337, 1–24. [Google Scholar] [CrossRef]
- Haralick, R.M.; Shanmugam, K.; Dinstein, I.H. Textural features for image classification. IEEE Trans. Syst. Man Cybern. -Syst. 1973, 3, 610–621. [Google Scholar] [CrossRef] [Green Version]
- Bonifazi, G.; Gargiulo, A.; Serranti, S.; Raspi, C. Imaging-based logics for ornamental stone quality chart definition. In Machine Vision Applications in Industrial Inspection XV; SPIE: Paris, France, 2007; Volume 6503, pp. 206–215. [Google Scholar]
- Papathomas, T.V.; Kashi, R.S.; Gorea, A. A human vision based computational model for chromatic texture segregation. IEEE Trans. Syst. Man Cybern.-Syst. Part B (Cybern.) 1997, 27, 428–440. [Google Scholar] [CrossRef] [Green Version]
- Wang, M.; Zhang, Q. Characterization decorative veneer patterns style by semantic differential method. Wood Res. 2015, 60, 219–226. [Google Scholar]
- Zhou, Y.; Tang, R.Y.; Yang, P. The Study of Material Texture Image Model by Kansei Engineering. Adv. Mater. Res. 2013, 712, 2900–2905. [Google Scholar] [CrossRef]
- Guo, X.; Asano, C.M.; Asano, A.; Kurita, T.; Liang, L.I. Analysis of texture characteristics associated with visual complexity perception. Opt. Rev. 2012, 19, 306–314. [Google Scholar] [CrossRef]
- Shohda AM, A.; Ali MA, M.; Ren, G.; Kim, J.G.; Abdo, A.M.; Abdellah, W.R.; Hassan, A.M. Sustainable Assignment of Egyptian Ornamental Stones for Interior and Exterior Building Finishes Using the AHP-TOPSIS Technique. Sustainability 2022, 14, 2453. [Google Scholar] [CrossRef]
- Sanmartín, P.; Silva, B.; Prieto, B. Effect of surface finish on roughness, color, and gloss of ornamental granites. J. Mater. Civ. Eng. 2011, 23, 1239–1248. [Google Scholar] [CrossRef]
- Benavente, D.; Martínez-Verdú, F.; Bernabeu, A.; Viqueira, V.; Fort, R.; del Cura, M.G.; Illueca, C.; Ordóñez, S. Influence of surface roughness on color changes in building stones. Color Res. Appl. 2003, 28, 343–351. [Google Scholar] [CrossRef] [Green Version]
- Antal, Á.; Görög, P.; Veres, Á.L.; Balla, P.; Török, Á. Colour of stone slabs under different standard illuminations. Period. Polytech.-Civ. 2017, 61, 66–74. [Google Scholar] [CrossRef] [Green Version]
- Wang, C.; Lu, W.; Ohno, R.; Gu, Z. Effect of wall texture on perceptual spaciousness of indoor space. Int. J. Environ. Res. Public Health 2020, 17, 4177. [Google Scholar] [CrossRef]
- Chen, W.S.; Lee, A.S.; Lin, H.C. Study of visual evaluations for wood flooring applying fuzzy logic. J. Wood Sci. 2014, 60, 327–338. [Google Scholar] [CrossRef]
- Fabrigar, L.R.; Wegener, D.T.; MacCallum, R.C.; Strahan, E.J. Evaluating the use of exploratory factor analysis in psychological research. Psychol. Methods 1999, 4, 272. [Google Scholar] [CrossRef]
- Kline, P. An Easy Guide to Factor Analysis; Routledge: London, UK, 2014. [Google Scholar]
- Klir, G.; Yuan, B. Fuzzy Sets and Fuzzy Logic; Prentice Hall: Hoboken, NJ, USA, 1995. [Google Scholar]
- Kahraman, C. (Ed.) Fuzzy Multi-Criteria Decision Making: Theory and Applications with recent Developments; Springer Science & Business Media: Cham, Switzerland, 2008. [Google Scholar]
- Hsieh, C.H.; Chen, S.H. A model and algorithm of fuzzy product positioning. Inf. Sci. 1999, 121, 61–82. [Google Scholar] [CrossRef]
- Chen, S.H. Ranking fuzzy numbers with maximizing set and minimizing set. Fuzzy Sets Syst. 1985, 17, 113–129. [Google Scholar] [CrossRef]
Figure 1.
Flowchart for research.

Figure 2.
Consumer survey on the assessment of the visual representations of decorative stone flooring.
Figure 2.
Consumer survey on the assessment of the visual representations of decorative stone flooring.

Figure 3.
Diagram of the affiliation function.

Figure 4.
The triangular fuzzy number affiliation function.

Figure 5.
Graph of the triangular fuzzy function affiliation values.

Figure 6.
Triangular fuzzy number of 10 decorative stone floors with each visual imagery evaluation.
Figure 6.
Triangular fuzzy number of 10 decorative stone floors with each visual imagery evaluation.

Figure 7.
Radar chart for thorough analysis of images of 10 different types of decorative stone floors.
Figure 7.
Radar chart for thorough analysis of images of 10 different types of decorative stone floors.


Table 1.
The top 10 selling decorative stone flooring types.
| Sort by | Stone Types |
|---|---|
| 1 | French wood grain |
| 2 | Silver White Dragon |
| 3 | Guizhou wood grain |
| 4 | Black and White Root |
| 5 | Roman Travertine |
| 6 | Black gold pattern |
| 7 | Wood grain jade |
| 8 | Legend of the Star River |
| 9 | Snowflake White |
| 10 | Black crystal jade |
Table 2.
Semantic variables for importance and scoring.
| Semantic Variables | Triangular Fuzzy Values |
|---|---|
| Very Low (VL) | (0,0,1) |
| Low (L) | (0,1,3) |
| Medium-Low (ML) | (1,3,5) |
| Medium (M) | (3,5,7) |
| Medium-High (MH) | (5,7,9) |
| High (H) | (7,9,10) |
| Very High (VH) | (9,10,10) |
Table 3.
The 110 adjectives suitable for expressing decorative stone flooring imagery.
| Solid | Passionate | Unconstrained | Feasible | Harmonious | Refreshing | Bright | Fresh | Familiar | Grand |
| Unremarkable | Economic | Poised | Noble | Gorgeous | Fancy | Original | Stylish | Expensive | Popular |
| Elegant | Pure | Graceful | Fluent | Extraordinary | Mundane | Durable | Soft | Striking | Exquisite |
| Rough | Adorable | Practical | Interesting | Beautiful | Minimalist | Luxury | Simple | Lavish | Refined |
| Highquality | Premium Elegance | Advanced | Mild | Refreshing | Meticulous | Rhythmic | Layered | Distinctive | Ample |
| Clean | Sturdy | Stately | Free | Amiable | Clarity | Neat | Generous | Modern | Classical |
| Retro | Innovative | Fashion | Traditional | Decorated | Confident | Coordinated | Variable | Warm | Heartwarming |
| Tender | Soft | Serene | Mass | Comfortable | Stable | Composed | Stabilized | Substantial | Fantastical |
| Emotional | Sedate | Rigid | Romantic | Blunt | Concise | Long-lasting use | Smooth solid | Lively | Introverted |
| Open | Relaxed | Silent | Lyrical | Rocking | Mature | Sentimental | Rational | Calm | Regular in shape |
| Harmonized | Shiny | General | Healthy | Environmentally friendly | Natural | Technology | Rustic | Vacationing | Leisurely |
Table 4.
The 40 high-frequency adjectives in the questionnaire.
| Grand | Durable | Flash | Feasible | Bright |
| Modern | Long-lasting use | Expensive | Practical | Premium Elegance |
| Advanced | Distinctive | Clean | Composed | Emotional |
| Rigid | Shiny | Graceful | High quality | Classical |
| Decorated | Variable | Concise | Natural | Harmonious |
| Gorgeous | Popular | Elegant | Exquisite | Minimalist |
| Luxury | Refreshing | Sturdy | Stately | Generous |
| Substantial | Original | Pure | Clarity | Retro |
Table 5.
Factor loading (extraction method: principal component analysis).
| Initial | Extraction | Initial | Extraction | ||
|---|---|---|---|---|---|
| Grand | 1.000 | 0.609 | Decorated | 1.000 | 0.632 |
| Durable | 1.000 | 0.649 | Variable | 1.000 | 0.690 |
| Flash | 1.000 | 0.627 | Concise | 1.000 | 0.753 |
| Feasible | 1.000 | 0.660 | Natural | 1.000 | 0.538 |
| Bright | 1.000 | 0.525 | Harmonious | 1.000 | 0.662 |
| Modern | 1.000 | 0.579 | Gorgeous | 1.000 | 0.572 |
| Long-lasting use | 1.000 | 0.563 | Popular | 1.000 | 0.657 |
| Expensive | 1.000 | 0.559 | Elegant | 1.000 | 0.590 |
| Practical | 1.000 | 0.680 | Exquisite | 1.000 | 0.538 |
| Premium Elegance | 1.000 | 0.657 | Minimalist | 1.000 | 0.552 |
| Advanced | 1.000 | 0.699 | Luxury | 1.000 | 0.562 |
| Distinctive | 1.000 | 0.515 | Refreshing | 1.000 | 0.615 |
| Clean | 1.000 | 0.720 | Sturdy | 1.000 | 0.635 |
| Composed | 1.000 | 0.447 | Stately | 1.000 | 0.644 |
| Emotional | 1.000 | 0.598 | Generous | 1.000 | 0.576 |
| Rigid | 1.000 | 0.586 | Substantial | 1.000 | 0.604 |
| Shiny | 1.000 | 0.619 | Original | 1.000 | 0.553 |
| Graceful | 1.000 | 0.674 | Pure | 1.000 | 0.607 |
| High quality | 1.000 | 0.651 | Clarity | 1.000 | 0.626 |
| Classical | 1.000 | 0.501 | Retro | 1.000 | 0.595 |
Table 6.
The 22 adjective factors with absolute value of factor loading greater than 0.6.
| Initial | Extraction | Initial | Extraction | ||
|---|---|---|---|---|---|
| Grand | 1.000 | 0.609 | Decorated | 1.000 | 0.632 |
| Durable | 1.000 | 0.649 | Variable | 1.000 | 0.690 |
| Flash | 1.000 | 0.627 | Concise | 1.000 | 0.753 |
| Feasible | 1.000 | 0.660 | Harmonious | 1.000 | 0.662 |
| Practical | 1.000 | 0.680 | Popular | 1.000 | 0.657 |
| Premium Elegance | 1.000 | 0.657 | Refreshing | 1.000 | 0.615 |
| Advanced | 1.000 | 0.699 | Sturdy | 1.000 | 0.635 |
| Clean | 1.000 | 0.720 | Stately | 1.000 | 0.644 |
| Shiny | 1.000 | 0.619 | Substantial | 1.000 | 0.604 |
| Graceful | 1.000 | 0.674 | Pure | 1.000 | 0.607 |
| High quality | 1.000 | 0.651 | Clarity | 1.000 | 0.626 |
Table 7.
KMO and Bartlett’s test.
| KMO Sampling Suitability Quantity | 0.763 | |
|---|---|---|
| Bartlett’s sphericity test | Approximate cardinality | 455.808 |
| Degree of freedom | 231 | |
| Significance | 0.000 | |
Table 8.
Total variance explained.
| Ingredients | Initial Eigenvalue | Extraction of the Sum of Squares of Loads | Sum of Squared Rotating Loads | ||||||
|---|---|---|---|---|---|---|---|---|---|
| Total | Variance Percentage | Cumulative % | Total | Variance Percentage | Cumulative % | Total | Variance Percentage | Cumulative % | |
| 1 | 2.456 | 11.162 | 11.162 | 2.456 | 11.162 | 11.162 | 1.462 | 6.647 | 6.647 |
| 2 | 1.417 | 6.440 | 17.602 | 1.417 | 6.440 | 17.602 | 1.419 | 6.451 | 13.098 |
| 3 | 1.341 | 6.096 | 23.698 | 1.341 | 6.096 | 23.698 | 1.380 | 6.273 | 19.371 |
| 4 | 1.272 | 5.783 | 29.481 | 1.272 | 5.783 | 29.481 | 1.370 | 6.227 | 25.598 |
| 5 | 1.216 | 5.528 | 35.009 | 1.216 | 5.528 | 35.009 | 1.311 | 5.958 | 31.556 |
| 6 | 1.185 | 5.385 | 40.394 | 1.185 | 5.385 | 40.394 | 1.300 | 5.910 | 37.466 |
| 7 | 1.170 | 5.316 | 45.711 | 1.170 | 5.316 | 45.711 | 1.290 | 5.862 | 43.328 |
| 8 | 1.074 | 4.883 | 50.594 | 1.074 | 4.883 | 50.594 | 1.257 | 5.713 | 49.041 |
| 9 | 1.063 | 4.831 | 55.425 | 1.063 | 4.831 | 55.425 | 1.233 | 5.603 | 54.644 |
| 10 | 1.011 | 4.597 | 60.022 | 1.011 | 4.597 | 60.022 | 1.183 | 5.378 | 60.022 |
| 11 | 0.977 | 4.439 | 64.461 | ||||||
| 12 | 0.923 | 4.195 | 68.656 | ||||||
| 13 | 0.873 | 3.967 | 72.623 | ||||||
| 14 | 0.844 | 3.837 | 76.460 | ||||||
| 15 | 0.815 | 3.703 | 80.162 | ||||||
| 16 | 0.757 | 3.440 | 83.603 | ||||||
| 17 | 0.703 | 3.197 | 86.800 | ||||||
| 18 | 0.666 | 3.028 | 89.828 | ||||||
| 19 | 0.630 | 2.861 | 92.689 | ||||||
| 20 | 0.590 | 2.680 | 95.369 | ||||||
| 21 | 0.528 | 2.400 | 97.769 | ||||||
| 22 | 0.491 | 2.231 | 100.000 | ||||||
Table 9.
Component matrix after rotation.
| 1 | 2 | 3 | 4 | 5 | 6 | 7 | 8 | 9 | 10 | |
|---|---|---|---|---|---|---|---|---|---|---|
| Stately | 0.683 | 0.018 | −0.046 | 0.026 | 0.216 | 0.017 | −0.076 | 0.097 | 0.029 | 0.108 |
| Durable | 0.636 | 0.247 | −0.073 | 0.136 | −0.384 | 0.051 | 0.056 | 0.075 | 0.149 | −0.034 |
| Pure | 0.588 | −0.150 | 0.468 | −0.072 | 0.070 | 0.139 | −0.026 | −0.121 | −0.110 | −0.063 |
| Grand | 0.034 | 0.810 | 0.069 | −0.147 | 0.042 | 0.051 | 0.136 | −0.066 | 0.148 | 0.086 |
| Feasible | 0.084 | 0.562 | −0.006 | 0.342 | −0.201 | 0.083 | −0.357 | 0.264 | −0.098 | 0.002 |
| Practical | 0.135 | 0.046 | 0.711 | −0.027 | −0.041 | −0.041 | 0.113 | 0.023 | 0.167 | −0.158 |
| High quality | −0.230 | 0.077 | 0.640 | 0.119 | −0.010 | 0.021 | −0.053 | 0.043 | −0.048 | 0.334 |
| Decorated | −0.032 | −0.132 | 0.029 | 0.811 | −0.075 | −0.005 | −0.038 | −0.029 | 0.143 | −0.010 |
| Graceful | 0.241 | 0.237 | 0.018 | 0.523 | 0.207 | −0.115 | 0.401 | 0.086 | −0.081 | 0.168 |
| Advanced | 0.177 | 0.210 | 0.108 | 0.389 | 0.278 | 0.360 | 0.081 | −0.244 | −0.172 | −0.366 |
| Concise | 0.070 | 0.009 | −0.003 | −0.046 | 0.761 | −0.035 | 0.093 | 0.110 | 0.016 | 0.089 |
| Substantial | 0.056 | −0.034 | −0.082 | 0.212 | 0.432 | 0.249 | −0.142 | 0.000 | 0.349 | −0.167 |
| Flash | −0.001 | 0.127 | 0.034 | −0.086 | −0.069 | 0.790 | −0.035 | −0.074 | −0.006 | −0.008 |
| Shiny | 0.117 | −0.096 | −0.040 | 0.086 | 0.098 | 0.591 | 0.157 | 0.285 | 0.078 | 0.134 |
| Premium Elegance | −0.008 | 0.103 | 0.173 | 0.105 | 0.106 | 0.150 | 0.604 | 0.049 | 0.090 | 0.027 |
| Harmonious | 0.105 | 0.122 | 0.242 | 0.132 | 0.116 | 0.081 | −0.491 | 0.027 | 0.178 | 0.157 |
| Clarity | 0.038 | 0.083 | −0.054 | −0.041 | 0.169 | 0.001 | −0.049 | 0.736 | 0.029 | −0.046 |
| Popular | 0.077 | −0.178 | 0.208 | 0.063 | −0.223 | 0.148 | 0.359 | 0.558 | 0.019 | 0.136 |
| Sturdy | 0.136 | −0.014 | 0.073 | 0.107 | 0.039 | 0.120 | −0.222 | −0.015 | 0.689 | 0.109 |
| Variable | −0.097 | 0.153 | 0.063 | −0.034 | 0.003 | −0.118 | 0.289 | 0.074 | 0.660 | −0.077 |
| Refreshing | 0.088 | 0.178 | 0.101 | 0.022 | 0.137 | 0.088 | −0.075 | 0.073 | 0.005 | 0.684 |
| Clean | −0.008 | 0.301 | 0.238 | 0.007 | 0.195 | 0.025 | −0.139 | 0.342 | 0.005 | −0.524 |
Table 10.
Factor renaming table.
| Factor 1 | 1.000 | Stately; Durable; Pure |
| Factor 2 | 1.000 | Grand; Feasible |
| Factor 3 | 1.000 | Practical; High quality |
| Factor 4 | 1.000 | Decorated; Graceful |
| Factor 5 | 1.000 | Concise; Substantial |
| Factor 6 | 1.000 | Flash; Shiny |
| Factor 7 | 1.000 | Premium Elegance; Harmonious |
| Factor 8 | 1.000 | Clarity; Popular |
| Factor 9 | 1.000 | Sturdy; Variable |
| Factor 10 | 1.000 | Refreshing; Clean |
Table 11.
The 10 types of decorative stone flooring number.
| No. | Species Name | Abridge | No. | Species Name | Abridge |
|---|---|---|---|---|---|
| 1 | French wood grain | FW | 6 | Black gold pattern | BG |
| 2 | Silver White Dragon | SW | 7 | Wood grain jade | WG |
| 3 | Guizhou wood grain | GW | 8 | Legend of the Star River | LS |
| 4 | Black and White Root | BW | 9 | Snowflake White | SF |
| 5 | Roman Travertine | RT | 10 | Black crystal jade | BC |
| No. 1 | No. 2 | No. 3 | No. 4 | No. 5 | |
 |  |  |  |  | |
| No. 6 | No. 7 | No. 8 | No. 9 | No. 10 | |
 |  |  |  |  | |
Table 12.
The visual imagery evaluation ranking and average score of each material decorative stone floor.
Table 12.
The visual imagery evaluation ranking and average score of each material decorative stone floor.
| Factor 1 | Factor 2 | Factor 3 | Factor 4 | Factor 5 | |
|---|---|---|---|---|---|
| FW | (4.3;6.1;7.6) | (4.5;6.3;7.7) | (4.5;6.3;7.7) | (4.3;5.9;7.4) | (4.4;6.1;7.5) |
| SW | (3.6;5.4;7) | (4.4;6.2;7.7) | (4;6.1;7.3) | (4.4;6.1;7.5) | (4.1;5.7;7.2) |
| GW | (3.8;5.7;7.2) | (4.2;5.9;7.4) | (4.5;6.3;7.8) | (4.4;6.1;7.6) | (4.4;6.1;7.6) |
| BW | (3.8;5.5;7.1) | (4;5.7;7.3) | (4.1;5.9;7.4) | (4.3;6;7.6) | (4.3;6;7.5) |
| RT | (4.1;5.8;7.4) | (4.6;6.2;7.8) | (4.5;6.3;7.7) | (4.5;6.2;7.7) | (4.4;6.2;7.7) |
| BG | (4.1;5.8;7.3) | (4.3;6;7.5) | (4.3;5.8;7.4) | (4.3;6;7.4) | (4.3;6;7.5) |
| WG | (3.9;6;7.3) | (4.1;5.9;7.4) | (4.4;6.1;7.6) | (4.5;6.3;7.7) | (4.4;6.1;7.6) |
| LS | (3.9;5.6;7.1) | (4;5.7;7.2) | (4.1;5.8;7.3) | (3.8;5.5;7.1) | (4;5.7;7.2) |
| SF | (4.1;5.8;7.4) | (4.1;5.8;7.4) | (4.2;6;7.5) | (4.5;6.2;7.7) | (4.3;6.1;7.6) |
| BC | (4;5.6;7.1) | (3.8;5.5;7) | (3.7;5.4;6.9) | (3.9;5.6;7.2) | (3.7;5.4;6.9) |
| Factor 6 | Factor 7 | Factor 8 | Factor 9 | Factor 10 | |
| FW | (4.4;6.1;7.7) | (4.4;6.1;7.5) | (4.3;6;7.5) | (4.7;6.5;7.9) | (4.8;6.6;8) |
| SW | (4.1;5.8;7.3) | (3.9;5.6;7.2) | (4.1;5.9;7.4) | (4;5.8;7.4) | (3.8;5.5;7.1) |
| GW | (4.3;6;7.6) | (4.3;6;7.6) | (4;5.7;7.3) | (4.4;6.2;7.7) | (4.4;6.1;7.6) |
| BW | (4.4;6.1;7.6) | (4.5;6.3;7.8) | (4.5;6.3;7.8) | (4.6;6.3;7.8) | (4.9;6.6;8) |
| RT | (4.6;6.3;7.8) | (4.6;6.4;7.8) | (4.6;6.4;7.7) | (4.4;6.2;7.7) | (4.8;6.5;7.9) |
| BG | (4;5.7;7.3) | (4.3;6;7.5) | (4.2;5.9;7.4) | (4.2;6;7.5) | (4.3;6;7.4) |
| WG | (4.5;6.2;7.6) | (4.4;6.2;7.7) | (4.5;6.2;7.7) | (4.2;6;7.5) | (4.3; 6;7.4) |
| LS | (3.9;5.5;7) | (4;5.7;7.2) | (3.9;5.6;7.1) | (3.9;5.5;7) | (4;5.7;7.1) |
| SF | (4.4;6.1;7.7) | (4.4;6.1;7.5) | (4.3;6;7.5) | (4.7;6.5;7.9) | (4.8;6.6;8) |
| BC | (4.1;5.8;7.3) | (3.9;5.6;7.2) | (4.1;5.9;7.4) | (4;5.8;7.4) | (3.8;5.5;7.1) |
Table 13.
The visual imagery of each material’s decorative stone flooring evaluation utility value table.
Table 13.
The visual imagery of each material’s decorative stone flooring evaluation utility value table.
| Factor 1 | Factor 2 | Factor 3 | Factor 4 | Factor 5 | Factor 6 | Factor 7 | Factor 8 | Factor 9 | Factor 10 | |
|---|---|---|---|---|---|---|---|---|---|---|
| FW | 2.2375 | 2.175 | 2.1854 | 2.0756 | 2.1125 | 2.2013 | 2.0756 | 2.1128 | 2.2 | 2.2440 |
| SW | 2.125 | 2.2125 | 2.1256 | 2.1013 | 2.0375 | 2.0615 | 2.0731 | 2.1244 | 2.15 | 2.0625 |
| GW | 2.175 | 2.1 | 2.2476 | 2.1641 | 2.175 | 2.1756 | 2.1756 | 2.0987 | 2.1875 | 2.1464 |
| BW | 2.1125 | 2.1125 | 2.15 | 2.2013 | 2.15 | 2.1385 | 2.2269 | 2.2269 | 2.175 | 2.2060 |
| RT | 2.1875 | 2.2 | 2.1854 | 2.1897 | 2.2375 | 2.1897 | 2.1897 | 2.1269 | 2.1875 | 2.1816 |
| BG | 2.125 | 2.125 | 2.0744 | 2.0756 | 2.15 | 2.0987 | 2.1128 | 2.0872 | 2.1375 | 2.0595 |
| WG | 2.2 | 2.1375 | 2.1610 | 2.1897 | 2.175 | 2.1013 | 2.2013 | 2.1641 | 2.1375 | 2.0595 |
| LS | 2.075 | 2.05 | 2.0878 | 2.0731 | 2.075 | 1.9474 | 2.0359 | 2.0103 | 1.9375 | 1.9863 |
| SF | 2.1875 | 2.1375 | 2.1744 | 2.1897 | 2.2125 | 2.15 | 2.2013 | 2.15 | 2.1125 | 2.2333 |
| BC | 2.0375 | 2 | 1.902 | 2.0987 | 2 | 2.0359 | 2.0359 | 2.0987 | 2.0875 | 2.1357 |
Disclaimer/Publisher’s Note: The statements, opinions and data contained in all publications are solely those of the individual author(s) and contributor(s) and not of MDPI and/or the editor(s). MDPI and/or the editor(s) disclaim responsibility for any injury to people or property resulting from any ideas, methods, instructions or products referred to in the content. |
© 2023 by the authors. Licensee MDPI, Basel, Switzerland. This article is an open access article distributed under the terms and conditions of the Creative Commons Attribution (CC BY) license (https://creativecommons.org/licenses/by/4.0/).
Share and Cite
MDPI and ACS Style
Li, H.; Chen, H. Research on Green Consumption Based on Visual Evaluation Method—Evidence from Stone Flooring Industry. Sustainability 2023, 15, 10453. https://doi.org/10.3390/su151310453
AMA Style
Li H, Chen H. Research on Green Consumption Based on Visual Evaluation Method—Evidence from Stone Flooring Industry. Sustainability. 2023; 15(13):10453. https://doi.org/10.3390/su151310453
Chicago/Turabian StyleLi, Hanzhe, and Hui Chen. 2023. "Research on Green Consumption Based on Visual Evaluation Method—Evidence from Stone Flooring Industry" Sustainability 15, no. 13: 10453. https://doi.org/10.3390/su151310453
Note that from the first issue of 2016, this journal uses article numbers instead of page numbers. See further details here.