


Location Suitability Evaluation and Spatial Optimization of Self-Driving Camps in Xinjiang
1
Key Laboratory of The Sustainable Development of Xinjiang’s Historical and Cultural Tourism, Xinjiang University, Urumqi 830046, China
2
College of Tourism, Xinjiang University, Urumqi 830049, China
*
Authors to whom correspondence should be addressed.
Sustainability 2023, 15(14), 10820; https://doi.org/10.3390/su151410820
Submission received: 21 May 2023
/
Revised: 29 June 2023
/
Accepted: 5 July 2023
/
Published: 10 July 2023
(This article belongs to the Special Issue Applications of GIS and Remote Sensing for Sustainable Spatial Planning)
Abstract
:Irregular tourism seasons and insufficient momentum in the development of new tourism modes disrupt the supply and demand balance between the development of self-driving tourism and the number of corresponding service facilities in Xinjiang. This constrains the growth of regional comprehensive benefits. This paper constructs an index system for evaluating the location suitability of self-driving camps in Xinjiang by the Delphi method; obtains DEM data, GIS data, POI data, and statistical data; and uses a combination of subjective and objective evaluation to calculate index weights. ArcGIS raster analysis and the P-median model were used to study the location suitability and spatial optimization strategies for self-driving tourism camps in Xinjiang. The results of this study are as follows: (1) An evaluation system for the suitability of self-driving camp locations in Xinjiang is constructed from the supply side and the demand side. (2) Self-driving camps in Xinjiang have a large supply capacity gap between counties and cities. (3) The overall suitability of the demand for self-driving camps in Xinjiang is low to moderate. (4) There exists a spatial imbalance in the suitability of the supply and demand for self-driving tourism camps in Xinjiang. (5) A total of 65 campsites were proposed for self-driving tours in Xinjiang considering spatial optimization. (6) Xinjiang should strengthen the matching of self-driving camps with tourism resources and traffic routes, and produce self-driving tour business maps with complete self-driving tour supporting facilities and services.
1. Introduction
Affected by the COVID-19 epidemic, the spatial and temporal contraction of tourism and leisure has resulted in a high demand for local leisure and proximity tourism and the development of new industries, including the camping economy, rendering self-driving tours with greater privacy, safety, and freedom an important travel option for the public. Xinjiang is a core area connected to many Central Asian countries and has the largest provincial area, with large differences in landscape types between the northern and southern sides of the border. Moreover, this area takes a long time to travel and a short time to visit, and exhibits obvious seasonal tourism patterns, a sufficient traffic road network construction space, and other favorable characteristics. Nearly 87% of the counties and urban areas are connected by highways, and self-driving tourists account for more than 80% of the total number of tourists. In this area, the self-driving tour market exhibits a high development potential, with people and vehicles fulfilling important roles in the consumption model in terms of stabilizing economic growth and expanding consumer goods categories. However, the lack of cultural depth, insufficient endogenous power, low product development level, and coordination imbalance between camps and self-driving tour routes in the development of this tourism market in Xinjiang have caused different development speeds of self-driving tours in northern and southern Xinjiang, increased the gap between investments in the self-driving tour market and related infrastructure construction, and generated a supply–demand mismatch between camps and self-driving tour development. The analysis of the suitability of the supply and demand for self-driving camps in Xinjiang is thus important for the construction of self-driving tour support facilities. Moreover, the layout of self-driving camps can be used to facilitate the construction and optimization of self-driving tour routes, providing development ideas for future construction and optimization of self-driving camps in Xinjiang.
The research on self-drive tourism includes studies on the self-drive tourism market, self-drive tourists, and self-drive camps. The formation and development of the self-drive tour market present different characteristics at different periods; the budding period is dominated by the development of a travel agency platform [1], which actively expands the travel agency business; the start-up period is dominated by the development of the 4S store platform [2], which analyzes the self-drive tourers’ consumption preferences with the help of large amount of car owners’ data; and the development period is dominated by an analysis of self-drive tourers’ spatial behavior characteristics [3], which summarizes self-drive tourists’ personalized, autonomous, and customized needs. The research on self-driving tourists mainly focuses on distinguishing the motivation differences among self-driving tourists [4]; summarizing the consumption characteristics and behavioral preferences of self-driving tourists in a targeted manner; understanding the characteristics of self-driving tourists’ travel route selection, travel consumption preferences, travel traffic perception, and participation in tourism activities [5,6,7,8]; mining the influencing factors of self-driving tourists’ satisfaction through the combination of behavioral characteristics and perceived value; and studying the relationship between satisfaction and behavior and their relationship with motivation. With the intense promotion of the self-driving tour market, the only way to develop self-driving tour products is to quickly grasp tourist preferences, obtain tourism trends, and adjust the structure of existing tourism resources in a timely manner. China has entered the era of self-driving tours. The demand for mass leisure tourism is unprecedentedly high, and self-driving tour camps with multiple functions and flexible operations are entering a golden development period; thus, the research on self-driving tour camps is not only in line with the current trend but also provides a strong guarantee for its development.
In the study of the spatial pattern of campgrounds, foreign scholars have mainly described spatial site selection, construction methods, campground classification, functional zoning, etc., in detail. For example, Robert W. Douglass and John Wiley, in their books Forest Recreation [9] and Formers Best RV and Tent Campgrounds in the U.S.A. [10], examined the required construction conditions, surrounding infrastructure, and provision of various services in campground planning and construction. Domestic scholars have predominantly analyzed site selection factors and layout forms; considered natural, market, social, and traffic factors in site selection [11]; classified self-driving camps into different types based on the reliance on carriers [12], spatial pattern [13], functional area division [14], and tourism resource grade [15]; and spatially visualized the distribution type, distribution density, distribution equilibrium, and distribution correlation of self-driving campsites. For example, Zhang Meng (2018) classified self-driving caravan camps in Xinjiang according to different factors, such as economic, population, resource, transportation, and policy factors [16]. Although researchers have summarized the spatial distribution characteristics of self-driving camps, the reason of the spatial differentiation of self-driving camps remains uncertain. As a consequence, no reasonable and effective solutions to the distribution imbalance in the spatial pattern have been proposed, and spatial optimization strategies for the development of self-driving camps have been insufficiently considered. Therefore, in this paper, we used the P-median model to improve the spatial pattern of self-driving camps in Xinjiang from a spatial optimization perspective, thereby ensuring more reasonable development and construction of self-driving camps in northern and southern Xinjiang and enhancing the camp distribution, self-driving routes, road traffic network, and tourism resources in a synergistic manner.
In the evaluation of the suitability of self-driving campsites, foreign scholars have mainly measured the importance of various indices in terms of hospitality services, availability of water and electricity, infrastructure construction, vegetation coverage, etc. [17], and they have divided the functional areas of campsites according to local conditions in terms of shopping possibilities, internet and satellite TV availability, and the provision of gourmet food, sports and leisure activities, and entertainment programs [18]. In addition, foreign scholars have employed the camping climate index [19] and the weather–proximity–perception framework [20] to explore the best camping conditions under climate change and the campground ecological evaluation system to determine the suitability of the ecological environment for campgrounds [21,22]. In the suitability evaluation of self-driving camps as supporting facilities for self-driving or camping tourism, domestic researchers have considered tourism resources, traffic accessibility, campground and road signage systems, service platform establishment, community participation, etc., to match the needs of subjects, objects, and media [23,24]. In the suitability assessment of tourist demand, camping areas must consider protected area resources, infrastructure conditions, management service methods, and social environment conditions to satisfy the diversified needs of tourists with the campground supply [25]; moreover, the relationship between the supply and demand is reflected not only between self-driving camps and tourists but also between self-driving camps and tourist destinations. Due to tourism development differences among regions and limited access to data, the evaluation system is not comprehensive enough. Therefore, an evaluation system for the location suitability of self-driving camps in Xinjiang was constructed considering the supply–demand relationship to bridge the gap in the literature. In location suitability evaluation and site planning, scholars have mostly constructed evaluation systems in terms of the natural environment, supporting facilities, traffic conditions, safety conditions, socioeconomic conditions, source market, and development potential [26,27,28,29,30,31,32]. Moreover, index factors have been determined by the Delphi method, literature analysis method, web text analysis method, etc., and index data have been quantified only from spatial or nonspatial attribute perspectives, while index weights have been calculated via linear weighted combination allocation, hierarchical analysis method, entropy value method, geographic information system (GIS) spatial analysis, etc. Notably, the method of assessing the suitability of a single type of data suffers certain limitations: the assignment of indicators from subjective or objective perspectives could cause deviations in the suitability results, and the indicator system cannot clarify the reliability of the test results, resulting in insufficient verification of the feasibility of the evaluation system. Therefore, in this paper, we combined spatial and nonspatial attribute data, employed the reliability test method to increase the robustness of the indicator system, and obtained comprehensive subjective and objective weights, thus ensuring a more reasonable structure of the index system, more accurate suitability classification, and a greater contribution to spatial optimization. Regarding environmental suitability, we mainly considered the influences of the tourism resource environment, traffic environment, and social environment on the spatial pattern of self-driving camps to achieve coordination between camps and spatial patterns [33]. As self-driving camps have distinct slope, slope direction, wind speed, and safety level requirements, these aspects have recently been considered in the evaluation system. Moreover, in climate conditions index selection, scholars have mostly adopted the temperature humidity index, wind chill index, clothing index, and radiation index [34]. Climate factors include temperature, humidity, wind, sunshine, and precipitation [35], and the above selection principle cannot reflect the correlation among these climate elements; thus, Ma Lijun and other scholars established the comprehensive comfort index [36] based on the temperature and humidity index, wind chill index, and clothing index to more accurately measure climate conditions.
The term sustainability has been used across many environmental disciplines and was recently defined for campsites by Marion et al. (2018) as: “... one that can accommodate the intended type and amount of use over time without unacceptable levels of expansion, degradation, maintenance, and social crowding or conflict [37]”. In the area of ecological sustainability research, campsite impacts generally result from campsite proliferation, expansion of existing campsites, tree damage and felling, vegetation loss and compositional change, soil exposure and loss, water pollution, and wildlife disturbance [38,39]. The increasing trend of material usage also impacts ecological sustainability through natural resource depletion, climate change, reduction in biodiversity, water pollution, and greenhouse gas emissions [40]. Due to the increased sensitivity to environmental and sustainability topics, in recent years the environmental effects of campsites have been investigated and assessed in order to quantify the impacts of camping activities [41,42,43,44]. Considering these growing ecological threats, sustainable development goals focus on conserving natural resources for the global economies while taking appropriate measures to utilize ecological resources [45]. For example, a sustainable mobility system for campsite customers can be built based on economic and environmental sustainability evaluations [46]. In the area of social sustainability research, actions that enhance campsite sustainability include a designated camping policy that restricts camping to a limited number of durable sites, visitor entry point quotas to match visitor numbers to site numbers, group size restrictions to limit campsite expansion, and site management actions such as tent site creation and canoe landing enclosures, as well as efforts to concentrate visitor activity, minimize soil loss, and shrink site size [47].
In summary, the suitability evaluation and spatial optimization of self-driving camps need to be based on sustainable development, following appropriate resource allocation, environmental and resource sustainability, and common goals and environmental resources; harmonizing socio-economic development with environmental carrying capacity; and reaching a general societal consensus on conservation-based resource development. Based on the above-mentioned background of self-driving tour development and related research progress, this paper attempts to study the following three aspects: First, an evaluation system of the location suitability of self-driving camps in Xinjiang is constructed through literature analysis and the Delphi method, and the comprehensive weight of each index is calculated by using the combination of hierarchical analysis and the entropy weight method. Second, the spatial analysis technology of GIS is used to visualize the suitability of supply and demand of self-driving camps in Xinjiang and describe their spatial distribution characteristics. Third, spatial optimization analysis is carried out based on the evaluation results of the suitability of self-driving camps in Xinjiang, and suggested construction points of self-driving camps in Xinjiang in the future are proposed. These spatial optimization suggestions are put forward in combination with the current situation of self-driving tourism development in Xinjiang. The purpose of this study is to strengthen the construction of self-driving tourism supporting facilities in Xinjiang; cater to the market demand for self-driving tourism; reasonably plan the layout of self-driving tourism camps in Xinjiang; give play to the tourism station replenishment function of highways; realize the integration of self-driving tourism routes and transportation road networks; and use the vast tourism resources of the province to promote Xinjiang, thus establishing an economically-strong province by creating a self-driving tourism destination.
2. Methods and Data Sources
2.1. Delphi Method
In this paper, the Delphi method is used to determine the model of a self-driving campground suitability evaluation index system. The methods outlined below are used to verify the scientificity and reasonableness of the index system for expert scoring results.
In the above equation, Mj is the arithmetic mean, and the greater the value obtained, the higher the importance of the indicator [48]. Kj is the frequency of perfect scores, and the greater the value obtained, the greater the importance of the indicator [49]. CVj is the coefficient of variation, and the smaller the value obtained, the better the coordination of the indicator [50]. cij is the score of index j by expert i; mj is the number of experts; m′j is the number of experts who scored full marks; is the standard deviation of index j; and is the mean value of index j.
2.2. Combination of Subjective and Objective Empowerment Method
2.2.1. Analytic Hierarchy Process (AHP) Method
In this paper, the subjective weights of each index factor were obtained with the help of the hierarchical analysis method, and the calculation steps are as follows:
(1) Construction of judgment matrix
A questionnaire was issued to experts using the 1–9 level scale method [51]. Experts compared the importance of each level of indexes between two and two to construct the judgment matrix.
In the above equation, A is the judgment matrix, and aij is the comparison result of indicator i to indicator j [52].
(2) Calculate the judgment matrix
In the above equation, Mi is the product of elements in each row of the judgment matrix, is the nth root of Mi, Wi is the normalized eigenvector, and is the maximum characteristic root [53].
(3) Consistency test
In the above equation, CI is the consistency index, n is the matrix order, CR is the consistency ratio, RI is the random consistency index [54], and the RI assignment table is shown in Table 1 [55]. If CR < 0.1, the consistency of the judgment matrix can be considered acceptable, and if CR ≥ 0.1, the judgment matrix needs to be modified and adjusted.
(4) Hierarchical total ranking
In the above equation, Wi is the total ranking weight of the hierarchy, aj denotes the total ranking weight of the upper level, and bij denotes the single ranking weight of the lower level to the upper level [56].
2.2.2. Entropy Value Method
In this paper, the objective weights of each index factor were obtained with the help of the entropy value method. The extreme value method is first used to normalize the raster data of each index in the following way [57]:
Next, the objective weights of each indicator are calculated using the entropy method with the following formula [58]:
In the above equation, y′ is the standardized value, and the value interval is [0, 1]; y is the value of each indicator in the evaluation index system; ymax and ymin are the maximum and minimum values of the indicator, respectively; Pij is the weight of the value of the jth indicator in the ith target layer; Ei is the information entropy of the ith indicator factor; and Wi is the weight of each indicator [59].
2.2.3. Synthetic Weights
In this paper, the integrated weights of the AHP method and the entropy value method are obtained by multiplying the synthetic normalization principle. The calculation formula is as follows [60]:
In the above equation, Qi is the comprehensive evaluation weight of the ith evaluation index, is the subjective weight value of the ith evaluation index, and is the objective weight value of the ith index.
2.3. GIS Spatial Analysis Method
2.3.1. Kernel Density Analysis
In this paper, the raster data of coordinates of points such as tourist attractions, national rural tourism key villages and towns, road density, geological disaster risk points, geological disaster occurrence points, tourist star-rated hotels, gas stations, and highway service areas were obtained with the help of kernel density analysis.
In the above equation [61], is the kernel function, h is the bandwidth, n is the point element, and x − xi is the distance from the estimated point to the sample.
2.3.2. Kriging Interpolation
In this paper, the raster data of air quality index, water supply per capita, population density, GDP per capita, and economic contribution of tourism were obtained with the help of kriging interpolation; the calculation formula is as follows [62]:
In the above equation, Z′0 is the estimated value of an unknown point (x0,y0) in space; Z0 is the true value of an unknown point (x0,y0) in space; n is the number of points that can determine the attribute value of the point; Zi is the attribute value of the ith known point; Wi is the weight of the ith known point; E(Z′0 − Z0) is the unbiased estimate; min(Var(Z′0 − Z0)) indicates the minimum difference between the estimated value and the true value.
2.3.3. P-Median Model
The P-median model is used in the determination of the optimal location of p facilities in a candidate set by minimizing the total weighted distance to serve all demands. It achieves spatial location optimization by minimizing the resistance and maximizing the coverage. The calculation formula is as follows [63,64,65]:
N is the point of demand for facilities for self-drive camps, with N = (1, 2, ..., n); is the ith demand point; M is the facility candidate point of the self-driving campground, with M = (1, 2, ..., m); cij is the unit cost from locations i to j; p denotes the total number of facilities that can be established (p < m); and Xj = 1 if the self-driving camp is established at , otherwise it is 0. If the facility demand point is at i ∈ N and is served by facility candidate j ∈ M, yij is 1, otherwise it is 0.
2.4. Data Sources
All data in this paper were collected prior to December 2020. The digital elevation model (DEM) data in this paper were retrieved from the Resource and Environment Science and Data Center of the Chinese Academy of Sciences. Administrative boundary data, traffic road network data, and water system vector data of Xinjiang for 2020 were obtained from the National Geographic Information Public Service Platform. Raster data of the temperature, wind speed, and relative humidity were provided by the National System Science Data Center. Point of interest (POI) data of Xinjiang self-driving camps, A-class scenic spots, national rural tourism key villages and towns, tourist star-rated hotels, gas stations, highway service areas, county and urban governments, etc., were retrieved from the Gaode Map open platform. Air quality index data were obtained from the China Meteorological Science Data Center, per capita water supply data were retrieved from the China County Construction Statistical Yearbook 2021 and China City Construction Statistical Yearbook 2021, and data on tourist scenic spots and tourist star-rated hotels were obtained from the Xinjiang Uygur Autonomous Region Culture and Tourism Department. Data on national rural tourism key villages and towns were provided by the Ministry of Culture and Tourism of the People’s Republic of China, and population density, gross domestic product (GDP) per capita, and tourism income data were retrieved from the Statistical Bulletin of National Economic and Social Development and government work reports of each county and urban area in Xinjiang.
2.5. Overview of the Study Area
Xinjiang is located at the northwestern border of China, bordering 8 countries, including Mongolia and the Russian Federation, and is the province with the largest area, the longest land border, and the largest number of neighboring countries in China. There are 106 counties and urban areas in Xinjiang. As a result of the interactions among various ethnic groups, a rich and unique multicultural environment has been formed. The geomorphic features of three mountains and two basins impede the entry of marine air currents, and the boundary of Tianshan Mountain divides this province into a moderate temperate zone in the north and a warm temperate zone in the south. Precipitation is scarce across the whole territory, showing a distribution pattern with higher precipitation at the northern border, in the west, in the mountains, and at the basin edge than at the southern border, in the east, in the basin, and at the basin center, respectively, and the windward slope of the mountains is higher than the leeward slope. By 2022, there were 574 A-class scenic spots, 73 national rural tourism key villages and towns, 385 tourist star-rated hotels, and 135 built and under-construction self-driving camps, of which 43, 26, and 66 are destination-based, transportation-dependent, and scenic-area-dependent camps, respectively, as shown in Figure 1. The rapid development of self-driving tourism, promoted by various tourism development strategies, has revitalized and enhanced the Xinjiang tourism industry, but there are large gaps in tourism development between northern and southern Xinjiang and the prefectures. The problem of a seasonal imbalance in the tourism product supply remains prominent, the enrichment level of the new tourism industry must still be enhanced, and the problem of long travels and short tours must be resolved. In addition, the limited number of existing camps, insufficient type diversification, notable dependence of camp construction on government support, lack of integration between camps and self-driving tour routes, and urgent need to improve camp internal infrastructure construction, such as camp division, signage systems, and living water, have led to a limited supply of self-driving tourism camps in the self-driving tour system. The construction of self-driving camps is the key to overcoming the problem of long travels and short tours in Xinjiang, and the active construction of a self-driving camp service system could effectively improve the tourism service capacity and promote tourism development in the core area of the Silk Road. Therefore, Xinjiang was adopted as the research area for the development of self-driving camps.
3. Findings
3.1. Construction of the Suitability Evaluation System for Self-Driving Camps in Xinjiang
3.1.1. Delphi Method Index Screening
In this paper, teachers specializing in tourism planning, ecological environment, tourism geography, and human geography from Xinjiang University, Xinjiang University of Finance and Economics, Xinjiang Normal University, Xinjiang Agricultural University, and Shihezi University, scholars from the Xinjiang Institute of Ecology and Geography of the Chinese Academy of Sciences, and professionals from the self-driving tour industry constitute the expert group. The comprehensive opinions of the expert group and the literature related to the evaluation of the suitability of self-driving camps were combined and a suitability evaluation system for self-driving camps in Xinjiang was constructed in terms of the supply and demand for self-driving camps at tourist destinations. The suitability of the evaluation index factors was determined through questionnaires, and the members of the expert group scored the importance of each index. Each index was assigned 1, 2, 3, 4, or 5 points according to the five evaluation levels of very unimportant, unimportant, generally important, important, and very important, respectively. Thirteen expert questionnaires were collected from November to December 2022, and the recovery rate was 100%. The results of the calculation of arithmetic mean (Mj), full score frequency (Kj), and coefficient of variation (CVj) are shown in Table 2.
Indicators were modified and deleted based on the boundary value method and the comprehensive opinions of the experts [66]; indicators with Mj values lower than 2.95, Kj values lower than 0.001, and CVj values higher than 0.33 were deleted, and when indicators satisfied two of the boundary values, their inclusion was decided by the expert group after discussion. Finally, 4 indicators, namely, slope direction, total water resources per capita, density of star-rated farmhouses, and proportion of the tertiary industry, were excluded, and the remaining 21 were retained, as shown in Table 3, for the evaluation system of the location suitability of self-driving camps in Xinjiang. To ensure the rationality of the index system, a reliability test was conducted, and the results showed that Cronbach’s α coefficient was 0.717, indicating satisfactory reliability; the Kaiser–Meyer–Olkin (KMO) value was 0.818, and Bartlett’s sphericity test value was P = 0.00 < 0.01, which reached the significant level and suggested a favorable structural validity.
3.1.2. Establishment of Integrated Weights
First, the expert group filled in the questionnaire regarding the weights of the location suitability evaluation index system for self-driving camps in Xinjiang. A total of 16 valid questionnaires were returned, including 14 paper copies and 2 electronic files, collected in January 2023, and the expert questionnaire data were processed and imported into Yaahp12.8 for hierarchical analysis to calculate the subjective weight of each index. The Wi, λmax, CI, RI, and CR values are shown in Table 4.
Afterward, a 10 km × 10 km fishing network was established in ArcGIS10.2, the study area was divided into 15,903 grids, and the mean value in each grid was determined. The attribute tables of all indicators were exported as Excel tables, the indicators were normalized in the order of the grids, and the entropy value method was applied in SPSSAU to calculate the objective weight of each indicator. Finally, comprehensive weights were obtained via the analytic hierarchy process (AHP) method and the entropy value method through multiplication based on the synthetic normalization principle, as shown in Table 5.
3.2. Xinjiang Self-Driving Camp Location Suitability Evaluation Analysis
3.2.1. Suitability Analysis of the Supply for Self-Driving Camps in Xinjiang
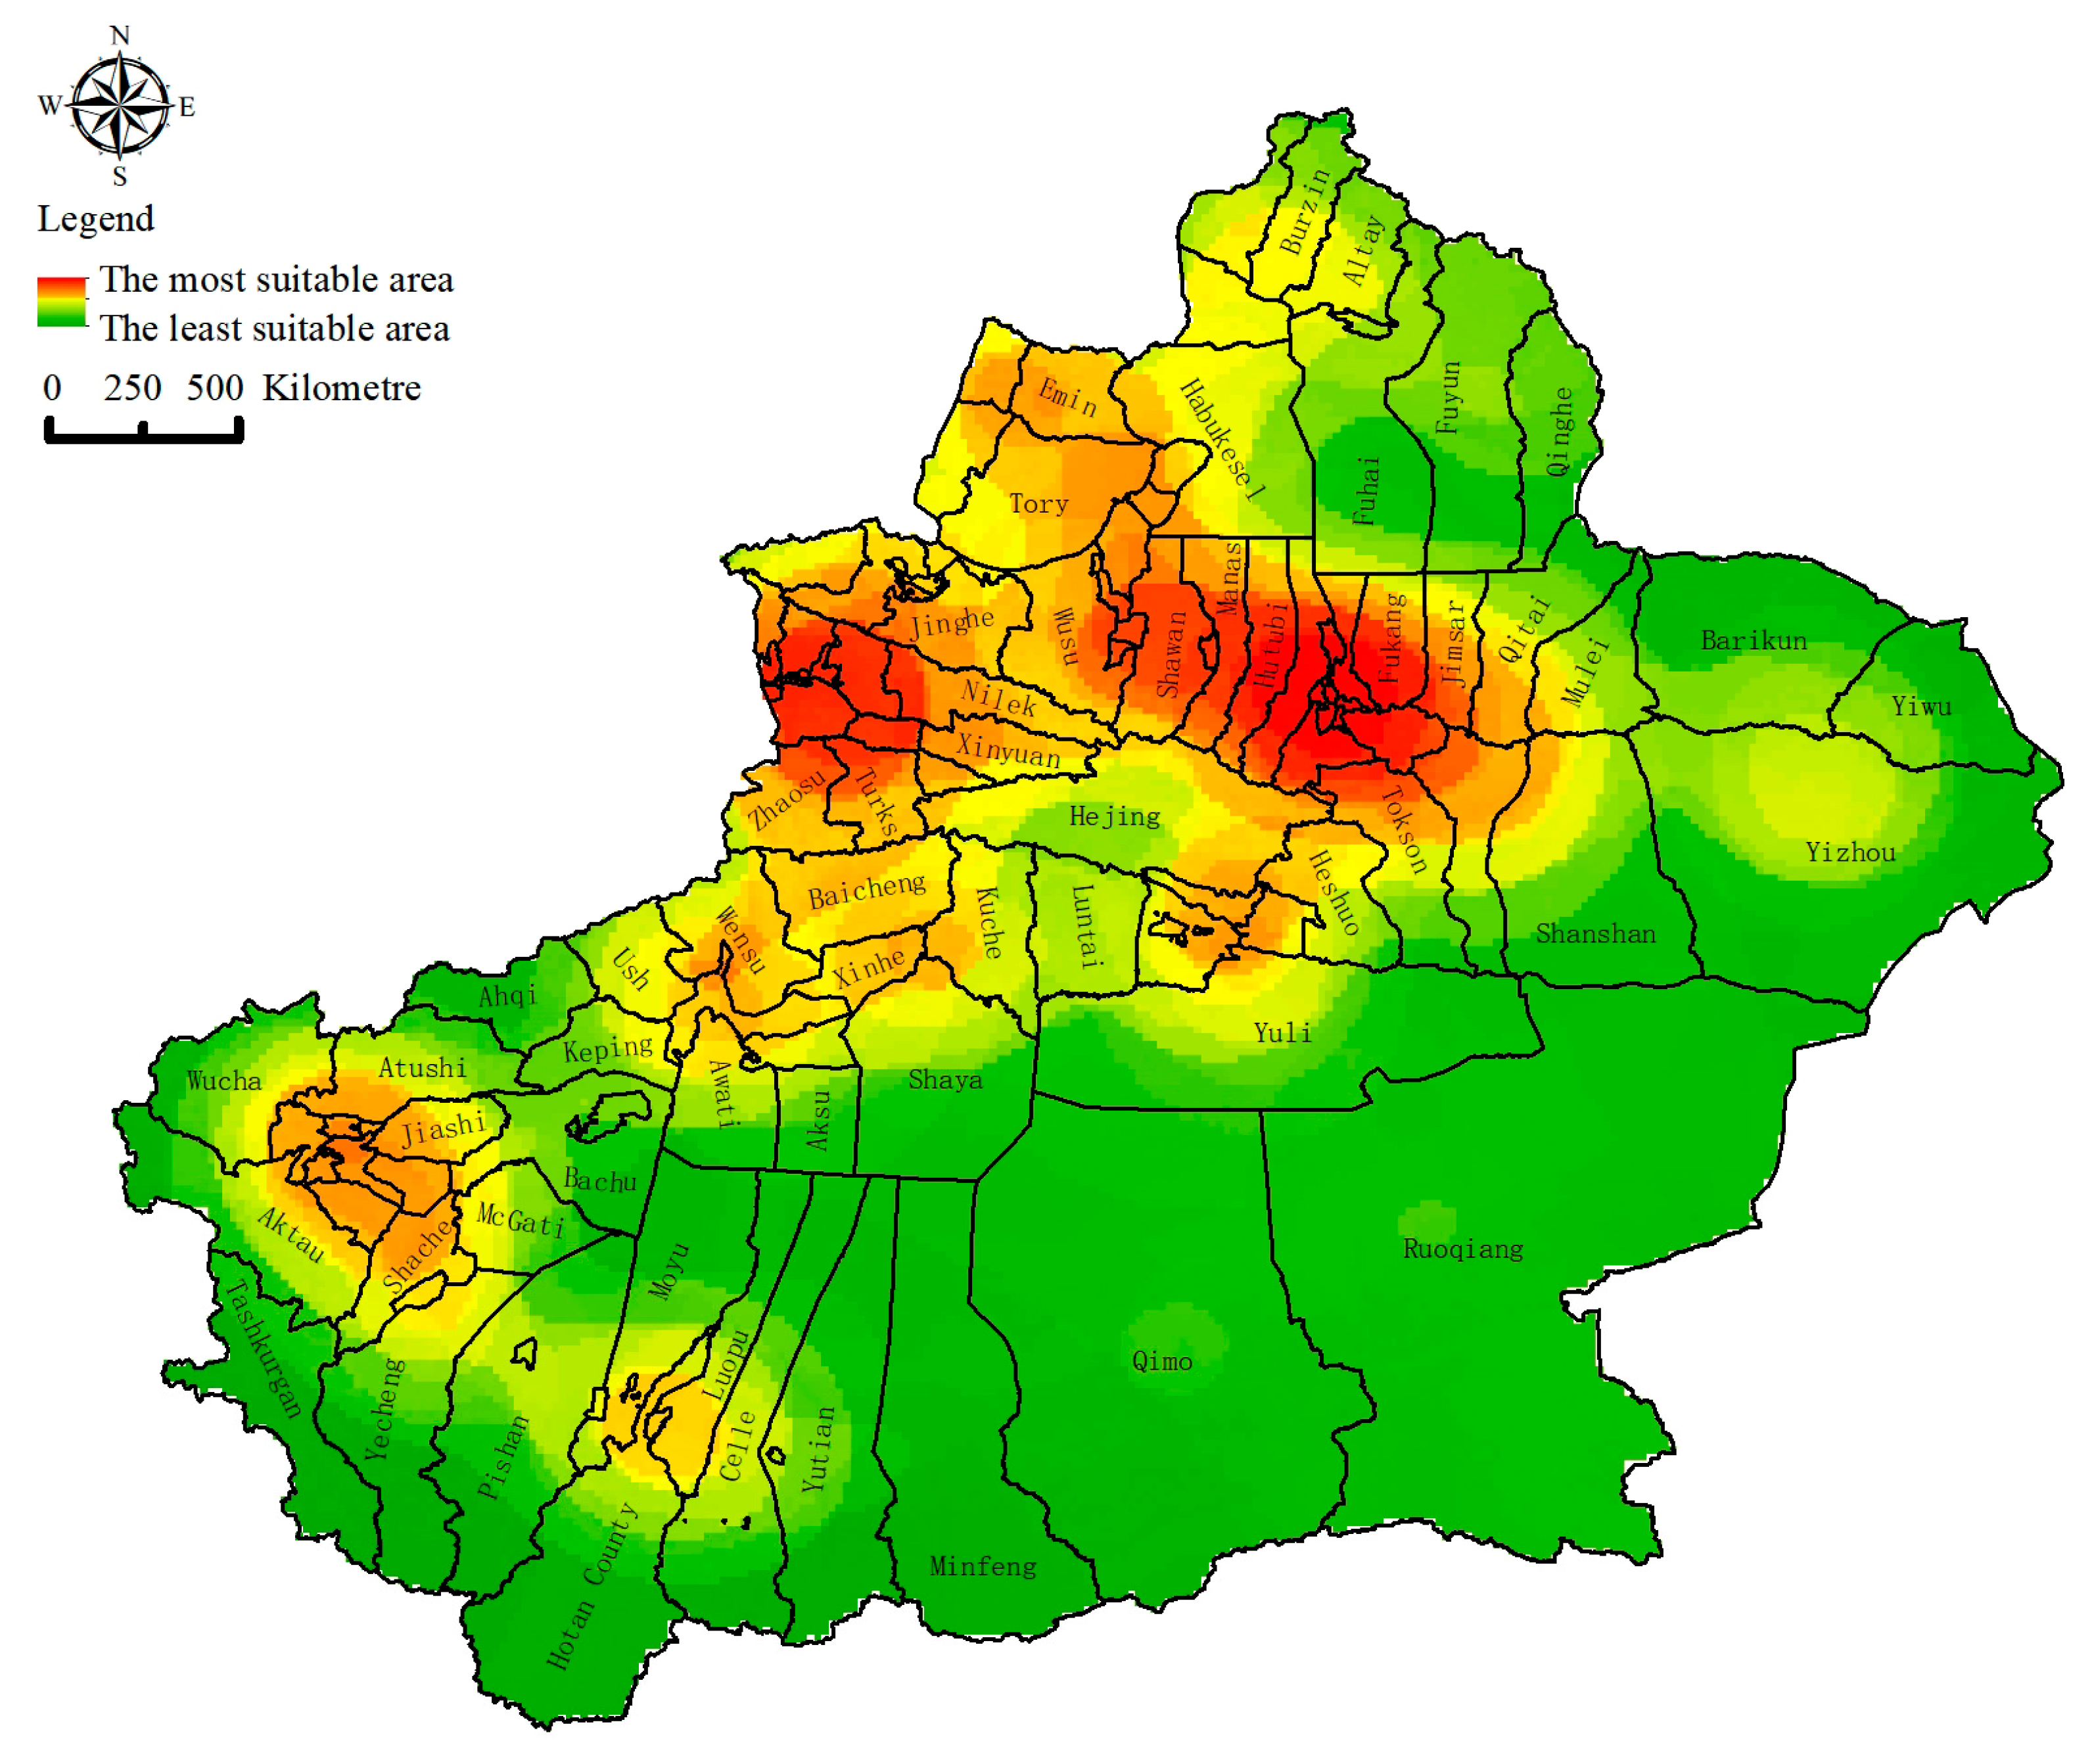
The suitability of the supply of self-driving camps in Xinjiang was obtained by weighting the indicators of the current status of tourism resources, terrain and landforms, climate suitability, water conditions, traffic location, and safety suitability, as shown in Figure 2. The suitability of the supply of self-driving camps in Xinjiang showed the characteristics of high values in the north and low values in the south, with double-core gathering features. The most suitable area is located in the circular core area formed by Huocheng County, Yining City, Yining County, Gongliu County, and Chabuchar Xibe Autonomous County; the contiguous core area formed by Karamay City, Shihezi City, Kuitun City, Manas County, central Hutubi County, and Urumqi City. This area has flat terrain, low altitude, pleasant climate, strong water resources and tourism endowment, and good traffic accessibility, but higher risks of geological disasters. The generally suitable area is distributed in a “Y” shape in Yili Prefecture, western Changji Prefecture, and Tacheng Region, with Kashgar City as the center and radiating in a circular shape to the surrounding counties, which can strengthen the reciprocal interconnection between the prefectures and form the tourism linkage effect between the regions by relying on the highway. The less suitable area includes the central and eastern part of Altai Region, Qitai County, and Mubi. The most unsuitable area includes the central and eastern part of Altai region, the northern part of Qitai County and Mubi County, the northern and eastern part of Hami City, the southeastern part of Bazhou, Kizhou, the southern part of Kashgar region, and the northern and eastern part of the Hotan region, where there are fewer high-grade tourist attractions and some mountainous areas with cold climate, rugged and steep terrain, and that are prone to geological disasters such as landslides.
3.2.2. Suitability Analysis of the Demand for Self-Driving Camps in Xinjiang
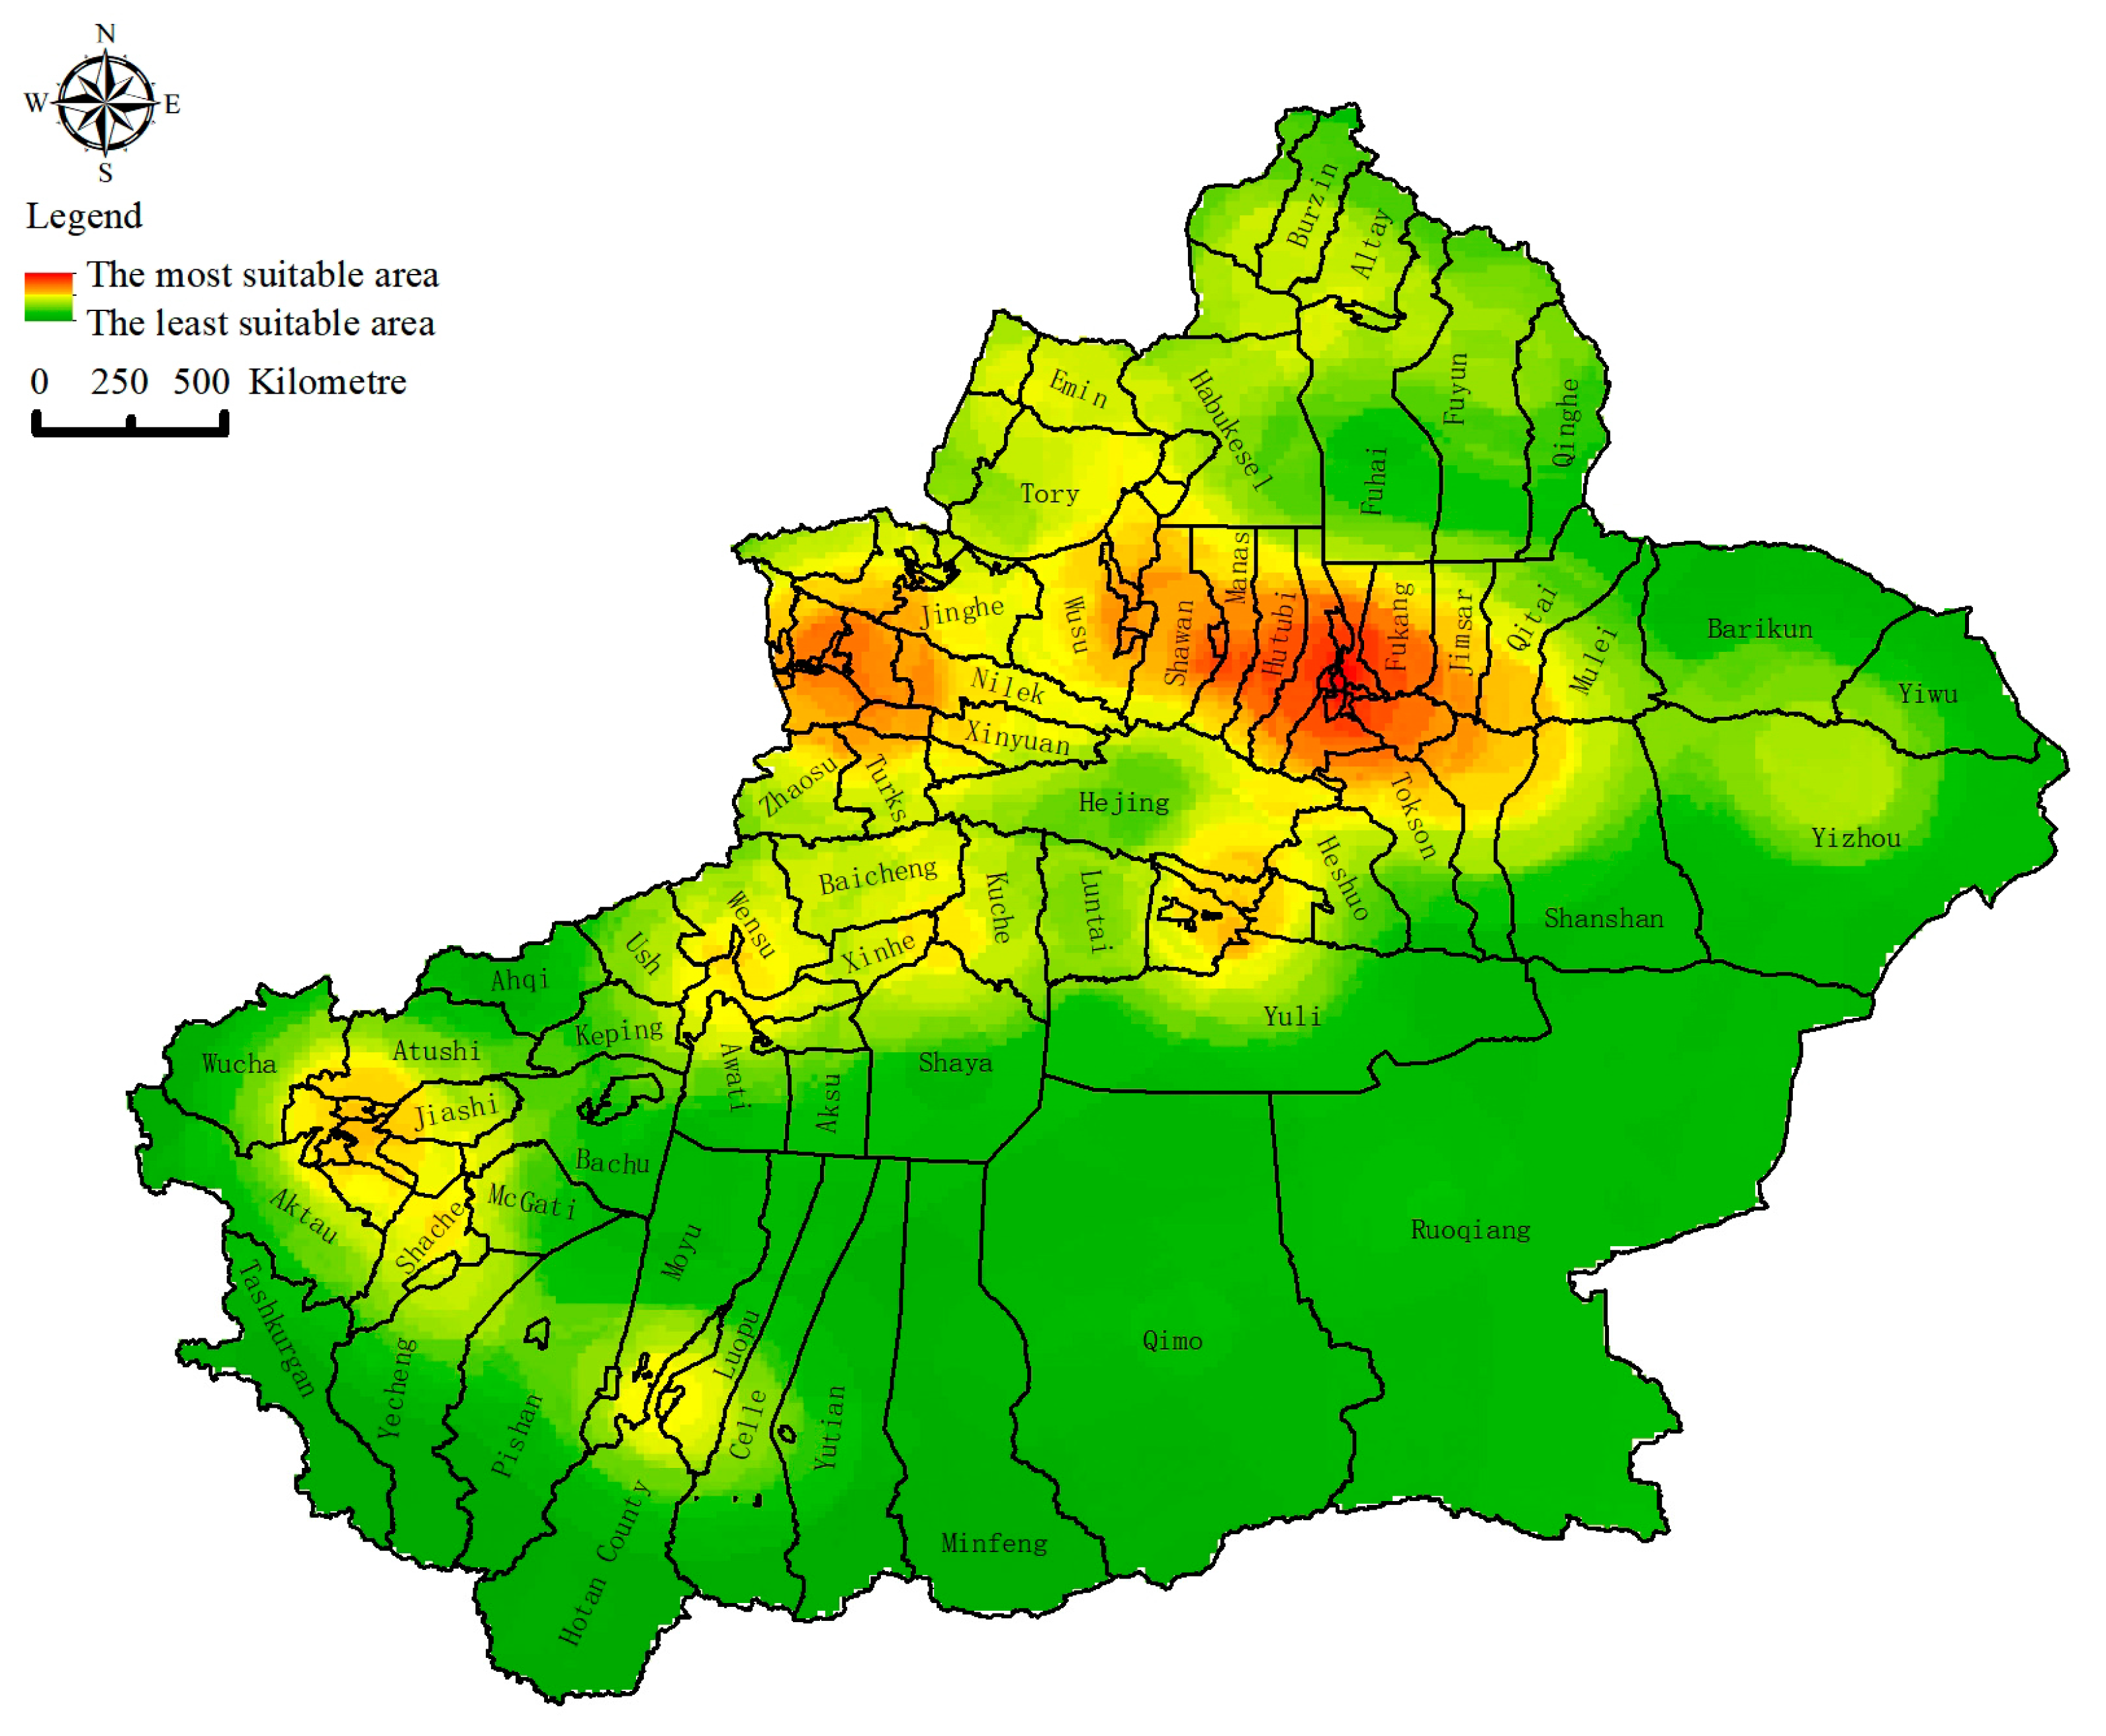
The weights of the social development level, public service facility level, and economic level indicators were determined to obtain the suitability of the demand for self-driving camps in Xinjiang, as shown in Figure 3. The most suitable area is located in Urumqi city, which ranks first in population density, road density, and gas station density, and has the largest number of high-grade tourist hotels; it is the transportation hub and tourism distribution center in Xinjiang. The more suitable area is located in Yining City, which has national highways and provincial roads linking the surrounding counties and cities, and a large number of gas stations and highway service areas. It is an important traffic node city connecting other regions, with a strong endowment of tourism resources, that has seen rapid development of tourism, attracting a large number of tourists, and has made outstanding contributions to the regional economy. Generally suitable areas are located in the southern part of the Altay region and the northern part of Changji Prefecture, Gaochang District, the southeastern part of Yili Prefecture, and the northwestern part of Aksu; these areas are characterized by limited transportation infrastructure and are a certain distance from the highway. Furthermore, the population is evenly distributed in the region, with a certain tourism reception capacity. The least suitable area is located in the east of Hami city, southwest of Bazhou, south of the Hotan area, Wucha county, and Aketao county; the population in this area is sparse, the number of tourist star-rated hotels is small, the demand of tourists is small, public service facilities are not complete, tourism development is lagging behind, and the contribution to the regional economy is not high. While 12 self-driving camps have been built in this area, there may be a problem of oversupply.
3.2.3. Suitability Analysis of the Supply and Demand for Self-Driving Camps in Xinjiang
As shown in Figure 4, the suitability of the supply and demand for self-driving camps in Xinjiang was weighted to obtain the final suitability of the supply and demand for self-driving camps in Xinjiang. The most suitable area accounts for 4.64% of the total of the study area, showing a double-core gathering trend, with Urumqi city as the center, and extending westward to the Dushanzi district. A total of 33 self-driving camps have been built in this area, and the supply and demand in this area are both at the most suitable level, with a large density of roads within the area and a rich variety of tourism resources to rely on, making it a high-quality area for developing self-driving camps. The more suitable area accounts for 10.84% of the total study area, centering on Yining City and extending to Huocheng County, Kokdala City, Yining County, Gongliu County, Caxian County, and the northern part of Turks County. A total of 47 self-driving camps have been built in this area, with a strong suitability of supply, while the suitability of demand needs to be improved, including excellent traffic conditions, high road accessibility, the number of high-grade scenic spots, and the density of self-driving camps. In order to better meet the needs of self-driving tourists, it is necessary to improve the quality of public service facilities and tourism reception capacity. The generally suitable area accounts for 17.23% of the total study area, including the northeastern part of Fuyun County and Qinghe County, the central part of Qitai County and Mubi Kazakh Autonomous County, the central part of Luntai County and Hejing County, the northeastern part of Kulle City, the northwestern part of Wensu County, the southern part of Atushi City, the eastern part of Ucha County, the central part of Aktau County, Kashgar City, the central part of Pishan County and Cele County, the northern part of Hotan County, etc. A total of 29 self-driving camps have been built in this area. With the support of the fine tourist scenic roads and the self-driving tour routes in the north and south of the area, the transportation conditions are relatively superior. The less suitable area accounts for 17.53% of the total study area, including Fuhai County to the south of Qinghe County, western Iwu County, southern Balikun County, central Turpan City, southern and western Ruoqiang County, central Heimo County, Awati County to the south of Shaya County, eastern Kechu, and south-central Hotan, etc. There are 17 self-driving tour camps built in this area, which are scattered and have different natural conditions in each county, and the traffic in the area is relatively undeveloped. In the process of developing self-driving tour camps, attention should be paid to improving the number of high-grade tourist attractions, fully exploiting tourism resources, using the driving effect of the most suitable areas, and vigorously promoting self-driving tours on the basis of improving the suitability of the status quo. The least suitable area accounts for 49.76% of the total study area, including the north and east of Hami City, southeast of Turpan City, north and south of Zhimat County, north of Ruqiang County, south of Batu County, southwest of Ahechi County, west of Wucha County, northwest of Aktau County, south of Tashan County and Yecheng County, and south of Hotan District, etc. There are nine self-driving tour camps built in the area, which are located in the poor sections of ecological safety environment of southern Xinjiang. Fewer scenic spots, drought and minimal rain, more wind and dust, needed improvements in road conditions, and the need to create camps are important factors that need to be addressed in the development of self-driving camps in the area.
3.3. Spatial Optimization Analysis of the Suitability of Self-Driving Camps in Xinjiang
3.3.1. Determination of Demand and Facility Points
Based on the results of spatial suitability analysis of the self-driving camps in Xinjiang, in this paper, we used reclassification tools to classify the suitability evaluation results for the new self-driving camps into 5 categories, after which the less to most suitable areas were extracted as spatial optimization areas by their attributes. We created a 20 km × 20 km fishing network, extracted the intersection points of the fishing network and regional road network as traffic demand points, obtained 11,326 traffic demand points, selected 501 scenic spots as tourist scenic demand points, and determined 106 county and municipal government mass center points as county and municipal demand points, respectively, totaling 11,933 facility demand points, as shown in Figure 5.
A buffer zone was constructed with 10 km of highways and high-grade highways, 30 km of other roads, 50 km of rivers, 50 km of A-class scenic spots, and 10 and 30 km of county and city governments, respectively, and the facility candidate point buffer zones were obtained by merging the 30 km buffer zones of highways, scenic spots, rivers, and towns and eliminating the 10 km buffer zones of towns. The intersections between the nodes of the created fishing network and the facility candidate point buffer zones were determined to obtain 3785 facility candidate points, and 135 points of the built self-driving camps were loaded, giving a total of 3920 facility candidate points, as shown in Figure 6. The overall distribution of the location of facility candidates shows the characteristics of more in the west and less in the east and more in the north and less in the south, forming a high aggregation area around Urumqi, Yining, Kashgar, and Altai.
3.3.2. Selection of Proposed Construction Sites for Self-Driving Camps in Xinjiang Based on the P-Median Model
The facility demand points, facility candidate points, and road network were imported into the geographic database, the element and network datasets were constructed, the road network topology relationship was established and validated, and the network dataset attributes were set. With the use of a network analysis tool to build a new location assignment model, we established 200 facility candidate points based on the Xinjiang 14th Five-Year Plan for Tourism, i.e., the Xinjiang Road Transportation and Tourism Industry Integration Development Plan, by combining the locations of 4A and above tourist scenic spots, national rural tourism key villages and towns, 15 key built tourist scenic roads, 10 tourist ancient roads, 8 self-driving tour routes, the main channel into Xinjiang, etc. The 135 built self-driving tourism camps were defined as mandatory items and 65 proposed self-driving tourism camps were obtained. As shown in Figure 7, most of the optimized proposed campsites occurred in the northern Xinjiang region, among which 12, 32, 11, and 10 proposed campsites were located in the less to most suitable areas. From the perspective of the administrative division, the Altai region is a potential development area for the construction of self-driving campsites, with abundant tourism resources and high tourism development, relying on natural scenery such as Kanas and the Cocoto Sea to create picturesque sightseeing resorts in summer. Moreover, in winter, the abundant snowfall resources can be utilized to create ski resorts, which greatly extends the tourism seasonality and notably contributes to the local economy. In addition, the overall spatial layout of self-driving camps in the generally suitable areas and above can be increased to 81%, providing a basis for the selection of possible locations of self-driving camps.
3.3.3. Space Optimization Suggestions
(1) Formation of the regional tourism cluster development model
The tourism resources of Xinjiang as a whole show the characteristics of more in the west and less in the east, more in the north and less in the south. For the regions with greater resource density, tourism development potential is high, plasticity is strong, tourism attraction is strong, government support and feedback to tourism development is greater, and the cooperation between counties and cities and the promotion of all-area tourism is smoother. However, in some areas of southern Xinjiang, the transportation network is sparse, and the transportation nodes are distant from one another; thus, it is difficult to share tourism resources between counties and cities, and some areas have not yet formed core tourism attractions to retain tourists, resulting in many tourists becoming “passing tourists” rather than “overnight tourists”. The regional development of tourism is hampered. Therefore, for the tourism development of the weaker counties and cities, the latter should engage in a joint effort with the surrounding counties and cities to develop a regional tourism cluster, with tourism resources, self-driving routes, and tourist scenic routes to support each other, thus enriching the tour system of the whole territory.
(2) Improvement in the match between self-driving camps and tourism resources and transportation routes
The large area of Xinjiang province, the scattered scenic spots, the long travel times, and the lack of accessibility between scenic spots directly affect the tourists’ experience and weaken the cooperation and mutual benefits between various states, counties, and cities. The construction of existing self-driving tour camps focuses on interdependence with tourism resources, but traditional tourism cannot meet the current public demand for self-driving tours, and should actively seek cooperation and innovation between self-driving tours and other industries, strengthen the service function of highways in the process of integration and development of the transportation industry and tourism, realize the coordinated development of self-driving tour supporting facilities and tourist routes and traffic roads from the perspective of transportation, and solve the Xinjiang “travel long tour short” predicament.
(3) Development of locally adapted self-driving tour products and improvement in the self-driving tour system
There is a gap between the development level of self-driving tours in North and South Xinjiang; thus, the spatial differentiation pattern of self-driving camps is intensified, and the homogenization phenomenon among self-driving camps is serious. Hence, it is necessary to create a number of self-driving camp demonstration points, promote active participation in the national self-driving camp assessment, enrich the types of self-driving camps, strengthen the development and innovation of self-driving tour products, achieve a standard of high-quality public entrepreneurship and employment, improve the level of self-driving camp service system in the province, and create a self-driving tour business map for Xinjiang with complete self-driving tour supporting facilities and services, so as to promote the growth of tourism economy.
4. Discussion
Li Feng et al. showed the overall distribution characteristics of national self-driving camps as early as 2017, and divided the ten aggregation segments of self-driving camps [68], among which Xinjiang failed to form a nuclear density aggregation due to the insufficient number of self-driving camps. However, with the promotion of the tourism development strategy, the number of self-driving camps in Xinjiang has been developed to a certain extent, and relevant studies should follow. Based on the results of location suitability evaluation and spatial optimization of self-driving camps in Xinjiang, this paper proposes the following points for discussion:
(1) This study constructs an evaluation system of location suitability of self-driving camps in Xinjiang from the supply and demand levels and uses a combination of subjective and objective evaluation to measure the weights of each index. It is consistent with Ding Hua et al.’s use of hierarchical analysis and the entropy value method for constructing the spatial location evaluation model of self-driving camps in Shaanxi Province [69], which ensures the objective and fair weights of evaluation indexes. The difference is that this paper uses raster data for spatial suitability analysis, which can give a more complete view of the suitability of current self-driving camps in Xinjiang, not only enriching the relevant research content but also helping the academic community to understand the spatial relationship between the supply and demand of self-driving camps in a more in-depth way.
(2) The importance of tourism resources to the construction of self-driving camps was verified. In this study, self-driving campsites in Xinjiang show spatial characteristics that are highly matched with tourism resources, and the comprehensive weight of the density of tourist attractions ranks first, which proves the close relationship between tourism resources and self-driving campsites, consistent with the perceived evaluation of self-driving tourists in the Suzhou Taihu camping base [70] and the coordinated relationship between self-driving campsites and A-class scenic spots in Qinghai [71]. However, notably, following the vigorous development of rural tourism, the audit and recognition of national rural tourism key villages and towns were carried out only after 2019, and the degree of coordination between some of the early constructed self-driving campsites and tourism resources is not sufficient. The future development and construction of self-driving campsites should strengthen the dependency on tourism resources, and the attractiveness of human resources to self-driving campsites should be considered in addition to natural resources.
(3) Traffic accessibility is still a prerequisite for the site selection of self-driving camps. Waston et al. clarified that the dominant factors affecting the selection of self-driving camps are geographical traffic factors followed by socio-cultural factors [72]. This study found that self-driving camps should consider not only the traffic accessibility to A-class scenic spots but also the traffic accessibility to the dependent towns, which is similar to the conclusions of Wang Lingen et al. (2012), Zhang Bo et al. (2021), and Yu Jinguo et al. (2017) [24,28,29]. In particular, coordinating the traffic layout of self-driving tour camps and grade highways, building gas stations, and service areas along highways and national roads can provide places for self-driving tourists to rest, and the value of traffic-dependent camps is enhanced by the long distances characteristic of Xinjiang, which has higher requirements for vehicle fuel consumption and long-distance driving. Most of the self-driving camps in Xinjiang are located in areas with good accessibility, such as national highways and provincial roads, and tourists tend to gather in tourist node cities. Despite the important support of tourism resources, problems such as insufficient accessibility of scenic spots, poor road conditions, and lack of networked connectivity for branch roads between neighboring attractions limit the development of self-driving tours. Furthermore, if the traffic factor is ignored, the development of self-driving tour routes is hindered and the development of self-driving camps is at a standstill.
(4) Self-driving camps are mostly built in places with convenient traffic and close to scenic spots. However, the regulations on the use of land for the construction of self-driving camps in China are not clear yet, and no special type of land for self-driving camps has been established. Thus, land approval for self-driving camps is difficult to attain, while at the same time, enterprises and investors need to go through cumbersome procedures when planning and using the land, and there are fewer preferential policies for the construction of supporting facilities for self-driving tours. There may be problems such as insufficient funds, improper site selection, and unqualified approval in the early stage. Cooperation among departments of natural resources, market supervision, forestry and grass, and ecological environmental protection should be strengthened to simplify the approval process for business licenses, forestry and grass approval, and ecological environmental protection procedures on the premises that no permanent buildings will be built, the ground will not be hardened, the environment will not be polluted, and the ecology will not be destroyed. Moreover, attention should be paid to the study of land use policies for self-drive tour camps.
(5) Local governments should take the comprehensive allocation of tourism industry elements as a guide, actively attract investment, promote the capital-transaction and market-oriented operation of self-driving tour camps, allow social investment and operation, and advocate the implementation of the “public service facilities + commercial service facilities” model, with the local government and scenic spots bearing the maintenance costs of public service facilities and the investor-operator bearing the maintenance costs of commercial service facilities. This process can reduce the financial burden in the maintenance of public service facilities as well as drive farmers and herdsmen to engage in related work and increase employment opportunities and income.
5. Conclusions
In this paper, we evaluated the suitability of the location of self-driving camps in Xinjiang from a supply–demand balance perspective at the raster and administrative unit scales, and we conducted spatial optimization analysis based on suitability evaluation level classification. The research results can be summarized as follows:
(1) A suitability evaluation system for self-driving camps in Xinjiang is constructed at the supply and demand levels. The supply level includes the current situation of tourism resources, topography and landscape, climate suitability, water conditions, traffic location, and safety suitability, while the demand level includes the level of social development, public service facilities, and economic level.
(2) The suitability of the supply of self-driving camps in Xinjiang is higher in the north than in the south and higher in the west than in the east. Due to differences in tourism resources and traffic conditions, the supply capacity varies between counties and cities. The most suitable areas are centered on Yining City and Urumqi City, while the least suitable areas are located in the hinterland of the mountain range. Influenced by the topography and geomorphology, some mountainous areas exhibit a cold climate and a rugged and steep terrain, and geological disasters such as mountain collapses can occur.
(3) The self-driving tourism camp demand suitability in Xinjiang indicates a gradual gathering trend in tourism node cities. The most suitable area is located in Urumqi City, and the more suitable areas occur in the tourism node cities in all states. Moreover, tourism development in the counties and cities containing access roads to and from Xinjiang lags behind, failing to fulfill the role of a self-driving tour traffic hub. Hence, the tourism economy in the least suitable areas does not greatly contribute to the regional economy.
(4) The evaluation results of the suitability of the supply and demand for self-driving camps in Xinjiang can be divided into five categories: the most suitable area accounts for 4.64% of the total study area, and 33 self-driving camps have been built; the more suitable area accounts for 10.84% of the total study area, and 47 self-driving camps have been built; the generally suitable area accounts for 17.23% of the total study area, and 29 self-driving camps have been built; the less suitable area accounts for 17.53% of the total study area, and 17 self-driving camps have been built; and the least suitable area accounts for 49.76% of the total study area, and 9 self-driving camps have been built in this area.
(5) With the use of the P-median model, 65 construction sites for self-driving camps in Xinjiang were proposed, which could improve the overall spatial layout of self-driving camps in the generally suitable area by more than 81%. In addition, the Altay region is a potential development area for the construction of self-driving camps due to its abundant tourism resources, long travel times, high suitability, and rapid tourism development.
(6) Three optimization strategies were proposed for the spatial optimization model. First, a regional tourism cluster development model should be established to enhance the tour system across the whole territory with the mutual support of tourism resources, self-driving tour routes, and tourist scenic roads. Second, the matching of self-driving camps with tourism resources and traffic routes should be improved, and the service function of highways should be reinforced. Third, numerous demonstration points of self-driving camps should be created to drive mass entrepreneurship and employment with fine products as typical consequences. Thus, the growth of the tourism economy could be promoted.
The research in this paper is an application-oriented study. It can not only broaden the development ideas of self-driving camps for the government and enterprises but also provide data support for the future planning and construction of self-driving camps. It also meets the realistic development needs of the integration of self-driving routes and traffic highways. Otherwise, this research provides a practical basis and reference for improving the suitability of self-driving camps in Xinjiang and building a self-driving tour system. The study results can effectively promote the economic growth brought by the new tourism industry, but it remains inadequate in terms of theoretical contributions, and the rationality of the evaluation indicators must be enhanced. In the future, time series data can be incorporated into the research scope, and spatial pattern evolution analysis of the suitability of self-driving camps in Xinjiang can be conducted on the basis of this study. This would allow the exploration of the changing trends and underlying factors to more deeply examine the driving mechanisms of spatial differentiation, to further study the synergistic relationship of the supply–demand balance in order to improve the evaluation system of the suitability of the demand for self-driving camps developed in this paper, and to comprehensively characterize the demand for self-driving camps in the source market from various perspectives. The demand for self-driving camps in the study area can also be further investigated to overcome the limitations of the suitability evaluation system for self-driving camps proposed in this paper.
Author Contributions
Writing—original draft, C.G.; Writing—review & editing, C.L. All authors have read and agreed to the published version of the manuscript.
Funding
This research received no external funding.
Institutional Review Board Statement
Not applicable.
Informed Consent Statement
Not applicable.
Data Availability Statement
Not applicable.
Conflicts of Interest
The authors declare no conflict of interest.
References
- Luo, X. On the Development and Product Design of Self-driving Travel Based on Travel Agency. J. Hunan First Norm. Coll. 2008, 154–156. [Google Scholar]
- Xu, M.; Dong, L. Self-driving Tour Market Development and Product Design Based on 4s Store Platform. Coop. Econ. Technol. 2012, 64–65. [Google Scholar]
- Wang, D.; Chen, T.; Liu, C. An Analysis of the Difference of Self-driving Tourist Market Characters Based on Travel Radius—A Case Study of Suzhou. Tour. Trib. 2010, 25, 42–47. [Google Scholar]
- Kristensen, M.S.; Arvidsen, J.; Elmose-Østerlund, K.; Iversen Evald, B. Motives for Shelter Camping. A Survey-study on Motivational Differences Across Group Composition and Experience Level. J. Outdoor Recreat. Tour. 2021, 33, 100333. [Google Scholar] [CrossRef]
- Viallon, P. Retired Snowbirds. Ann. Tour. Res. 2012, 39, 2073–2091. [Google Scholar] [CrossRef]
- Lillywhite, J.M.; Simonsen, J.E.; Fowler, J.M. Visitor Preferences for Campfires in US National Forest Developed Campgrounds. West. J. Appl. For. 2013, 28, 78–84. [Google Scholar] [CrossRef]
- Liu, Y.; Zhang, Y.; Liao, B. An Empirical Study on Behavioral Characteristics of Self-driving Tourists in Nanning City—Measurement and Analysis Based on Questionnaire Survey Data. J. Guangxi Univ. Philos. Soc. Sci. 2010, 32, 10–15. [Google Scholar]
- Tkaczynski, A.; Rundle-Thiele, S. Is Destination Marketing Missing the Mark? A Fraser Coast Segmentation Analysis. J. Destin. Mark. Manag. 2019, 12, 12–14. [Google Scholar] [CrossRef]
- Douglass, R.W. Forest Recreation; Waveland Press Inc.: Long Grove, IL, USA, 2000; pp. 18–20. [Google Scholar]
- Wiley, J. Formers Best RV and Tent Campgrounds in the U.S.A.; John Wiley Sons: Toronto, ON, Canada, 2003; pp. 224–227. [Google Scholar]
- Liu, S.; Huang, A.; Wang, R.; Zhong, X. Analysis of the factors influencing the site selection of self-driving tourism camps. Consum. Guide 2010, 194–195. [Google Scholar]
- Li, X. Study on The Construction of Auto Campground in Shandong Province. Master’s Thesis, Shandong University, Jinan, China, 2010. [Google Scholar]
- Deng, X. The Space Development Pattern Research on Since Motorists Camp of Fujian Province. Master’s Thesis, Fujian Normal University, Fuzhou, China, 2011. [Google Scholar]
- Su, Y. Primary Research of Building Auto Camp in Hubei Province—Take the Ecotourism Area of Enshi Pingba Camp as an Example. Master’s Thesis, Wuhan Institute of Sports, Wuhan, China, 2014. [Google Scholar]
- Yang, Y. Research on Self-driving Tourism Development of Tibet Ali Region. Master’s Thesis, Zhejiang Normal University, Jinhua, China, 2013. [Google Scholar]
- Zhang, M. Research on Spatial Distribution Characteristics and Optimization of Self-Driving Recreational Vehicle Camp in Xinjiang. Master’s Thesis, Xinjiang Normal University, Ürümqi, China, 2018. [Google Scholar]
- Goonan, K.A.; Monz, C.A.; Manning, R.E.; Anderson, L.E. Resource Conditions and Paddler Standards for Primitive Campsites Along Lake Champlain. J. Great Lakes Res. 2012, 38, 157–166. [Google Scholar] [CrossRef]
- Mikulić, J.; Prebežac, D.; Šerić, M.; Krešić, D. Campsite Choice and The Camping Tourism Experience: Investigating Decisive Campsite Attributes Using Relevance-determinance Analysis. Tour. Manag. 2017, 59, 226–233. [Google Scholar] [CrossRef]
- Ma, S.; Craig, C.A.; Feng, S. The Camping Climate Index (CCI): The Development, Validation, and Application of a Camping-sector Tourism Climate Index. Tour. Manag. 2020, 80, 104105. [Google Scholar] [CrossRef]
- Craig, C.A. The Weather-Proximity-Cognition (WPC) Framework: A Camping, Weather, and Climate Change Case. Tour. Manag. 2019, 75, 340–352. [Google Scholar] [CrossRef]
- Breiby, M.A. Exploring Aesthetic Dimensions in A Nature-based Tourism Context. J. Vacat. Mark. 2014, 20, 163–173. [Google Scholar] [CrossRef]
- Marion, J.; Cole, D. Spatial and Temporal Variation in Soil and Vegetation Impacts on Campsites. Ecol. Appl. 1996, 6, 520–530. [Google Scholar] [CrossRef] [Green Version]
- Hu, Q. Research on Suitability of Camping Tourism Development in Haifeng Wetland. Master’s Thesis, Yunnan University, Kunming, China, 2016. [Google Scholar]
- Wang, L.; Cheng, S.; Zhong, L. The Construction of Index System for Tourism Resources Development Suitability Based on Self-driving Tourism—A Case Study of Yichun City. Hum. Geogr. 2012, 27, 134–139+31. [Google Scholar]
- Fu, Y.; Yin, J.; Zhao, Z.; Wang, L. Tourists Willingness Based Evaluation of Camping Suitability in Nature Reserve. J. Chin. Urban For. 2021, 19, 121–125. [Google Scholar]
- Xiao, X. Planning and Design of Nature Education Camp in Dagang Forest Farm Based on Suitability Evaluation. Master’s Thesis, Jiangxi Agricultural University, Nanchang, China, 2021. [Google Scholar]
- Liu, J.; Li, T. The Suitability Analysis of Tent Camping Sites in the North Luoxiao National Forest Park Based on GIS. Nat. Prot. Areas 2021, 1, 90–98. [Google Scholar]
- Zhang, B.; Tang, B.; Zhou, L. Study on Site Selection Optimization of Self-driving Camps in Western Sichuan Based on Spatial Suitability. Highway 2021, 66, 218–223. [Google Scholar]
- Yu, J.; Xu, Y. Evaluation of Suitability of Self-drving Camp Based on GIS—A case study of Lvshunkou District, Dalian. J. Liaoning Norm. Univ. Nat. Sci. Ed. 2017, 40, 372–378. [Google Scholar]
- Guo, S. The Research on Comprehensive Evaluation and Development Countermeasures of Hunan Campgrounds. Master’s Thesis, Central South University of Forestry and Technology, Changsha, China, 2017. [Google Scholar]
- Liu, H.; Yang, Z.; Wang, C.; Han, F.; Wang, Z. Camping Suitability of World Natural Heritage Based on GIS: A Case Study in Kurderning, A World Heritage in The Tianshan Mountains. Xinjiang Arid Zone Res. 2016, 33, 843–850. [Google Scholar]
- Yuan, W.; Zhang, J.; Ji-qiang, T.; Zhou, B.; Kang, R.C.; Wang, A.H.; Liu, W.; Zhang, L. Suitability of Spatial Pattern of Camping Sites in Langxiang Natural Reserve, Northeast China, based on GIS technology. Chin. J. Appl. Ecol. 2015, 26, 2785–2793. [Google Scholar]
- Wei, Y. Research on Environmental Suitability and Spatial Layout of Camping Tourism Areas in Forest Reserves. Master’s Thesis, Northeast Forestry University, Harbin, China, 2016. [Google Scholar]
- Ma, L.; Sun, G.; Xie, Y.; Long, M. A Study on Variations of The Tourism Climate Comfort Degree in Five Typical Cities in Eastern China During the Last 50 Years. Resour. Sci. 2010, 32, 1963–1970. [Google Scholar]
- Cao, W.; He, Y.; Li, Z.; Wang, S.; Wang, C. Evaluation of The Tourism Climate Comfort Index in Lijiang City, Yunnan. J. Glaciol. Geocryol. 2012, 34, 201–206. [Google Scholar]
- Ma, L.; Sun, G.; Wang, J. Evaluation of Tourism Climate Comfortableness of Coastal Cities in The Eastern China. Prog. Geogr. 2009, 28, 713–722. [Google Scholar]
- Marion, J.L.; Arredondo, J.; Wimpey, J.; Meadema, F. Applying Recreation Ecology Science to Sustainably Manage Camping Impacts: A Classification of Camping Management Strategies. Int. J. Wilderness 2018, 24, 84–100. [Google Scholar]
- Leung, Y.-F.; Marion, J.L. Managing Impacts of Camping. Book Chap. In Environmental Impacts of Ecotourism; Buckley, R., Ed.; CABI Publishing: Wallingford, UK, 2004; pp. 245–258. [Google Scholar]
- Jeffrey, L.; Marion, Y.-F.; Leung, H.E.; Burroughs, K. A Review and Synthesis of Recreation Ecology Research Findings on Visitor Impacts to Wilderness and Protected Natural Areas. J. For. 2016, 114, 352. [Google Scholar]
- Razzaq, A.; Fatima, T.; Murshed, M. A Symmetric Effects of Tourism Development and Green Innovation on Economic Growth and Carbon Emissions in Top 10 GDP Countries. Environ. Plann. Manag. 2023, 66, 471–500. [Google Scholar] [CrossRef]
- Yi, W.; Qing, L. How does The Travel and Tourism Industry Contribute to Sustainable Resource Management? The Moderating Role of ICT in Highly Resource-consuming Countries. Resour. Policy 2023, 82, 103536. [Google Scholar]
- Arredondo, J.R.; Marion, J.L.; Meadema, F.P.; Wimpey, J.F. Modeling Areal Measures of Campsite Impacts on The Appalachian National Scenic Trail to Enhance Ecological Sustainability. J. Environ. Manag. 2021, 279, 111693. [Google Scholar] [CrossRef]
- Wang, T.; Watanabe, T. Monitoring Campsite Soil Erosion by Structure-from-Motion Photogrammetry: A Case Study of Kuro-dake Campsites in Daisetsuzan National Park, Japan. J. Environ. Manag. 2022, 314, 115106. [Google Scholar] [CrossRef] [PubMed]
- Fitchett, J.M.; Meyer, C.A. The Applicability and Suitability of The Camping Climate Index for South Africa. J. Outdoor Recreat. Tour. 2023, 42, 100619. [Google Scholar] [CrossRef]
- Jiang, C.; Zhang, Y.; Kamran, H.W.; Afshan, S. Understanding the Dynamics of The Resource Curse and Financial Development in China? A Novel Evidence Based on QARDL Model. Resour. Policy 2021, 72, 102091. [Google Scholar] [CrossRef]
- Del Moretto, D.; Colla, V.; Annunziata Branca, T. Sustainable Mobility for Campsites: The Case of Macchia Lucchese. Renew. Sustain. Energy Rev. 2017, 68, 1063–1075. [Google Scholar] [CrossRef]
- Eagleston, H.; Marion, J.L. Sustainable Campsite Management in Protected Areas: A Study of Long-term Ecological Changes on Campsites in The Boundary Waters Canoe Area Wilderness, Minnesota, USA. J. Nat. Conserv. 2017, 37, 73–82. [Google Scholar] [CrossRef] [Green Version]
- Mu, J.; Mao, Y.; Zhang, L.; Qi, Q. Establishment of Index System Valuating Nursing Staff’s Ability in preventing and Controlling Healthcare-Associated Infection Based on Delphi Method. Chin. J. Infect. Control 2022, 21, 1229–1235. [Google Scholar]
- Yu, Q.; Chen, J.; Song, H. A Delphi Study on The Evaluation Index System Establishment of Home-School Cooperation Competency of Teachers. Teach. Educ. Res. 2022, 34, 44–52. [Google Scholar]
- Chen, J.; Yang, X. Establishment of Evaluation Index System for Excellent Young Scientists Fund Based on Delphi and Analytic Hierarchy Process. Sci. Found. China 2023, 496–503. [Google Scholar]
- Wang, S.; Li, J.; Gong, S.; Xie, J. Research on Buliding Water Supply and Drainage Safety Assessment Based on Analytic Hierarchy Process—A Case of Fire Exting Uishing System. Waterwastewater Eng. 2022, 58, 98–101+131. [Google Scholar]
- Huang, S.; He, Y.; Yang, Z.; Ju, P.; Yang, X.; Wang, K.; Feng, Y.; Chen, H.; Wu, N. Construction of An Ecosystem Service Value Evaluation System for The Longquan Mountain Forest Park in Chengdu City Based on The Analytic Hierarchy Process. Chin. J. Appl. Environ. Biol. 2022, 28, 1635–1645. [Google Scholar]
- Sun, J.; Ma, C.; Hu, J.; Yan, T.; Gao, J.; Xu, H. Susceptibility Evaluation of Geological Hazard by Coupling Grey Relational Degree and Analytic Hierarchy Process: A case of Chongtou Town, Yunhe County, Zhejiang Province. J. Eng. Geol. 2023, 31, 538–551. [Google Scholar]
- Xia, H.; Liu, L.; Zhou, X.; Chen, K.; Li, Y.; Kuang, P.; Sun, G.; Lei, Y. Selection of Suitable Mosses for Bare Rock and Steep Slope Greening after Jiuzhaigou Earthquake Based on the Analytic Hierarchy Process. Bull. Bot. Res. 2023, 1–10. Available online: http://42.194.184.28/kcms/detail/23.1480.S.20230525.1027.004.html (accessed on 27 June 2023).
- Xu, X. The Use of Analytic Hierarchy Process. Stat. Decis. Mak. 2008, 156–158. [Google Scholar]
- Du, C.; Zhao, K.; Wu, J.; Jiang, Y.; Mao, F.; Wang, J.; Guo, W. Construction of Evaluation System for Tumor Information Systems Based on Analytic Hierarchy Process. Chronic Dis. Prev. Control China 2019, 27, 241–246. [Google Scholar]
- Xie, Y.; Zhang, L.; Luo, S.; Yang, J.; Li, F.; Wang, D. Evaluating the Level of Provincial Ecological Civilization Development in China Using the DoubleBenchmark Progressive Method. China Eng. Sci. 2017, 19, 60–66. [Google Scholar]
- Zeng, L.; Tang, L. Research on Landscape Performance Evaluation of Ancient Salt Cultural Towns in Sichuan, Yunnan and Guizhou Intersection Based on Hierarchical Entropy Method. Des. Res. 2021, 11, 143–147+151. [Google Scholar]
- Wang, W.; Ji, K.; Zhang, Y. Evaluation about Ecological Security of Regional Land Use Based on Entropy Weight Method: A Case about Chizhou City, Anhui Province. J. Shandong Agric. Eng. Coll. 2021, 38, 22–31. [Google Scholar]
- Du, H.; Zhang, Y. Study on the Influencing Factors Based on APH-Entropy Weight:Take Sustainable Development of Tourism Characteristic Towns in Shangluo City as An Example. Hubei Agric. Sci. 2021, 60, 170–174. [Google Scholar]
- Zhang, S.; He, F.; Hu, X.; Yang, H. Spatial Distribution Characteristics and Influencing Factors of Rural Tourism Destinations in Hebei Province. J. Nat. Sci. Hunan Norm. Univ. 2023, 46, 103–112. [Google Scholar]
- Liu, X.; Wang, J.; Zhou, B.; Liu, S. Data Optimization Based on Ordinary Kriging for Radon Detection to Identify Spontaneous Combustion Areas. J. Taiyuan Univ. Technol. 2022, 53, 690–696. [Google Scholar]
- Yi, W.; Yu, Y.; Zhang, Y.; Li, Z.; Huang, Y. p-median Model Based Optimal Planning of Energy Station for Regional Integrated Energy Systems. Autom. Electr. Power Syst. 2019, 43, 107–112. [Google Scholar]
- Zhou, Y.; Ma, Z.; Wang, K. A Reliability P-median Location model for Relief Supplies Reserve Bases. Manag. Rev. 2015, 27, 198–208. [Google Scholar]
- Dan, Z. Investigation and Evaluation on Large Scale p-Median Problem—A Case Study of Dalarna, Sweden. Master’s Thesis, Tianjin University of Finance and Economics, Tianjin, China, 2013. [Google Scholar]
- Wang, C.; Si, Q. A Study of Data Statistical Processing Method of Delphi Method and Its Application. J. Inn. Mong. Inst. Financ. Econ. Compr. Ed. 2011, 9, 92–96. [Google Scholar]
- Shen, X. Study on Study on Spatial-temporal Differentiation of Tourism Climate Comfort in Guangxi Based on DEM. Carsologica Sinica 2018, 37, 254–264. [Google Scholar]
- Li, F.; Wang, D.; Liu, C.; Sun, F. Spatial Distribution Characteristics and Mechanistic Drivers of Self-driving and RV Camping in China. Resour. Sci. 2017, 39, 288–302. [Google Scholar]
- Ding, H.; Wang, J.; Liao, W.; Liang, T.; Dai, H. Site Selection of Self-driving and Recreational Vehicle camps in China:An Investigation Using Analytic Hierarchy Process and Entropy. J. Transp. Eng. 2021, 8, 16. [Google Scholar]
- Feng, L.I.; Wang, D.G. Influencing Factors and Mechanism of Campgrounds Development Based on Tourist Online Reviews: A Case Study of Suzhou Taihu RV Camping Park. Geogr. Geo-Inf. Sci. 2019, 35, 135–140. [Google Scholar]
- Yin, X.X.; Ye, C.Y.; Lin, X.B.; Li, J.L.; Gao, X.C. Study on The Tourism Spatial Structure of Qinghai Province Based on The Accessibility of All-area Self-driving Tourism. J. Cent. China Norm. Univ. Nat. Sci. 2019, 2, 298–308. [Google Scholar]
- Waston, A.E.; Roggenbuck, J.W.; Williams, D.R. The influence of past experience on wilderness choice. J. Leis. Res. 1991, 23, 21–36. [Google Scholar]
Figure 1.
Overview of the study area.

Figure 2.
Suitability of the supply for self-driving camps in Xinjiang.

Figure 3.
Suitability of the demand for self-driving camps in Xinjiang.

Figure 4.
Suitability evaluation of the supply and demand for self-driving camps in Xinjiang.

Figure 5.
P-median model facility demand points.
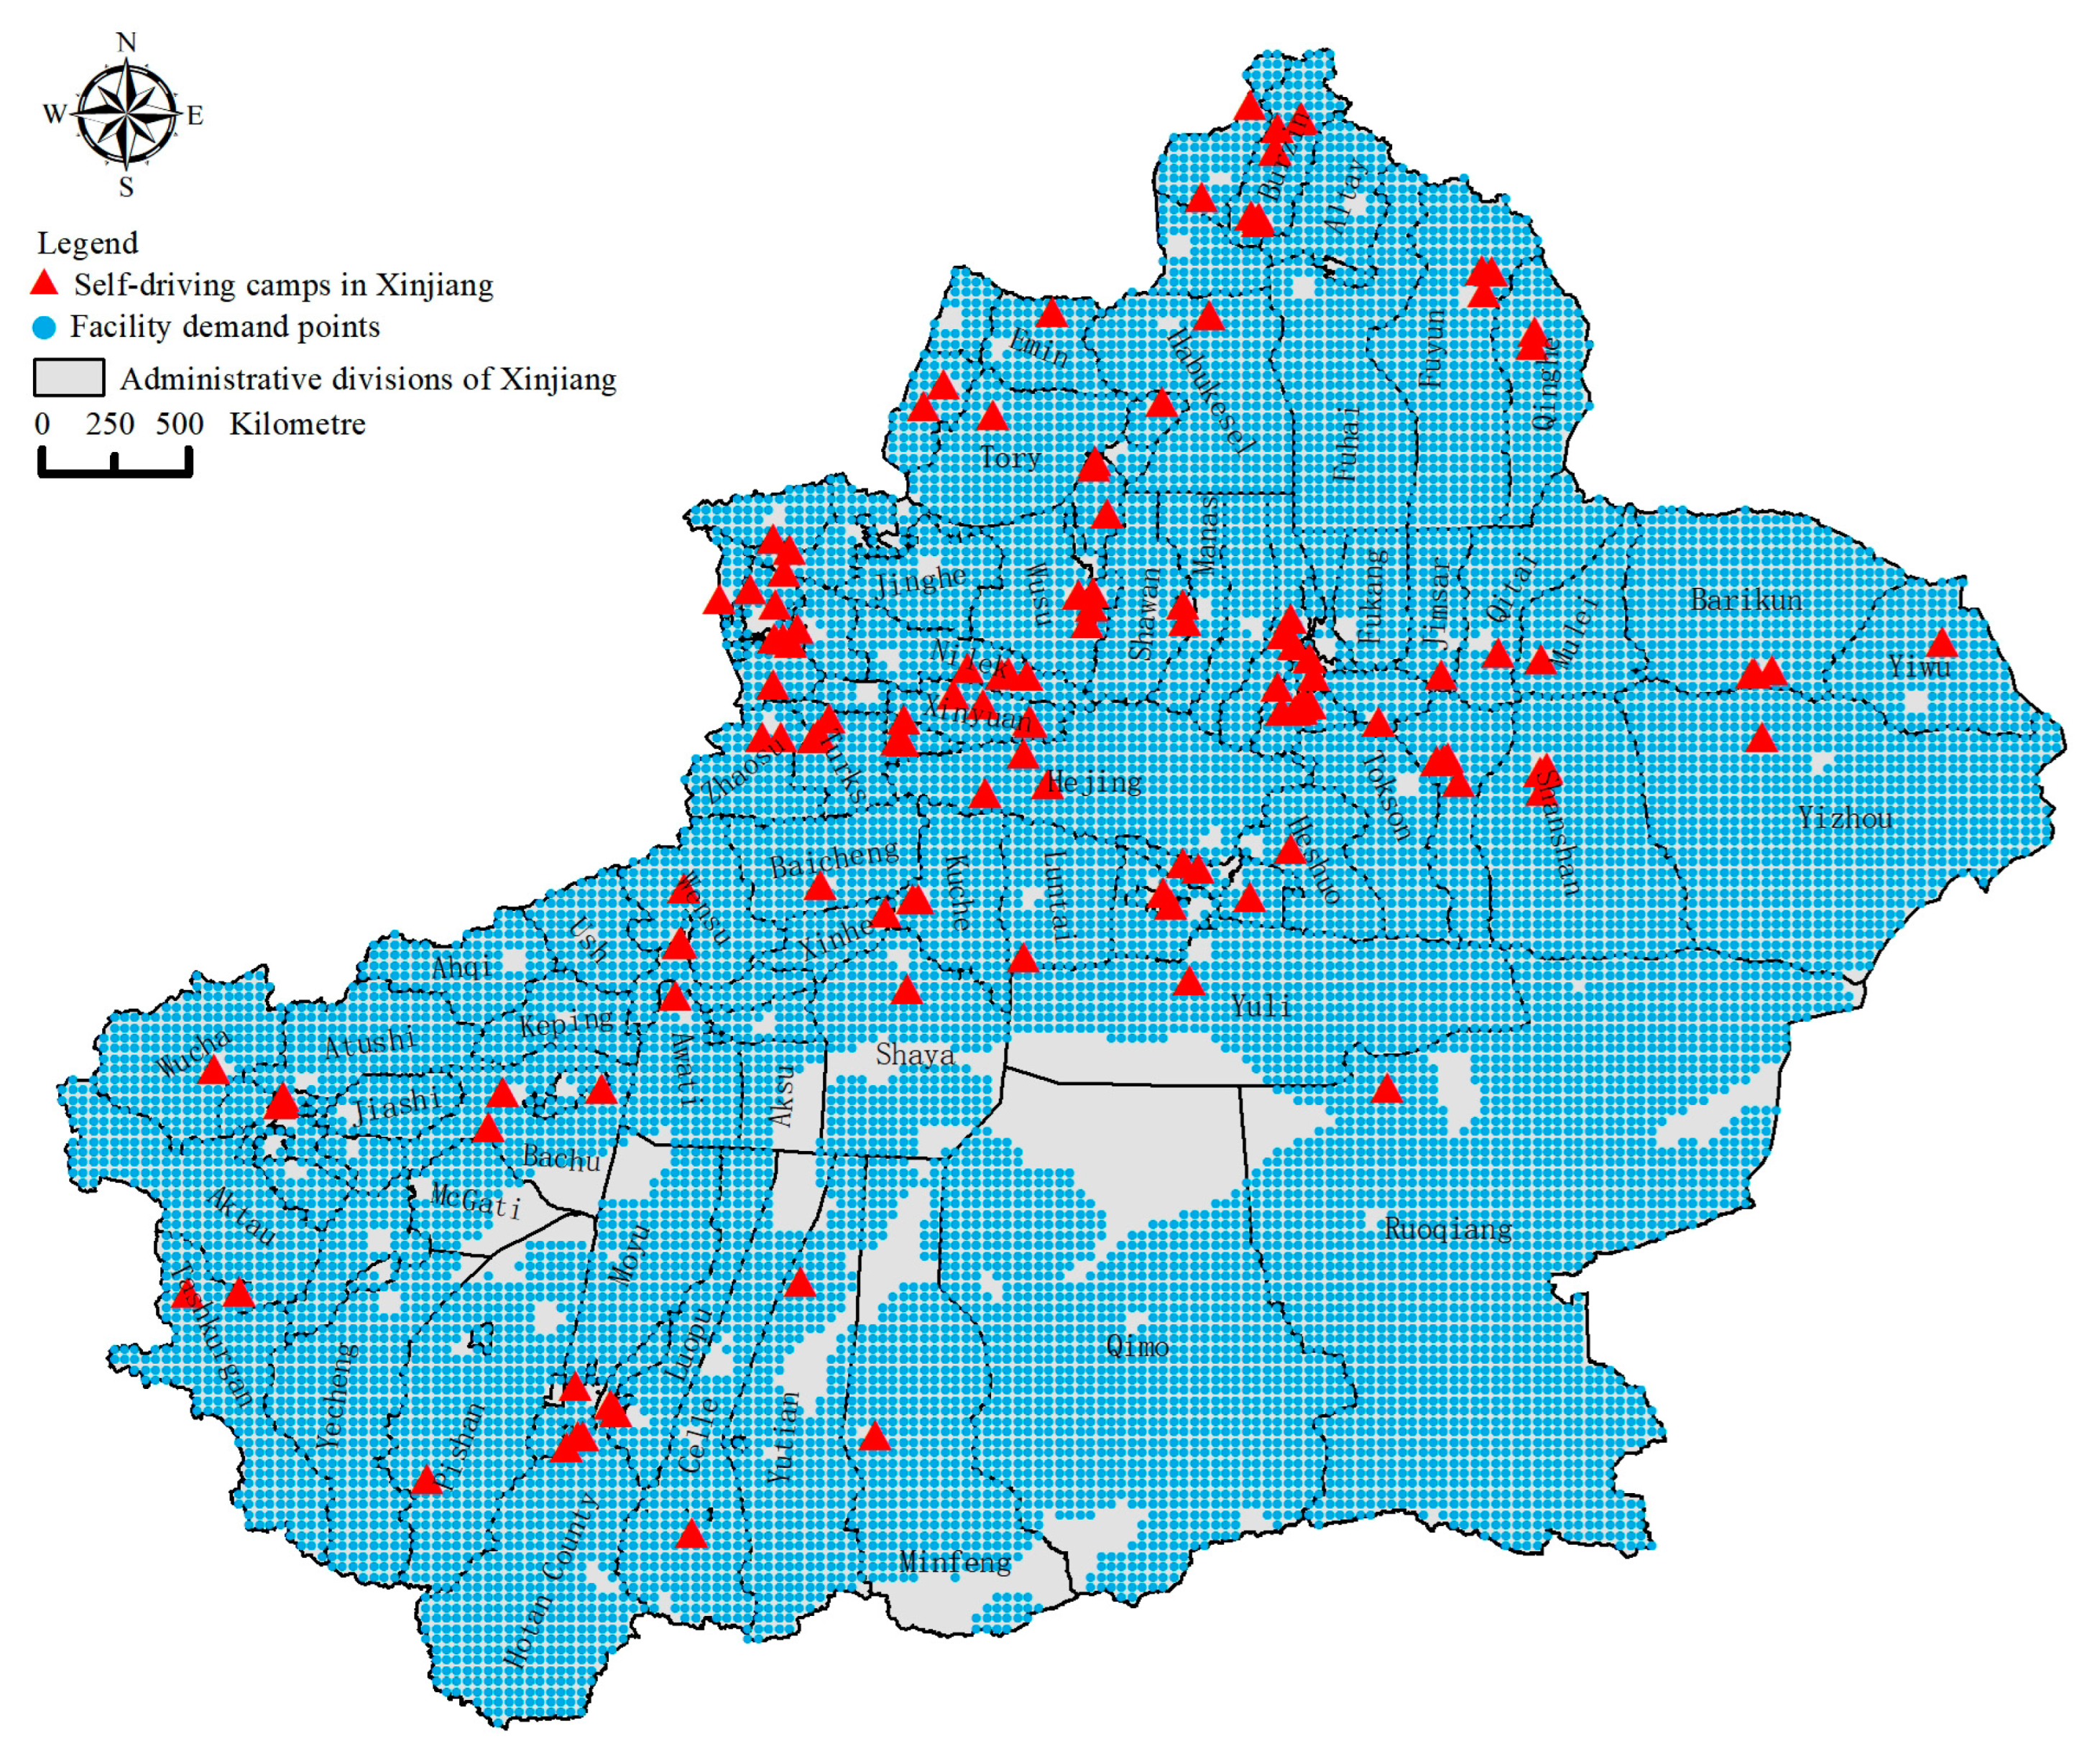
Figure 6.
P-median model facility candidate points.

Figure 7.
Optimization of the spatial pattern of self-driving camps in Xinjiang.


Table 1.
Table of RI values of the random consistency index test of the judgment matrix.
| Order | 1 | 2 | 3 | 4 | 5 | 6 | 7 | 8 | 9 |
| RI | 0 | 0 | 0.58 | 0.9 | 1.12 | 1.24 | 1.32 | 1.41 | 1.45 |
Table 2.
Screening of location suitability evaluation index system for self-driving camps in Xinjiang.
Table 2.
Screening of location suitability evaluation index system for self-driving camps in Xinjiang.
| Target Layer | Guideline Layer | Factor Layer | Indicator Layer | Importance | ||
|---|---|---|---|---|---|---|
| Mj | Kj | CVj | ||||
| Location suitability evaluation index system for self-driving camps in Xinjiang | Xinjiang self-driving camp supply suitability | Status of tourism resources | Density of tourist attractions | 3.38 | 0.15 | 0.30 |
| Density of national rural tourism key villages and towns | 3.62 | 0.15 | 0.28 | |||
| Terrain and landforms | Elevation | 3.92 | 0.38 | 0.30 | ||
| Slope | 3.92 | 0.23 | 0.21 | |||
| Slope direction | 3.92 | 0.23 | 0.19 | |||
| Vegetation cover | 3.69 | 0.23 | 0.25 | |||
| Climate suitability | Temperature and humidity index | 4.31 | 0.38 | 0.14 | ||
| Wind chill index | 4.38 | 0.46 | 0.14 | |||
| Air quality index | 3.15 | 0 | 0.17 | |||
| Water conditions | Water proximity | 3.15 | 0.23 | 0.39 | ||
| Water supply per capita | 3.15 | 0 | 0.24 | |||
| Total water resources per capita | 3.23 | 0.15 | 0.35 | |||
| Traffic location | Road density | 2.77 | 0 | 0.32 | ||
| Camp to scenic spot accessibility | 3.23 | 0 | 0.27 | |||
| Camp to dependent town center accessibility | 3.46 | 0.08 | 0.21 | |||
| Safety suitability | Geological hazard risk | 2.77 | 0 | 0.38 | ||
| Number of geological disasters | 3.85 | 0.15 | 0.17 | |||
| Xinjiang self-driving camps demand suitability | Social development level | Population density | 3.31 | 0 | 0.28 | |
| Tourist star-rated hotel density | 3.78 | 0.08 | 0.15 | |||
| Density of star-rated farmhouses | 3.78 | 0.08 | 0.24 | |||
| Public service facility level | Gas station density | 3.46 | 0.08 | 0.22 | ||
| Highway service area density | 3.15 | 0.08 | 0.27 | |||
| Economic level | Proportion of the tertiary industry | 2.92 | 0 | 0.31 | ||
| GDP per capita | 3.46 | 0 | 0.18 | |||
| Tourism economic contribution | 4.08 | 0.23 | 0.18 | |||
Table 3.
Description of location suitability evaluation index system for self-driving camps in Xinjiang.
Table 3.
Description of location suitability evaluation index system for self-driving camps in Xinjiang.
| Target Layer | Guideline Layer | Factor Layer | Indicator Layer | Calculation Method |
|---|---|---|---|---|
| Location suitability evaluation index system for self-driving camps in Xinjiang | Xinjiang self-driving camps supply suitability | Status of tourism resources | Density of tourist attractions | After kernel density analysis, the natural breakpoint method was employed to reclassify the density values into five categories, and scores from 1 to 5 were assigned according to the interval (in ascending order) |
| Density of national rural tourism key villages and towns | After kernel density analysis, the natural breakpoint method was employed to reclassify the density values into five categories, and scores from 1 to 5 were assigned according to the interval (in ascending order) | |||
| Terrain and landforms | Elevation | Natural-breakpoint-method-based reclassification into 5 categories, followed by the assignment of scores from 1 to 5 according to the interval (in descending order) | ||
| Slope | Natural-breakpoint-method-based reclassification into 5 categories, followed by the assignment of scores from 1 to 5 according to the interval (in descending order) | |||
| Vegetation cover | Natural-breakpoint-method-based reclassification into 5 categories, followed by the assignment of scores from 1 to 5 according to the interval (in ascending order) | |||
| Climate suitability | Temperature humidity index | Referring to the range of values in existing studies [36,67], reclassification was achieved according to 9, 7, 5, 3, and 1 | ||
| Wind chill index | Referring to the range of values in existing studies [36,67], reclassification was conducted according to 9, 7, 5, 3, and 1 | |||
| Air quality index | After interpolation in kriging space, the air quality was reclassified into 6 categories according to the national air quality standards, and scores from 1 to 6 were assigned according to the interval (in descending order) | |||
| Water conditions | Water proximity | After Euclidean distance analysis, the natural breakpoint method was employed to reclassify the values into five categories, and scores from 1 to 5 were assigned according to the interval (in descending order) | ||
| Water supply per capita | After interpolation in kriging space, the natural breakpoint method was used to reclassify the values into five categories, and scores from 1 to 5 were assigned according to the interval (in ascending order) | |||
| Traffic location | Road density | After kernel density analysis, the natural breakpoint method was used to reclassify the density values into five categories, and scores from 1 to 5 were assigned according to the interval (in ascending order) | ||
| Camp to scenic spot accessibility | The origin–destination (OD) cost matrix was constructed to calculate the point accessibility, the natural breakpoint method was adopted for data reclassification into 5 categories, and scores from 1 to 5 were assigned according to the interval (in descending order) | |||
| Camp to dependent town center accessibility | The OD cost matrix was constructed to calculate the point accessibility, the natural breakpoint method was used for data reclassification into 5 categories, and scores from 1 to 5 were assigned according to the interval (in descending order) | |||
| Safety suitability | Geological hazard risk | After kernel density analysis, the natural breakpoint method was used for data reclassification into 5 categories, and scores from 1 to 5 were assigned according to the interval (in descending order) | ||
| Number of geological disasters | After kernel density analysis, the natural breakpoint method was employed for data reclassification into 5 categories, and a score from 1 to 5 was assigned according to the interval (in descending order) | |||
| Xinjiang self-driving camps demand suitability | Social development level | Population density | After interpolation in kriging space, the natural breakpoint method was used for data reclassification into five classes, and a score from 1 to 5 was assigned according to the interval (in ascending order) | |
| Tourist star-rated hotel density | After kernel density analysis, the natural breakpoint method was employed for data reclassification into five categories, and scores from 1 to 5 were assigned according to the interval (in ascending order) | |||
| Public service facility level | Gas station density | After kernel density analysis, the natural breakpoint method was used for data reclassification into five categories, and scores from 1 to 5 were assigned according to the interval (in ascending order) | ||
| Highway service area density | After kernel density analysis, the natural breakpoint method was used for data reclassification into five categories, and scores from 1 to 5 were assigned according to the interval (in ascending order) | |||
| Economic level | GDP per capita | After interpolation in kriging space, the natural breakpoint method was used to reclassify the data into five classes, and scores from 1 to 5 were assigned according to the interval (in ascending order) | ||
| Tourism economic contribution | Tourism economic contribution = tourism income/total regional income; calculation results were obtained using kriging spatial interpolation, the natural breakpoint method was used for data reclassification into five levels, and scores from 1 to 5 were assigned according to the interval (in ascending order) |
Table 4.
Consistency test results.
| Indicator | Wi | λmax | CI | RI | CR |
|---|---|---|---|---|---|
| Xinjiang self-driving camps supply suitability | 0.6667 | 2.0000 | 0.0000 | 0 | 0.0000 |
| Xinjiang self-driving camps demand suitability | 0.3333 | ||||
| Status of tourism resources | 0.2448 | 6.2561 | 0.0512 | 1.26 | 0.0406 |
| Terrain and landforms | 0.0694 | ||||
| Climate suitability | 0.0660 | ||||
| Water conditions | 0.1441 | ||||
| Traffic location | 0.2718 | ||||
| Safety suitability | 0.2038 | ||||
| Social development level | 0.4126 | 3.0536 | 0.0268 | 0.52 | 0.0516 |
| Public service facility level | 0.3275 | ||||
| Economic level | 0.2599 | ||||
| Density of tourist attractions | 0.7500 | 2.0000 | 0.0000 | 0 | 0.0000 |
| Density of national rural tourism key villages and towns | 0.2500 | ||||
| Elevation | 0.4126 | 3.0536 | 0.0268 | 0.52 | 0.0516 |
| Slope | 0.2599 | ||||
| Vegetation cover | 0.3275 | ||||
| Temperature and humidity index | 0.3874 | 3.0183 | 0.0091 | 0.52 | 0.0176 |
| Wind chill index | 0.1692 | ||||
| Air quality index | 0.4434 | ||||
| Water proximity | 0.7500 | 2.0000 | 0.0000 | 0 | 0.0000 |
| Water supply per capita | 0.2500 | ||||
| Road density | 0.2402 | 3.0183 | 0.0091 | 0.52 | 0.0176 |
| Camp to scenic spot accessibility | 0.5499 | ||||
| Camp to dependent town center accessibility | 0.2098 | ||||
| Geological hazard risk | 0.6667 | 2.0000 | 0.0000 | 0 | 0.0000 |
| Number of geological disasters | 0.3333 | ||||
| Population density | 0.5000 | 2.0000 | 0.0000 | 0 | 0.0000 |
| Tourist star-rated hotel density | 0.5000 | ||||
| Gas station density | 0.6667 | 2.0000 | 0.0000 | 0 | 0.0000 |
| Highway service area density | 0.3333 | ||||
| GDP per capita | 0.5000 | 2.0000 | 0.0000 | 0 | 0.0000 |
| Tourism economic contribution | 0.5000 |
Table 5.
Weights of the location suitability evaluation index system for self-driving camps in Xinjiang.
Table 5.
Weights of the location suitability evaluation index system for self-driving camps in Xinjiang.
| Target Layer | Guideline Layer | Factor Layer | Indicator Layer | AHP | Entropy Value Method | Combined Weights |
|---|---|---|---|---|---|---|
| Location suitability evaluation index system for self-driving camps in Xinjiang | Xinjiang self-driving camps supply suitability | Current status of tourism resources | Density of tourist attractions | 0.1224 | 0.0878 | 0.1868 |
| National rural tourism key villages and towns density | 0.0408 | 0.0856 | 0.0607 | |||
| Terrain and landforms | Elevation | 0.0191 | 0.0230 | 0.0076 | ||
| Slope | 0.0120 | 0.0076 | 0.0016 | |||
| Vegetation cover | 0.0152 | 0.0161 | 0.0043 | |||
| Climate suitability | Temperature and humidity index | 0.0171 | 0.0060 | 0.0019 | ||
| Wind chill index | 0.0074 | 0.0170 | 0.0022 | |||
| Air quality index | 0.0195 | 0.0040 | 0.0014 | |||
| Water conditions | Water proximity | 0.0721 | 0.0119 | 0.0149 | ||
| Water supply per capita | 0.0240 | 0.0334 | 0.0139 | |||
| Traffic location | Road density | 0.0435 | 0.1390 | 0.1051 | ||
| Camp to scenic spot accessibility | 0.0997 | 0.0179 | 0.0310 | |||
| Camp to dependent town center accessibility | 0.0380 | 0.0190 | 0.0125 | |||
| Safety suitability | Geological hazard potential risk | 0.0906 | 0.0067 | 0.0105 | ||
| Number of geological disasters | 0.0453 | 0.0077 | 0.0060 | |||
| Xinjiang self-driving camps demand suitability | Social development level | Population density | 0.0688 | 0.1220 | 0.1459 | |
| Tourist star-rated hotel density | 0.0688 | 0.1051 | 0.1257 | |||
| Public service facility level | Gas station density | 0.0728 | 0.1158 | 0.1465 | ||
| Highway service area density | 0.0364 | 0.0794 | 0.0502 | |||
| Economic level | GDP per capita | 0.0433 | 0.0515 | 0.0388 | ||
| Tourism economic contribution | 0.0433 | 0.0433 | 0.0326 |
Disclaimer/Publisher’s Note: The statements, opinions and data contained in all publications are solely those of the individual author(s) and contributor(s) and not of MDPI and/or the editor(s). MDPI and/or the editor(s) disclaim responsibility for any injury to people or property resulting from any ideas, methods, instructions or products referred to in the content. |
© 2023 by the authors. Licensee MDPI, Basel, Switzerland. This article is an open access article distributed under the terms and conditions of the Creative Commons Attribution (CC BY) license (https://creativecommons.org/licenses/by/4.0/).
Share and Cite
MDPI and ACS Style
Li, C.; Guo, C. Location Suitability Evaluation and Spatial Optimization of Self-Driving Camps in Xinjiang. Sustainability 2023, 15, 10820. https://doi.org/10.3390/su151410820
AMA Style
Li C, Guo C. Location Suitability Evaluation and Spatial Optimization of Self-Driving Camps in Xinjiang. Sustainability. 2023; 15(14):10820. https://doi.org/10.3390/su151410820
Chicago/Turabian StyleLi, Cai, and Chengjie Guo. 2023. "Location Suitability Evaluation and Spatial Optimization of Self-Driving Camps in Xinjiang" Sustainability 15, no. 14: 10820. https://doi.org/10.3390/su151410820
Note that from the first issue of 2016, this journal uses article numbers instead of page numbers. See further details here.