

Building Information Modeling and Building Performance Simulation-Based Decision Support Systems for Improved Built Heritage Operation

Abstract
:1. Introduction
Paper Scope and Structure
2. Background
2.1. Large Public Building Stock Management
2.2. Gaps and Challenges in Building Management
2.3. Digital Transition for the Built Environment
2.4. Energy-Related Operational Issues in University Campuses
3. Materials and Methods
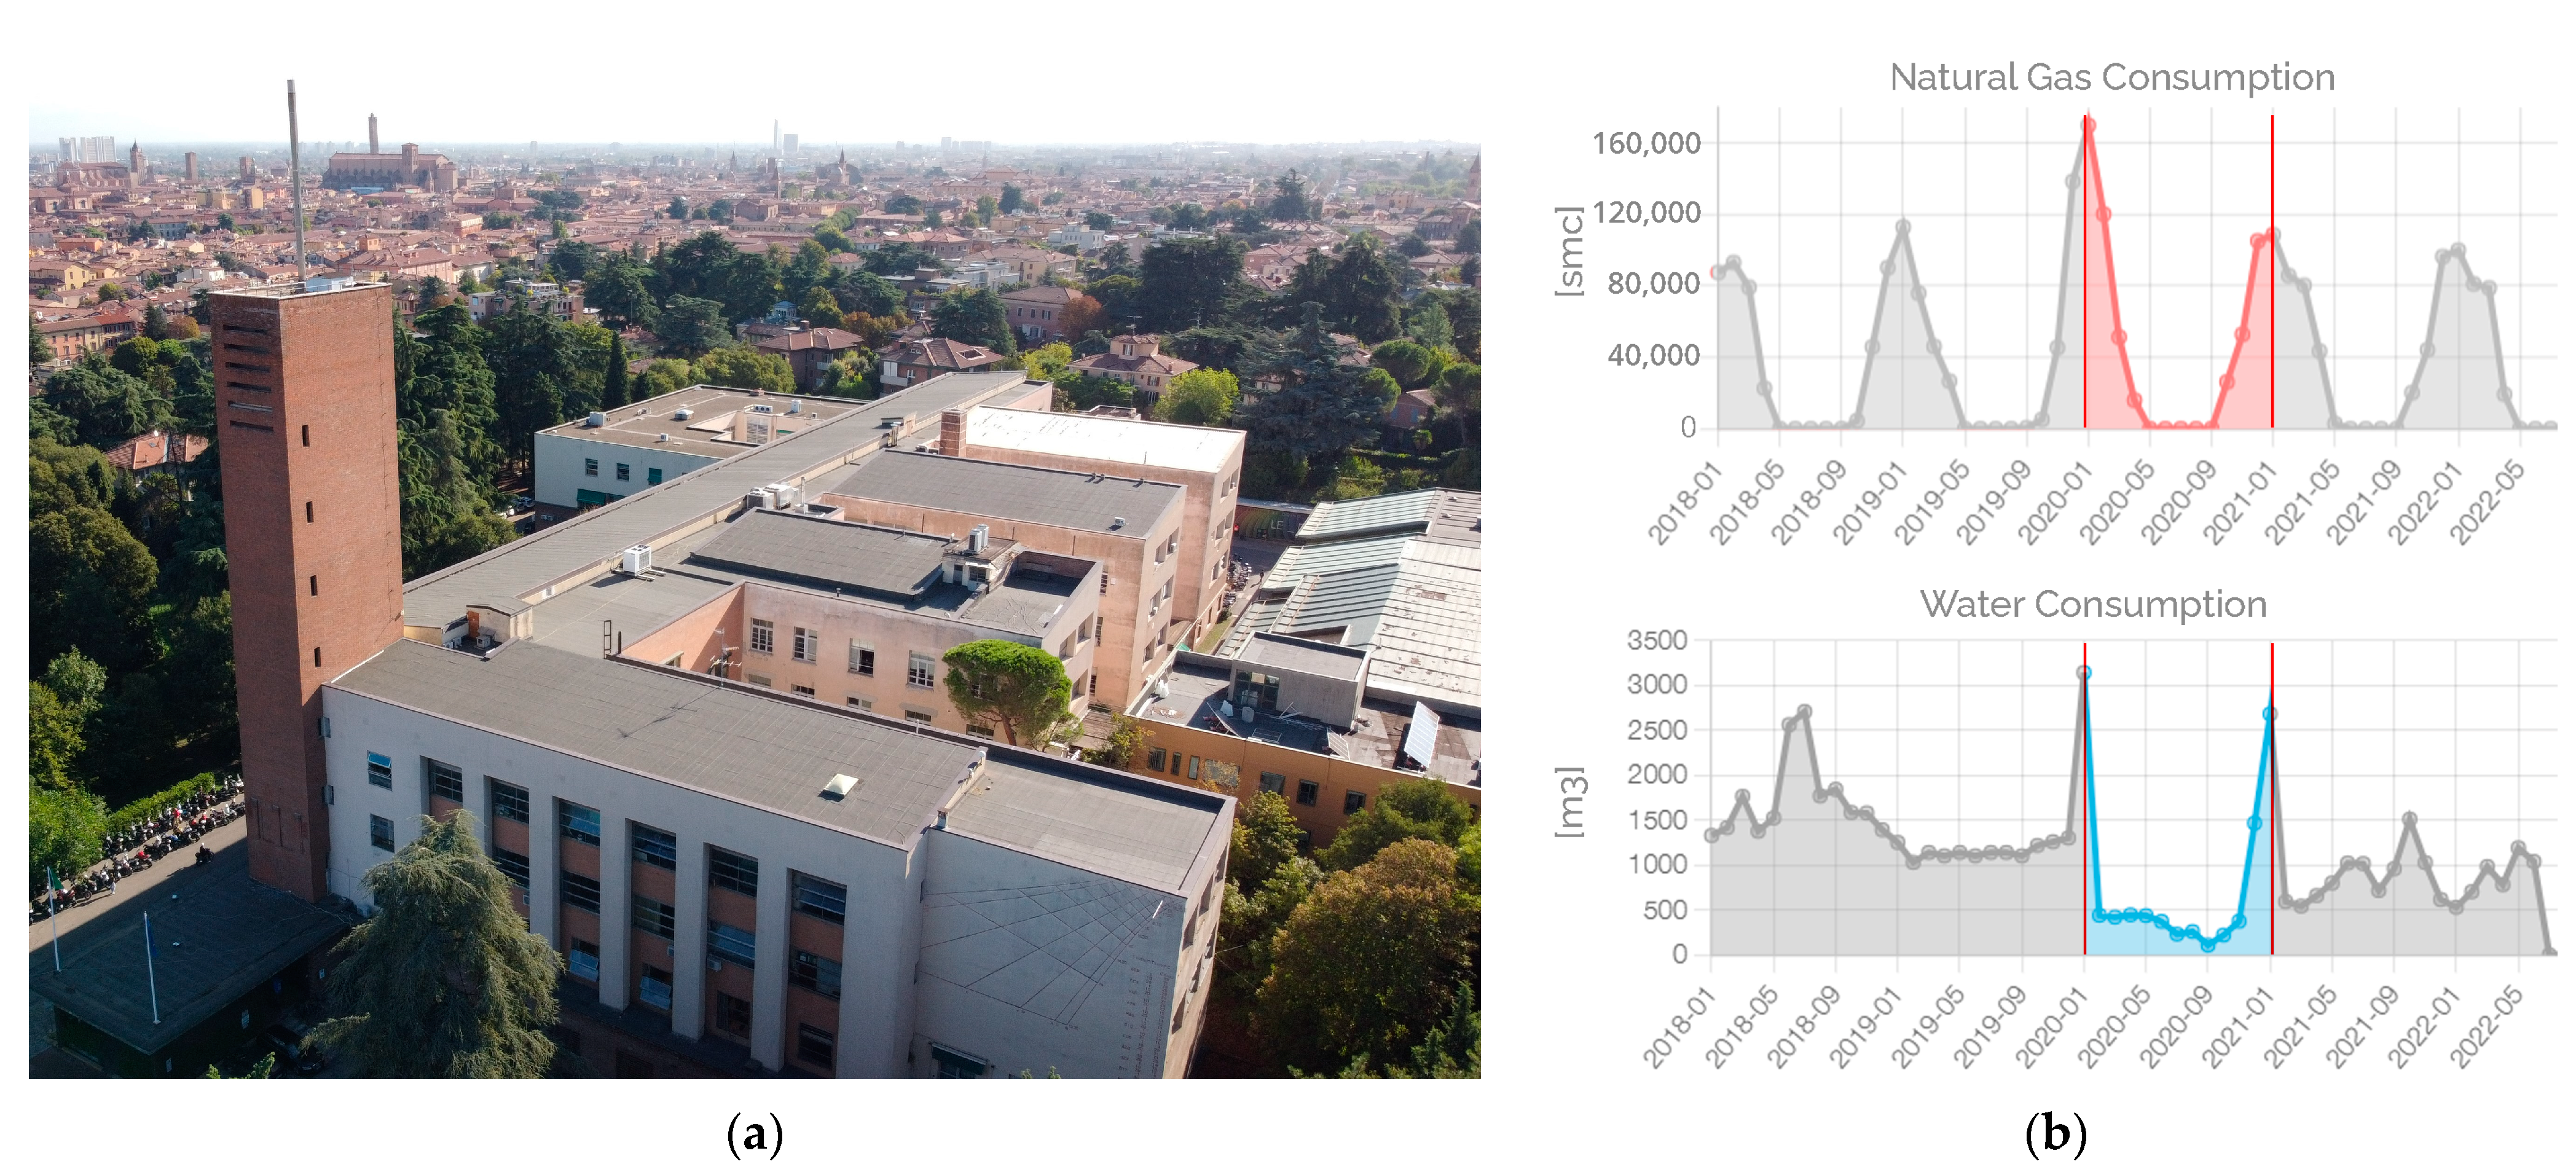
3.1. Case Study
3.2. Decision Support System Conceptualization
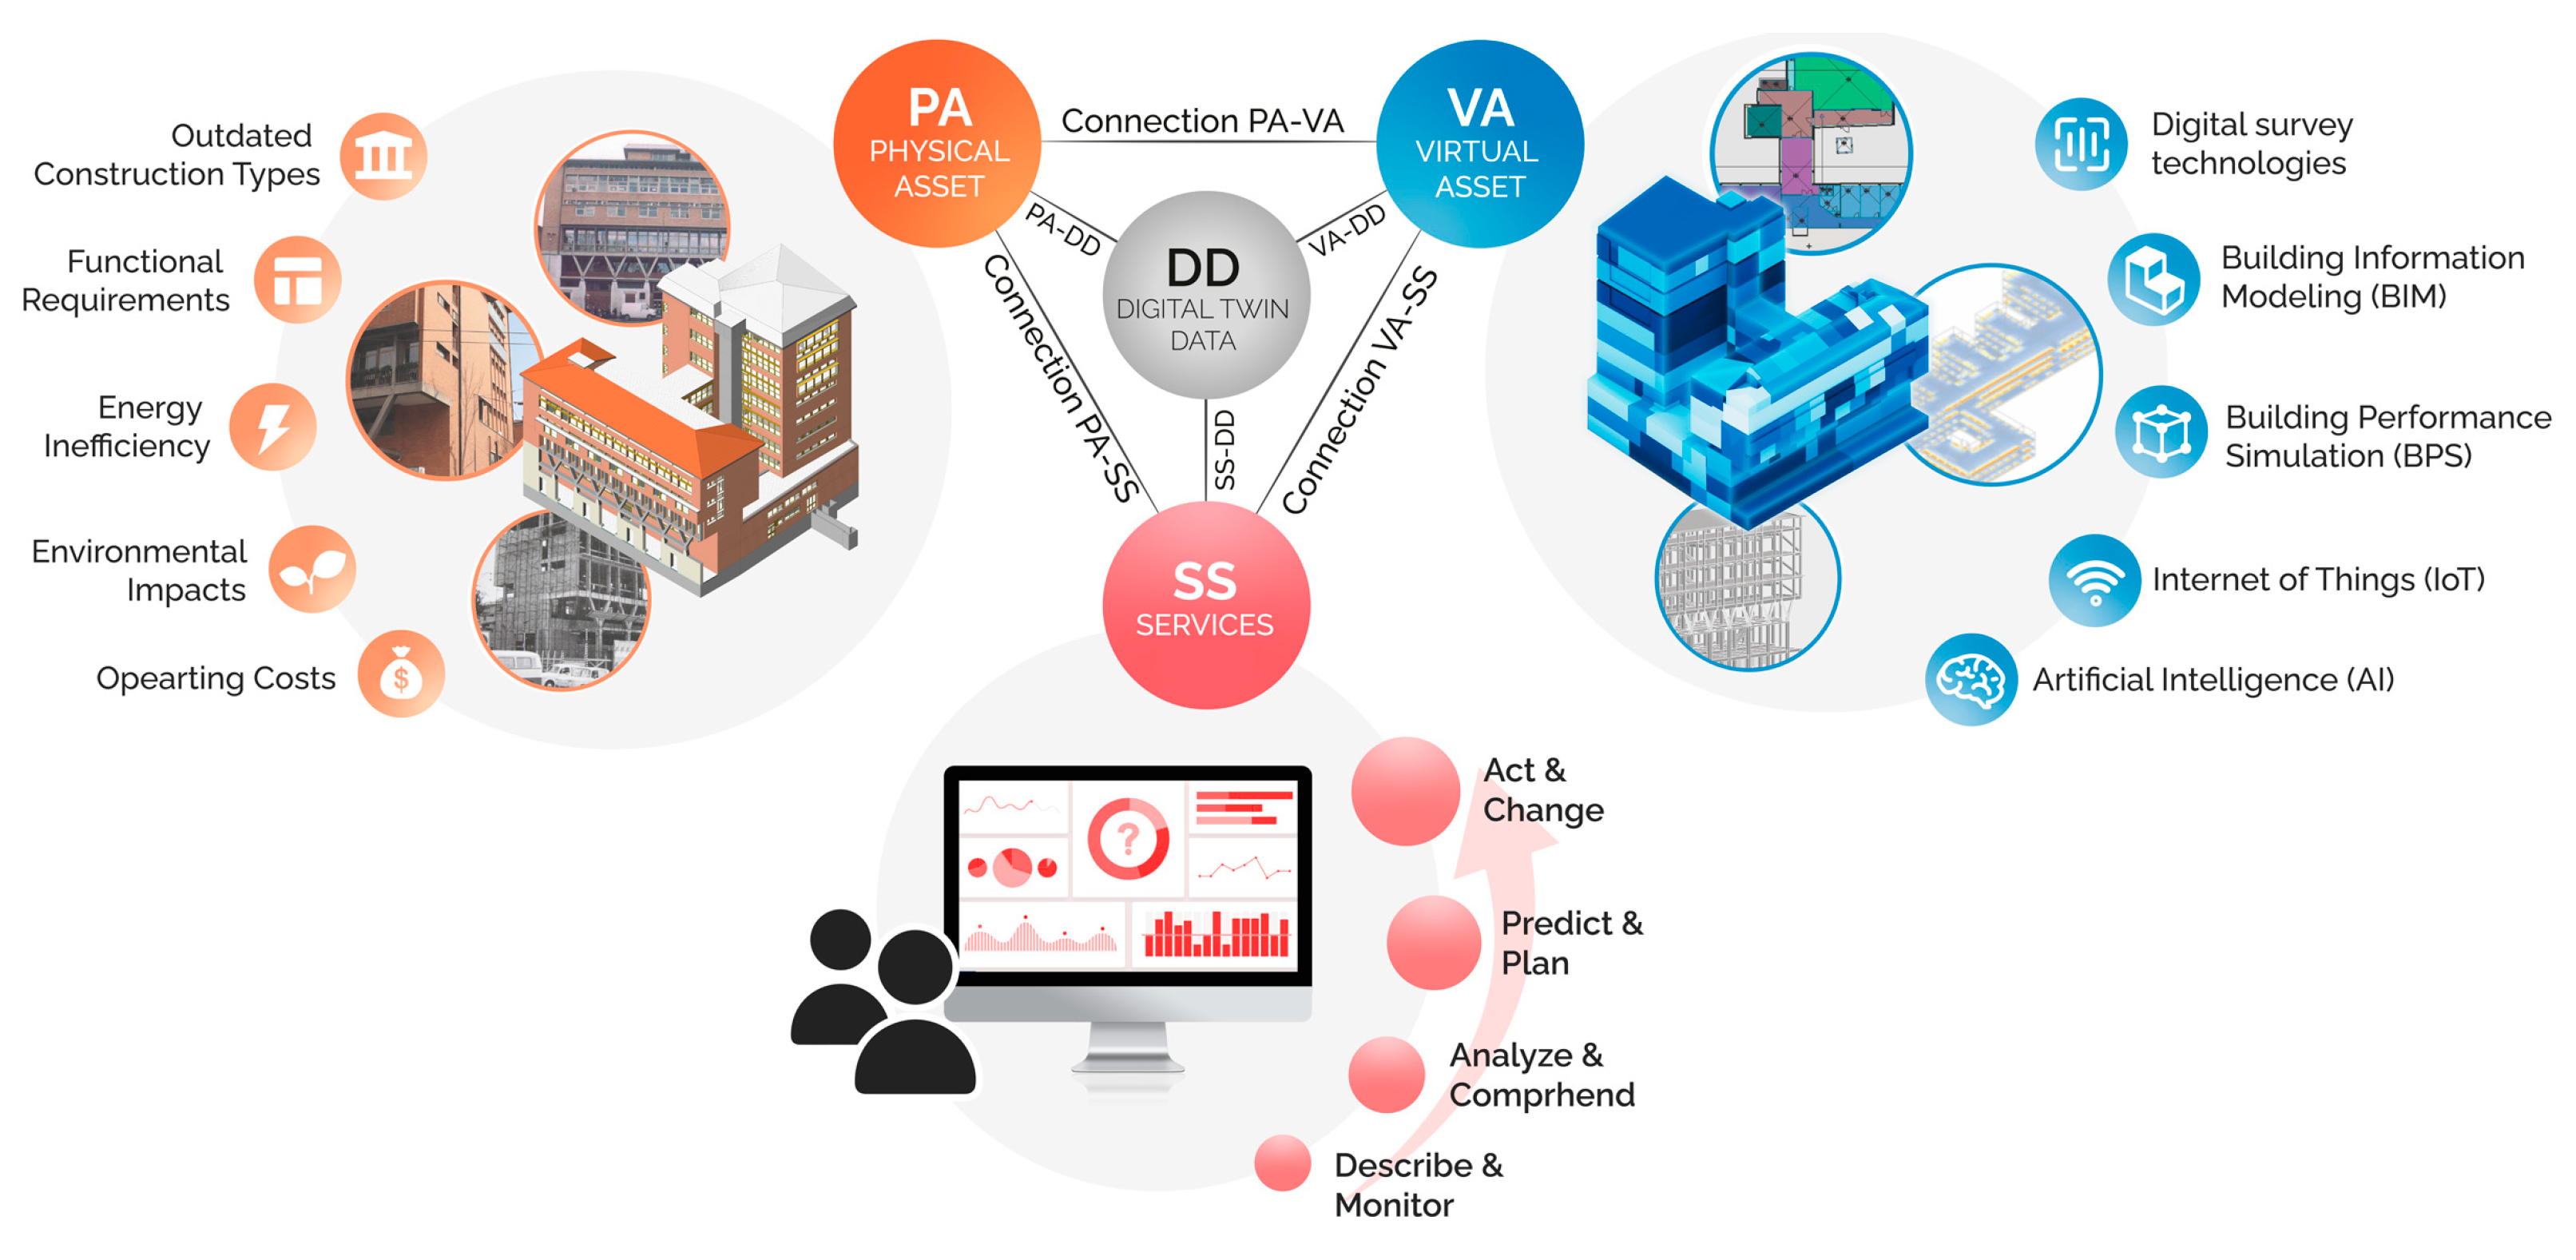
3.2.1. Digital Twin Model
- Physical asset, the asset entity in the physical space;
- Virtual asset, the asset entity in the virtual space;
- Connections, the data and information connections (or flows) that bind the physical and virtual entities;
- DT data, which consists of the fusion and integration of all data related to the physical and virtual entities and their elaboration into more accurate and complete information;
- Services, facilitate the visualization and use of the information collected or processed by the DT, which is standardized and “encapsulated” according to the needs of different actors and functions [69].
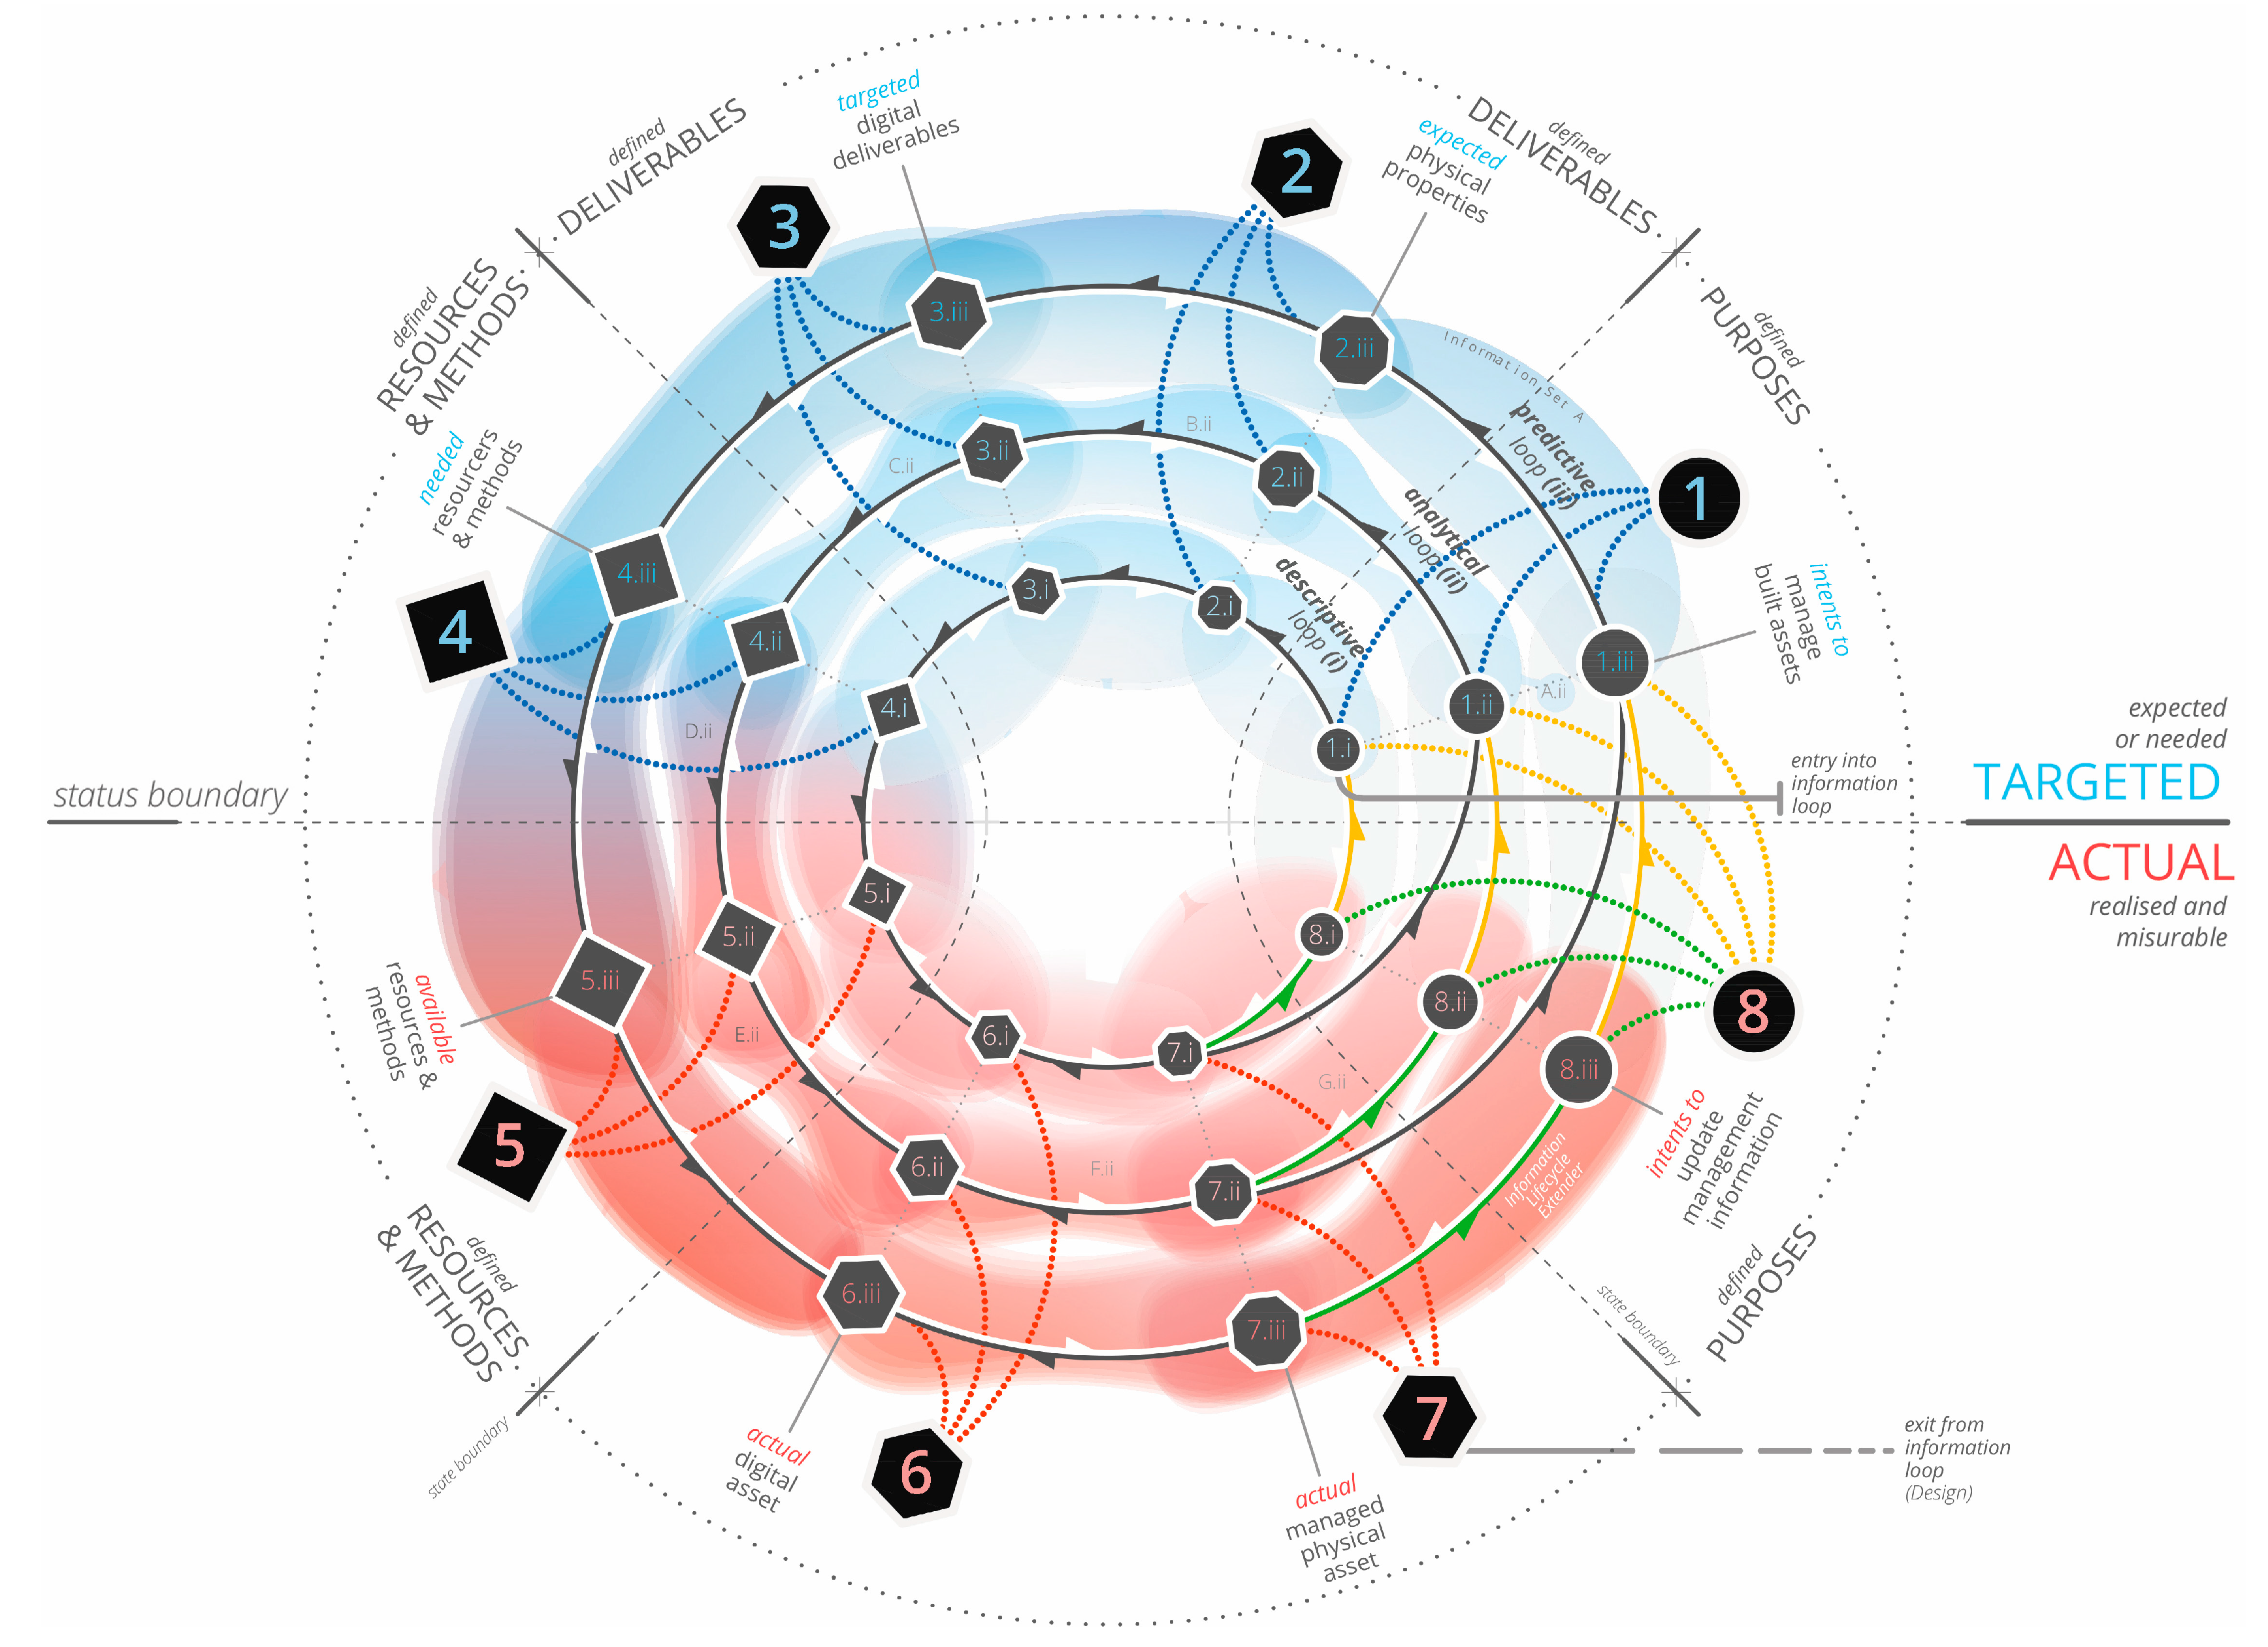
3.2.2. Information Management Framework
- Information statuses describe information while continuously exchanging, processing, and transforming during its lifecycle from a programmatic state (targeted state) to an applicative state (actual state).
- Information states capture the information transformation and describe it from being a simple purpose to a digital deliverable and a resource.
- Information loops identify the maturity of information through four consequential levels describing the capability of the DT system. These include a Descriptive Loop (i), a BIM-based level to document and describe information related to the current state of the physical asset; an Analytical loop (ii), a BPS-based level to analyze and process information related to the current or future state of the physical asset by using deterministic models; a Predictive loop (iii): an IoT-based level to analyze and process information related to the current or future state of the physical asset through data monitoring or predictive models (ML) based on sensor data coming from the physical asset; a Proactive loop, to integrate all the information acquired or processed in the previous levels within a centralized data environment and allow filtered visualization and interaction of information through DT Services to benchmark the building operational issues or predict new ones.
- Information milestones represent, for each loop, the steps that information traverses throughout its lifecycle.
- Information flows refer to the movement of information between information milestones (forward flows for actions and reverse flow for checks) or within information milestones (inward flows for data acquisition and outward flows for data sharing).
- Information links refer to the migration of information throughout information loops, allowing interoperability between different models, documents, data, resources, methods, and actors involved in other information loops.
- Determining the intent to manage the physical asset (PA);
- Identifying the physical properties to collect from the PA as well as the properties to investigate through the DSS;
- Targeting the digital deliverables to produce for storing the collected data and create the DSS;
- Comprehending what the resources and methods needed to set up the DSS are;
- Setting up an actual method and using the available resources to implement the DSS;
- Realizing the actual digital deliverables and integrating them into the digital asset (DA);
- Letting asset managers adopt and use the DA;
- Thinking about possible improvements or new uses of the DA.
3.3. Implementation
3.3.1. Purposes
3.3.2. Deliverables
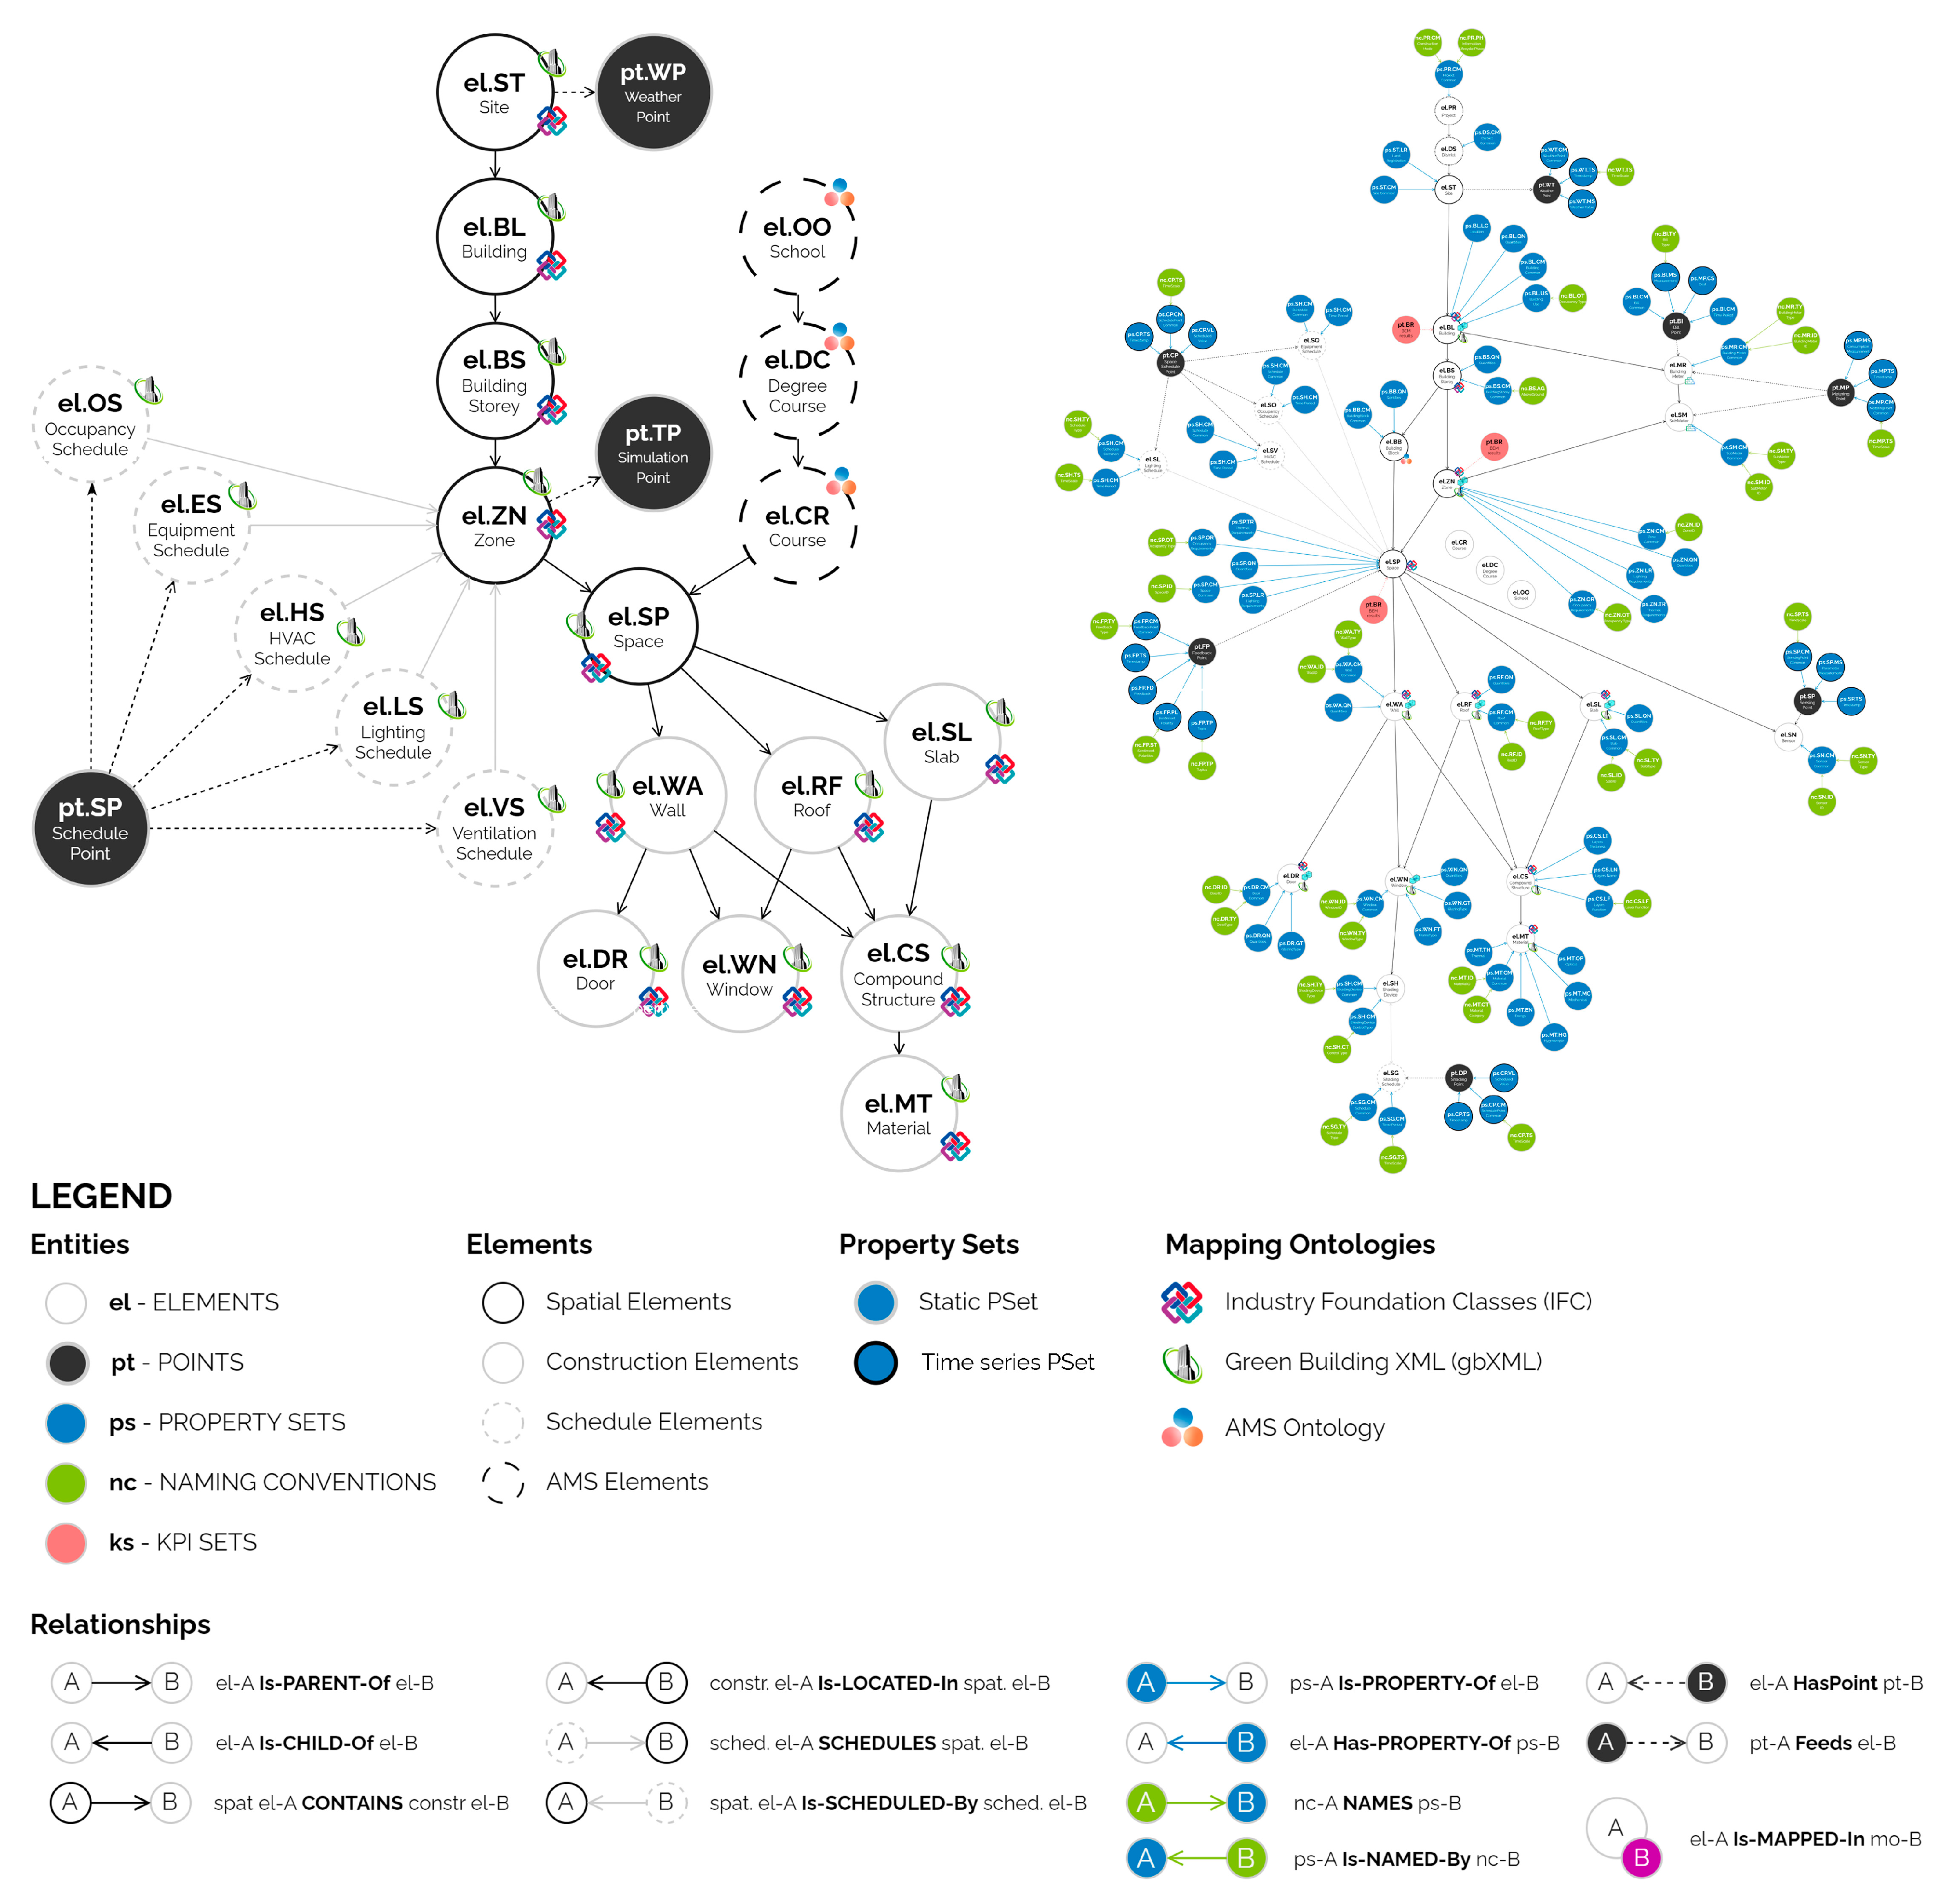
Information Requirements
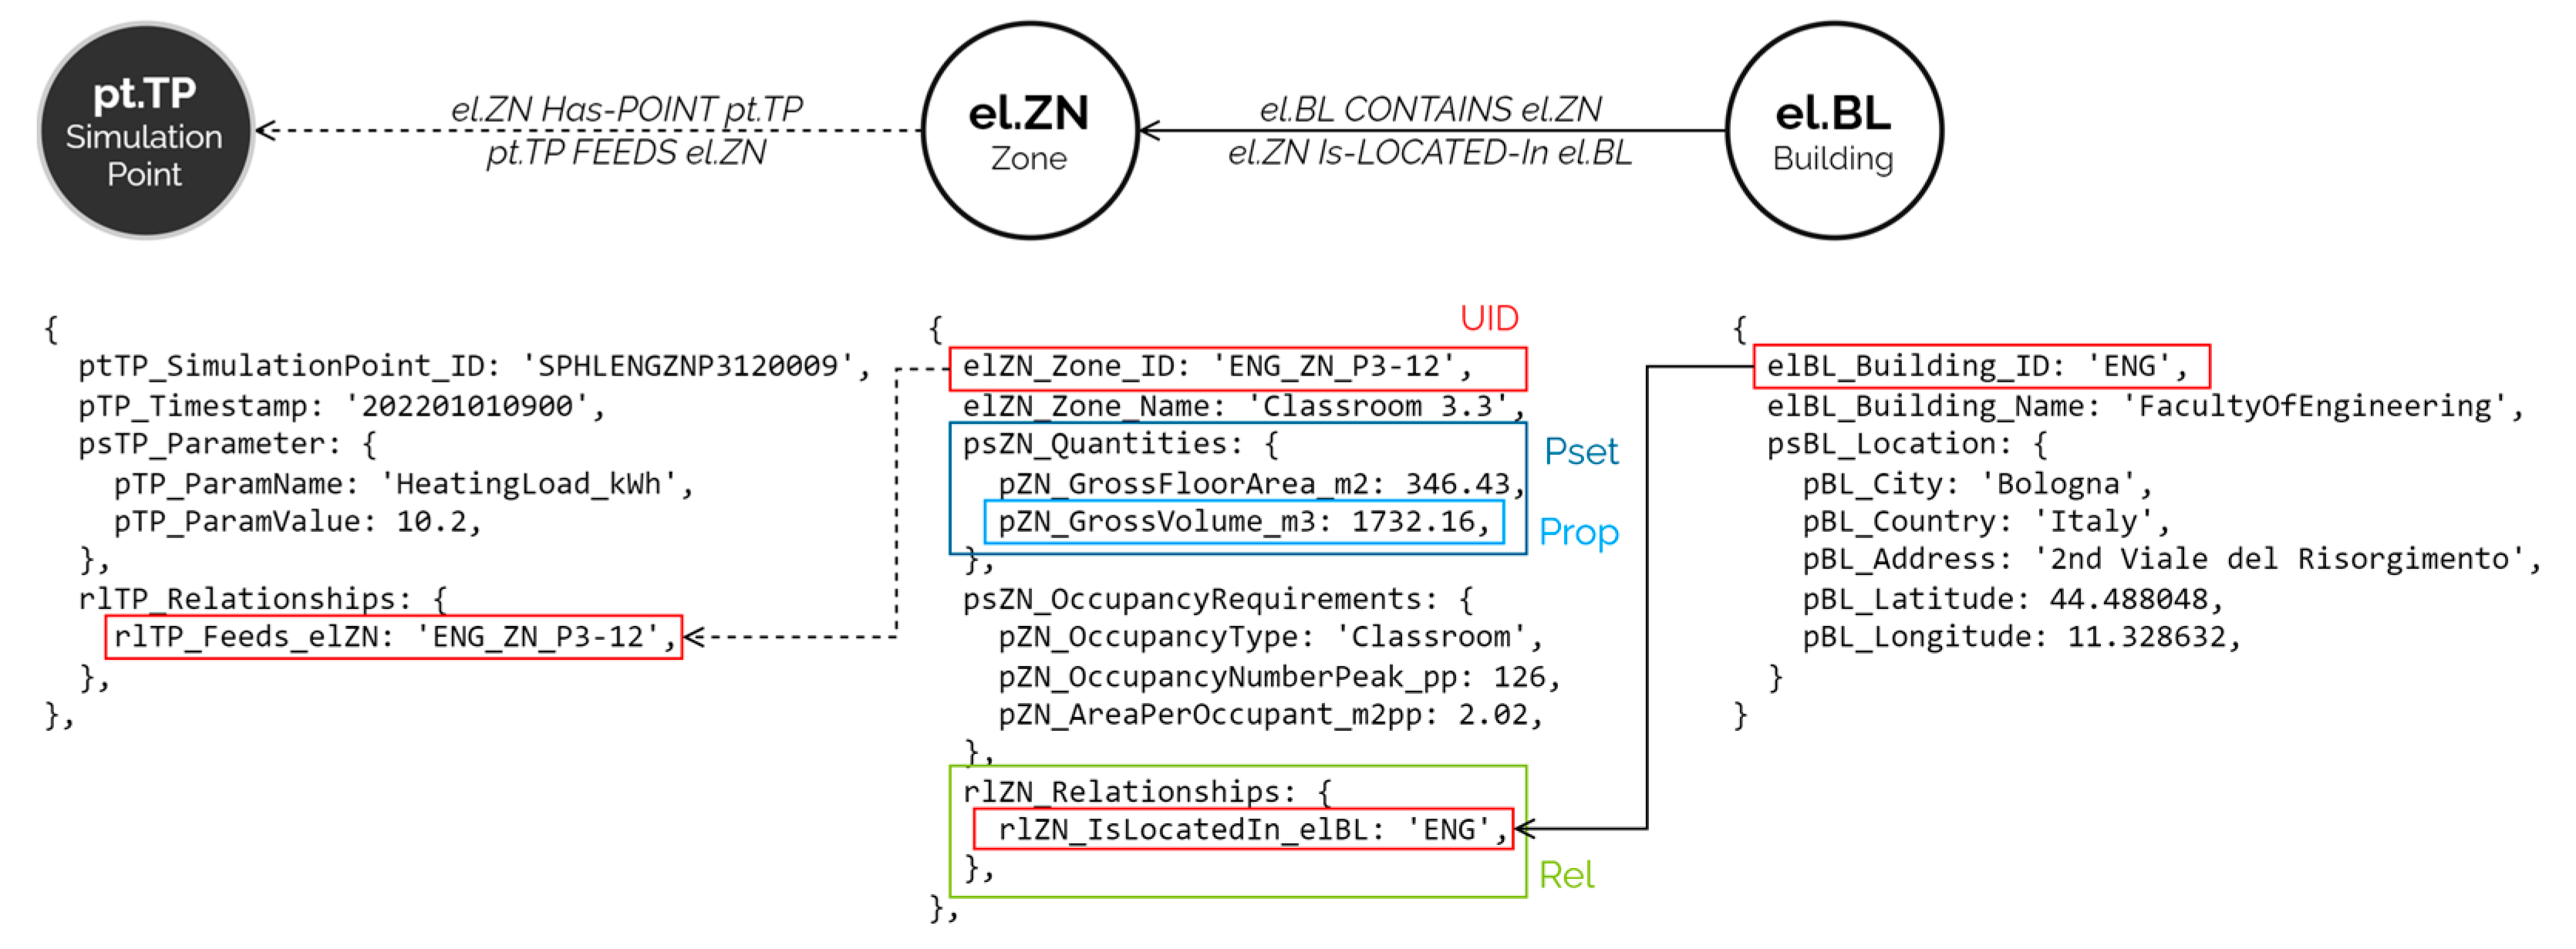
- Elements (el), which represent the spatial (buildings, storeys, zones, and spaces) and construction components of buildings (walls, floors, roofs, and openings);
- Property sets (ps), which assign properties to the elements grouped by theme and type;
- Naming conventions (nc), which standardize the language of different models;
- Points (pt) are discrete units of information about an observation at a given time, as in the Brick’s ontology [71];
- Key performance indicator sets (ks) are collections of metrics and measures that are used to evaluate the performance of building spatial elements.
Digital Models
3.3.3. Resources and Methods
Data Collection
Data Modeling
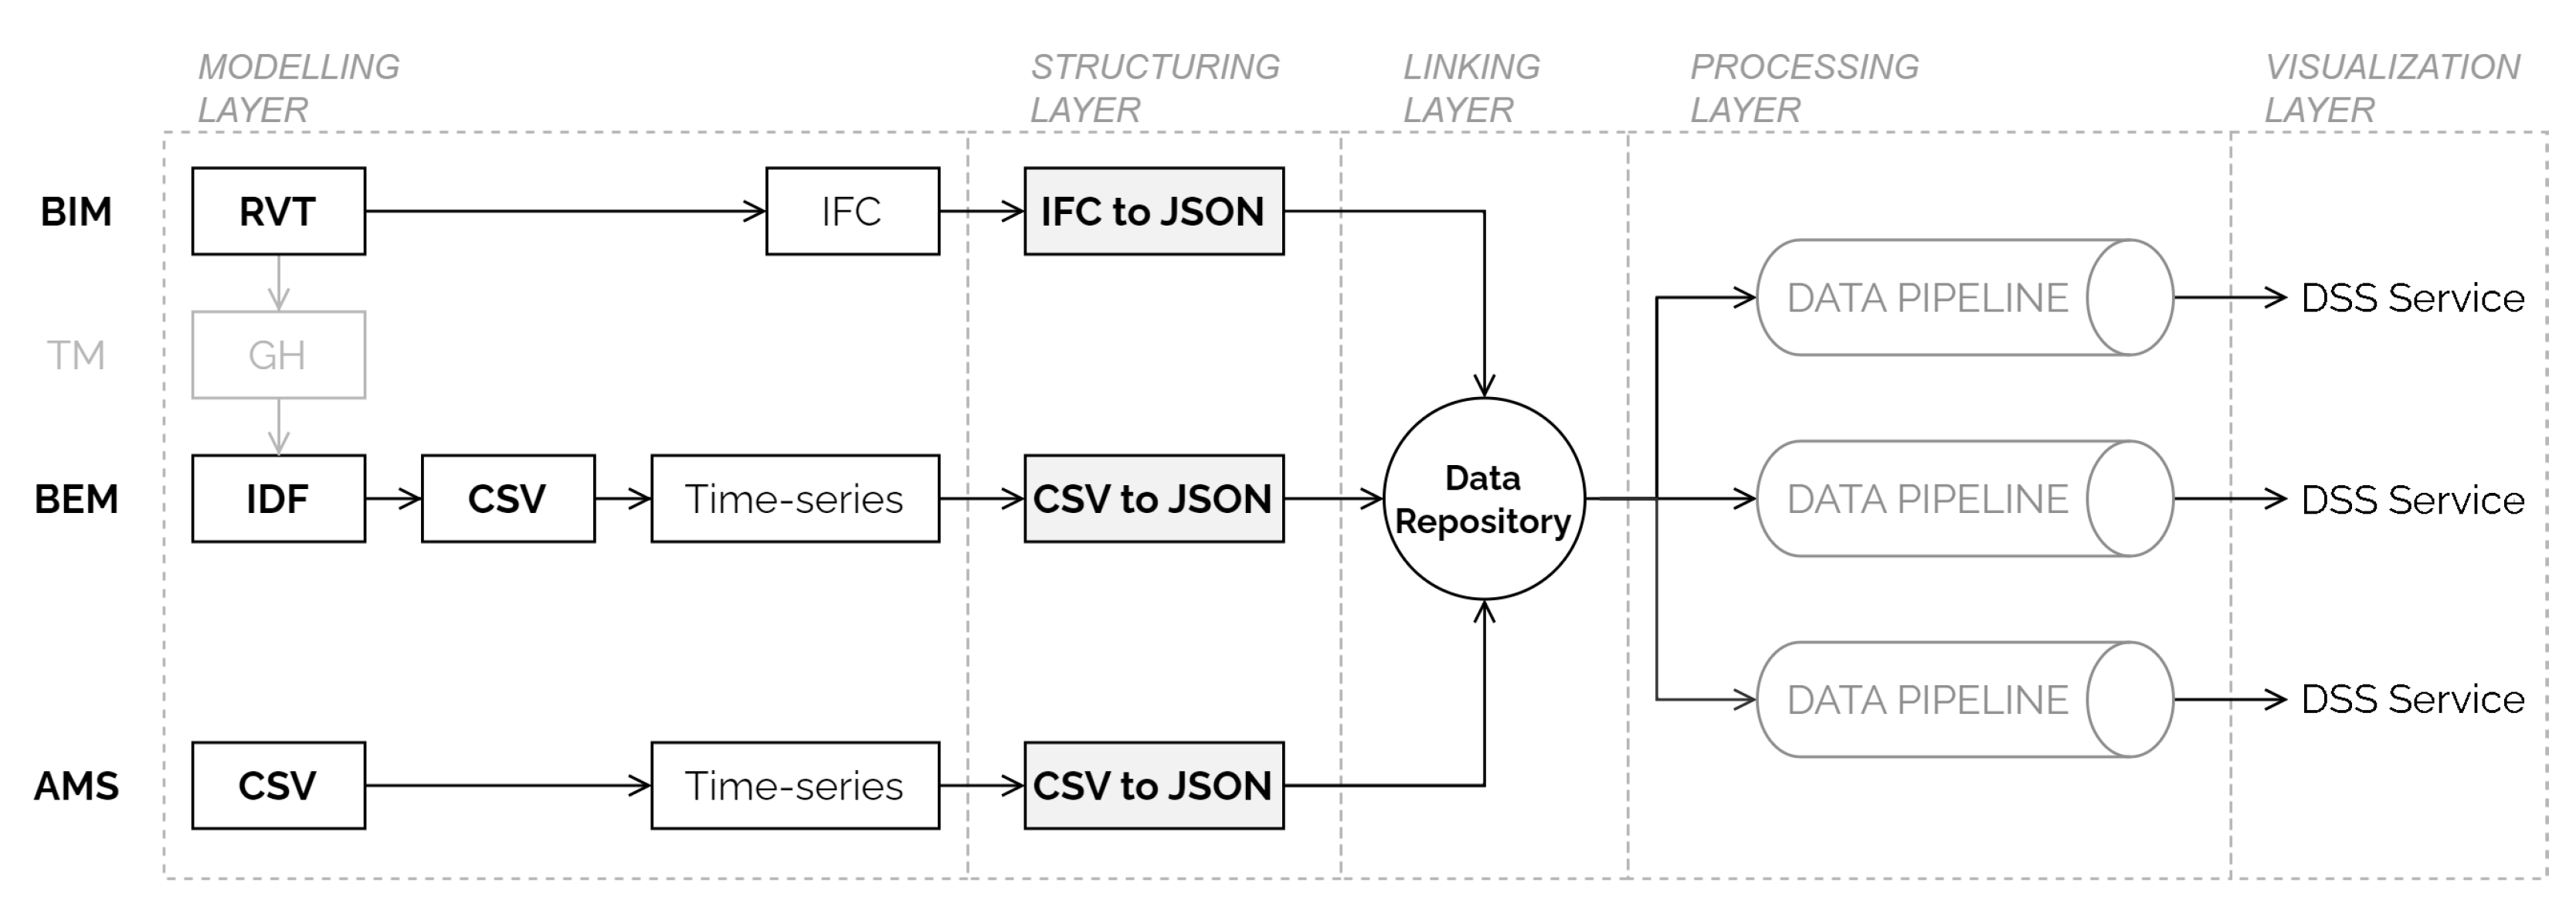
Data Linking, Processing, and Visualization
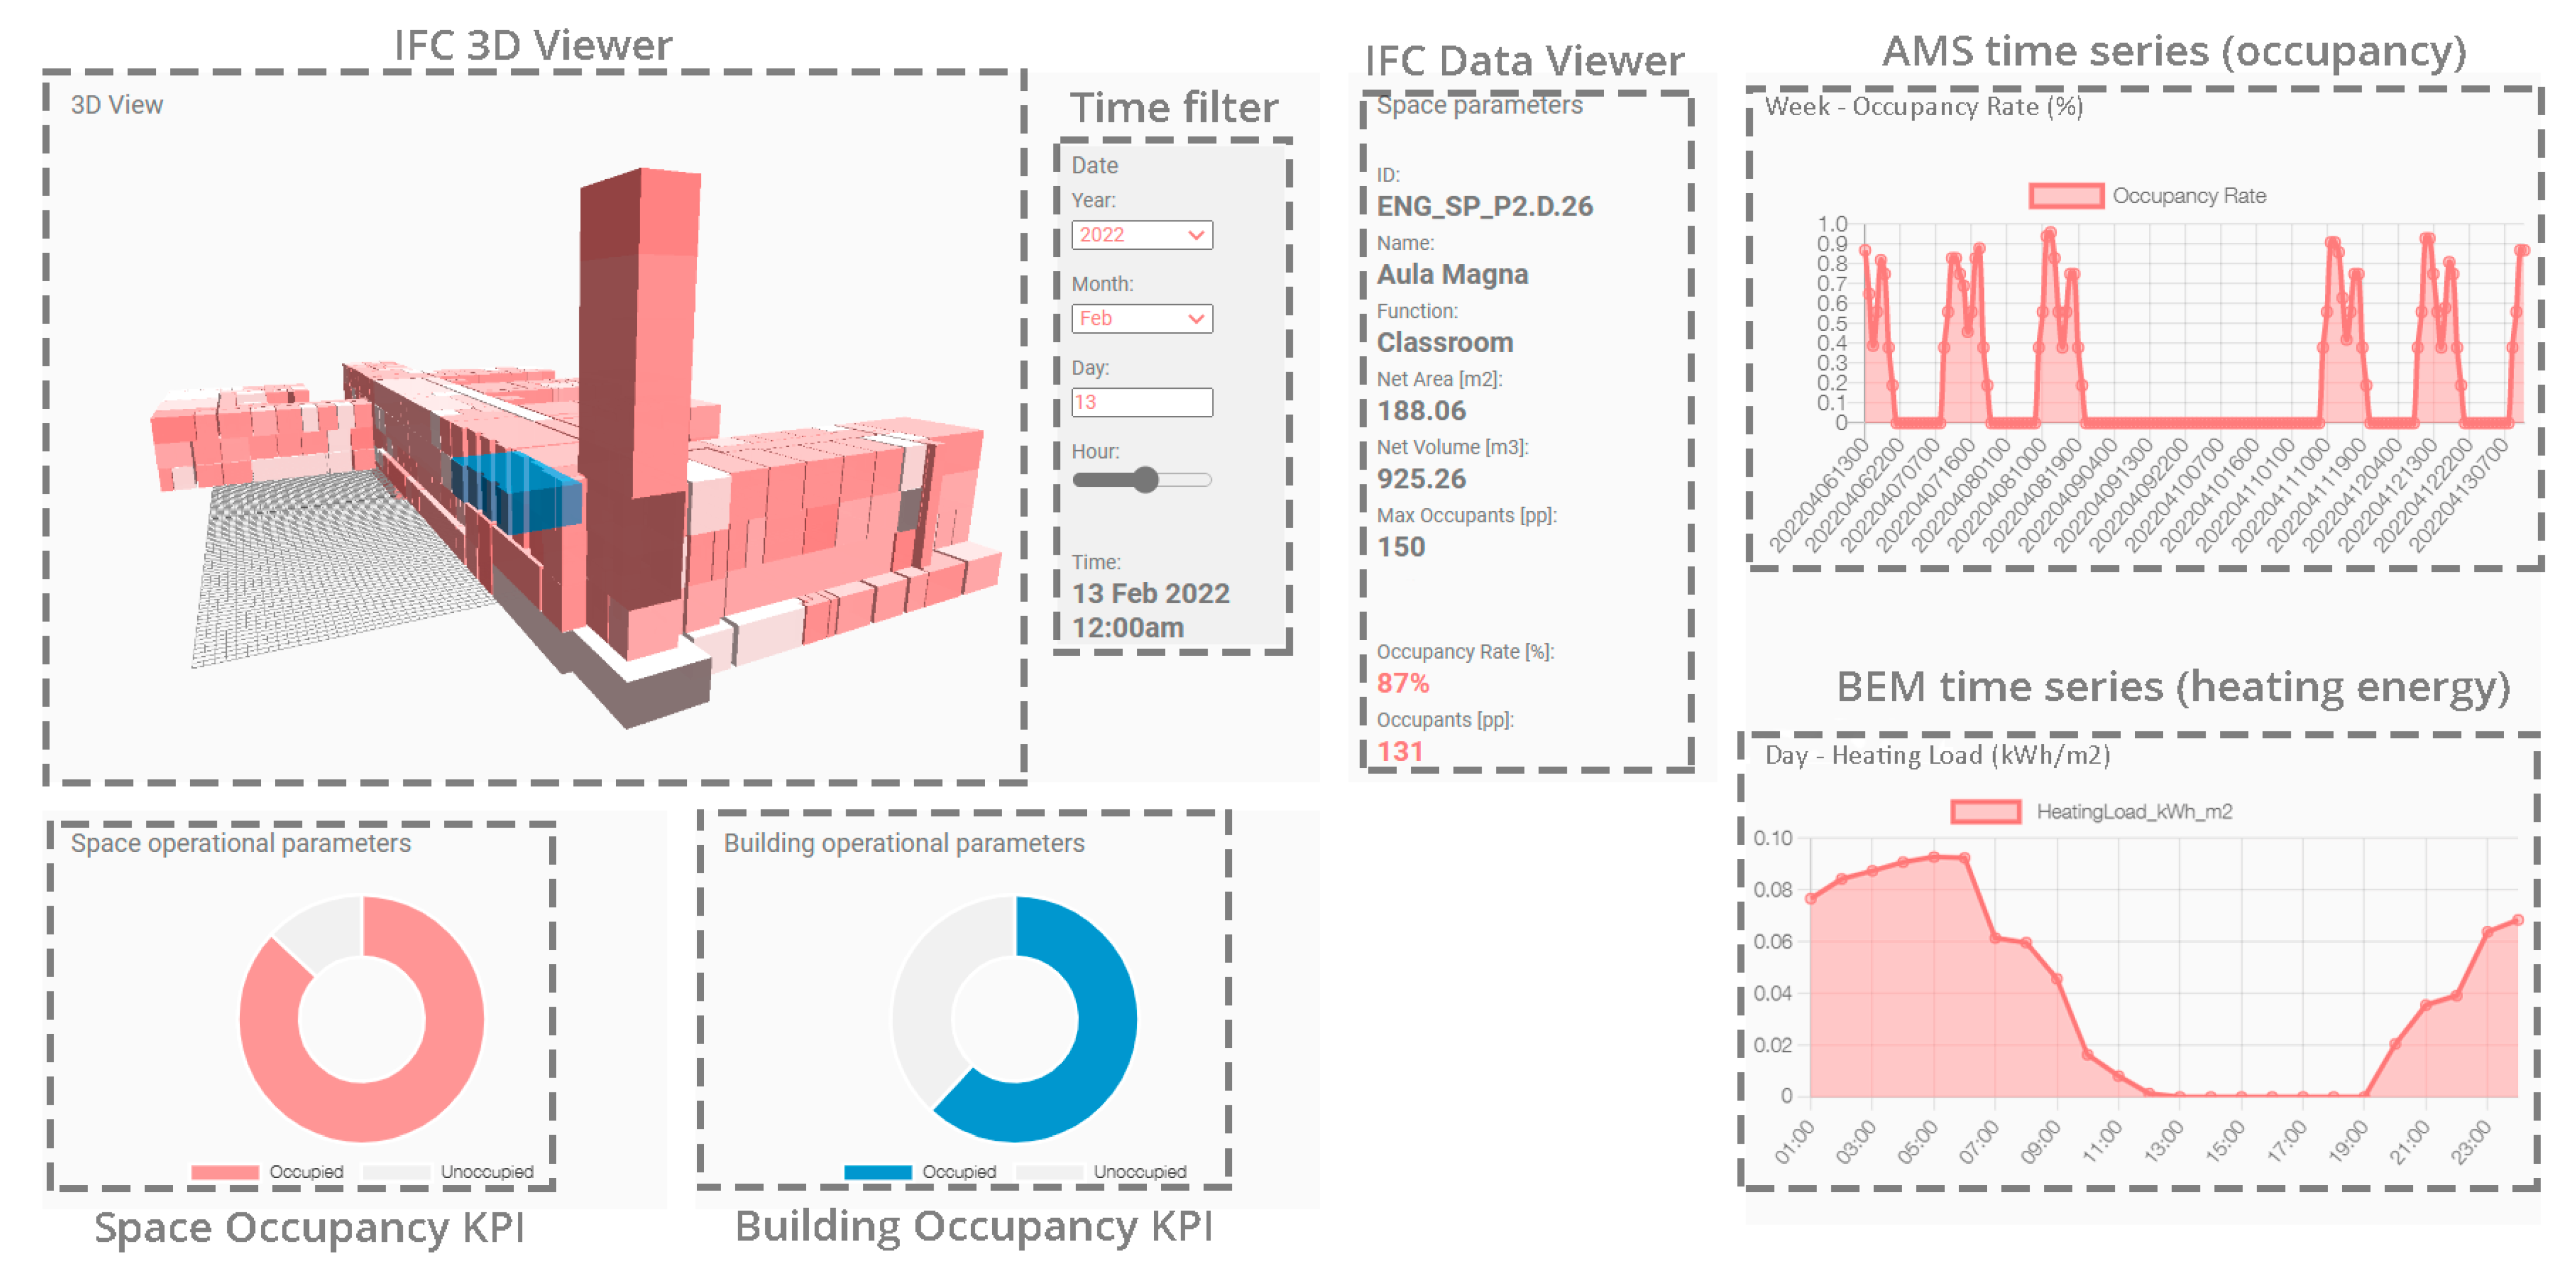
3.3.4. Service Interaction
4. Results
4.1. Energy Modeling Hypotheses
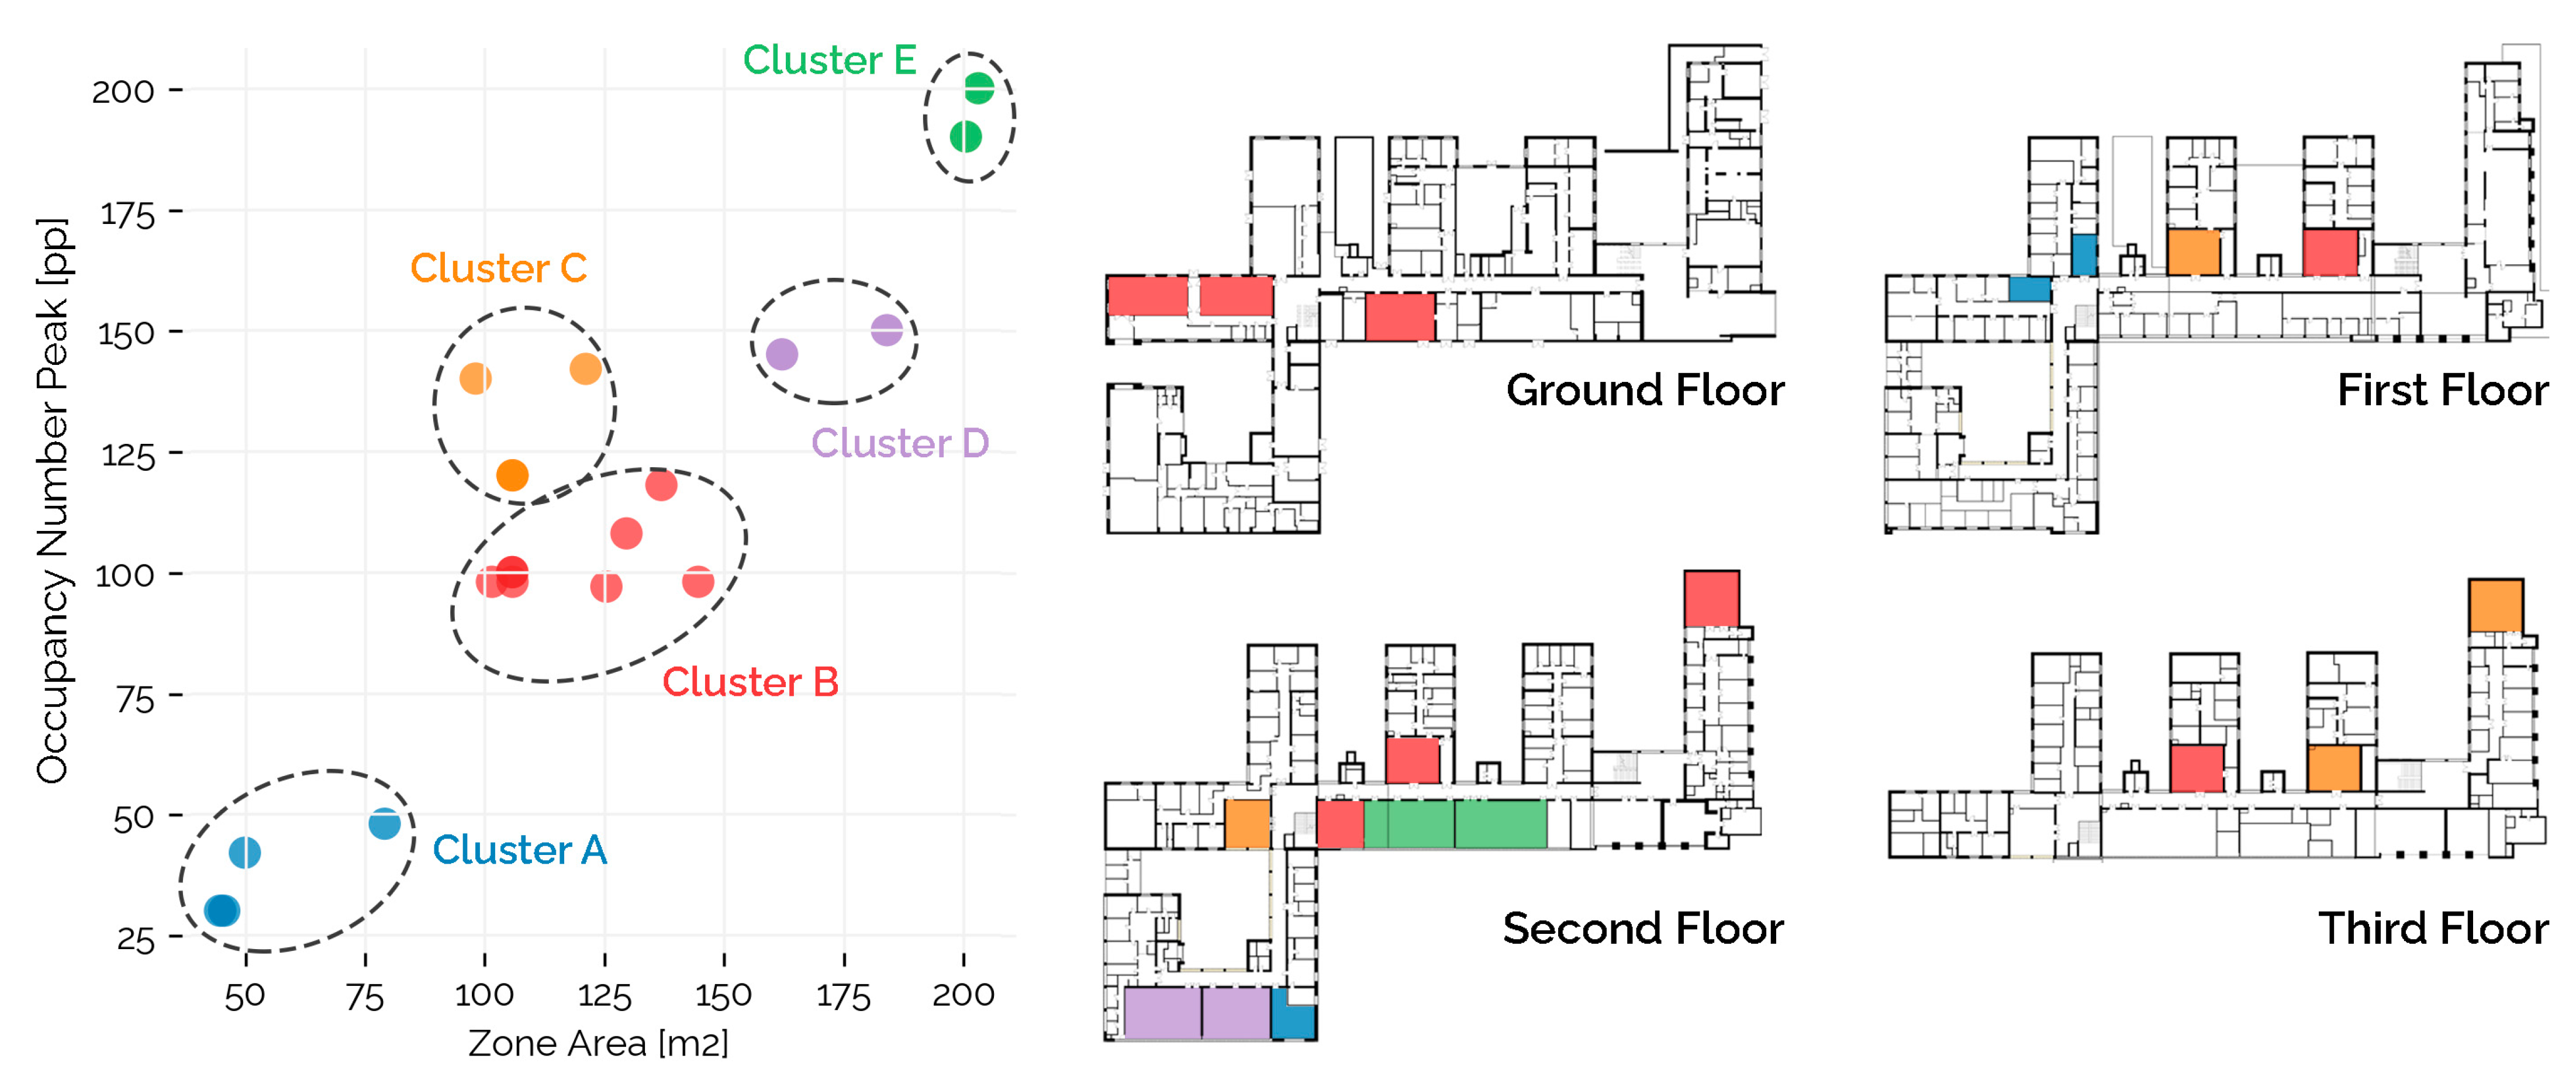
4.2. Zone Clustering
4.3. Energy Simulation Results
4.3.1. Energy Demand
- The total heating demand is estimated to be 3405.77 kWh;
- The electricity demand for lighting and equipment is estimated to be 321.36 kWh;
- The overall management costs are calculated to be EUR 183.9 for heating and EUR 51.11 for lighting and equipment;
- The total equivalent emissions for the day are estimated at 1668.83 kgCO2eq for heating and 76.56 kgCO2eq for lighting and equipment.
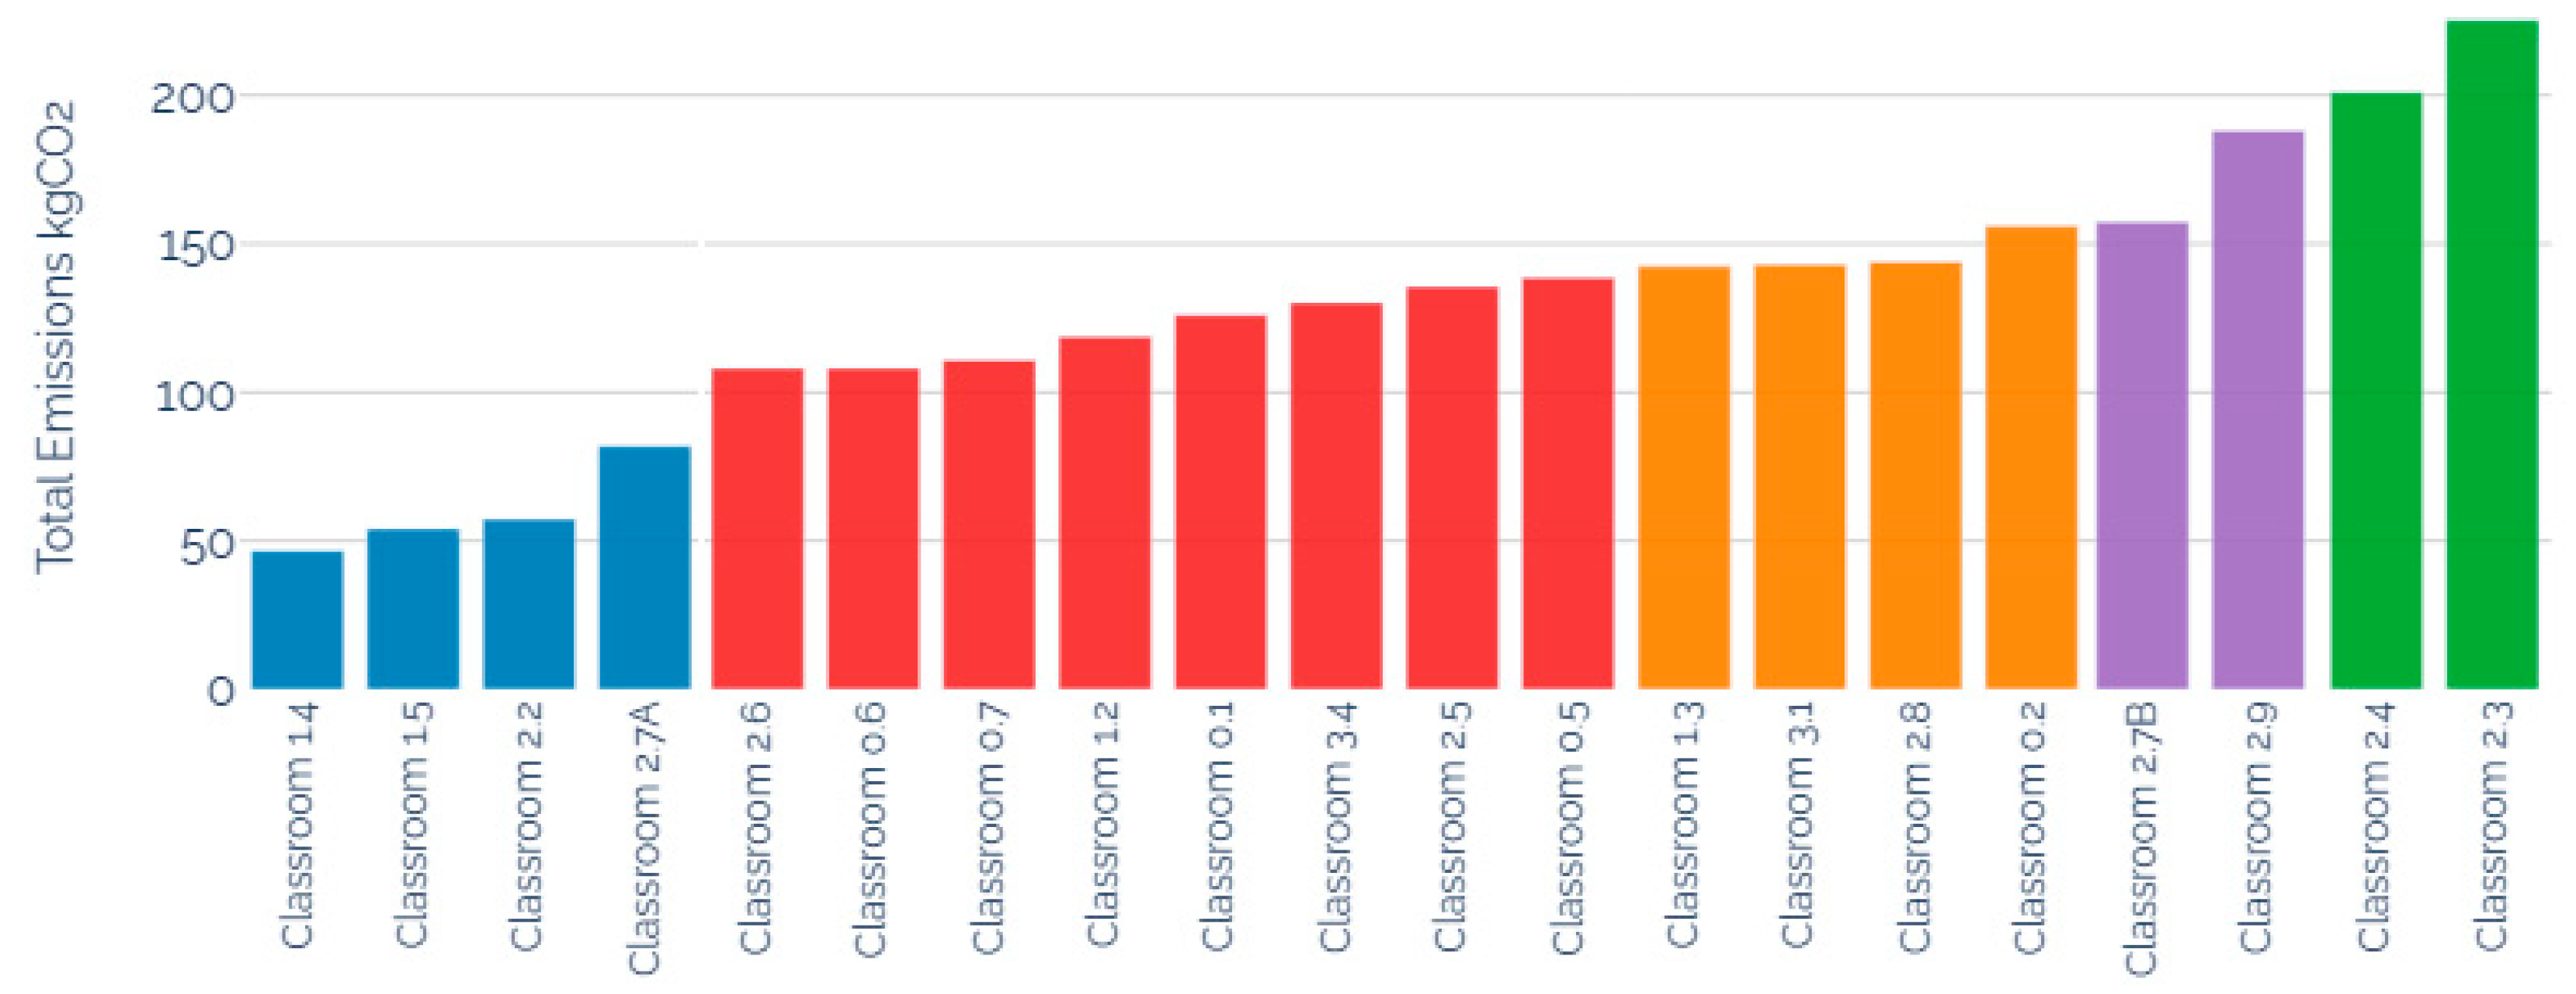
4.3.2. Space Ranking
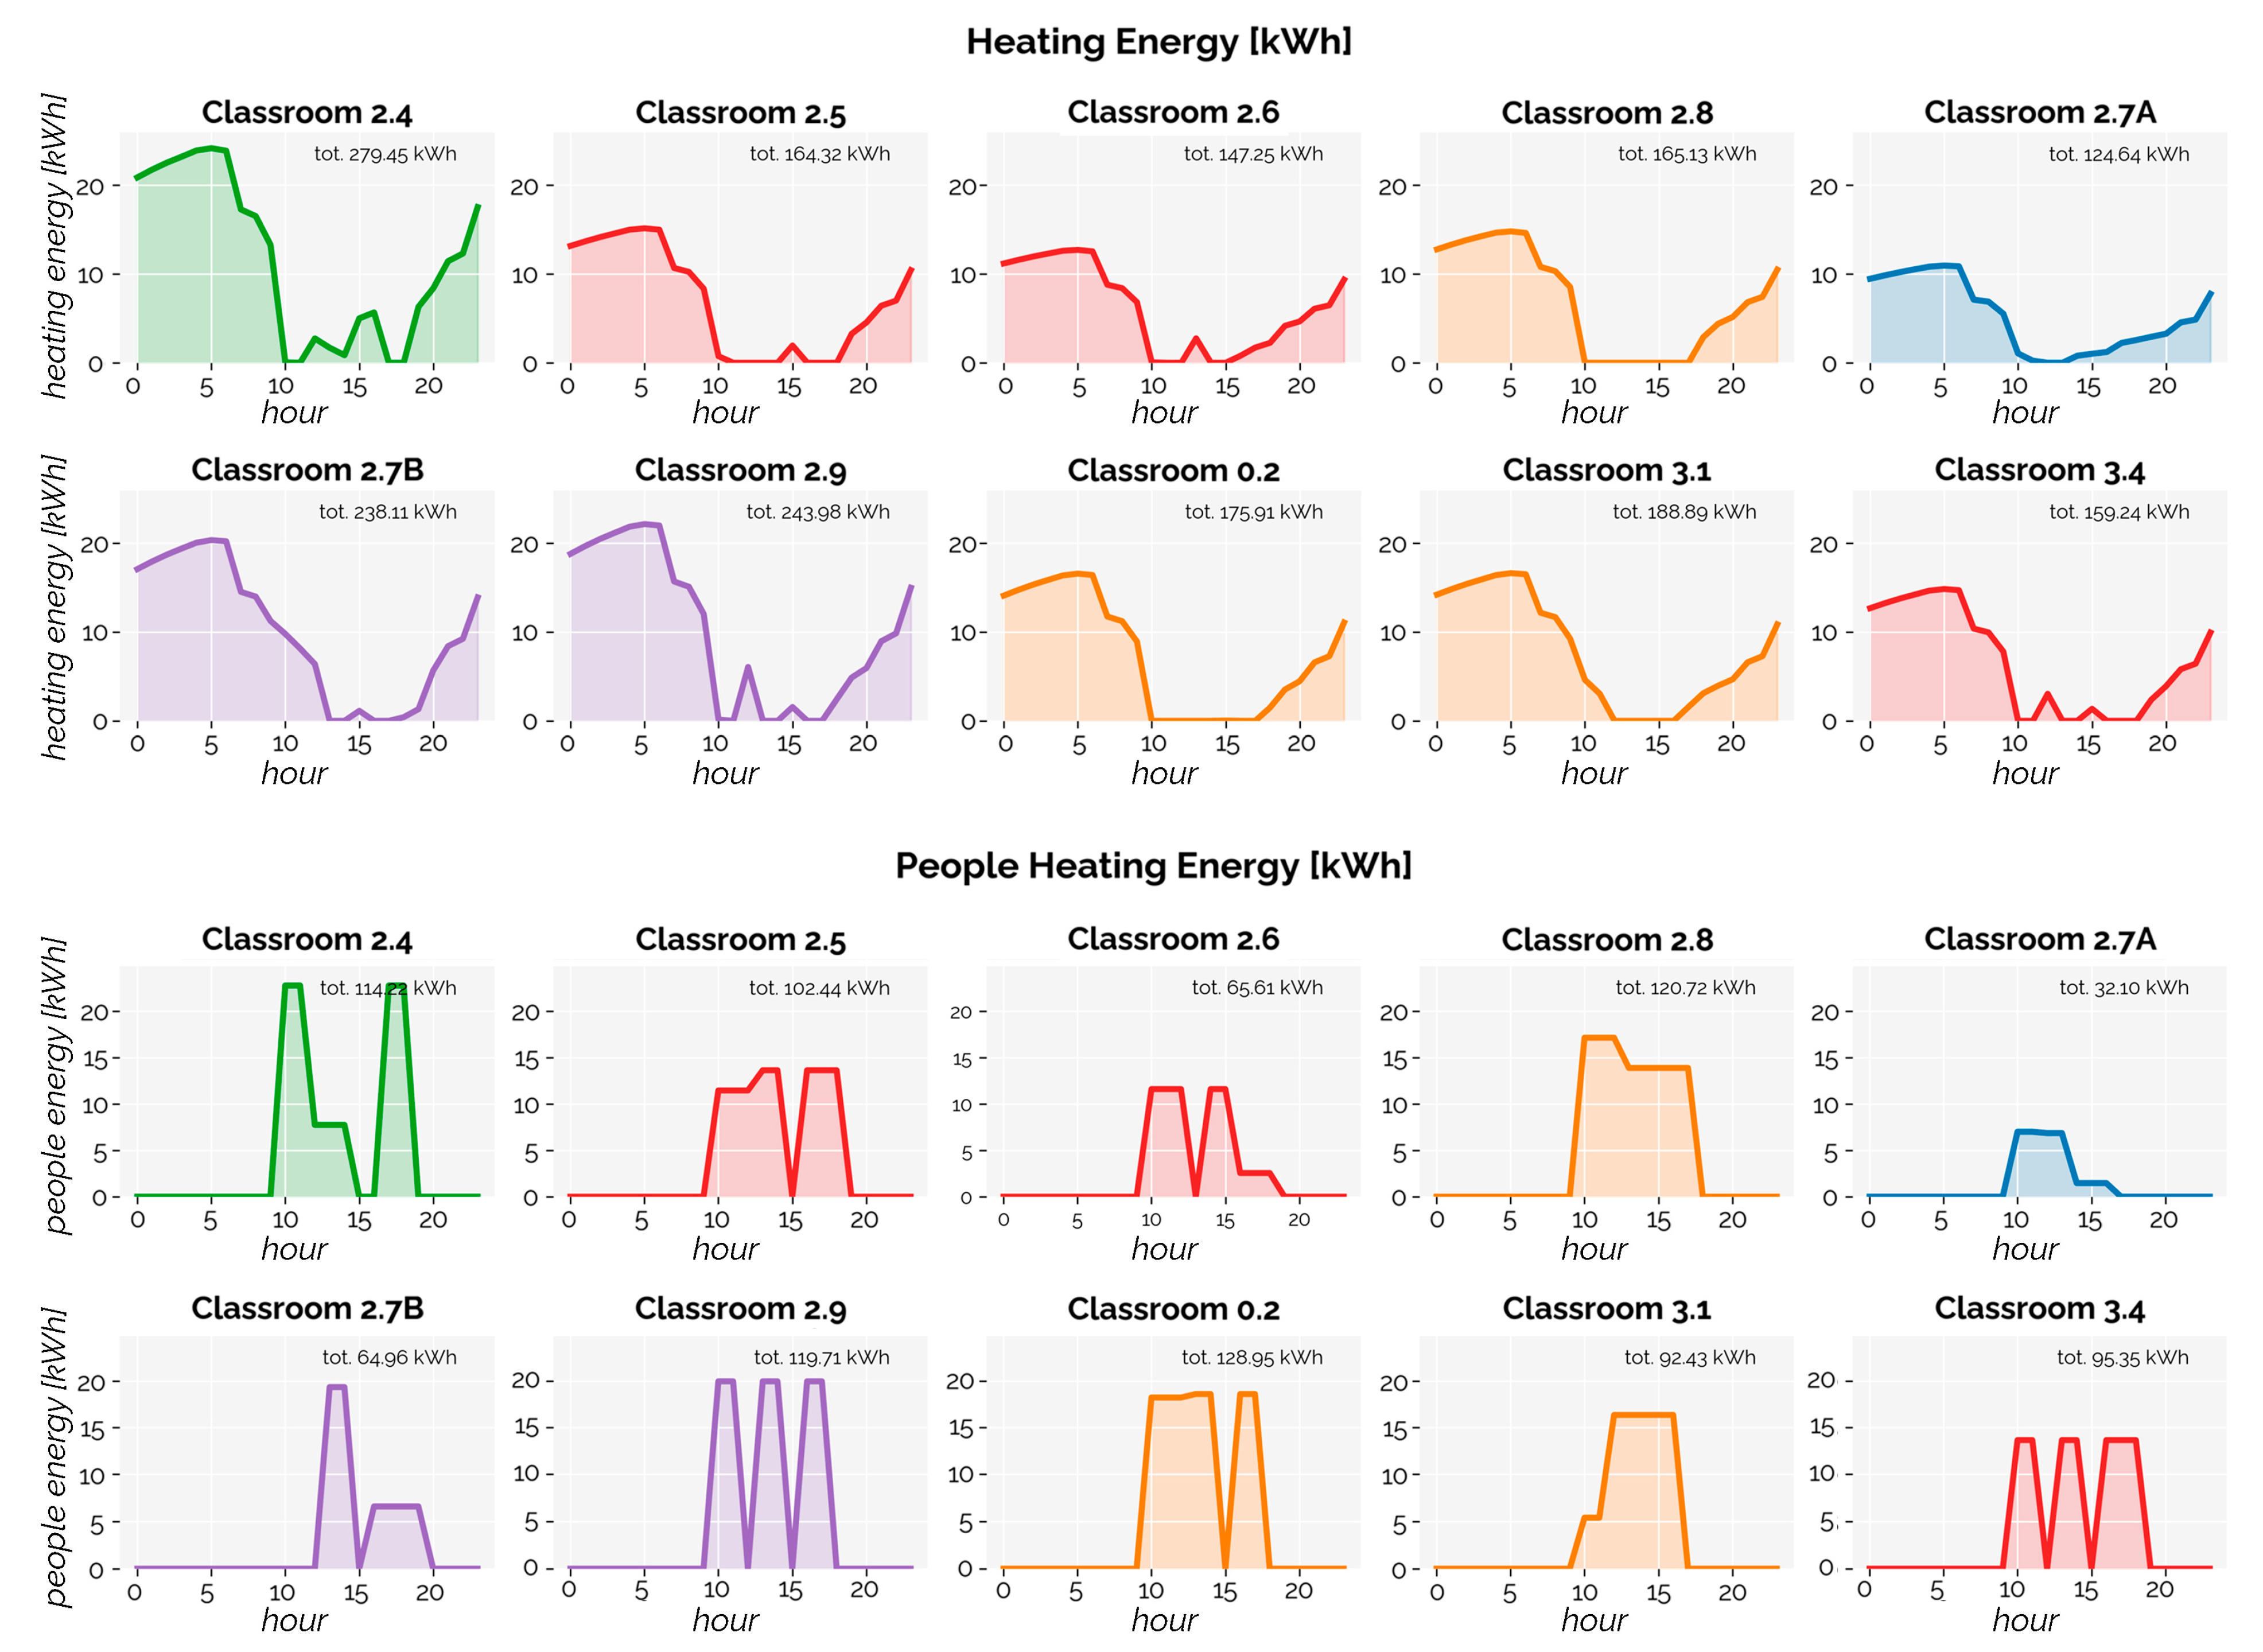
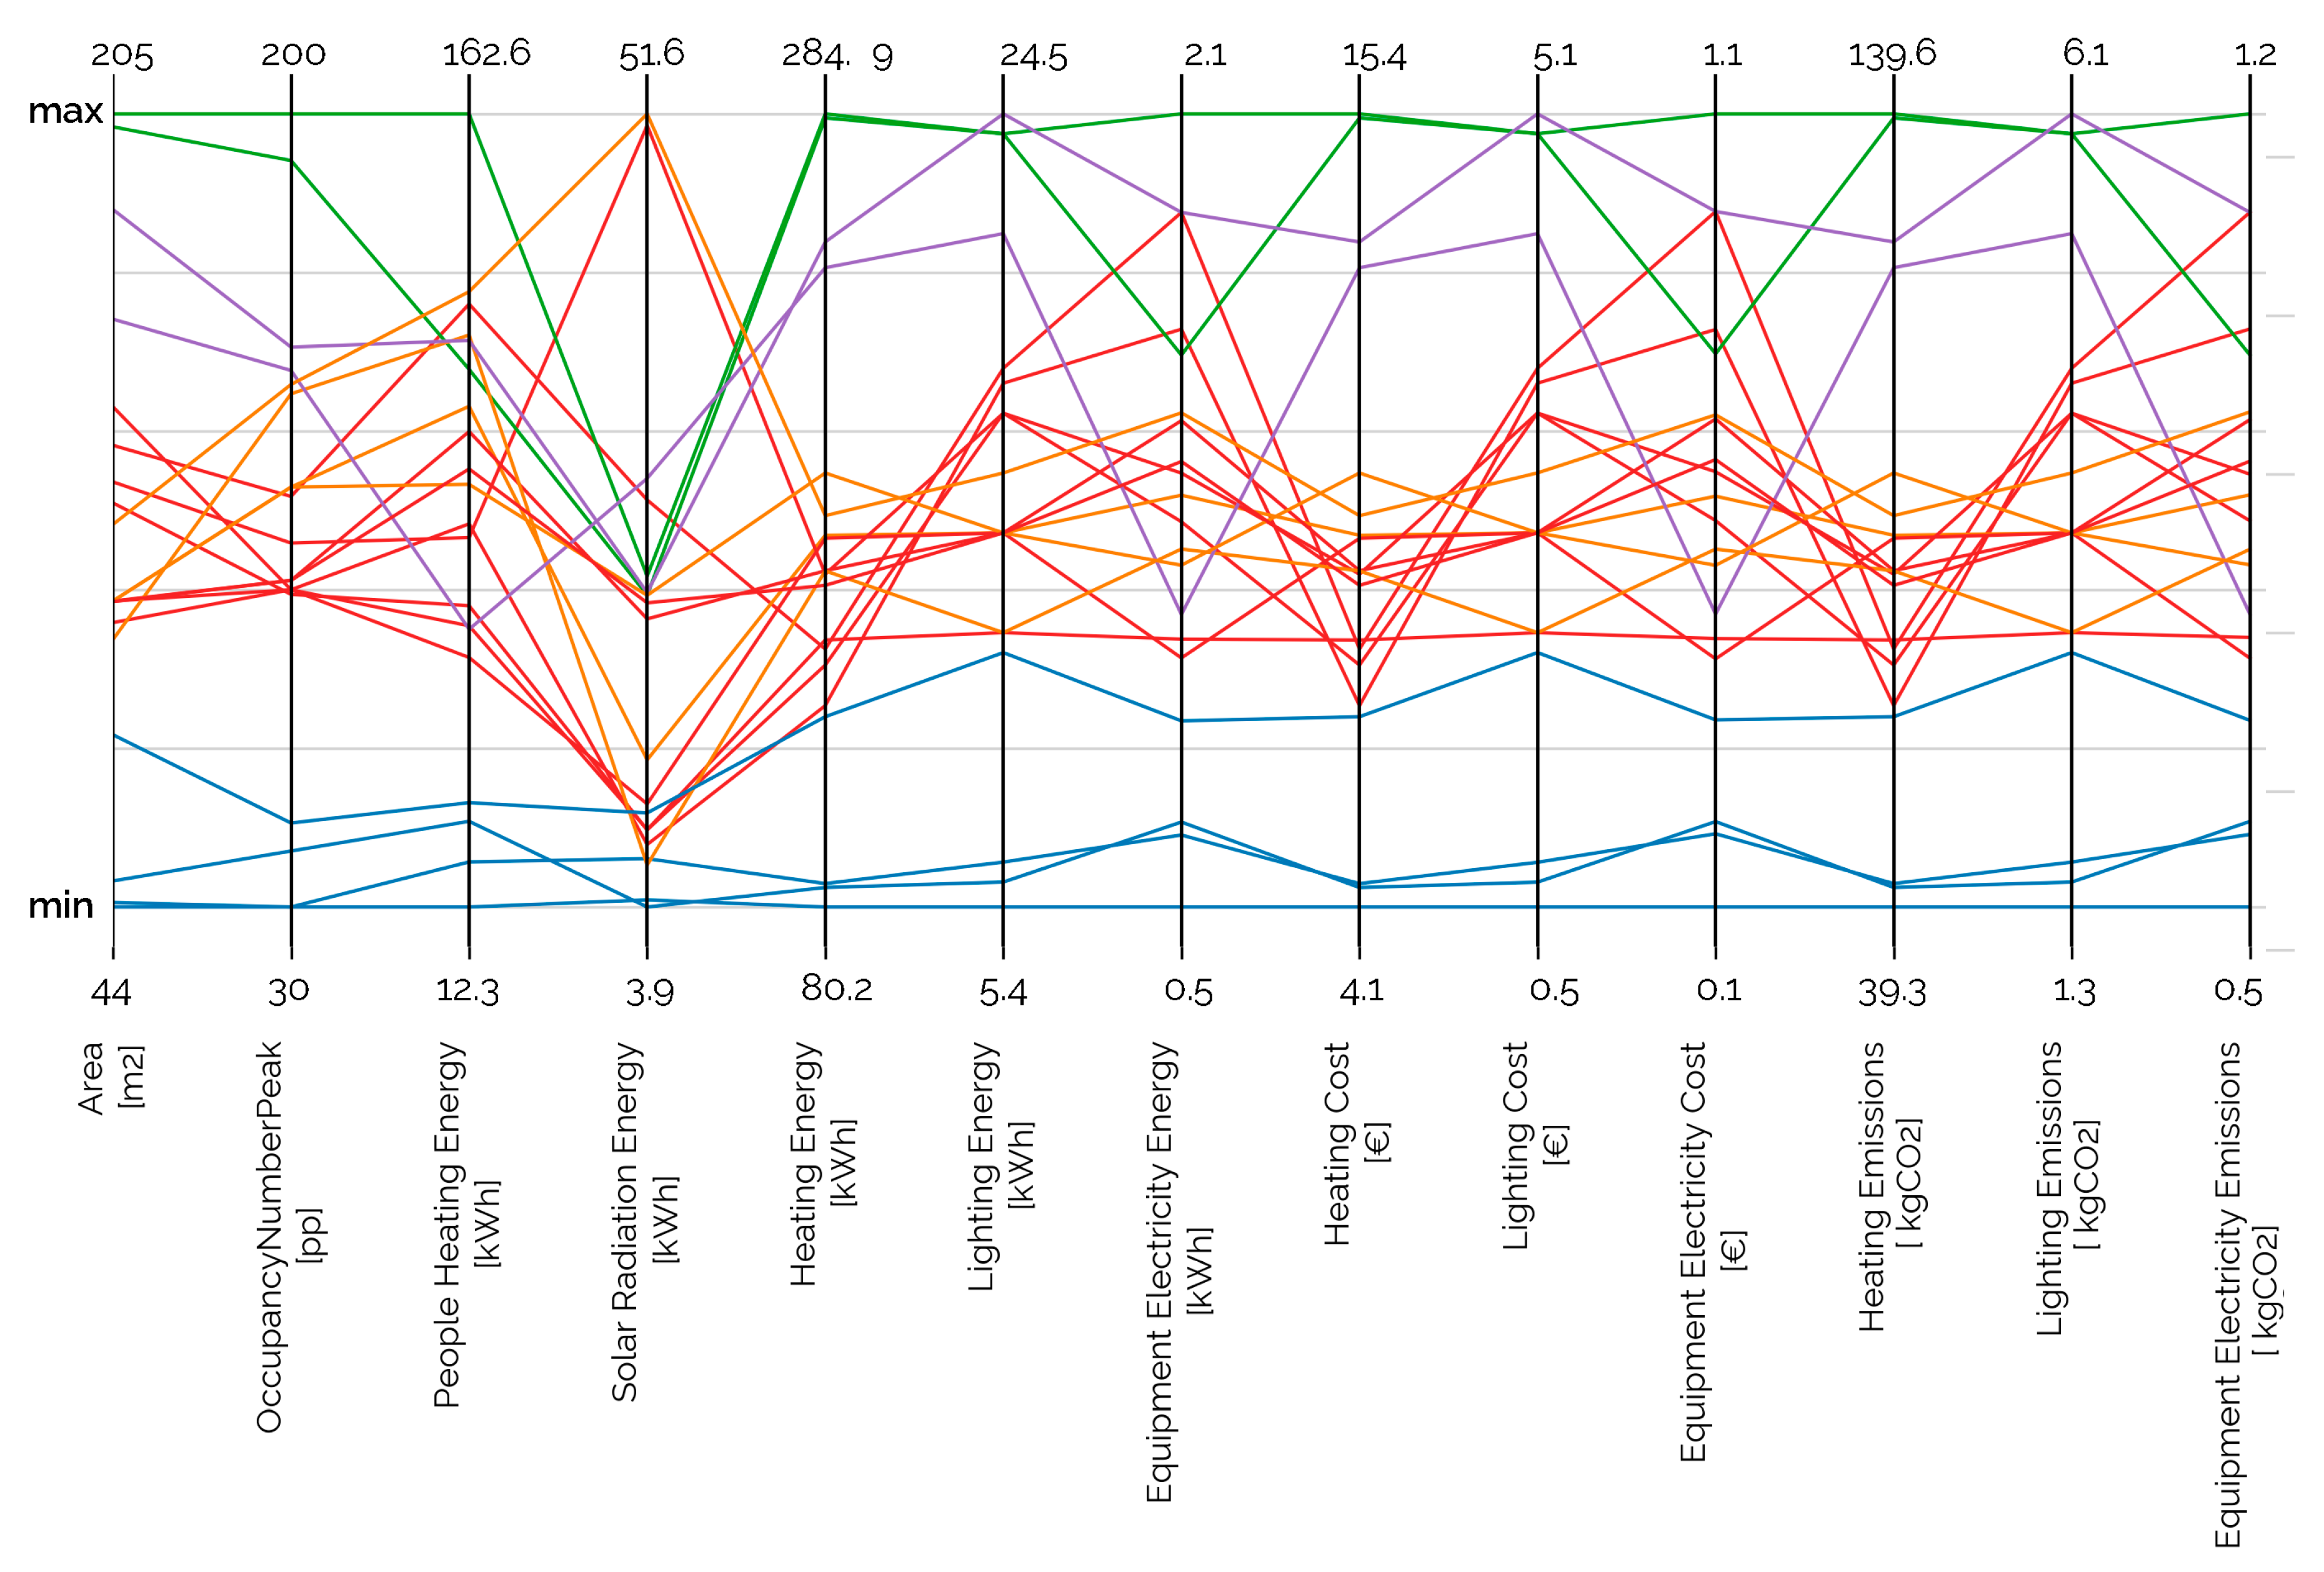
4.3.3. Space Comparison
5. Discussion
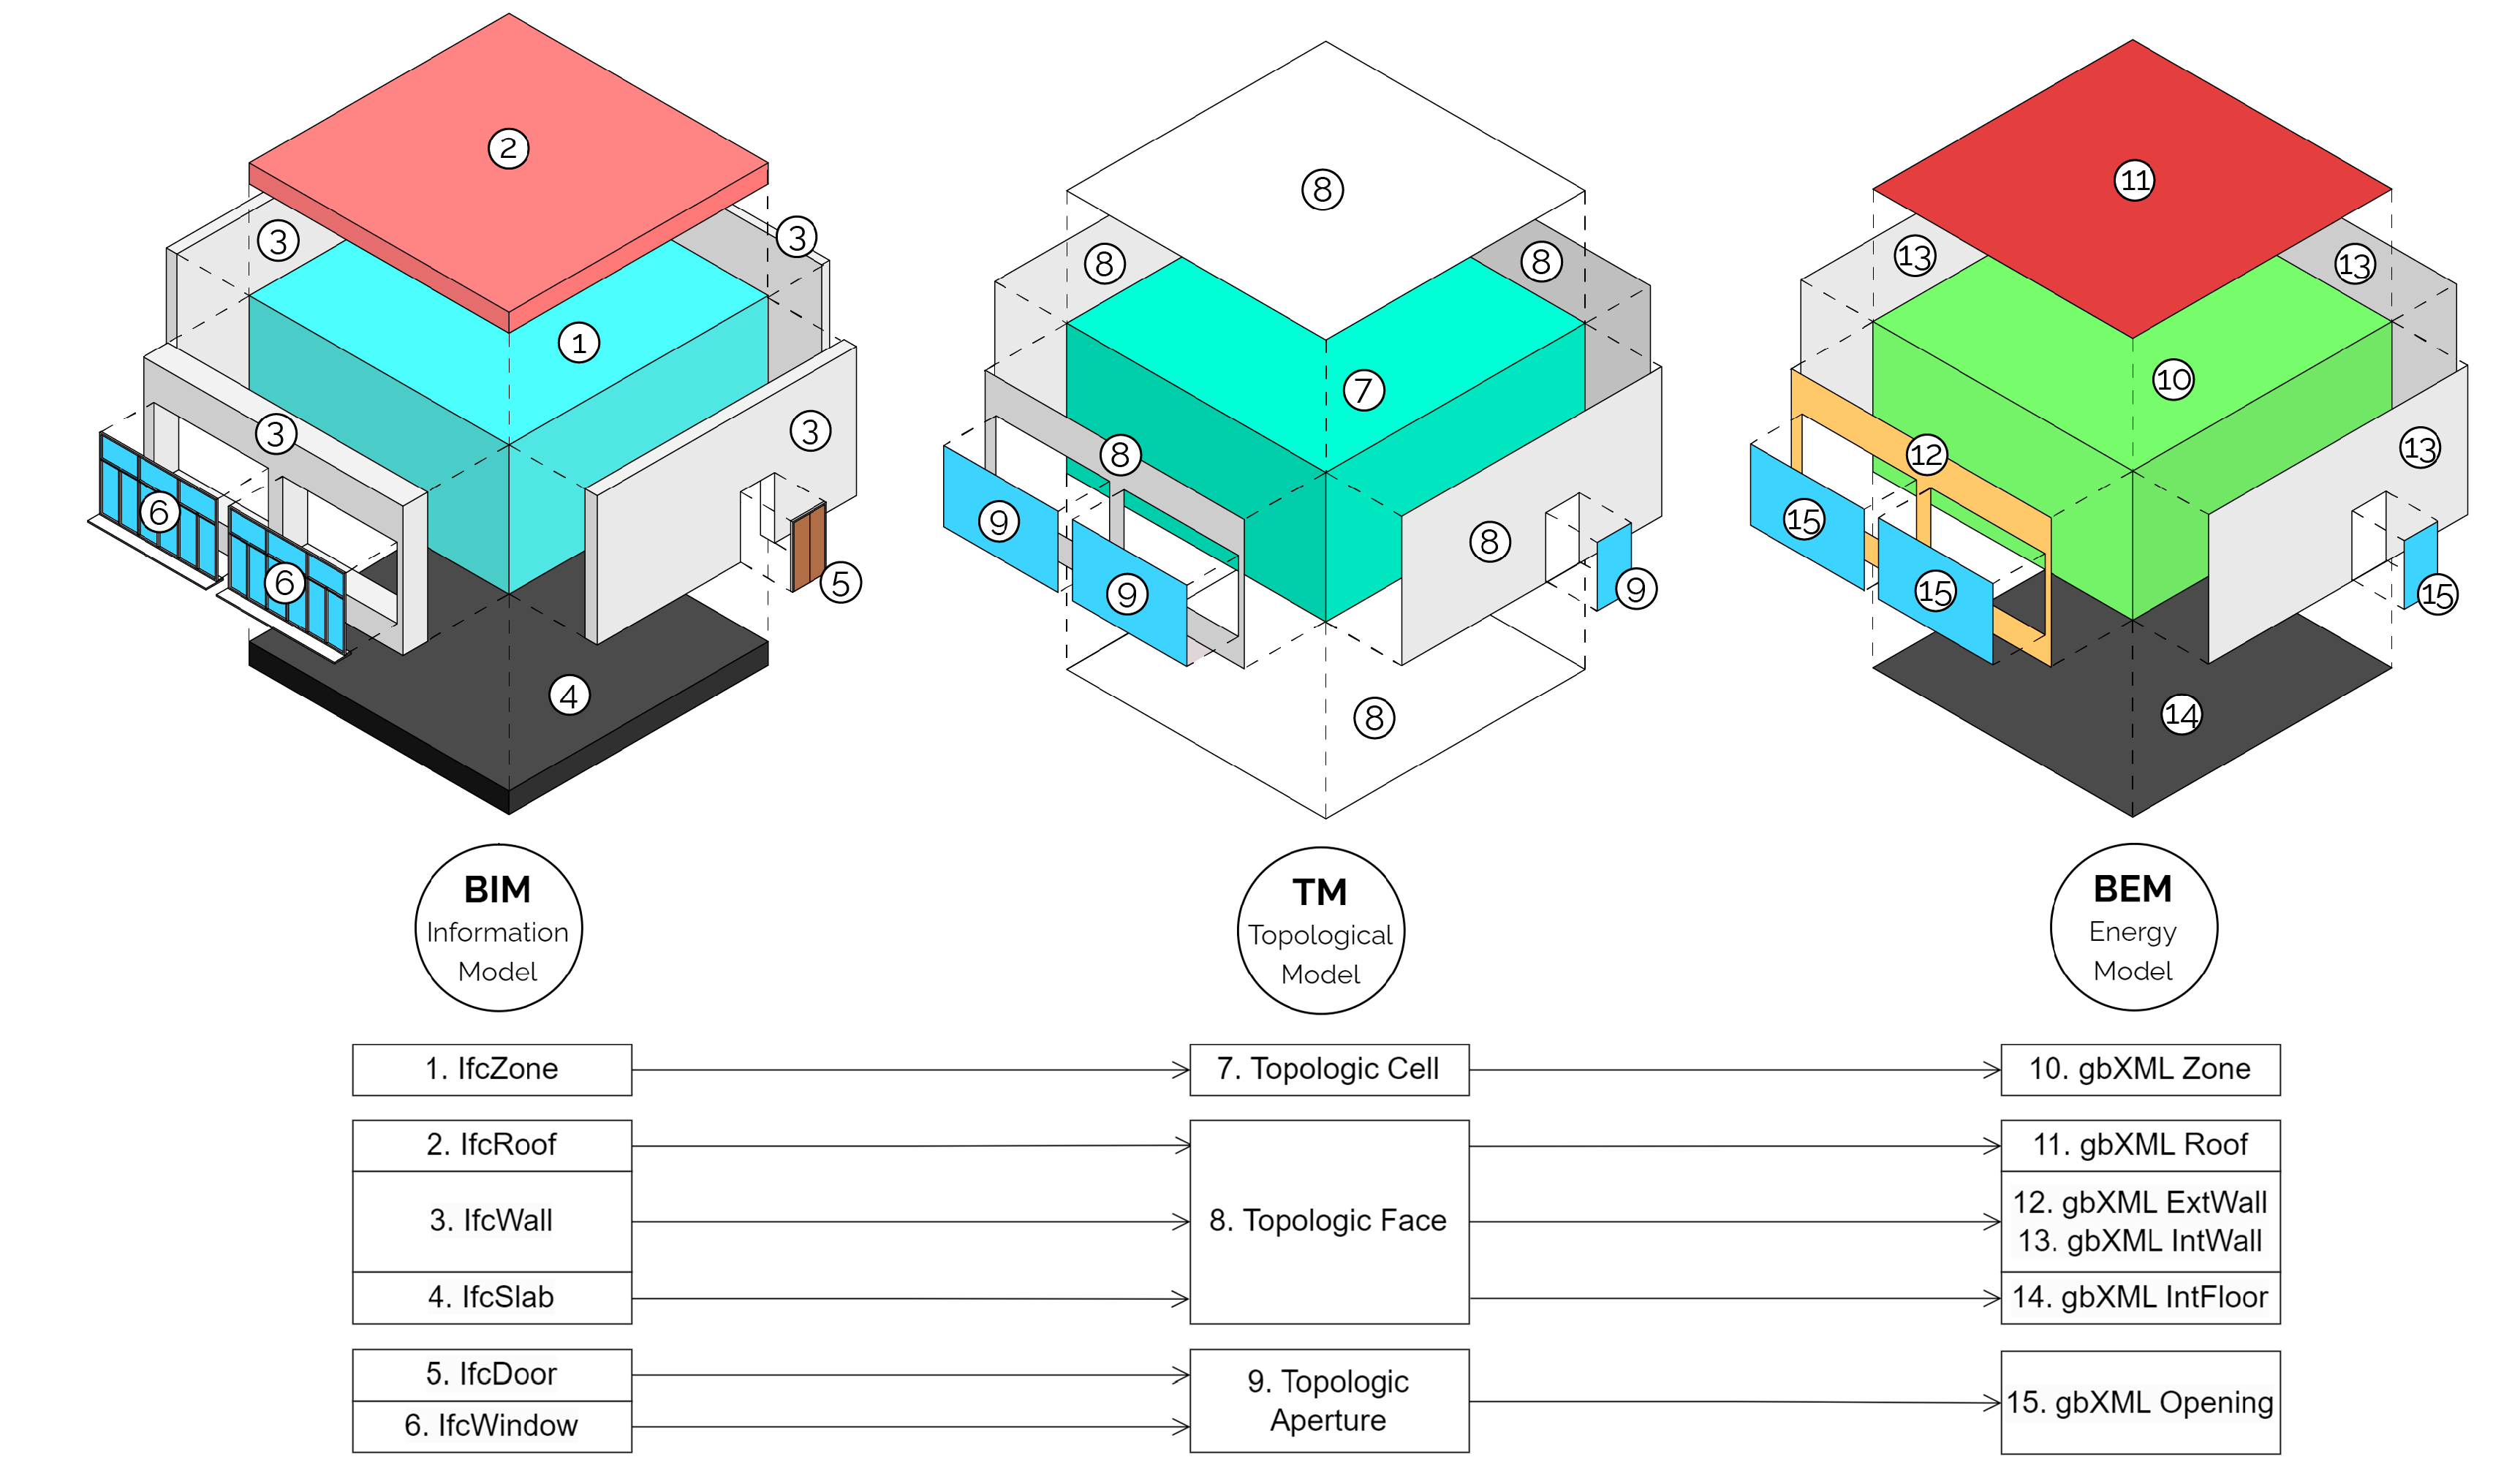
5.1. BIM to BEM Interoperability
5.2. Energy Consumption Prediction Methods
5.3. Limitations and Future Developments
6. Conclusions
Author Contributions
Funding
Institutional Review Board Statement
Data Availability Statement
Conflicts of Interest
Appendix A

| Property Set | Properties |
|---|---|
| Cell.Common | Zone ID (str), Zone Name (str) |
| Cell.Relationships | ChildOf: Building (rel), ChildOf: Building Storey (rel), ParentOf: Faces (rel), ParentOf: Apertures (rel) |
| Cell.Quantities | Gross Volume (m3), Net Volume (m3), Gross Area (m2), Net Area (m2), Gross Height (m), Net Height (m), |
| Cell.LightingAndEquipment | ArtificialLighting (bool), IlluminanceSetpoint (lux), LightingPowerDensity (W/m2), EquipmentPowerDensity (W/m2), LightingSchedule (rel), EquipmentSchedule (rel) |
| Cell.OccupancyRequirements | IsOccupied (bool), AreaPerOccupant (mq/pp), OccupancyNumber (pp), OccupancType (str), OccupancySchedule (rel) |
| Cell.ThermalRequirements | IsHeated (bool), IsCooled (bool), IsVentilated (bool), TemperatureSummerMax (°C), TemperatureSummerMin (°C), TemperatureWinterMax (°C), TemperatureWinterMin (°C), HumidityMax (%), HumidityMin (%), NaturalVentilationRate (m3/(s·m2), MechVentilationRate (m3/(s·m2), CoolingSchedule (rel), HeatingSchedule (rel), VentilationSchedule (rel) |
| Property Set | Properties |
|---|---|
| Face.Common | Face ID (str), Face Name (str), Face Type (str) |
| Face.Relationships | ChildOf: Building (rel), ChildOf: Building Storey (rel), ChildOf: Cell(rel), ParentOf: Apertures (rel) |
| Face.Quantities | Length (m), Width (m), Height (m), GrossSideArea (m2), NetSideArea (m2), GrossVolume (m3), NetVolume (m2), GrossWeight (kg), NetWeight (kg) |
| Face.Materials | MaterialLayer1: (Name (rel), Thickness (m), Conductivity (W/mK), Density (kg/m3), SpecificHeat (K/kgK); MaterialLayer2: (Name (rel), Thickness (m), Conductivity (W/mK), Density (kg/m3), SpecificHeat (K/kgK); MaterialLayerN: (Name (rel), Thickness (m), Conductivity (W/mK), Density (kg/m3), SpecificHeat (K/kgK) |
| Face.ThermalProperties | U-Value (W/m2K), R-Value (m2K/W), VolumetricHeatCapacity (J/km3) |
| Face.Common | Face ID (str), Face Name (str), Face Type (str) |
| Property Set | Properties |
|---|---|
| Aperture.Common | Face ID (str), Face Name (str), Face Type (str) |
| Aperture.Relationships | ChildOf: Building (rel), ChildOf: Building Storey (rel), ChildOf: Cell (rel) |
| Aperture.Quantities | Width (m), Height (m), Area (m2), Perimeter (m) |
| Aperture.ThermalProperties | U-Value (W/m2K), SolarHeatGainCoefficient (float), VisibileTrasmittance (float) |
Appendix B
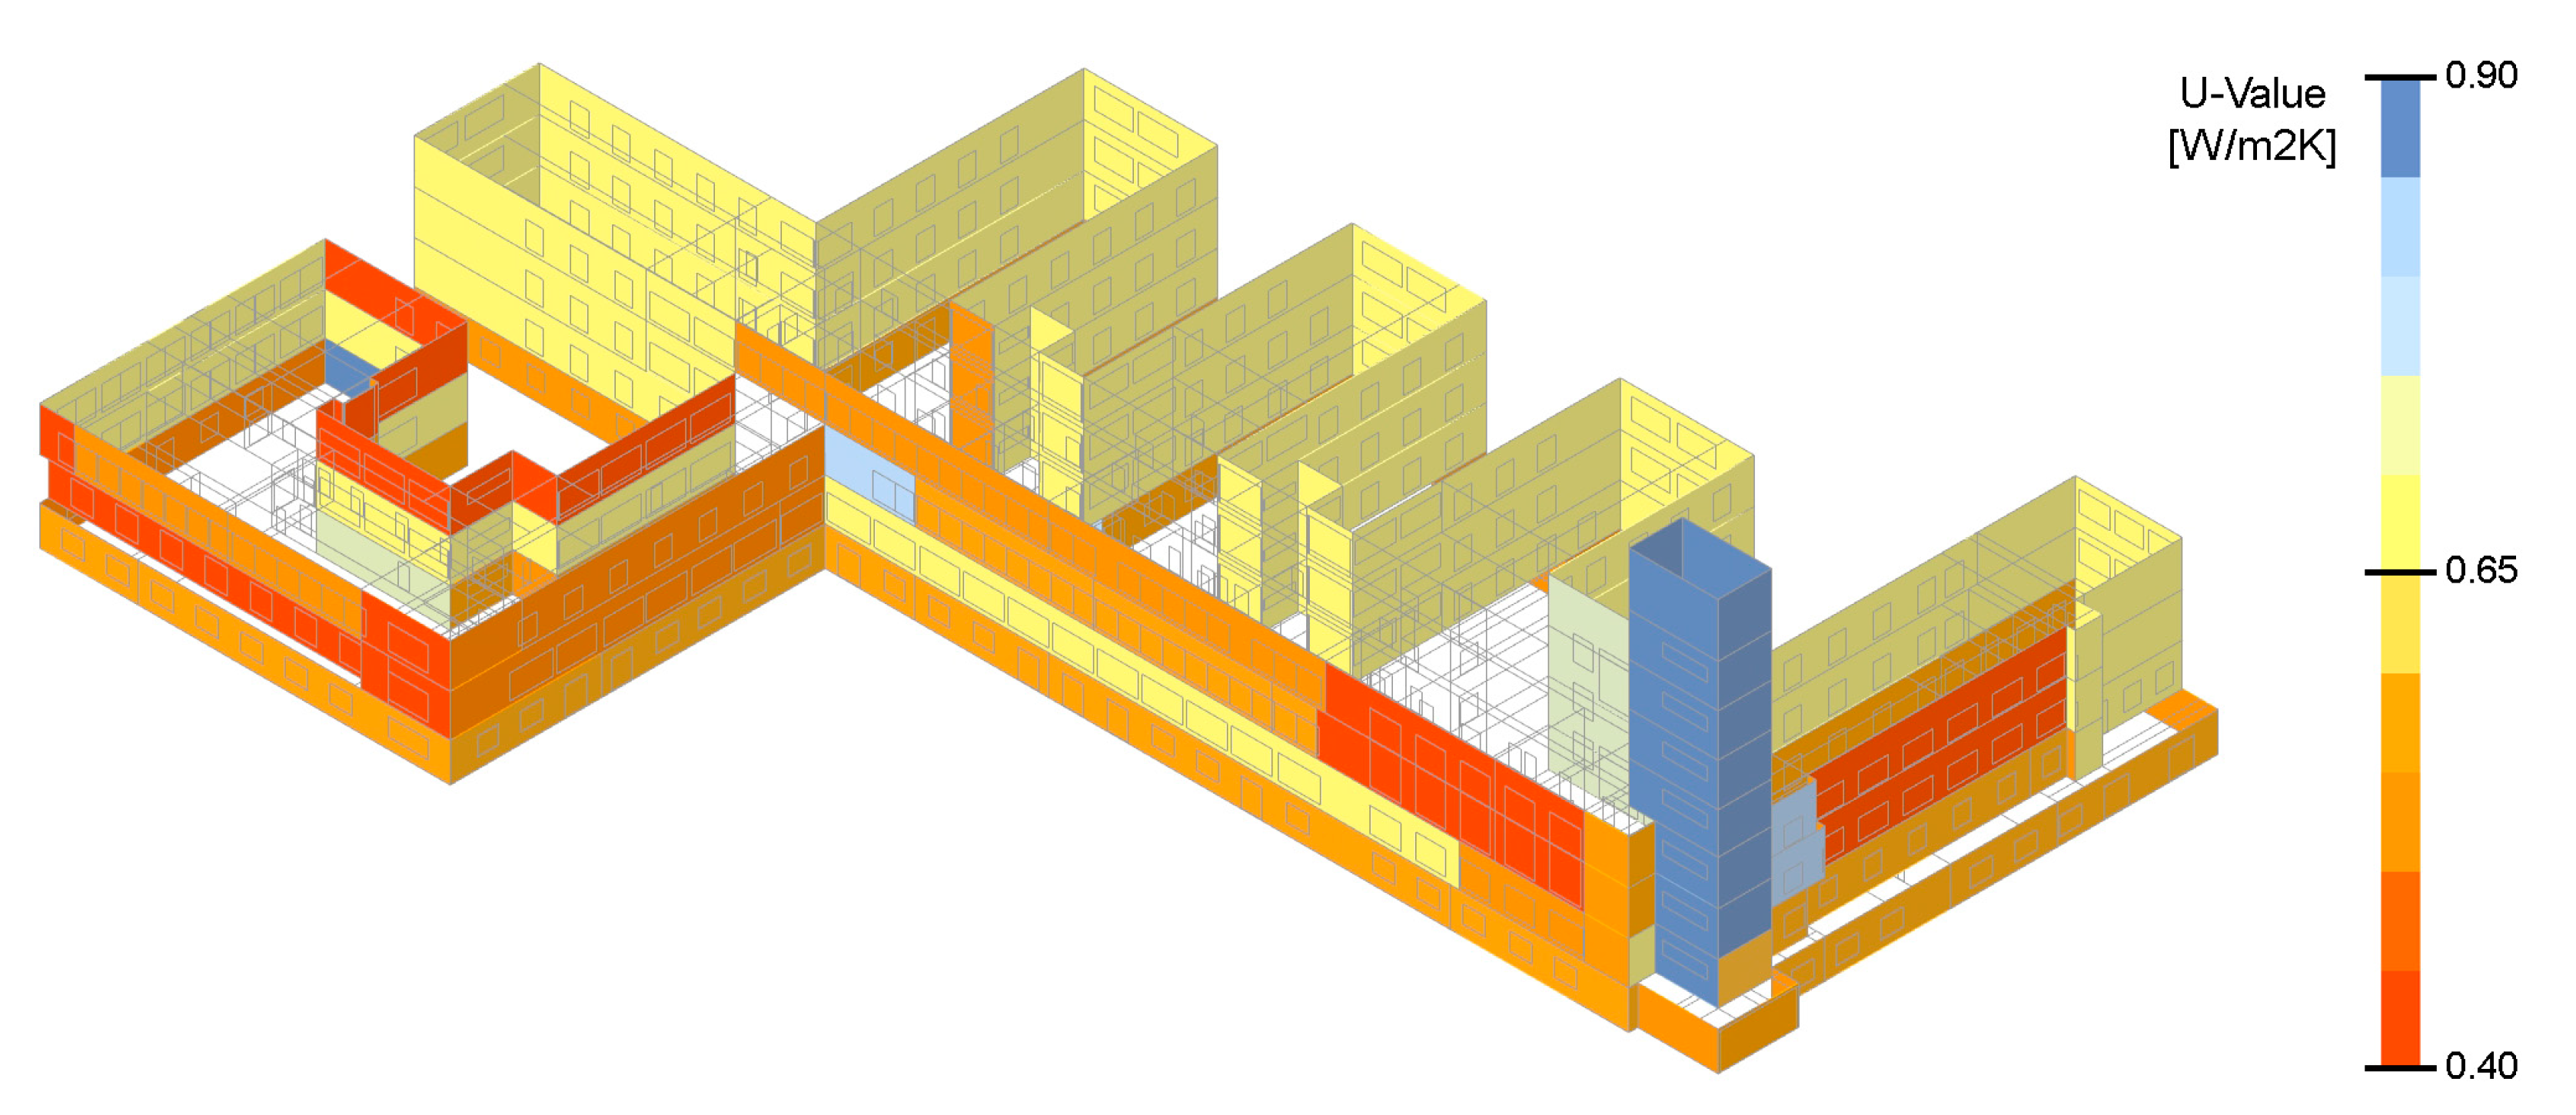
| Construction Type | Element | Materials (External to Internal Layers) | U-Value (W/m2K) |
|---|---|---|---|
| AreatedBrickWall_36cm | Wall | Plaster_2cm, Areated brick_32cm, GypsiumPlaster_2cm | 0.72 |
| BrickWall_50cm_2 | Wall | Plaster_2cm, SolidBrick_14cm, Air_16cm, SolidBrick_14cm, GypsiumPlaster_2cm | 0.68 |
| MixedBrickConcreteWall_120cm | Wall | Plaster_2cm, SolidBrick_14cm, SolidBrick_14cm, ReinforcedConcrete_45cm, Air_36cm, SolidBrick_14cm, GypsiumPlaster_2cm | 0.55 |
| MixedBrickConcreteWall_160cm | Wall | Plaster_2cm, SolidBrick_14cm, SolidBrick_14cm, SolidBrick_14cm, Air_16cm, ReinforcedConcrete_95cm, GypsiumPlaster_2cm | 0.41 |
| SolidBrickWall_45cm | Wall | SolidBrick_14cm, SolidBrick_14cm, SolidBrick_14cm | 0.45 |
| SolidBrickWall_47cm | Wall | SolidBrick_14cm, SolidBrick_14cm, SolidBrick_28cm, GypsiumPlaster_2cm | 0.54 |
| SolidBrickWall_50cm | Wall | Plaster_3cm, SolidBrick_14cm, SolidBrick_14cm, SolidBrick_28cm, GypsiumPlaster_2cm | 0.51 |
| SolidBrickWall_30cm | Wall | SolidBrick_14cm, SolidBrick_14cm, GypsiumPlaster_2cm | 0.85 |
| SolidBrickWall_34cm | Wall | Plaster_2cm, SolidBrick_14cm, SolidBrick_14cm, GypsiumPlaster_2cm | 0.76 |
| SolidBrickWall_37cm | Wall | Plaster_3cm, SolidBrick_14cm, SolidBrick_14cm, GypsiumPlaster_2cm | 0.72 |
| SolidBrickWall_49cm | Wall | Plaster_2cm, SolidBrick_14cm, Air_, SolidBrick_14cm, GypsiumPlaster_2cm | 0.68 |
| SolidBrickWall_62cm | Wall | Plaster_2cm, SolidBrick_28cm_30cm, Air_14cm, SolidBrick_14cm, GypsiumPlaster_1cm | 0.49 |
| SolidBrickWall_64cm | Wall | Plaster_2cm, Air_17cm, SolidBrick_14cm, Air_16cm, SolidBrick_14cm, GypsiumPlaster_1cm | 0.64 |
| SolidBrickWall_64cm | Wall | Plaster_2cm, SolidBrick_14cm, SolidBrick_14cm, SolidBrick_14cm, SolidBrick_14cm, GypsiumPlaster_2cm | 0.40 |
| SolidBrickWall_72cm | Wall | SolidBrick_28cm, Air_28cm, SolidBrick_14cm, GypsiumPlaster_2cm | 0.50 |
| SolidBrickWall_77cm | Wall | SolidBrick_14cm, SolidBrick_28cm, Air_30cm, SolidBrick_14cm, GypsiumPlaster_2cm | 0.46 |
| SolidBrickWall_79cm | Wall | Plaster_2cm, SolidBrick_14cm, SolidBrick_14cm, Air_31cm, SolidBrick_14cm, GypsiumPlaster_1cm | 0.46 |
| SolidBrickWall_82cm | Wall | SolidBrick_28cm, Air_38cm, SolidBrick_14cm, GypsiumPlaster_2cm | 0.47 |
| HollowConcreteFloor_60cm | Floor | CeramicTiles_2cm, LightConcrete_8cm, HollowSlab_48cm, GypsiumPlaster_2cm | 1.16 |
| HollowConcreteFloor_52cm | Floor | CeramicTiles_2cm, LightConcrete_8cm, HollowSlab_40cm, GypsiumPlaster_2cm | 1.35 |
| HollowConcreteRoof_52cm | Roof | Gravel_10cm, WaterProofMembane_1cm, HollowSlab_40cm, GypsiumPlaster_2cm | 1.41 |
| GroundFloor_50cm | Floor | CeramicTiles_2cm, LightConcrete_8cm, ConcreteSlab_20cm, Gravel_20cm | 3.03 |
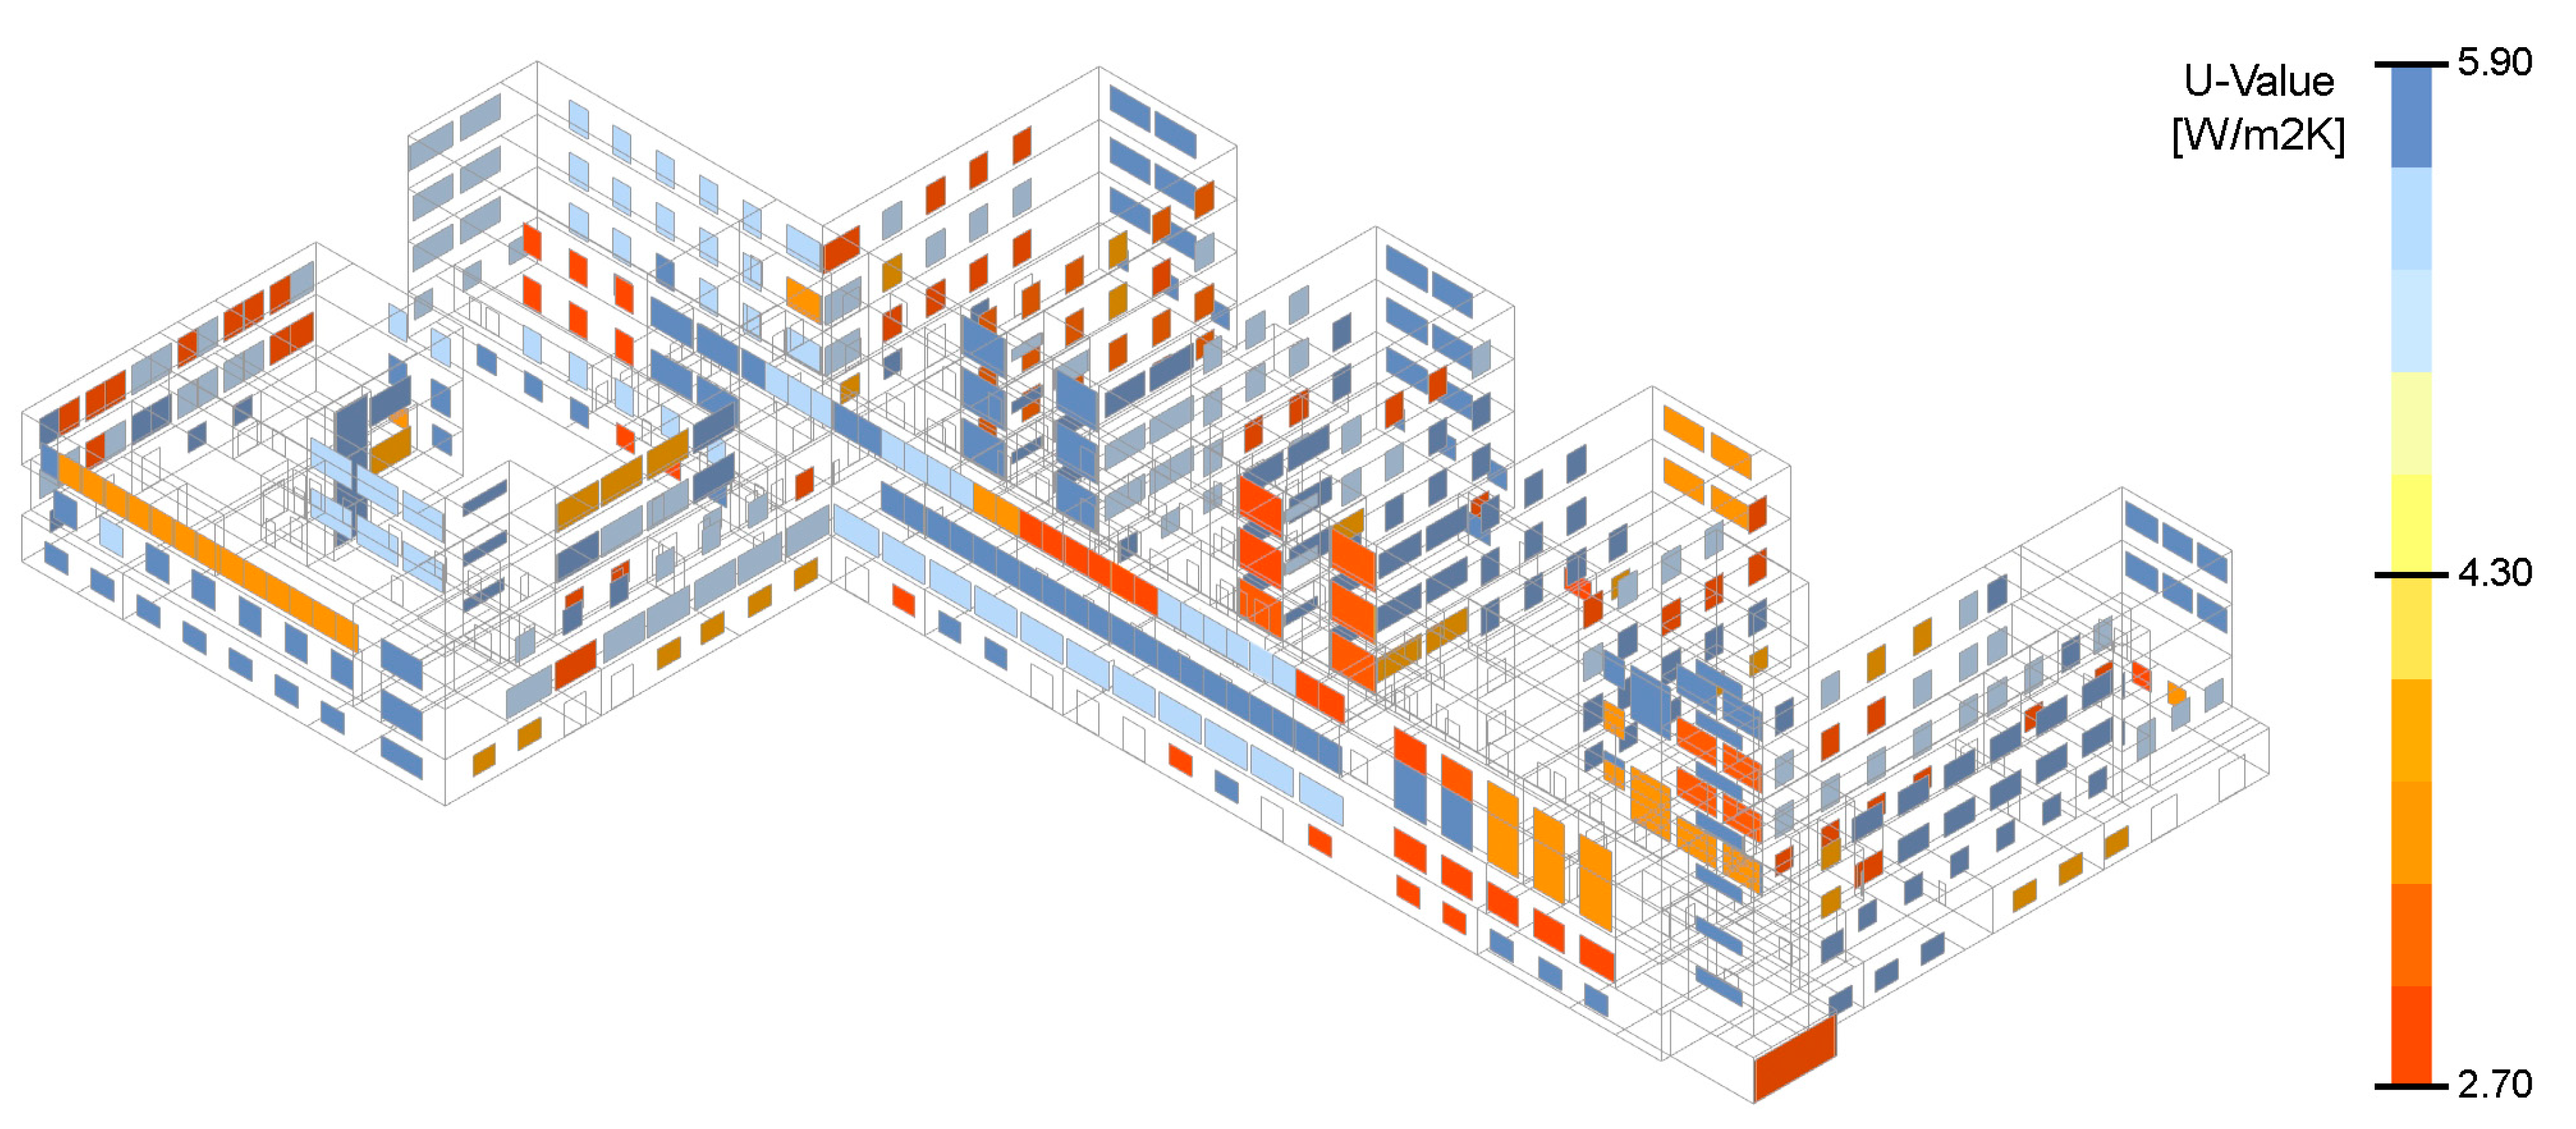
| Opening Type | Frame Material | Glass Type | U-Value (W/m2K) |
|---|---|---|---|
| SteelFrame_SingleGlass_Old | Steel | Single Layer | 5.5–5.8 |
| AluminiumFrame_DoubleGlass_Old | Alluminium | Double Layer | 3.0–3.4 |
| WoodFrame_SingleGlass_Old | Wood | Single Layer | 4.5–4.9 |
| WoodFrame_DoublGlass_Recent | Wood | Double Layer | 2.7–2.9 |
Appendix C
| Space Name | Building Storey | Cluster ID | Area (m2) | Occupancy Number Peak (pp) | Area/Occupant (mq/pp) |
|---|---|---|---|---|---|
| Classroom 0.1 | Second Floor | B | 129.6 | 108 | 1.20 |
| Classroom 0.2 | Third Floor | C | 121.1 | 142 | 0.85 |
| Classroom 0.5 | Ground Floor | B | 136.9 | 118 | 1.16 |
| Classroom 0.6 | Ground Floor | B | 125.4 | 97 | 1.29 |
| Classroom 0.7 | Ground Floor | B | 144.6 | 98 | 1.48 |
| Classroom 1.2 | First Floor | B | 105.8 | 98 | 1.08 |
| Classroom 1.3 | First Floor | C | 105.8 | 120 | 0.88 |
| Classroom 1.4 | First Floor | A | 44.7 | 30 | 1.49 |
| Classroom 1.5 | First Floor | A | 45.6 | 30 | 1.52 |
| Classroom 2.2 | Second Floor | A | 49.9 | 42 | 1.19 |
| Classroom 2.3 | Second Floor | E | 203.1 | 200 | 1.02 |
| Classroom 2.4 | Second Floor | E | 200.5 | 190 | 1.06 |
| Classroom 2.5 | Second Floor | B | 105.8 | 100 | 1.06 |
| Classroom 2.6 | Second Floor | B | 101.5 | 98 | 1.04 |
| Classroom 2.7A | Second Floor | A | 79.1 | 48 | 1.65 |
| Classroom 2.7B | Second Floor | D | 162.1 | 145 | 1.12 |
| Classroom 2.8 | Second Floor | C | 98.1 | 140 | 0.70 |
| Classroom 2.9 | Second Floor | D | 184 | 150 | 1.23 |
| Classroom 3.1 | Third Floor | C | 105.8 | 120 | 0.88 |
| Classroom 3.4 | Third Floor | B | 105.7 | 100 | 1.06 |
| Space Name | Equipment Energy (kWh) | Lighting Energy (kWh) | Heating Energy (kWh) | People Heating Energy (kWh) | Solar Radiation Energy (kWh) |
|---|---|---|---|---|---|
| Classroom 0.1 | 0.82 | 17.28 | 166.11 | 82.33 | 50.93 |
| Classroom 0.2 | 0.91 | 15.84 | 181.2 | 128.94 | 51.62 |
| Classroom 0.5 | 1.22 | 18.36 | 146.77 | 126.60 | 28.43 |
| Classroom 0.6 | 0.74 | 17.28 | 142.64 | 69.41 | 8.61 |
| Classroom 0.7 | 1.04 | 18.00 | 132.17 | 84.94 | 7.73 |
| Classroom 1.2 | 0.53 | 14.40 | 175.37 | 59.60 | 10.17 |
| Classroom 1.3 | 0.78 | 14.40 | 176.14 | 107.21 | 12.82 |
| Classroom 1.4 | 0.15 | 5.40 | 80.19 | 12.31 | 4.41 |
| Classroom 1.5 | 0.26 | 6.48 | 86.24 | 20.85 | 6.88 |
| Classroom 2.2 | 0.28 | 6.00 | 85.23 | 28.56 | 3.98 |
| Classroom 2.3 | 1.37 | 24.00 | 284.92 | 162.64 | 23.85 |
| Classroom 2.4 | 1.00 | 24.00 | 283.86 | 114.21 | 22.71 |
| Classroom 2.5 | 0.90 | 14.40 | 166.99 | 102.43 | 21.28 |
| Classroom 2.6 | 0.56 | 12.00 | 149.11 | 65.61 | 8.62 |
| Classroom 2.7A | 0.44 | 11.52 | 129.30 | 32.09 | 9.63 |
| Classroom 2.7B | 0.60 | 21.60 | 245.20 | 64.95 | 29.73 |
| Classroom 2.8 | 0.70 | 12.00 | 166.95 | 120.72 | 6.50 |
| Classroom 2.9 | 1.22 | 24.48 | 251.85 | 119.70 | 22.86 |
| Classroom 3.1 | 0.68 | 14.40 | 192.22 | 92.42 | 22.70 |
| Classroom 3.4 | 0.84 | 14.40 | 163.21 | 95.35 | 22.25 |
References
- Zuo, J.; Zhao, Z.Y. Green building research–current status and future agenda: A review. Renew. Sustain. Energy Rev. 2014, 30, 271–281. [Google Scholar] [CrossRef]
- Mattoni, B.; Guattari, C.; Evangelisti, L.; Bisegna, F.; Gori, P.; Asdrubali, F. Critical review and methodological approach to evaluate the differences among international green building rating tools. Renew. Sustain. Energy Rev. 2018, 82, 950–960. [Google Scholar] [CrossRef]
- AbdelAzim, A.I.; Ibrahim, A.M.; Aboul-Zahab, E.M. Development of an energy efficiency rating system for existing buildings using Analytic Hierarchy Process–The case of Egypt. Renew. Sustain. Energy Rev. 2017, 71, 414–425. [Google Scholar] [CrossRef]
- Natural Resources Defense Council, City Energy Project Resource Library. Available online: http://www.cityenergyproject.org (accessed on 12 May 2023).
- World Green Building Council, Global Status Report 2017. Available online: https://www.worldgbc.org/news-media/global-status-report-2017 (accessed on 12 May 2023).
- World Green Building Council, New Report: The Building and Construction Sector Can Reach Net Zero Carbon Emissions by 2050. Available online: https://www.worldgbc.org/news-media/WorldGBC-embodied-carbon-report-published (accessed on 12 May 2023).
- European Green Deal. Available online: https://commission.europa.eu/strategy-and-policy/priorities-2019-2024/european-green-deal_en (accessed on 12 May 2023).
- Renovation Wave. Available online: https://energy.ec.europa.eu/topics/energy-efficiency/energy-efficient-buildings/renovation-wave_en (accessed on 12 May 2023).
- New European Bahuas. Available online: https://new-european-bauhaus.europa.eu/index_en (accessed on 12 May 2023).
- Built4People Partnership Strategic Research & Innovation Agenda. Final Draft: September 2021. European Partnerships under Horizon Europe. Available online: https://build-up.ec.europa.eu/en/resources-and-tools/publications/built4people-partnership-strategic-research-innovation-agenda-2021 (accessed on 18 July 2023).
- Bortolini, R.; Forcada, N. Analysis of building maintenance requests using a text mining approach: Building services evaluation. Build. Res. Inf. 2020, 48, 207–217. [Google Scholar] [CrossRef]
- Fouseki, K.; Cassar, M. Energy Efficiency in Heritage Buildings—Future Challenges and Research Needs. Hist. Environ. Policy Pract. 2014, 5, 95–100. [Google Scholar] [CrossRef] [Green Version]
- Manzoor, B.; Othman, I.; Pomares, J.C. Digital Technologies in the Architecture, Engineering and Construction (AEC) Industry—A Bibliometric—Qualitative Literature Review of Research Activities. Int. J. Environ. Res. Public. Health 2021, 18, 6135. [Google Scholar] [CrossRef]
- Wang, K.; Guo, F.; Zhang, C.; Hao, J.; Schaefer, D. Digital Technology in Architecture, Engineering, and Construction (AEC) Industry: Research Trends and Practical Status toward Construction 4.0. In Proceedings of the Construction Research Congress 2022, Arlington, VA, USA, 9–12 March 2022; pp. 983–992. [Google Scholar] [CrossRef]
- Agostinelli, S.; Cumo, F.; Guidi, G.; Tomazzoli, C. Cyber-Physical Systems Improving Building Energy Management: Digital Twin and Artificial Intelligence. Energies 2021, 14, 2338. [Google Scholar] [CrossRef]
- Abdelrahman, M.; Zhan, S.; Miller, C.; Chong, A. Data science for building energy efficiency: A comprehensive text-mining driven review of scientific literature. Energy Build. 2021, 242, 110885. [Google Scholar] [CrossRef]
- Ide, L.; Gutland, M.; Bucking, S.; Santana Quintero, M. Balancing Trade-offs between Deep Energy Retrofits and Heritage Conservation: A Methodology and Case Study. Int. J. Archit. Herit. 2022, 16, 97–116. [Google Scholar] [CrossRef]
- Petri, I.; Rezgui, Y.; Ghoroghi, A.; Alzahrani, A. Digital twins for performance management in the built environment. J. Ind. Inf. Integr. 2023, 33, 100445. [Google Scholar] [CrossRef]
- Azizi, N.S.M.; Wilkinson, S.; Fassman, E. Management practice to achieve energy-efficient performance of green buildings in New Zealand. Archit. Eng. Des. Manag. 2014, 10, 25–39. [Google Scholar] [CrossRef]
- Abuimara, T.; Hobson, B.W.; Gunay, B.; O’Brien, W.; Kane, M. Current state and future challenges in building management: Practitioner interviews and a literature review. J. Build. Eng. 2021, 41, 102803. [Google Scholar] [CrossRef]
- Srivastava, S.; Yang, Z.; Jain, R.K. Understanding the adoption and usage of data analytics and simulation among building energy management professionals: A nationwide survey. Build. Environ. 2019, 157, 139–164. [Google Scholar] [CrossRef]
- European Commission, Definition of the Digital Building Logbook. Report 1 of the Study on the Development of a European Union Framework for Buildings’ Digital Logbook. 2020. Available online: https://op.europa.eu/en/publication-detail/-/publication/cacf9ee6-06ba-11eb-a511-01aa75ed71a1/language-en (accessed on 12 May 2023).
- Harris, N.; Shealy, T.; Parrish, K.; Granderson, J. Cognitive barriers during monitoring-based commissioning of buildings. Sustain. Cities Soc. 2019, 46, 101389. [Google Scholar] [CrossRef] [Green Version]
- Chamari, L.; Petrova, E.; Pauwels, P. A web-based approach to BMS, BIM and IoT integration. In Proceedings of the CLIMA 2022: The 14th REHVA HVAC World Congress, Rotterdam, The Netherlands, 22–25 May 2022. [Google Scholar] [CrossRef]
- Ding, Y.; Han, S.; Tian, Z.; Yao, J.; Chen, W.; Zhang, Q. Review on occupancy detection and prediction in building simulation. Build. Simul. 2022, 15, 333–356. [Google Scholar] [CrossRef]
- Brehmer, M.; Ng, J.; Tate, K.; Munzner, T. Matches, Mismatches, and Methods: Multiple-View Workflows for Energy Portfolio Analysis. IEEE Trans. Vis. Comput. Graph. 2016, 22, 449–458. [Google Scholar] [CrossRef]
- Almatared, M.; Liu, H.; Tang, S.; Sulaiman, M.; Lei, Z.; Li, H.X. Digital Twin in the Architecture, Engineering, and Construction Industry: A Bibliometric Review. In Proceedings of the Construction Research Congress 2022, Arlington, VA, USA, 9–12 March 2022; pp. 670–678. [Google Scholar] [CrossRef]
- Boje, C.; Guerriero, A.; Kubicki, S.; Rezgui, Y. Towards a semantic Construction Digital Twin: Directions for future research. Autom. Constr. 2020, 114, 103179. [Google Scholar] [CrossRef]
- Deng, M.; Menassa, C.C.; Kamat, V.R. From BIM to digital twins: A systematic review of the evolution of intelligent building representations in the AEC-FM industry. J. Inf. Technol. Constr. 2021, 26, 58–83. [Google Scholar] [CrossRef]
- Lu, Q.; Xie, X.; Parlikad, A.K.; Schooling, J.; Pitt, M. Digital Twins in the Built Environment: Fundamentals, Principles and Applications; ICE Publishing: London, UK, 2022. [Google Scholar]
- Predari, G.; Prati, D.; Massafra, A. Modern Construction in Bologna. The Faculty of Engineering by Giuseppe Vaccaro, 1932–1935. In Digital Modernism Heritage Lexicon; Springer Nature Switzerland AG: Cham, Switzerland, 2021; pp. 233–258. [Google Scholar]
- Gulli, R.; Predari, G. Il Moderno a Bologna: La Facoltà di Ingegneria di Giuseppe Vaccaro (1932–1935). ANANKE 2018, 83, 101–108. [Google Scholar]
- Mosteiro-Romero, M.; Miller, C.; Chong, A.; Stouffs, R. Elastic buildings: Calibrated district-scale simulation of occupant-flexible campus operation for hybrid work optimization. Build. Environ. 2023, 237, 110318. [Google Scholar] [CrossRef]
- Gui, X.; Gou, Z.; Lu, Y. Reducing university energy use beyond energy retrofitting: The academic calendar impacts. Energy Build. 2021, 231, 110647. [Google Scholar] [CrossRef]
- EnergyPlus. Available online: https://energyplus.net/ (accessed on 12 May 2023).
- European Parliament, Amendments Adopted by the European Parliament on 14 March 2023 on the Proposal for a Directive of the European Parliament and of the Council on the Energy Performance of Buildings. (Recast) (COM(2021)0802–C9-0469/2021–2021/0426(COD)). Available online: https://www.europarl.europa.eu/doceo/document/TA-9-2023-0068_EN.pdf (accessed on 30 May 2023).
- Ministero Dell’economia e delle Finanze (MEF), Patrimonio Della PA. Rapporto Tematico. Modello di Stima del Valore del Patrimonio Immobiliare Pubblico. 2015. Available online: https://www.dt.mef.gov.it/export/sites/sitodt/modules/documenti_it/programmi_cartolarizzazione/patrimonio_pa/Modello_Stima_Valore_Immobili_Pubblici.pdf (accessed on 12 May 2023).
- Zhao, J.; Feng, H.; Chen, Q.; Garcia de Soto, B. Developing a conceptual framework for the application of digital twin technologies to revamp building operation and maintenance processes. J. Build. Eng. 2022, 49, 104028. [Google Scholar] [CrossRef]
- Code of Cultural Heritage and Landscape. ai Sensi Dell’articolo 10 della Legge 6 Luglio 2002, n. 137. Italian Legislative Decree 22 January 2004, n. 42. 2004.
- Gómez-Gil, M.; Sesana, M.M.; Salvalai, G.; Espinosa-Fernández, A.; López-Mesa, B. The Digital Building Logbook as a gateway linked to existing national data sources: The cases of Spain and Italy. J. Build. Eng. 2023, 63, 105461. [Google Scholar] [CrossRef]
- Merino, J.; Xie, X.; Moretti, N.; Chang, J.Y.; Parlikad, A.K. Data integration for digital twins in the built environment. In Proceedings of the 2022 European Conference on Computing in Construction, Rhodes, Greece, 24–26 July 2022. [Google Scholar] [CrossRef]
- Osello, A.; Lucibello, G.; Morgagni, F. HBIM and virtual tools: A new chance to preserve architectural heritage. Build. Open Access J. Built Environ. 2018, 8, 12. [Google Scholar] [CrossRef] [Green Version]
- Ivson, P.; Moreira, A.; Queiroz, F.; Santos, W.; Celes, W. A Systematic Review of Visualization in Building Information Modeling. IEEE Trans. Vis. Comput. Graph. 2020, 26, 3109–3127. [Google Scholar] [CrossRef] [Green Version]
- Eastman, C.M.; Teicholz, P.M.; Sacks, R.; Lee, G. BIM Handbook: A Guide to Building Information Modeling for Owners, Managers, Designers, Engineers and Contractors, 3rd ed.; Wiley: Hoboken, NJ, USA, 2018. [Google Scholar]
- Murphy, M.; McGovern, E.; Pavia, S. Historic building information modelling (HBIM). Struct. Surv. 2009, 27, 311–327. [Google Scholar] [CrossRef] [Green Version]
- Aliero, M.S.; Asif, M.; Ghani, I.; Pasha, M.F.; Jeong, S.R. Systematic Review Analysis on Smart Building: Challenges and Opportunities. Sustainability 2022, 14, 3009. [Google Scholar] [CrossRef]
- Brunone, F.; Cucuzza, M.; Imperadori, M.; Vanossi, A. From Cognitive Buildings to Digital Twin: The Frontier of Digitalization for the Management of the Built Environment. In Wood Additive Technologies; In Springer Tracts in Civil Engineering; Springer International Publishing: Cham, Switzerland, 2021; pp. 81–95. [Google Scholar] [CrossRef]
- Davila, J.M.; Delgado Oyedele, L. Digital Twins for the built environment: Learning from conceptual and process models in manufacturing. Adv. Eng. Inform. 2021, 49, 101332. [Google Scholar] [CrossRef]
- Tang, S.; Shelden, D.R.; Eastman, C.M.; Pishdad-Bozorgi, P.; Gao, X. A review of building information modeling (BIM) and the internet of things (IoT) devices integration: Present status and future trends. Autom. Constr. 2019, 101, 127–139. [Google Scholar] [CrossRef]
- Zhang, F.; Chan AP, C.; Darko, A.; Chen, Z.; Li, D. Integrated applications of building information modeling and artificial intelligence techniques in the AEC/FM industry. Autom. Constr. 2022, 139, 104289. [Google Scholar] [CrossRef]
- UNI 11337-4:2017; Edilizia e Opere di Ingegneria Civile-GESTIONE Digitale dei Processi Informativi delle Costruzioni-Parte 4: Evoluzione e Sviluppo Informativo di Modelli, Elaborati e Oggetti. UNI: Milano, Italy, 2017.
- UNI EN ISO 19650-1:2019; Organizzazione e Digitalizzazione delle Informazioni Relative All’edilizia e alle opere di Ingegneria civile, Incluso il Building Information Modelling (BIM)-Gestione Informativa Mediante il Building Information Modelling-Parte 1: Concetti e Principi. UNI: Milano, Italy, 2019.
- De Wilde, P. Building performance simulation in the brave new world of artificial intelligence and digital twins: A systematic review. Energy Build. 2023, 292, 113171. [Google Scholar] [CrossRef]
- Borin, P.; Zanchetta, C. IFC: Processi e Modelli Digitali openBIM per L’ambiente Costruito; Maggioli Editore: Santarcangelo di Romagna, Italy, 2020. [Google Scholar]
- Marmo, R.; Polverino, F.; Nicolella, M.; Tibaut, A. Building performance and maintenance information model based on IFC schema. Autom. Constr. 2020, 118, 103275. [Google Scholar] [CrossRef]
- Hunhevicz, J.J.; Motie, M.; Hall, D.M. Digital building twins and blockchain for performance-based (smart) contracts. Autom. Constr. 2021, 133, 103981. [Google Scholar] [CrossRef]
- Succar, B.; Poirier, E. Lifecycle information transformation and exchange for delivering and managing digital and physical assets. Autom. Constr. 2020, 112, 103090. [Google Scholar] [CrossRef]
- Hosamo, H.H.; Nielsen, H.K.; Kraniotis, D.; Svennevig, P.R.; Svidt, K. Digital Twin framework for automated fault source detection and prediction for comfort performance evaluation of existing non-residential Norwegian buildings. Energy Build. 2023, 281, 12732. [Google Scholar] [CrossRef]
- Lu, Q.; Parlikad, A.K.; Woodall, P.; Don Ranasinghe, G. Developing a Digital Twin at Building and City Levels: Case Study of West Cambridge Campus. J. Manag. Eng. 2020, 36, 05020004. [Google Scholar] [CrossRef]
- Massachusetts Institute of Technology, from Plan to Action: MIT Campus Greenhouse Gas Emissions Reduction Strategy. 2017. Available online: https://sustainability.mit.edu/mit-campus-greenhouse-gas-emissions-reduction-strategy-published (accessed on 5 June 2023).
- Queen’s University, Queen’s University Greenhouse Gas Inverntory Report 2017, 2018c. Available online: https://www.queensu.ca/facilities/sites/facilwww/files/uploaded_files/Reports/Energy/GHG%202018%20Report.pdf (accessed on 5 June 2023).
- University of West England, Carbon Management Plan 2013–2020 (Version: 03). 2017. Available online: https://www.uwe.ac.uk/-/media/uwe/documents/about/sustainability/carbon-management-plan-2013-2020.pdf (accessed on 5 June 2023).
- Wadud, Z.; Royston, S.; Selby, J. Modelling energy demand from higher education institutions: A case study of the UK. Appl. Energy 2019, 233, 816–826. [Google Scholar] [CrossRef]
- Meschini, S.; Pellegrini, L.; Locatelli, M.; Accardo, D.; Tagliabue, L.C.; Di Giuda, G.M.; Avena, M. Toward cognitive digital twins using a BIM-GIS asset management system for a diffused university. Front. Built Environ. 2022, 8, 59475. [Google Scholar] [CrossRef]
- Grieves, M.W. Virtually Intelligent Product Systems: Digital and Physical Twins. In Complex Systems Engineering: Theory and Practice; Flumerfelt, S., Schwartz, K.G., Mavris, D., Briceno, S., Eds.; American Institute of Aeronautics and Astronautics, Inc.: Reston, VA, USA, 2019; pp. 175–200. [Google Scholar] [CrossRef]
- Tao, F.; Zhang, M.; Liu, W. Five-dimension digital twin model and its ten applications. Comput. Integr. Manuf. Syst. 2019, 25, 1–18. [Google Scholar]
- Tao, F.; Zhang, M.; Nee, A.Y.C. Digital Twin Driven Smart Manufacturing; Academic Press: London, UK, 2019. [Google Scholar]
- Grieves, M.W. Product lifecycle management: The new paradigm for enterprises. Int. J. Prod. Dev. 2005, 2, 71. [Google Scholar] [CrossRef]
- Qi, Q.; Tao, F.; Zuo, Y.; Zhao, D. Digital Twin Service towards Smart Manufacturing. Procedia CIRP 2018, 72, 237–242. [Google Scholar] [CrossRef]
- Batchelor, D.; Schnabel, M.A.; Dudding, M. Smart Heritage: Defining the Discourse. Heritage 2021, 4, 1005–1015. [Google Scholar] [CrossRef]
- Balaji, B.; Bhattacharya, A.; Fierro, G.; Gao, J.; Gluck, J.; Hong, D.; Johansen, A.; Koh, J.; Ploennigs, J.; Agarwal, Y.; et al. Brick: Metadata schema for portable smart building applications. Appl. Energy 2018, 226, 1273–1292. [Google Scholar] [CrossRef]
- Jabi, W.; Aish, R.; Lannon, S.; Chatzivasileiadi, A.; Wardhana, N.M. Topologic-A toolkit for spatial and topological modelling. In Proceedings of the eCAADe 2018 Conference: Computing for a better tomorrow, Łódź, Poland, 19–21 September 2018; pp. 449–458. [Google Scholar] [CrossRef]
- Rhino.Inside.Revit. Available online: https://www.rhino3d.com/inside/revit/beta/ (accessed on 5 June 2023).
- LadyBug Tools. Available online: https://www.ladybug.tools/ (accessed on 5 June 2023).
- University Planner. Available online: https://unibo.prod.up.cineca.it/calendarioPubblico/linkCalendarioId=5e9996a228a649001237296d (accessed on 5 June 2023).
- IFC.js. BIM Toolkit for JavaScript. Available online: https://ifcjs.github.io/info/ (accessed on 5 June 2023).
- Semprini, G.; Marinosci, C.; Ferrante, A.; Predari, G.; Mochi, G.; Garai, M.; Gulli, R. Energy management in public institutional and educational buildings: The case of the school of engineering and architecture in Bologna. Energy Build. 2016, 126, 365–374. [Google Scholar] [CrossRef]
- Bonomolo, M.; Di Lisi, S.; Leone, G. Building Information Modelling and Energy Simulation for Architecture Design. Appl. Sci. 2021, 11, 2252. [Google Scholar] [CrossRef]
- Panagiotidou, V.; Korner, A. From Intricate to Coarse and Back. A voxel-based workflow to approximate high-res geometries for digital environmental simulations. In Proceedings of the 40th eCAADe Conference, Ghent, Belgium, 13–17 September 2022; pp. 491–500. [Google Scholar]
- Costa, G.; Sicilia, A. Web technologies for sensor and energy data models. In Building and Semantics. Data Models and Web Technologies for the Built Environment; Pauwels, P., McGlinn, K., Eds.; CRC Press: Boca Raton, FL, USA, 2022; pp. 51–68. [Google Scholar]
- Chen, Y.; Guo, M.; Chen, Z.; Chen, Z.; Ji, Y. Physical energy and data-driven models in building energy prediction: A review. Energy Rep. 2022, 8, 2656–2671. [Google Scholar] [CrossRef]
- Mazzeo, D.; Matera, N.; Cornao, C.; Oliveti, G.; Romagnoni, P.; De Santoli, L. EnergyPlus, IDA ICE and TRNSYS predictive simulation accuracy for building thermal behaviour evaluation by using an experimental campaign in solar test boxes with and without a PCM module. Energy Build. 2020, 212, 109812. [Google Scholar] [CrossRef]
- De Wilde, P. The gap between predicted and measured energy performance of buildings: A framework for investigation. Autom. Constr. 2014, 41, 40–49. [Google Scholar] [CrossRef]


| Zone UID (BIM) | Zone Name (BIM) | Net Area (BIM) (m2) | Timestamp (Y–M–D H:M) | Occupancy Rate (SD) (%) | Heating Demand (BEM) (kWh) |
|---|---|---|---|---|---|
| ENG_ZN_P3-12 | Classroom 3.3 | 346.43 | 21 January 2022 09:00 | 0.85 | 10.20 |
| 21 January 2022 10:00 | 0.90 | 4.59 | |||
| ENG_ZN_P3-15 | Classroom 3.6 | 252.97 | 21 January 2022 09:00 | 0.00 | 4.13 |
| 21 January 2022 10:00 | 0.75 | 2.04 |
| Analysis Day | Natural Gas Cost | Electricity Cost | Emissions for Electricity Mixes | Emissions for Heat Production from Natural Gas |
|---|---|---|---|---|
| 23 February 2022 1 | 0.054 EUR/kWh 2 | 0.159 EUR/kWh 2 | 0.49 kgCO2eq/kWh 3 | 0.25 kgCO2eq/kWh 3 |
| Min Temperature | Mean Temperature | Max Temperature | Min Humidity | Max Humidity |
|---|---|---|---|---|
| 5.9 °C | 7.6 °C | 10.2 °C | 44% | 94% |
| Average Yearly Temperature | Hottest Yearly Temperature | Coldest Yearly Temperature | Annual Cumulative Horizontal Solar Radiation | Percentage of Diffuse Horizontal Solar Radiation |
|---|---|---|---|---|
| 13.0 °C | 31.7 °C | −3.1 °C | 1142.24 Wh/m2 | 53.7% |
| Gross Conditioned Area | Gross Unconditioned Area | Gross Conditioned Volume | Mean U-Value Opaque Envelope | Glazed/Opaque Envelope Surface Ratio |
|---|---|---|---|---|
| 18,738 m2 | 523 m2 | 81,382 m3 | 1.10 W/m2K | 29% |
| Dimensional KPIs | Energy KPIs | Cost KPIs | Emissions KPIs |
|---|---|---|---|
| Net area (sqm) Occupancy number at peak (people count) | Energy demanded for heating (kWh) Energy demanded for lighting (kWh) Energy demanded for equipment (kWh) Natural Gas demanded for heating (kWh) Electricity demanded for lighting and equipment (kWh) | Costs for heating (EUR) Costs for lighting (EUR) Costs for equipment (EUR) Total costs (EUR) | Equivalent emissions for heating (kgCO2eq) Equivalent emissions for lighting (kgCO2eq) Equivalent emissions for equipment (kgCO2eq) |
Disclaimer/Publisher’s Note: The statements, opinions and data contained in all publications are solely those of the individual author(s) and contributor(s) and not of MDPI and/or the editor(s). MDPI and/or the editor(s) disclaim responsibility for any injury to people or property resulting from any ideas, methods, instructions or products referred to in the content. |
© 2023 by the authors. Licensee MDPI, Basel, Switzerland. This article is an open access article distributed under the terms and conditions of the Creative Commons Attribution (CC BY) license (https://creativecommons.org/licenses/by/4.0/).
Share and Cite
Massafra, A.; Costantino, C.; Predari, G.; Gulli, R. Building Information Modeling and Building Performance Simulation-Based Decision Support Systems for Improved Built Heritage Operation. Sustainability 2023, 15, 11240. https://doi.org/10.3390/su151411240
Massafra A, Costantino C, Predari G, Gulli R. Building Information Modeling and Building Performance Simulation-Based Decision Support Systems for Improved Built Heritage Operation. Sustainability. 2023; 15(14):11240. https://doi.org/10.3390/su151411240
Chicago/Turabian StyleMassafra, Angelo, Carlo Costantino, Giorgia Predari, and Riccardo Gulli. 2023. "Building Information Modeling and Building Performance Simulation-Based Decision Support Systems for Improved Built Heritage Operation" Sustainability 15, no. 14: 11240. https://doi.org/10.3390/su151411240