


Optimizing Thermal Management System in Electric Vehicle Battery Packs for Sustainable Transportation


Mechanical Engineering Department, Faculty of Engineering and Quantity Surveying, INTI International University, Nilai 71800, Malaysia
*
Author to whom correspondence should be addressed.
Sustainability 2023, 15(15), 11822; https://doi.org/10.3390/su151511822
Submission received: 19 May 2023
/
Revised: 21 June 2023
/
Accepted: 21 June 2023
/
Published: 1 August 2023
(This article belongs to the Topic Advanced Battery Thermal Management Solution for Electric Vehicles)
Abstract
:The transportation sector is a significant contributor to greenhouse gas (GHG) emissions due to large energy consumption, which is why there is a need to promote the use of electric vehicles (EVs) to mitigate overall GHG emissions. To ensure market confidence towards EVs, battery packs’ energy storage capacity and thermal management system (TMS) must be optimized. Designing a battery pack that can withstand changes in temperature is essential to the TMS. In this study, we proposed two battery pack designs with cell arrangement angles of and , respectively, to investigate TMS. The CAD models were drawn, and simulations were performed using ANSYS Fluent with a mesh size of 0.005m. The computational fluid dynamics (CFD) analysis was conducted to obtain the maximum and average temperature and fluid flow velocity. Our results show that the 3 parallel and 8 series (3p8s) battery pack design with a cell arrangement angle of is the most feasible and can consistently perform in thermal management. This design also has 15% less volume than the cell arrangement of , allowing for more battery packs to be incorporated in the EV for a longer range of travel. Furthermore, this design can maintain the battery pack at its optimal operating temperature of 25 °C, reducing the incidence of battery runaway and ultimately lowering the EVs maintenance costs. The proposed design approach can serve as a basis for designing battery packs with optimized thermal management systems for EVs, contributing to the global effort to reduce GHG emissions.
1. Introduction
The pursuit of sustainability and the promotion of sustainable development have taken precedence in addressing the environmental, social, and economic challenges that humanity faces. As the world endeavors for a more sustainable future, electric vehicles (EVs) have emerged as a promising solution for the reduction of greenhouse gas emissions and the promotion of greener transportation systems. Nevertheless, the widespread adoption of EVs is heavily dependent on optimizing their performance, efficiency, and durability. Among the essential components of an EV, the battery pack stands out as a vital component for assuring the vehicle’s dependable operation and long life. As battery technology evolves, thermal management systems become increasingly important to maintain optimal performance and safety [1]. Effective thermal management not only improves battery performance, but also contributes to overall energy efficiency, range optimization, and battery life extension, thereby fostering sustainability in the transportation industry [2].
A big step forward in EV technology began after lithium-ion batteries (LIBs) achieved a breakthrough in terms of the high specific energy and power densities [3], high nominal voltage, low self-discharge rate [4], compact size and less weight [5], and also long cycle-life and no memory effect [6]. According to Zhao et al. [7], LIBs would continue to dominate the present commercial EV power battery market. Some researchers carried out a study on the prediction of the whole-life-cycle state of charge for LIBs, where the result shows that C7 and C8 batteries have reduced their capacity by 21.30% and 22.61%, respectively, after 200 cycles [8]. Additionally, a convolutional neural network prediction of the LIBs remaining useful life has been examined, and the results show a 94.20% accuracy rate [9]. Additionally, Hu et al. [10] proposed a fractional-order calculus to estimate the State of Charge (SOC) and State of Health (SOH) for LIBs. However, the experimental validation of the proposed method is limited to a single battery cell and does not consider the effects of temperature and current load on SOC and SOH estimation. Meanwhile, She et al. [11] carried out an experimental method to estimate the SOH with a root mean square error of 0.00955. As the size and the capacity of LIBs pack determines the range of EV travel in one charge, it is crucial to design a large capacity battery pack for the success of EV development [12]. The advancements discussed demonstrate the progress towards sustainable development in the EV industry.
Various approaches exist for managing heat transfer in battery pack design, including active, passive, and hybrid thermal management systems. For instance, Singirikonda and Obulesu [13] proposed a secondary loop liquid cooling method that effectively modulates temperature variations between battery cells, maintaining them within a range of less than 5 °C while reducing energy consumption. Meanwhile, Nazar et al. [14] implemented a passive thermal management system employing phase change material, which accelerates the rate of cooling of Li-ion batteries. On the other hand, Jin et al. [15] developed a novel hybrid thermal management system for electric vehicles, which achieved uniform heat distribution across the entire battery within a temperature range of 0.5 to 1.5 °C. From the past, it was shown that battery pack design would affect the thermal management system (TMS) of EVs. For instance, the most common design of battery packs is a combination of cylindrical LIBs cells in series and parallel to size up the capacity of the battery pack [16]. However, combining a large number of cells results in rapid temperature rising within the pack itself, and the thermal management system (TMS) plays a serious role [17]. Due to battery thermal runaways, there have been several incidents of EVs catching fire in accidents. One of the methods to solve this issue is to diagnose the abnormity of battery charging capacity. For example, Wang et al. [18] proposed a tree-based prediction model to analyze the error distribution of large sets of data.
On the other hand, the temperature, which is a very important factor, will affect several aspects of LIBs such as electrochemical behaviors and performance and ultimately the life-cycle cost [19]. The optimal operating temperatures for LIBs that given the highest cell potential performance are in the 20 to 40 °C range [20,21]. The three primary TMS types are Phase Change Material (PCM), liquid cooling, and air cooling. Among these three TMS types, liquid cooling has been proven the most effective to cool LIBs packs due to its capacity to absorb more heat with a lower volume of design [22]. For instance, Tousi et al. [23] have proposed a AgO nanofluid as a coolant for NCR18650BF and NCR21700A type of lithium-ion batteries (LIBs), whereas Sheng et al. [24] proposed a cellular cooling jacket (CCJ) with 2 mm diameter holes for liquid to flow in between the battery pack. Due to its limited heat absorption capacity, air cooling requires high velocity, which requires the use of a pump. Consequently, air cooling systems cannot compete with liquid cooling systems in terms of design simplicity and weight [25]. However, the air cooling system by Bisht et al. [26] could be optimized using vortex generator with an attack angle of 30° based on the simulation result. While PCM functions as a passive system without fans or a manifold, its cooling performance is inferior to that of both liquid and air cooling systems [27].
The literature indicates that several studies on EV in relation to TMS performance have been conducted. In order to assess the TMS performance, several studies additionally looked into the layout of the cell arrangement in battery packs, including 3p5s [16] and 6s4p [28]. Their research showed that phase change material (PCM) in the thermal management system yields different behavior. Additionally, Xia, Wang, Ren, Sun, Yang, and Feng [16] found out that the arrangement of cells will influence the flow field, which will also have an impact on the temperature distribution and the reliability of a battery pack. Although Liu et al. [29] had suggested a unique TMS for battery packs, this approach has only been tested on the hybrid EV, with a coefficient of performance of 0.225. In addition, this study did not evaluate the performance of the proposed system under various operating conditions, such as different driving modes and ambient temperatures. Hence, the scope of this research focuses on battery pack cell configurations in relation to TMS performance under different ambient temperatures. A comparison of battery energy storage was performed on two battery packs namely Panasonic NCR18650BF and Panasonic NCR21700A. The two battery packs with the best performance were chosen for detailed analysis, which would evaluate the thermal transfer rate and thermal distribution within the battery module. Then, using ANSYS, CFD analysis is performed by measuring and evaluating variables like maximum and average cell temperature as well as fluid flow velocity. At the end of this research, a novel battery pack cell arrangement is developed which leads to more economic, efficient, and comfortable mobility of EVs. The significance of this research lies in the fact that the proposed design permits greater battery pack integration and an extended travel range with 15% less volume. The result also showed that the battery temperature can be maintained within a reasonable range with an efficient cooling system.
The paper is organized into various sections. Section 1 provides an overview of the significance and difficulties associated with thermal management systems in battery packs for EVs. The study’s methodology is described in Section 2, including collecting data, preprocessing, and multi-physics modeling. Section 3 discusses the results obtained from the TMS simulation using the methodology described in Section 2. The results are also compared with the existing literature, where the novelty of the research is highlighted in this section as well. Finally, Section 4 concludes by highlighting the significance of the findings and provides suggestions for future research directions.
2. Methodology
This section describes the broad framework of the TMS analysis for lithium-ion battery packs. Figure 1 illustrates the five phases that comprise the framework.
2.1. Data Collection and Pre-Processing
In this research, there are two types of battery models considered, which are Panasonic NCR18650BF and Panasonic NCR21700A. To examine the best battery model to analyze in this study, we have benchmarked the Tesla Model S 100D with a consumption of 18.9 kWh/100 km and assume the cells discharge up to 90% of their capacity for a longer life cycle. The accepted range of battery length to wheelbase (BL/WL) ratio is 0.65 as reported in Sankaran and Venkatesan [30], which can lead to improved design efficiency and compatibility. Therefore, with the battery length of 1.737 m in this design, the vehicle’s wheelbase should be less than or equal to 2.672 m. The battery length to wheelbase ratio is a critical parameter as it determines the dimension of the battery envelope that can be installed between the front and rear axle in the longitudinal direction [30]. The parameter of the cell’s model as referred to by Tousi, Sarchami, Kiani, Najafi and Houshfar [23], Waldmann et al. [31], and Zülke et al. [32] is tabulated in Table 1.
The parameter of the cell model will be used as a basis to compute the desired range of the necessary data, including the final pack energy, the energy needed for one module, the total voltage, the capacity, the current, and the system power. Equations (1)–(8) are used to calculate the necessary parameters.
2.2. Multi-Physics Modeling and TMS Design
The sizing of the battery was calculated to determine the appropriate arrangement of cells in series and parallel. The calculations indicate that 55 cells in parallel and 8 cells in series are necessary to achieve the required capacity of 126 kWh. The most suitable battery model between NCR18500BF and NCR21700A will be chosen for the TMS simulation. The wall in contact with air is configured for convection heat transfer while the ambient temperature ranges from 25 to 30 °C [33]. Table 2 presents the boundary conditions utilized in the simulation.
The battery pack investigated in this study consists of 55 parallel cells and 8 series cells. Nevertheless, since the heat generation and transfer of the system are comparable, ANSYS is used to simulate the cell’s connection of 3 parallel and 8 series (3p8s) at angles and , where is the cell’s arrangement angle. The dimensions and the cell’s arrangement of the model is illustrated in Figure 2. According to Liu et al. [34], the packing density is affected by the cell arrangement angle. According to the findings of their research, generated higher structural stiffness compared to , but the volume of the cell’s arrangement with an angle of is 15% lesser compared to . This means that the cell’s arrangement with is preferable if the thermal performance of is on par with as it can help reduce the overall expense of the EV, making it more affordable for consumers. To prove this, Computational Fluid Dynamic (CFD) simulation is conducted in this research with the aid of ANSYS Fluent.
To obtain accurate and optimal computational time, a grid independence test is performed by changing the meshing size. The specified number of repetitions is likewise adequate to see how the simulated outcome improves. Figure 3 shows the graph of average flow rate of the fluid versus meshing size in the 3p8s model.
Based on Figure 3, meshing size of the 3p8s model is reduced from 0.01 m to 0.003 m. The grid independence test revealed that a mesh size of 0.005 m produces accurate results while minimizing computational time, reaching the optimal balance between precision and efficiency. Therefore, this mesh size can be recommended as the optimal option for efficiently obtaining accurate results for the investigated problem. All objects were named appropriately to differentiate between active and inactive components. The simulation was run for 30 iterations with convection heat transfer occurring on the wall’s contact surface with the air, while the contact surfaces of the walls were coupled. One of the examples of meshing models for the cell arrangement of is shown in Figure 4, along with the names of the component parts on the right panel.
3. Results and Discussion
Since there are two battery models being considered in this research, the calculation is carried out to evaluate the performance. Table 3 shows the summary result obtained for Panasonic NCR18650BF and Panasonic NCR21700A.
This study found that the NCR21700A model is more efficient in producing energy, requiring only 7040 cells compared to the 10496 cells needed for the NCR18650BF model to produce the same amount of energy (Table 3). This novel finding has led to further analysis of the NCR21700A model. Researchers developed a cooling tube using water as a medium to remove heat generated by the cells. The simulation focuses on parameters such as the potential of cells, the maximum, and the average temperature of cells. Section 3.1 and Section 3.2 present the results obtained for different cell arrangements of the 3p8s model, which shed new light on the potential of this technology.
3.1. Temperature Contour and Velocity Path Line of 3p8s Model with
As described in Section 3, the simulation is run with a meshing size of 0.01 m by default and 30 iterations; it was discovered, however, that despite the shorter computational time, a meshing size of 0.01 m is unable to produce an accurate output. To obtain accurate and optimal computational time, the meshing size was finally adjusted to 0.0005 m after multiple tries. The specified number of repetitions is likewise adequate to see how the simulated outcome improves. Figure 5 shows the temperature contour of the 3p8s model with .
The research findings, depicted in Figure 5, reveal that the busbar, where the current and potential of cells are concentrated, exhibits the highest temperature in the red region. Conversely, the water shows the lowest temperature in the blue highlighted region. The busbar’s position and its lack of direct contact with the cooling tube cause the high temperature. Additionally, the simulation data show an even temperature distribution of cells, as indicated by the similar temperature contour pattern. The cells’ maximum and average temperatures are 298.157 K and 298.040 K, respectively, with a negligible difference of 0.117 K between them. These results confirm the stable operation of cells under these conditions. Moreover, the velocity path line of the 3p8s model with is depicted in Figure 6, providing further insights into the research findings.
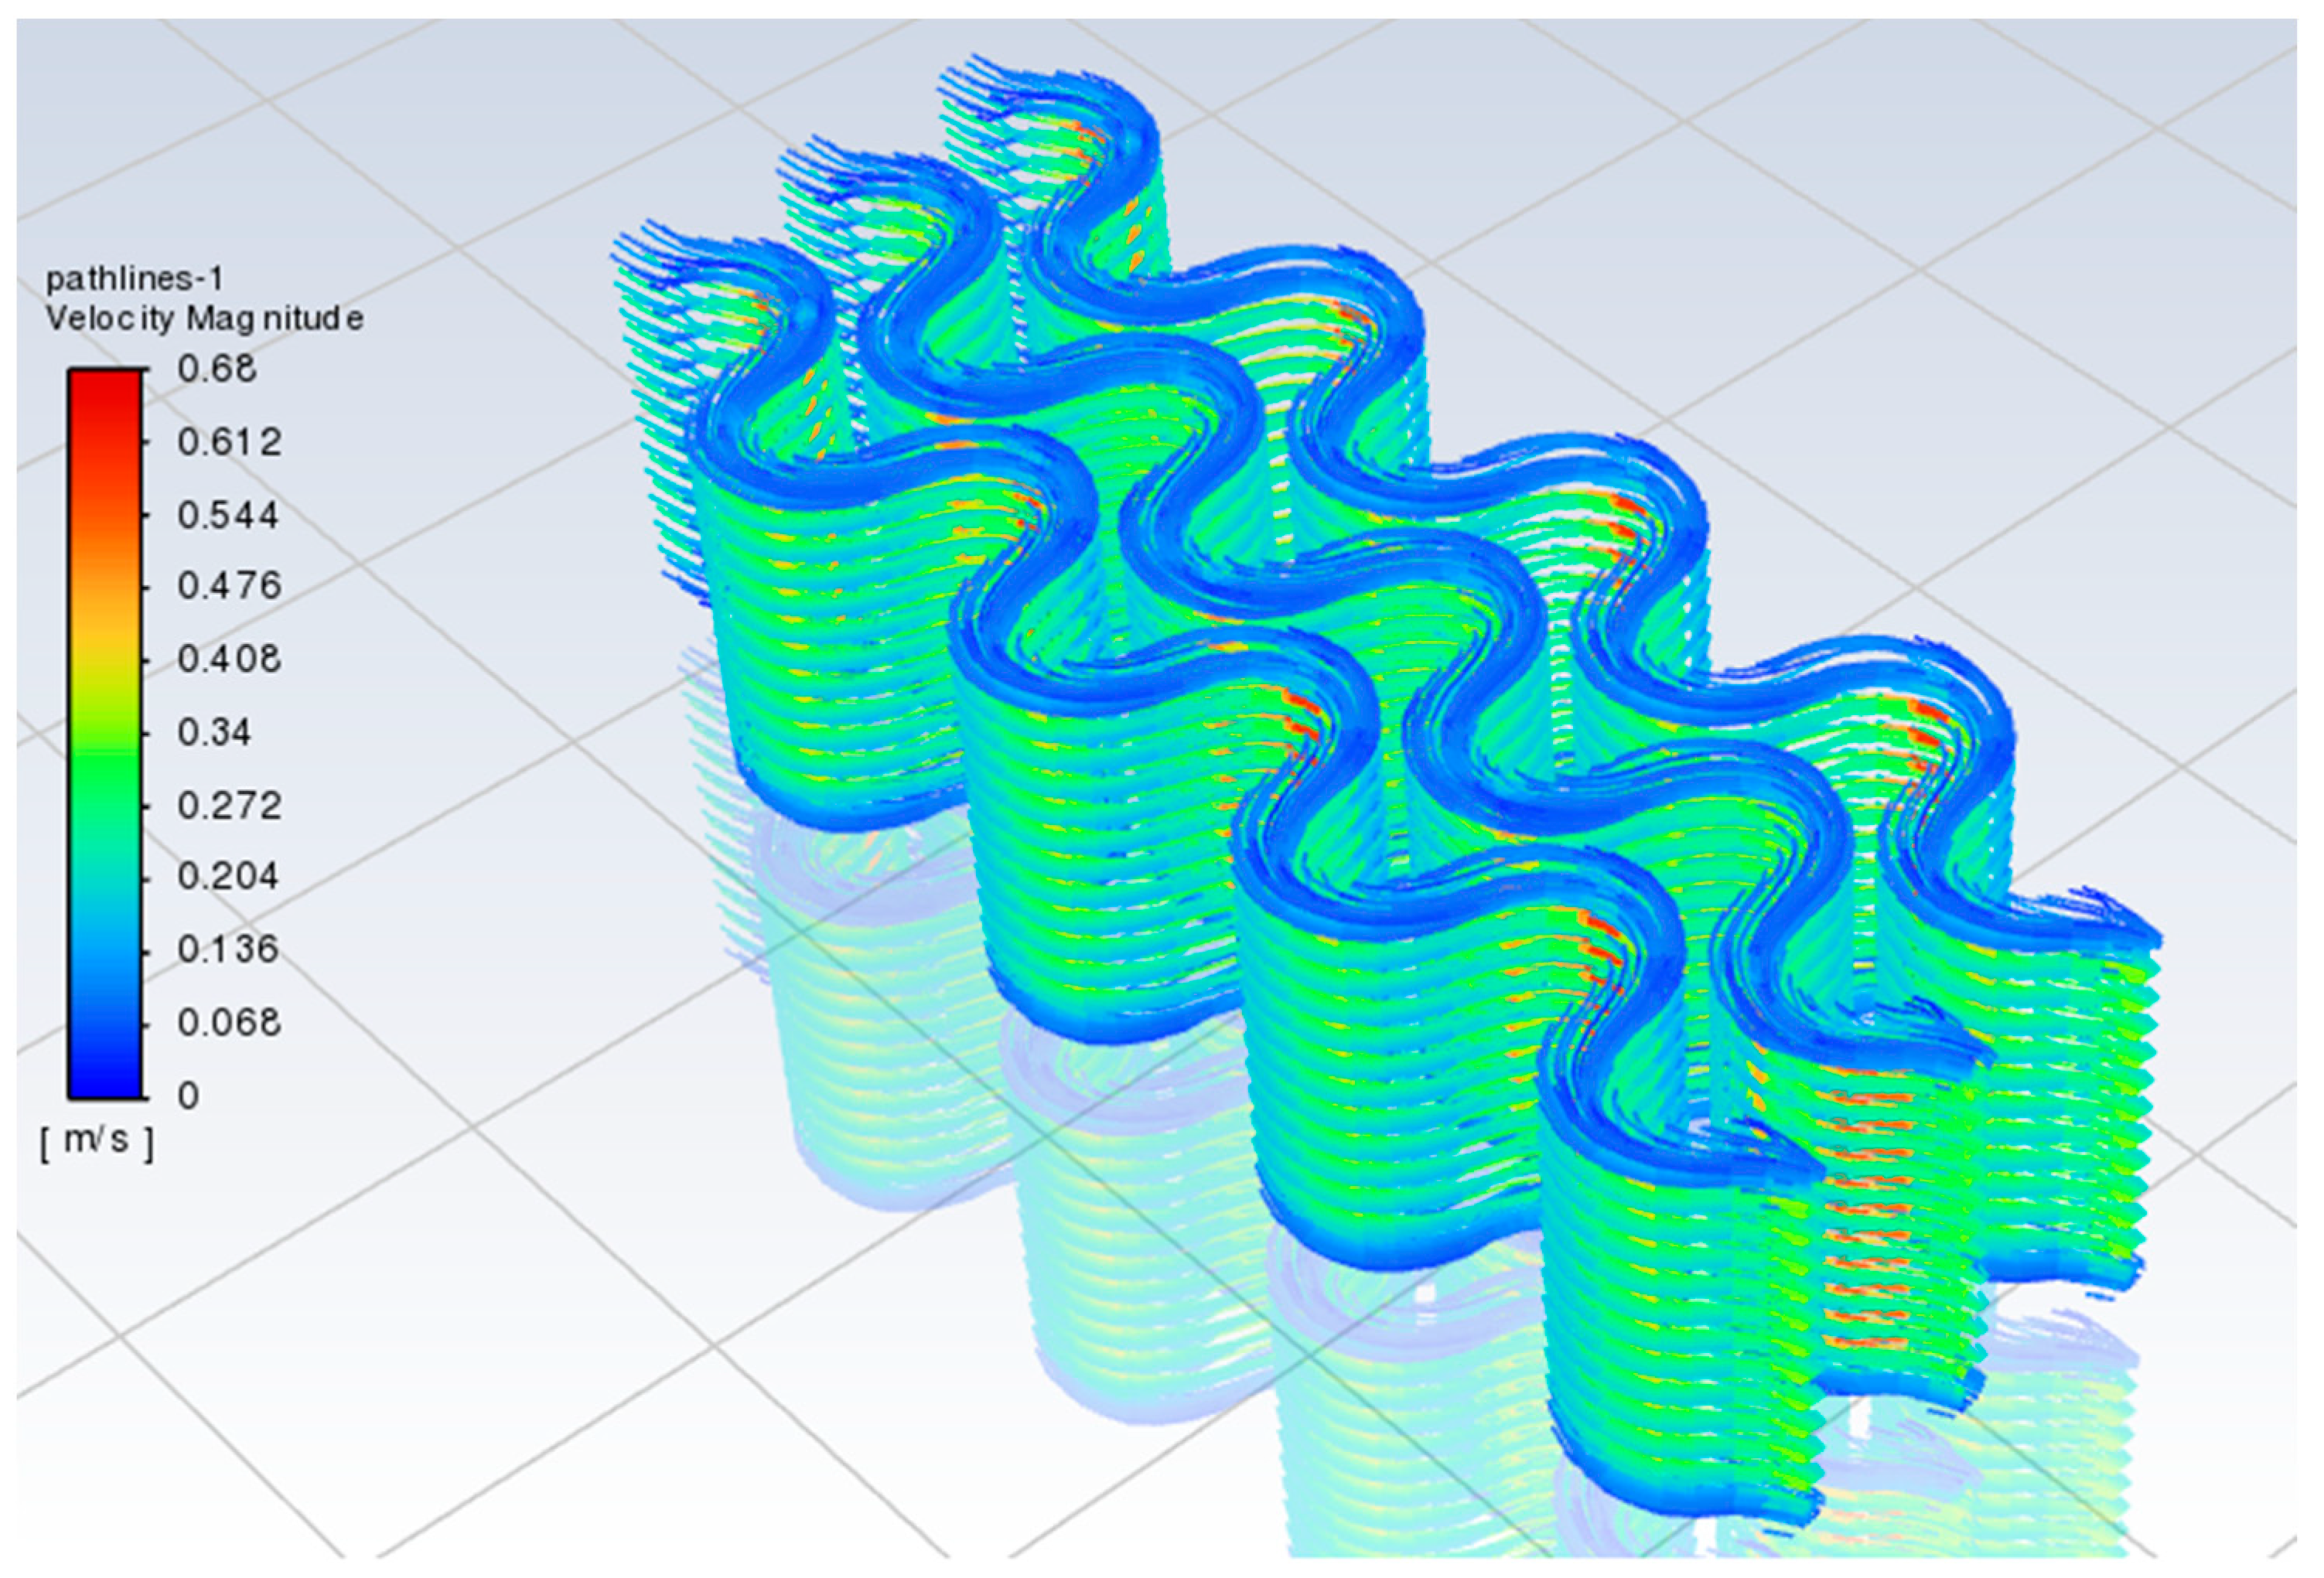
The simulation results, depicted in Figure 6, revealed that the velocity magnitude of the water ranged from 0.0637 m/s to 0.637 m/s. The average velocity of the water was found to be 0.508 m/s, which was higher than the inlet velocity. The cooling tube design was responsible for increasing the velocity of the water, especially near the peak of the curve, where a maximum velocity of 0.637 m/s was observed. The enhanced velocity led to increased cooling efficiency as the water absorbed heat from the cells and left the battery pack before being replaced with cooler water. Overall, the results suggest that the cooling tube design with water as a medium could effectively cool the battery pack, improving its performance and lifespan.
3.2. Temperature Contour and Velocity Path Line of 3p8s model with
The simulated result of the temperature profile and the velocity path line of the 3p8s model with is discussed in this subsection. For instance, the temperature contour of the 3p8s model with is shown in Figure 7.
The results, as presented in Figure 7, demonstrate that the maximum temperature is concentrated at the busbar while the minimum temperature is at the water region. This finding is noteworthy as it highlights the significance of the design of the cooling tube that utilizes water to effectively dissipate heat generated by the cells. Moreover, the study also reveals that the temperature distribution across cells is even and stable, as shown by the small difference between the maximum and average temperature. These novel findings are essential for assuring the battery pack’s safe and efficient operation. Additionally, the velocity path line of the 3p8s model with , as shown in Figure 8, provides a comprehensive visualization of the flow of the cooling water inside the battery pack.
The simulation results, depicted in Figure 8, reveal a novel finding: the average velocity of water in the cooling tube is 0.492 m/s, which is lower than that of the 3p8s model with θ = π⁄3. This is attributed to the longer length of the cooling tube in the current model, which slows down the water flow. However, the maximum velocity at the peak of the cooling tube is 0.68 m/s, which does not significantly impact the overall system performance. These findings are summarized in Table 4 in the next subsection, which compares the results of the 3p8s models with and , providing new insights into the impact of cooling tube length on water velocity in battery thermal management systems.
3.3. Comparison of Results
The efficiency of a battery greatly relies on the operating temperature; the optimum working temperature of LIBs is said to be between 20 °C to 40 °C [20]. Therefore, the TMS of a battery pack has a very critical role in this field to ensure the working of the LIBs pack is at optimum performance to prolong its lifetime. To choose the best design in this research, a comparison of results was carried out to evaluate the performance of the two models. The simulation result of the two models is summarized and tabulated in Table 4.
The results from Table 4 demonstrate the significant impact of cell arrangement angle on the maximum and average cell temperature in both 3p8s and 3p5s models. The cell arrangement with shows lower maximum and average cell temperature compared to , and the latter arrangement increases the cell’s potential by 60%. Additionally, the 3p8s model with is more space-efficient than the 3p8s model with . While both designs maintain the cell temperature under the optimum working temperature of LIBs, the 3p8s model with exhibits a slightly greater average temperature and fluid velocity than the 3p8s model with , indicating its superior performance. Notably, this study’s findings surpass those proposed by Xia, Wang, Ren, Sun, Yang and Feng [16], highlighting the importance of cell arrangement and fluid flow velocity in the design of efficient thermal management systems for LIBs.
Additionally, the Reynolds number of the fluid flow in the tube using Equation (9) is tabulated in Table 5.
where Reynolds number, average velocity of the fluid, Characteristic length, and dynamic viscosity of the fluid [35]. As shown in Table 5, the Reynolds number for all cell configurations is greater than 3500, indicating a turbulence flow. The y+ value of the turbulence model has also been tabulated in Table 5, which shows the range of 38.88 to 70.71. Since this turbulence model employs k-omega, the range of y+ values from 30 to 300 is appropriate for near-wall treatment.
Based on the numerical simulations conducted, the novelty of the findings is listed as below:
- Recognizing the significance of increasing fluid flow velocity to sustain optimal cell temperature;
- As the temperature of a fluid rises, its density decreases and the frictional force against the wall increases at a lower velocity;
- To address the density variation issue, use water with a high specific heat capacity as a coolant;
- Observation that water’s density remains nearly constant as its temperature varies minimally;
- Evidence of uniform and effective heat distribution along the cooling conduit, indicating the design’s viability;
- Emphasizing that the velocity of water only varies at the peak of the cooling tube, indicating the cooling tube’s practicality;
- Noting that the average flow velocity of this design does not vary exponentially throughout the flow.
4. Conclusions
The study has successfully achieved its aim of optimizing the performance of a 126 kWh battery pack made up of 7040 cells of the NCR21700A type. The battery pack’s performance was found to be superior when the cells were arranged in 3 parallel and 8 series at an angle of , which resulted in a 15% smaller size compared to the straight cell’s arrangement of . Additionally, the research has demonstrated the importance of maintaining the cell’s temperature within the optimum operating temperature of LIBs to prolong its lifetime and mitigate the chances of cell replacement. The study has also highlighted the critical role of surface contact area between the cell and the coolant in the cooling effectiveness, with the turbulence flow type and an average velocity of around 0.5 m/s proving to be effective throughout the cooling process. These findings are consistent with the principles of sustainable development by optimizing energy storage performance, minimizing resource consumption, and fostering operational efficiency in battery pack design.
Moving forward, there are numerous suggestions for future research in this field. First, it would be beneficial to concentrate on battery management systems (BMS) to boost the overall performance and efficacy of battery packs. The investigation of advanced BMS algorithms, state-of-charge estimation techniques, and thermal management strategies can further optimize the operation of the battery pack and extend its lifespan. In addition, future research could focus on enhancing the design of battery pack enclosures. Exploring novel materials and structures that improve heat dissipation, reduce weight, and improve thermal management can contribute to further enhancing the performance and security of battery packs. In a nutshell, although future research should investigate battery management systems, battery pack enclosures, and emerging cell technologies, the results of this study provide valuable insights and suggestions for optimizing battery pack designs in EVs. Implementation of the findings may result in improved performance, increased efficiency, and enhanced dependability, thereby contributing to the widespread adoption of EVs and the transition to a greener and more sustainable transportation system.
Author Contributions
Conceptualization, C.K.C. and C.H.C.; methodology, C.K.C. and C.H.C.; software, C.K.C. and C.H.C.; validation, C.K.C. and C.H.C.; formal analysis, C.K.C. and C.H.C.; investigation, C.H.C.; resources, C.K.C.; data curation, C.H.C.; writing—original draft preparation, C.K.C. and C.H.C.; writing—review and editing, C.K.C.; visualization, C.K.C. and C.H.C.; supervision, C.K.C. and J.R.; project administration, J.R.; funding acquisition, C.K.C. All authors have read and agreed to the published version of the manuscript.
Funding
This research received no external funding.
Institutional Review Board Statement
Not applicable.
Informed Consent Statement
Not applicable.
Data Availability Statement
Data is contained within the article.
Conflicts of Interest
The authors declare no conflict of interest.
References
- Olabi, A.G.; Maghrabie, H.M.; Adhari, O.H.K.; Sayed, E.T.; Yousef, B.A.A.; Salameh, T.; Kamil, M.; Abdelkareem, M.A. Battery thermal management systems: Recent progress and challenges. Int. J. Thermofluids 2022, 15, 100171. [Google Scholar] [CrossRef]
- Yokoyama, A. Thermal Management System for Electric Vehicles. SAE Int. J. Mater. Manuf. 2011, 4, 1277–1285. [Google Scholar] [CrossRef]
- Ling, Z.; Wang, F.; Fang, X.; Gao, X.; Zhang, Z. A hybrid thermal management system for lithium ion batteries combining phase change materials with forced-air cooling. Appl. Energy 2015, 148, 403–409. [Google Scholar] [CrossRef] [Green Version]
- Ritchie, A.; Howard, W. Recent developments and likely advances in lithium-ion batteries. J. Power Sources 2006, 162, 809–812. [Google Scholar] [CrossRef]
- Arfeen, Z.A.; Abdullah, M.P.; Hassan, R.; Othman, B.M.; Siddique, A.; Rehman, A.U.; Sheikh, U.U. Energy storage usages: Engineering reactions, economic-technological values for electric vehicles—A technological outlook. Int. Trans. Electr. Energy Syst. 2020, 30, e12422. [Google Scholar] [CrossRef]
- Ye, Y.; Saw, L.H.; Shi, Y.; Tay, A.A.O. Numerical analyses on optimizing a heat pipe thermal management system for lithium-ion batteries during fast charging. Appl. Therm. Eng. 2015, 86, 281–291. [Google Scholar] [CrossRef]
- Zhao, G.; Wang, X.; Negnevitsky, M. Connecting battery technologies for electric vehicles from battery materials to management. iScience 2022, 25, 103744. [Google Scholar] [CrossRef]
- Wang, S.; Takyi-Aninakwa, P.; Jin, S.; Yu, C.; Fernandez, C.; Stroe, D.-I. An improved feedforward-long short-term memory modeling method for the whole-life-cycle state of charge prediction of lithium-ion batteries considering current-voltage-temperature variation. Energy 2022, 254, 124224. [Google Scholar] [CrossRef]
- Wang, S.; Jin, S.; Bai, D.; Fan, Y.; Shi, H.; Fernandez, C. A critical review of improved deep learning methods for the remaining useful life prediction of lithium-ion batteries. Energy Rep. 2021, 7, 5562–5574. [Google Scholar] [CrossRef]
- Hu, X.; Yuan, H.; Zou, C.; Li, Z.; Zhang, L. Co-Estimation of State of Charge and State of Health for Lithium-Ion Batteries Based on Fractional-Order Calculus. IEEE Trans. Veh. Technol. 2018, 67, 10319–10329. [Google Scholar] [CrossRef]
- She, C.; Zhang, L.; Wang, Z.; Sun, F.; Liu, P.; Song, C. Battery State of Health Estimation Based on Incremental Capacity Analysis Method: Synthesizing from Cell-Level Test to Real-World Application. IEEE J. Emerg. Sel. Top. Power Electron. 2021, 11, 214–223. [Google Scholar] [CrossRef]
- Sharma, S.; Panwar, A.K.; Tripathi, M.M. Storage technologies for electric vehicles. J. Traffic Transp. Eng. Engl. Ed. 2020, 7, 340–361. [Google Scholar] [CrossRef]
- Singirikonda, S.; Obulesu, Y.P. Adaptive secondary loop liquid cooling with refrigerant cabin active thermal management system for electric vehicle. J. Energy Storage 2022, 50, 104624. [Google Scholar] [CrossRef]
- Nazar, M.W.; Iqbal, N.; Ali, M.; Nazir, H.; Amjad, M.Z.B. Thermal management of Li-ion battery by using active and passive cooling method. J. Energy Storage 2023, 61, 106800. [Google Scholar] [CrossRef]
- Jin, L.; Tian, J.; Gao, S.; Xie, P.; Akbarzadeh, M.; Kalogiannis, T.; Berecibar, M.; Lan, Y.; Hu, D.; Ding, Y.; et al. A novel hybrid thermal management approach towards high-voltage battery pack for electric vehicles. Energy Convers. Manag. 2021, 247, 114676. [Google Scholar] [CrossRef]
- Xia, Q.; Wang, Z.; Ren, Y.; Sun, B.; Yang, D.; Feng, Q. A reliability design method for a lithium-ion battery pack considering the thermal disequilibrium in electric vehicles. J. Power Sources 2018, 386, 10–20. [Google Scholar] [CrossRef]
- Rao, Z.; Huo, Y.; Liu, X. Experimental study of an OHP-cooled thermal management system for electric vehicle power battery. Exp. Therm. Fluid Sci. 2014, 57, 20–26. [Google Scholar] [CrossRef]
- Wang, Z.; Song, C.; Zhang, L.; Zhao, Y.; Liu, P.; Dorrell, D.G. A Data-Driven Method for Battery Charging Capacity Abnormality Diagnosis in Electric Vehicle Applications. IEEE Trans. Transp. Electrif. 2022, 8, 990–999. [Google Scholar] [CrossRef]
- Rao, Z.; Wang, S.; Wu, M.; Lin, Z.; Li, F. Experimental investigation on thermal management of electric vehicle battery with heat pipe. Energy Convers. Manag. 2013, 65, 92–97. [Google Scholar] [CrossRef]
- Panchal, S.; Dincer, I.; Agelin-Chaab, M.; Fowler, M.; Fraser, R. Uneven temperature and voltage distributions due to rapid discharge rates and different boundary conditions for series-connected LiFePO4 batteries. Int. Commun. Heat Mass Transf. 2017, 81, 210–217. [Google Scholar] [CrossRef]
- Xiong, R.; Li, Z.; Yang, R.; Shen, W.; Ma, S.; Sun, F. Fast self-heating battery with anti-aging awareness for freezing climates application. Appl. Energy 2022, 324, 119762. [Google Scholar] [CrossRef]
- Jin, L.W.; Lee, P.S.; Kong, X.X.; Fan, Y.; Chou, S.K. Ultra-thin minichannel LCP for EV battery thermal management. Appl. Energy 2014, 113, 1786–1794. [Google Scholar] [CrossRef]
- Tousi, M.; Sarchami, A.; Kiani, M.; Najafi, M.; Houshfar, E. Numerical study of novel liquid-cooled thermal management system for cylindrical Li-ion battery packs under high discharge rate based on AgO nanofluid and copper sheath. J. Energy Storage 2021, 41, 102910. [Google Scholar] [CrossRef]
- Sheng, L.; Zhang, H.; Su, L.; Zhang, Z.; Zhang, H.; Li, K.; Fang, Y.; Ye, W. Effect analysis on thermal profile management of a cylindrical lithium-ion battery utilizing a cellular liquid cooling jacket. Energy 2021, 220, 119725. [Google Scholar] [CrossRef]
- Park, H. A design of air flow configuration for cooling lithium ion battery in hybrid electric vehicles. J. Power Sources 2013, 239, 30–36. [Google Scholar] [CrossRef]
- Bisht, A.S.; Bisht, V.S.; Bhandari, P.; Rawat, K.S.; Alam, T.; Blecich, P. The Use of a Vortex Generator for the Efficient Cooling of Lithium-Ion Batteries in Hybrid Electric Vehicles. Processes 2023, 11, 500. [Google Scholar] [CrossRef]
- Lin, C.; Xu, S.; Chang, G.; Liu, J. Experiment and simulation of a LiFePO4 battery pack with a passive thermal management system using composite phase change material and graphite sheets. J. Power Sources 2015, 275, 742–749. [Google Scholar] [CrossRef]
- Lamrani, B.; Lebrouhi, B.E.; Khattari, Y.; Kousksou, T. A simplified thermal model for a lithium-ion battery pack with phase change material thermal management system. J. Energy Storage 2021, 44, 103377. [Google Scholar] [CrossRef]
- Liu, H.; Wen, C.; Yuen, A.C.Y.; Han, Y.; Cheung, S.C.-P.; Kook, S.; Yeoh, G.H. A novel thermal management system for battery packs in hybrid electrical vehicles utilising waste heat recovery. Int. J. Heat Mass Transf. 2022, 195, 123199. [Google Scholar] [CrossRef]
- Sankaran, G.; Venkatesan, S. Standardization of electric vehicle battery pack geometry form factors for passenger car segments in India. J. Power Sources 2021, 502, 230008. [Google Scholar] [CrossRef]
- Waldmann, T.; Scurtu, R.-G.; Richter, K.; Wohlfahrt-Mehrens, M. 18650 vs. 21700 Li-ion cells—A direct comparison of electrochemical, thermal, and geometrical properties. J. Power Sources 2020, 472, 228614. [Google Scholar] [CrossRef]
- Zülke, A.; Li, Y.; Keil, P.; Burrell, R.; Belaisch, S.; Nagarathinam, M.; Mercer, M.P.; Hoster, H.E. High-Energy Nickel-Cobalt-Aluminium Oxide (NCA) Cells on Idle: Anode- versus Cathode-Driven Side Reactions. Batter. Supercaps 2021, 4, 934–947. [Google Scholar] [CrossRef]
- Yatim, A.N.M.; Latif, M.T.; Sofwan, N.M.; Ahamad, F.; Khan, M.F.; Mahiyuddin, W.R.W.; Sahani, M. The association between temperature and cause-specific mortality in the Klang Valley, Malaysia. Environ. Sci. Pollut. Res. 2021, 28, 60209–60220. [Google Scholar] [CrossRef] [PubMed]
- Liu, B.; Zhang, J.; Zhang, C.; Xu, J. Mechanical integrity of 18650 lithium-ion battery module: Packing density and packing mode. Eng. Fail. Anal. 2018, 91, 315–326. [Google Scholar] [CrossRef] [Green Version]
- Ali, N.; Addali, A.; Amaral Teixeira, J. Effect of Water Temperature, pH Value, and Film Thickness on the Wettability Behaviour of Copper Surfaces Coated with Copper Using EB-PVD Technique. J. Nano Res. 2019, 60, 124–141. [Google Scholar] [CrossRef]
Figure 1.
Research Framework.
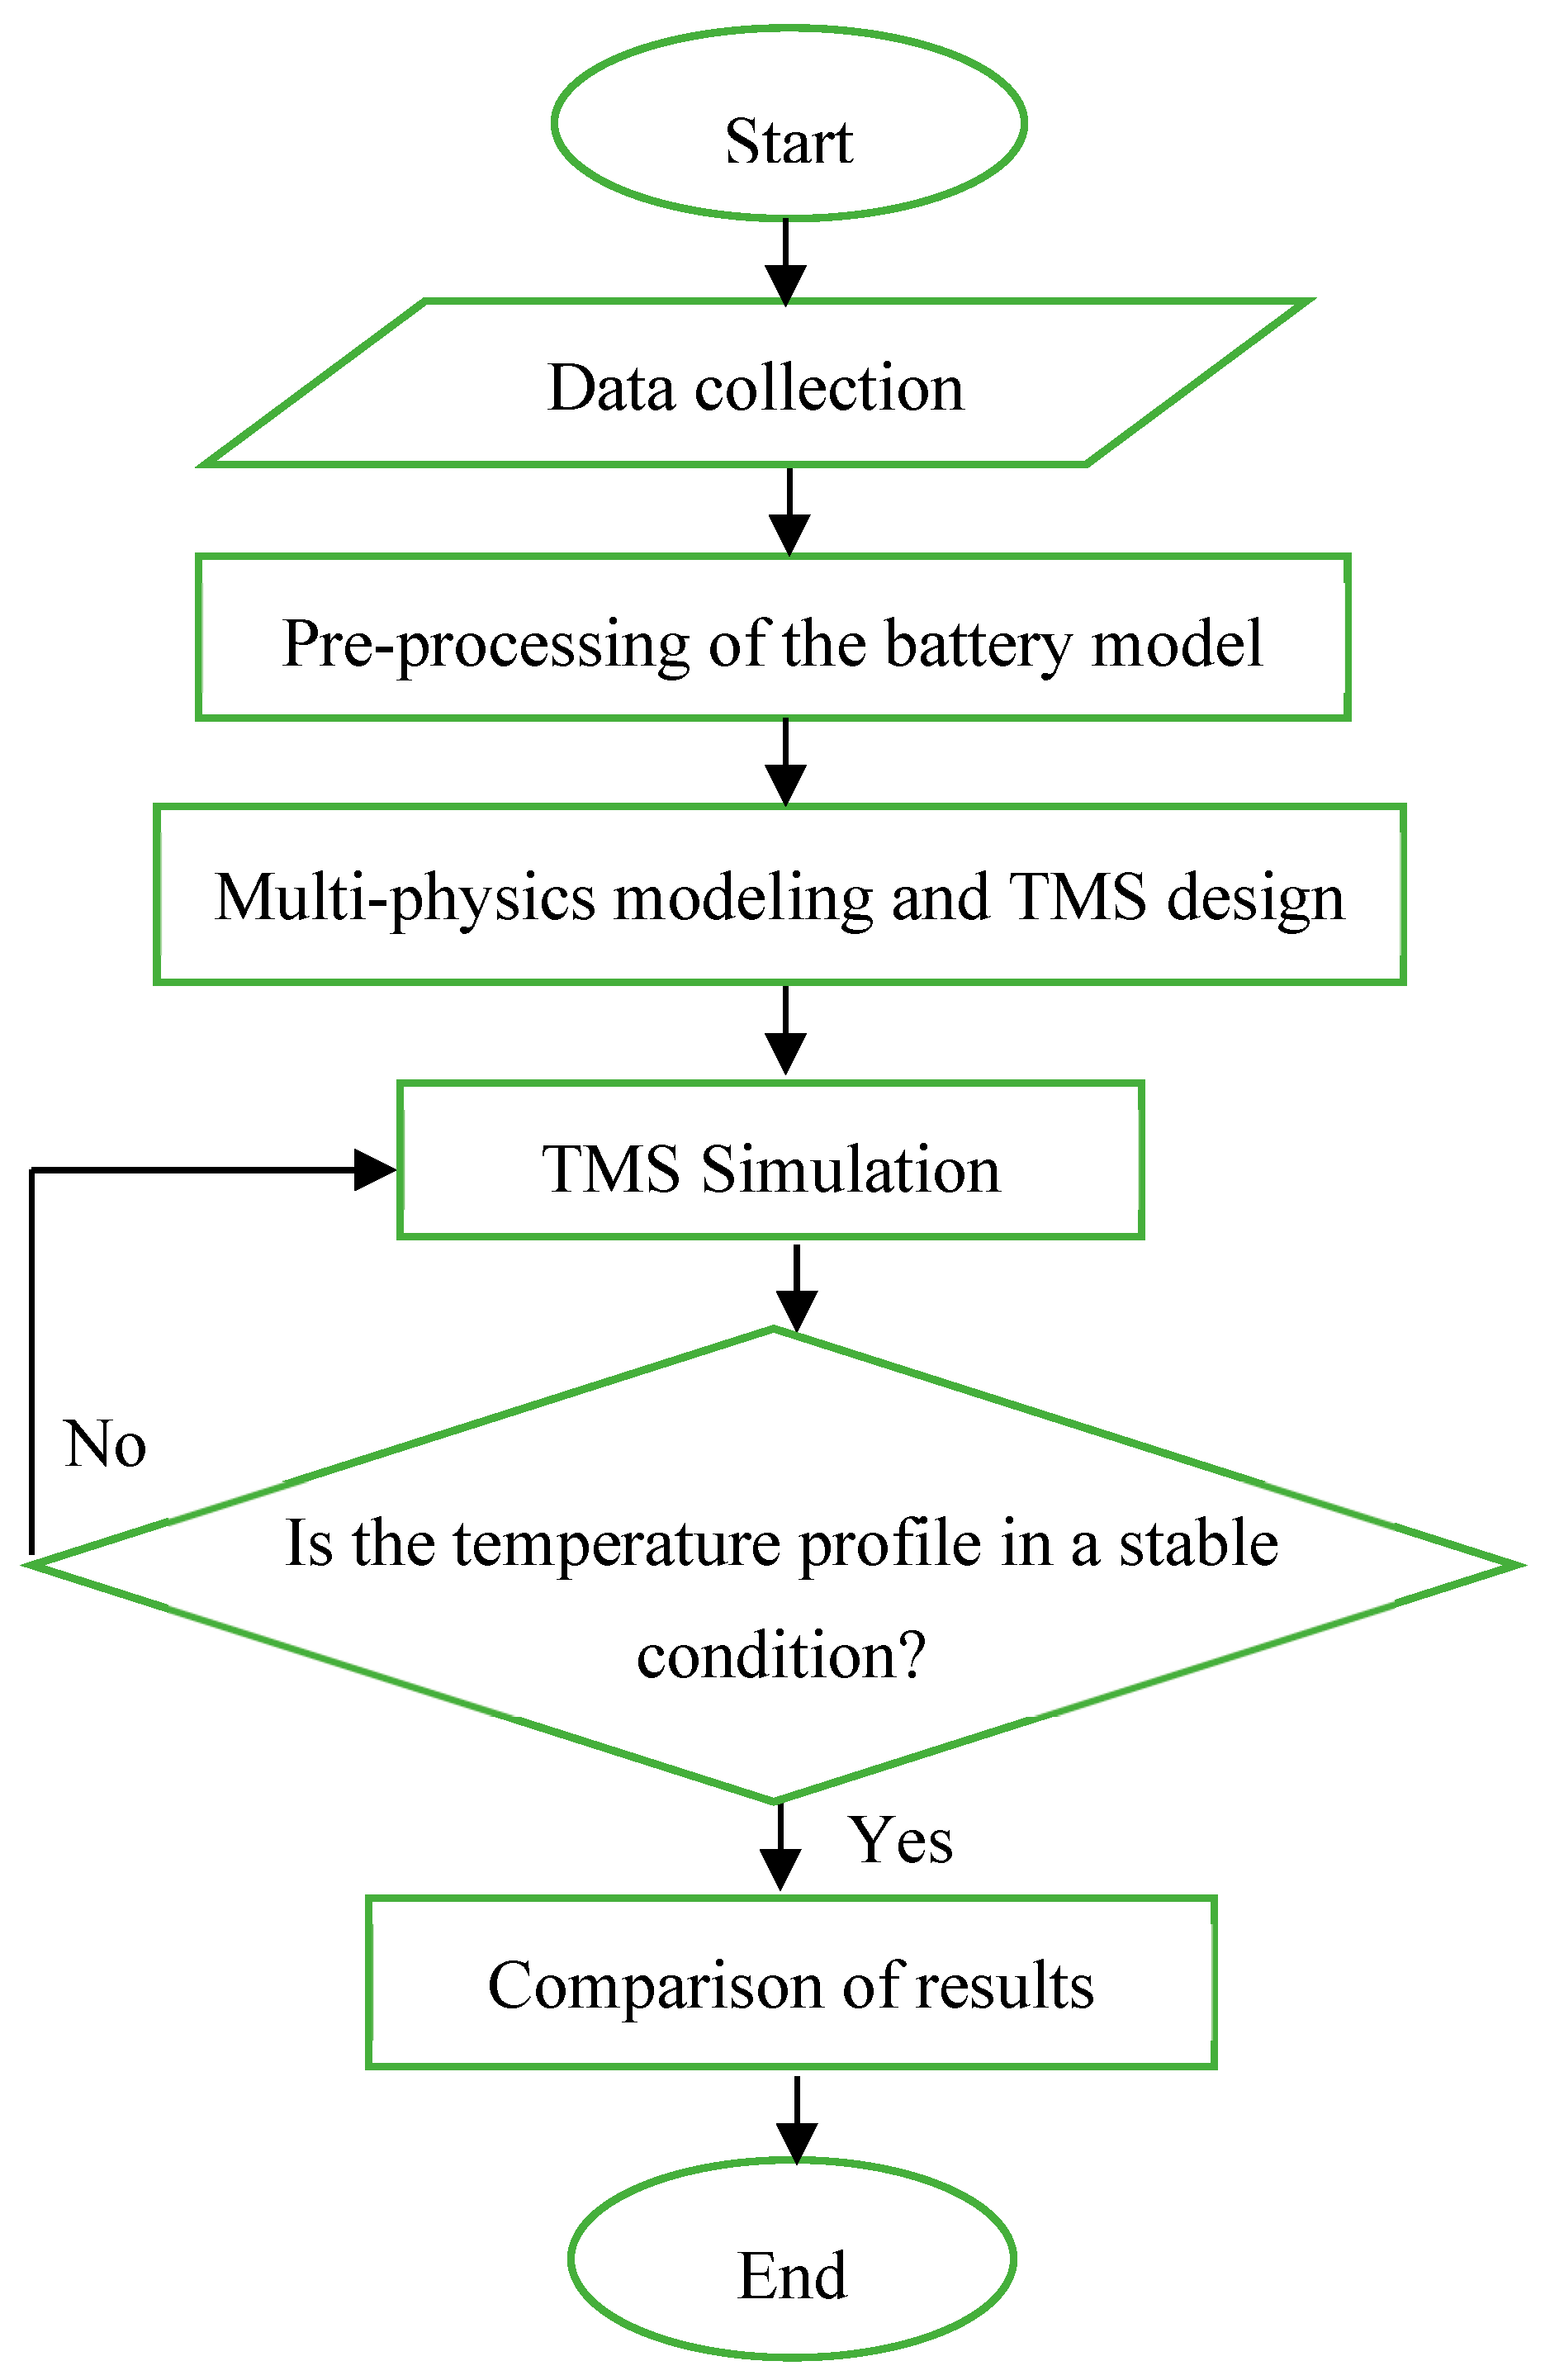
Figure 2.
3p8s model with different cell arrangements. (a) Demonstration of angle in cell arrangements [34]. (b) Cell arrangements with . (c) Cell arrangements with .
Figure 2.
3p8s model with different cell arrangements. (a) Demonstration of angle in cell arrangements [34]. (b) Cell arrangements with . (c) Cell arrangements with .
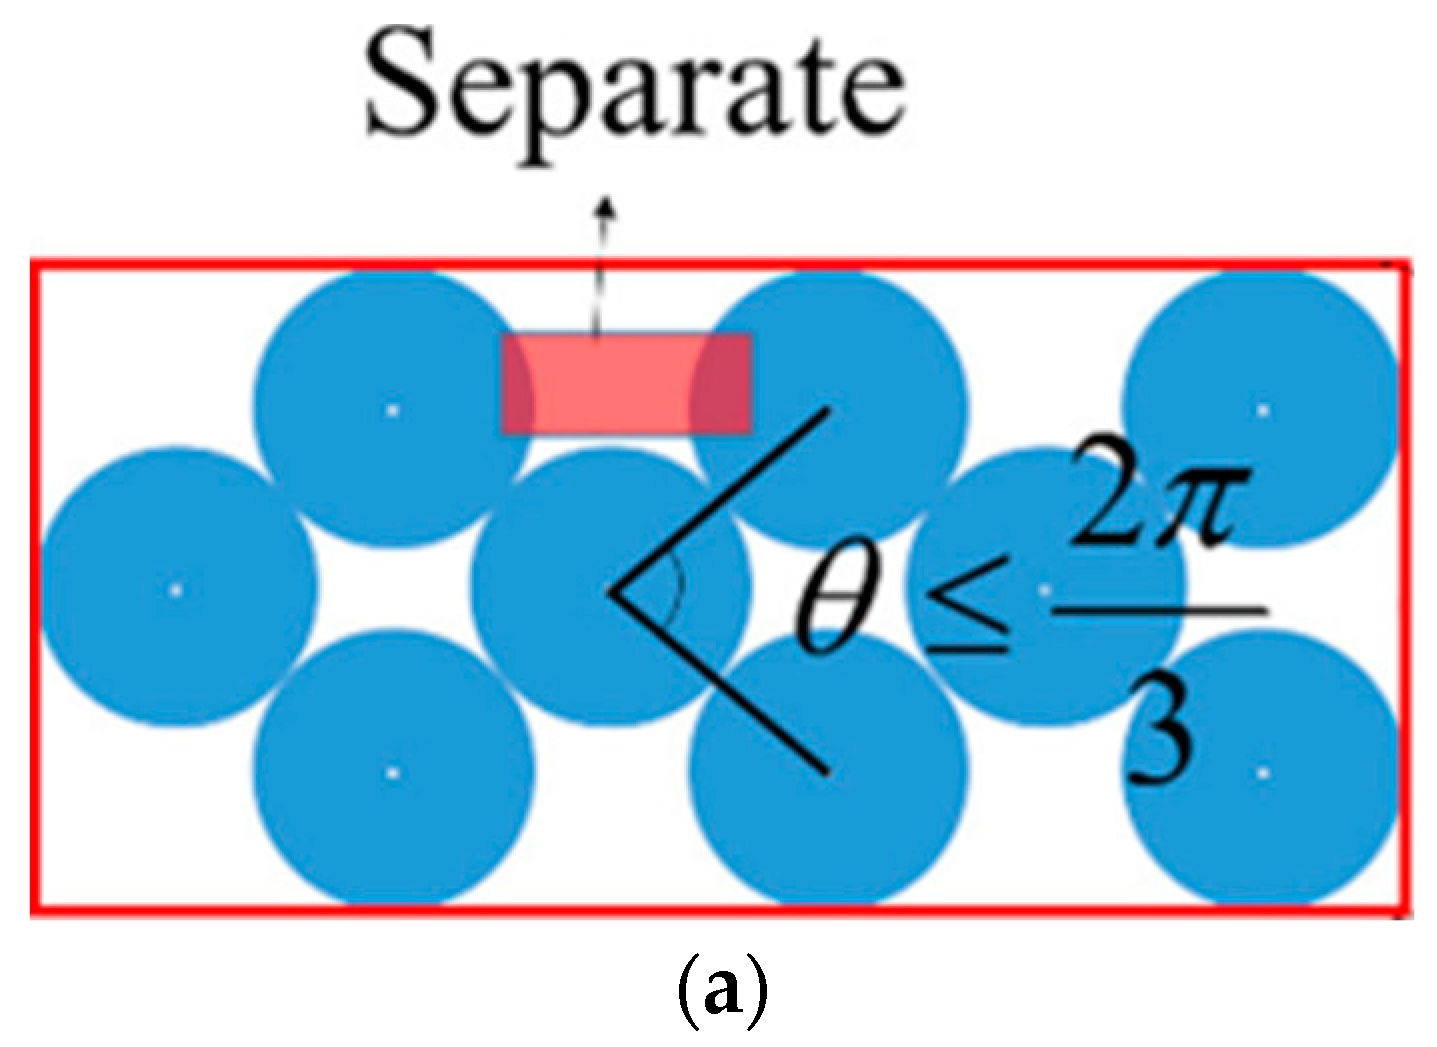
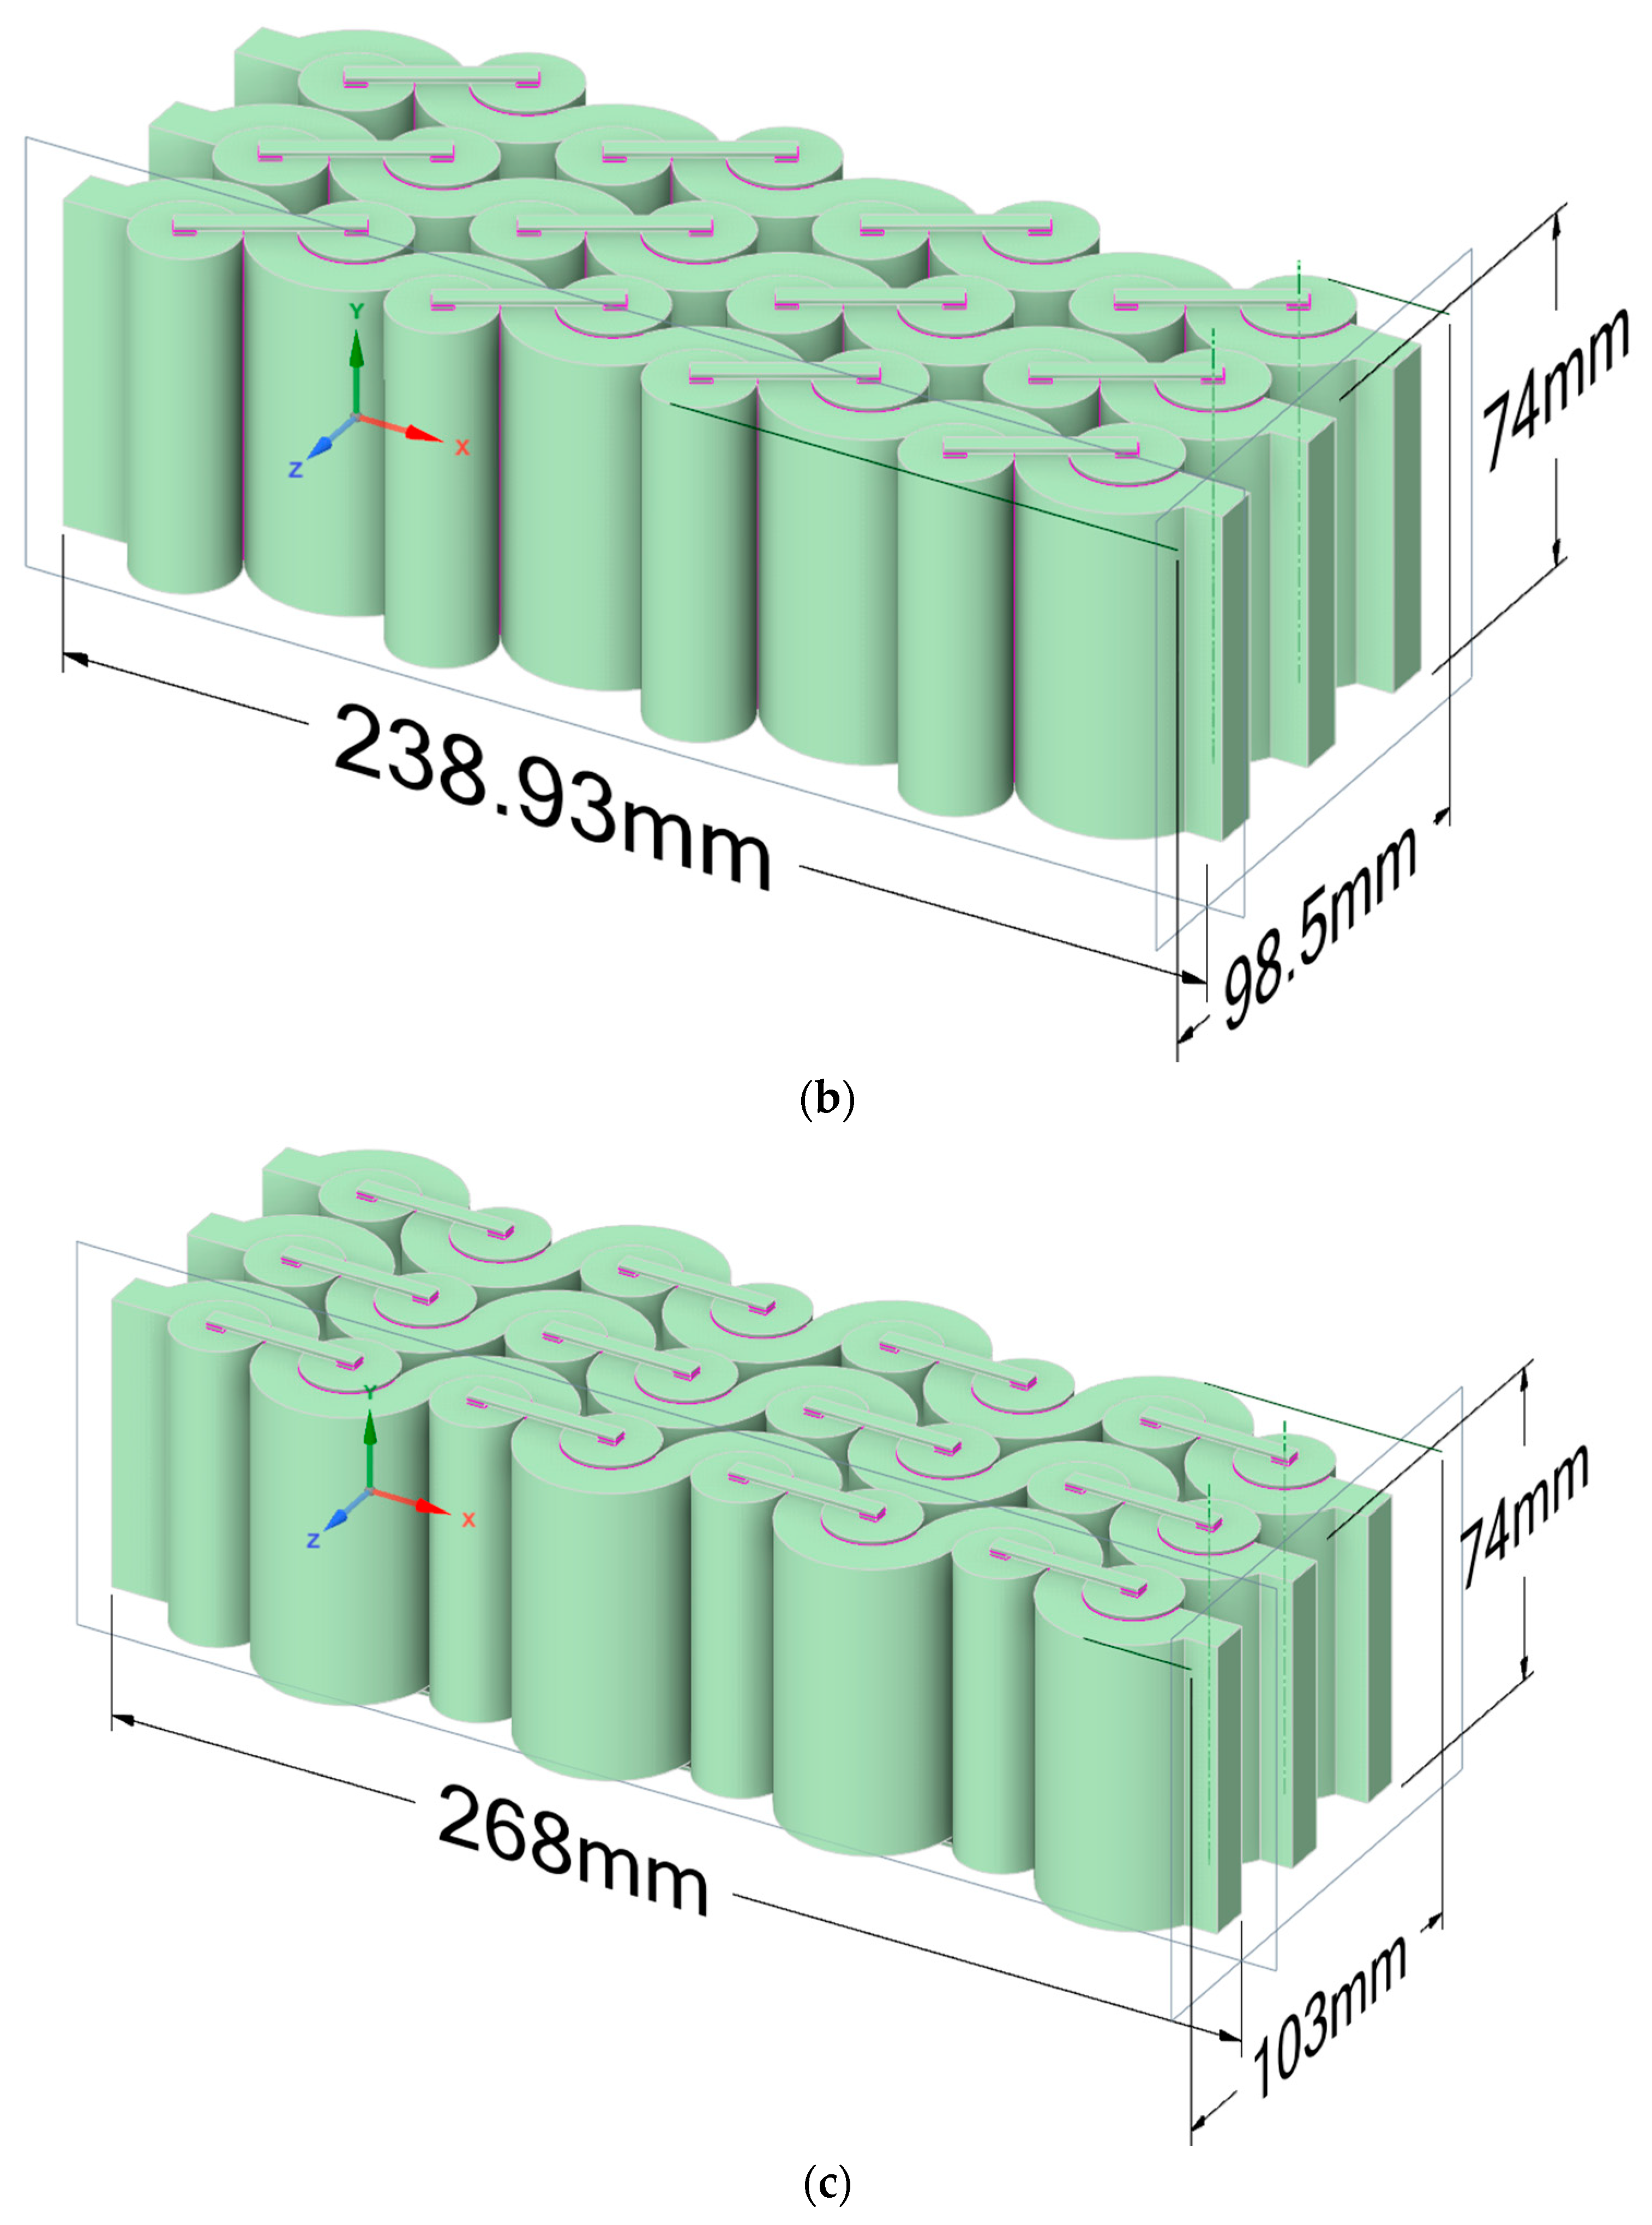
Figure 3.
Grid independence test of the 3p8s model.
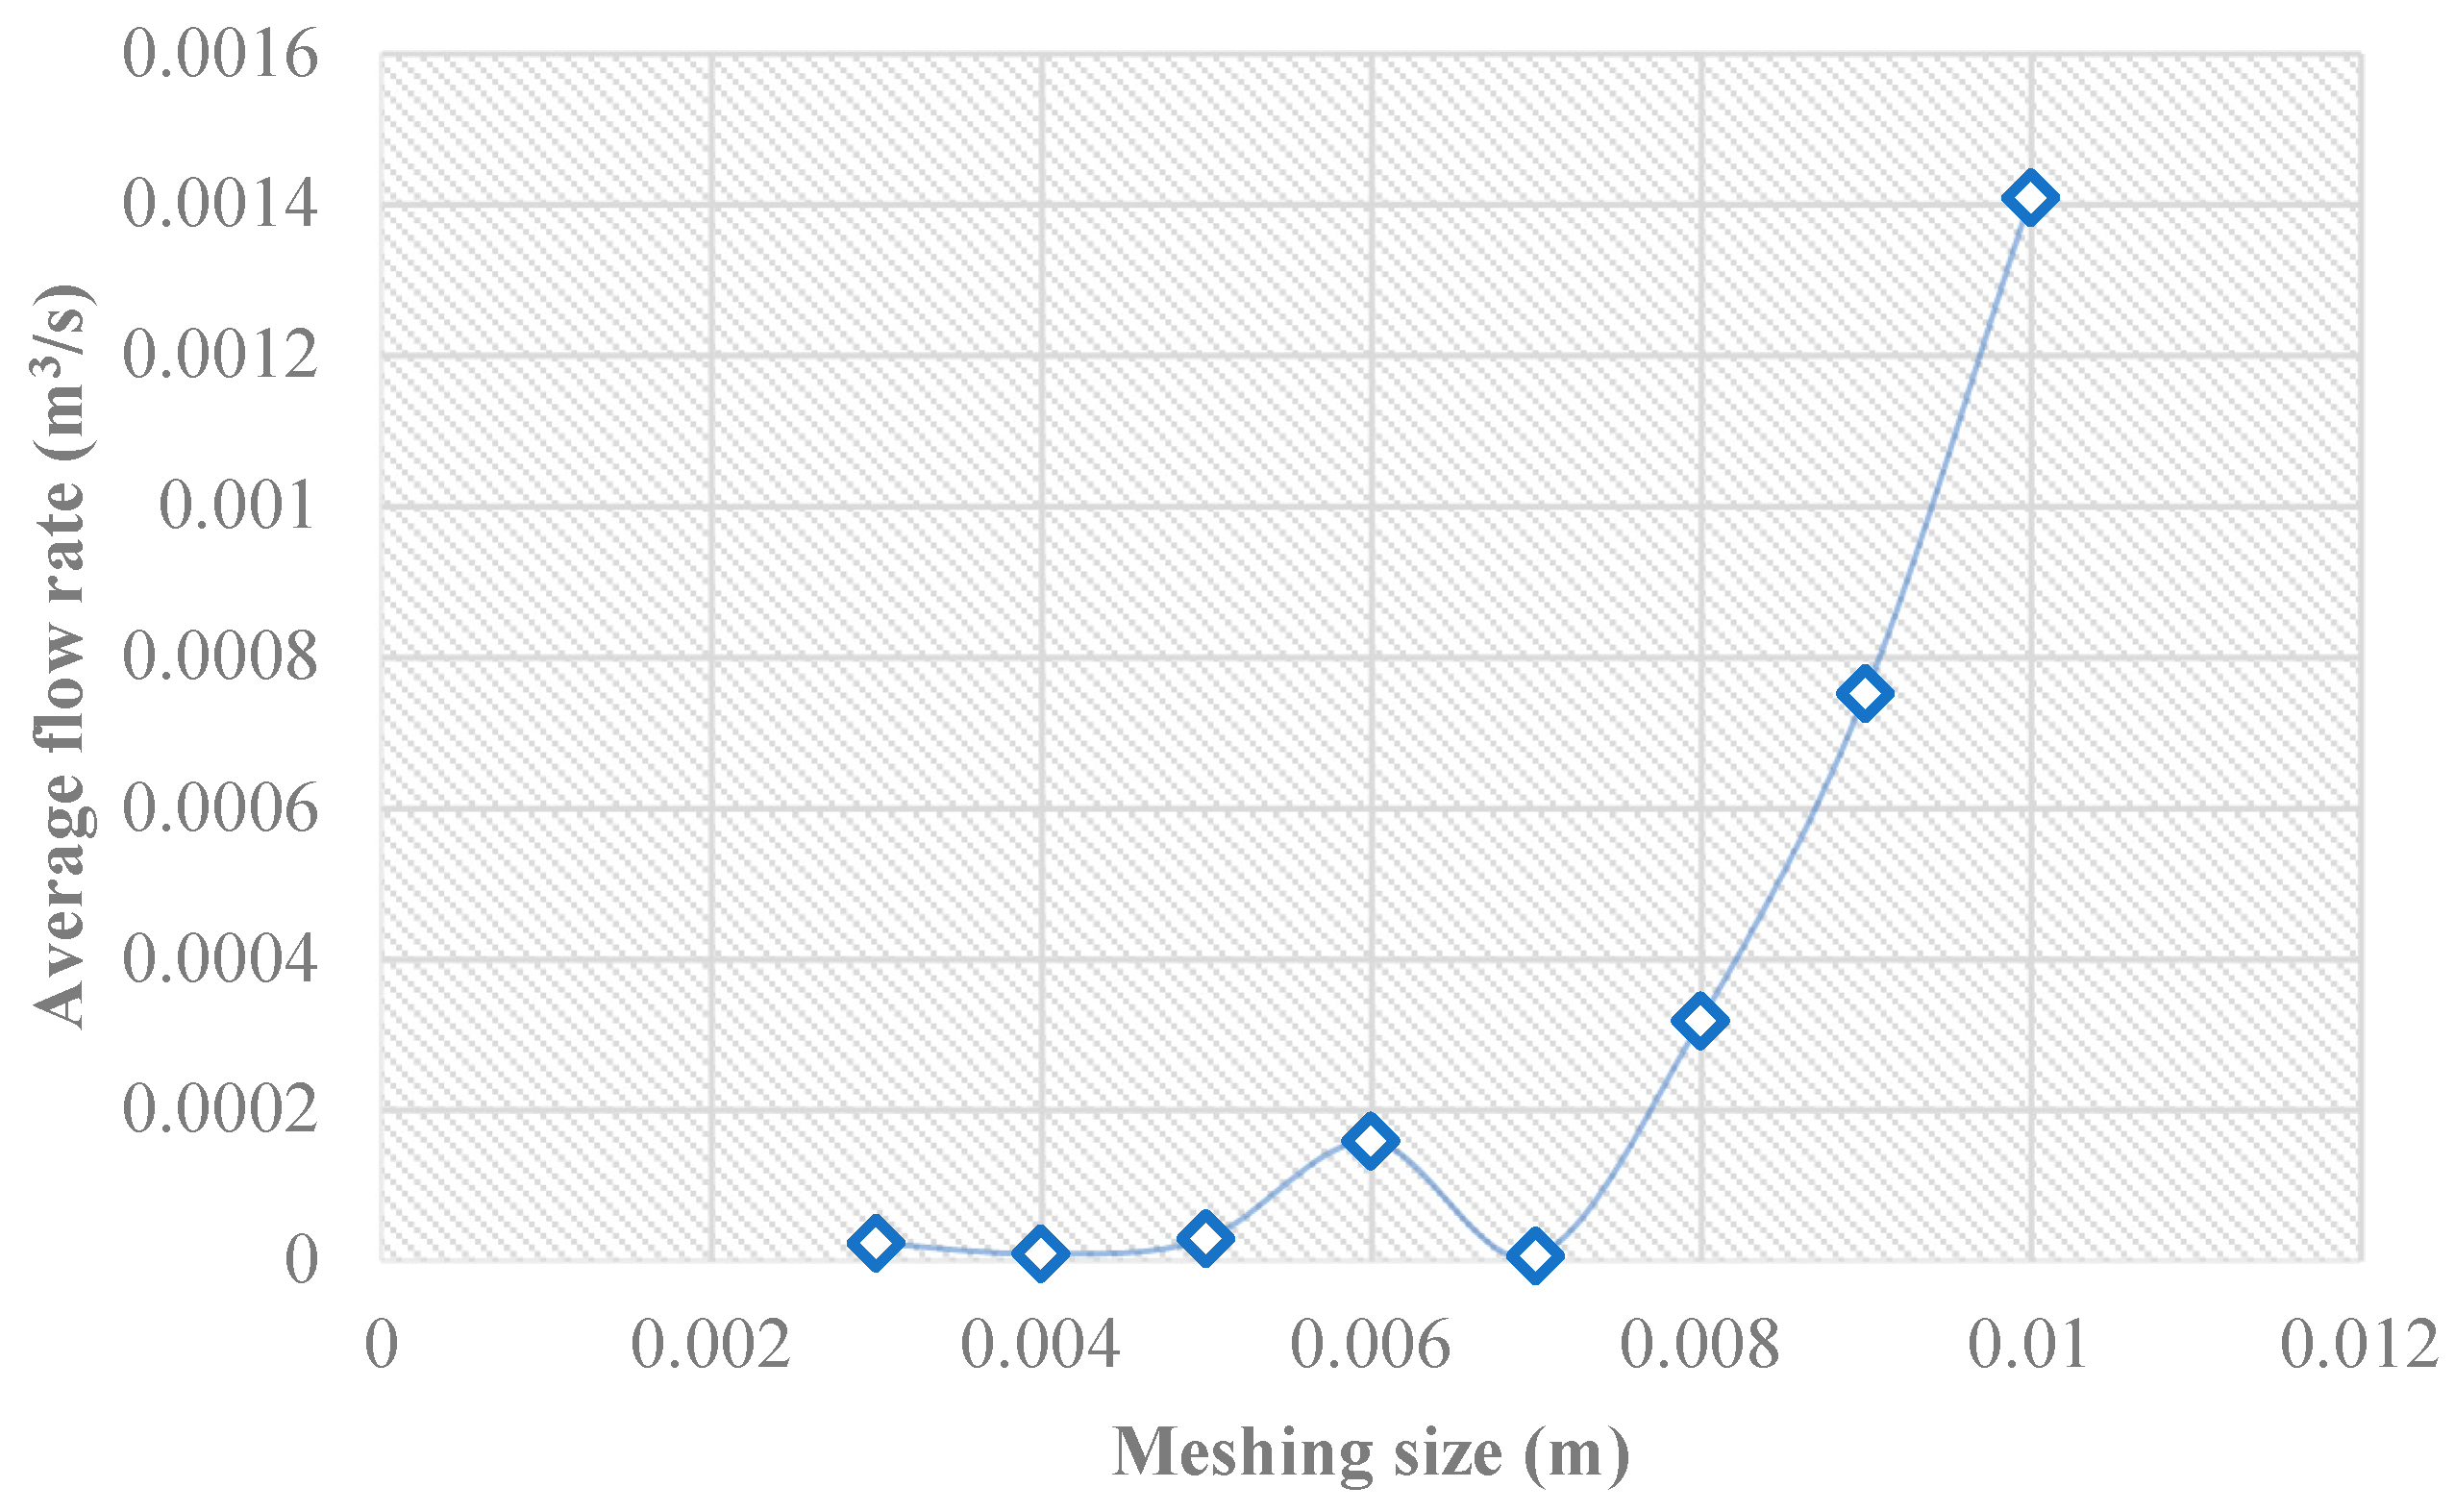
Figure 4.
Meshing and naming of 3p8s model with .

Figure 5.
Temperature contour of 3p8s model with .
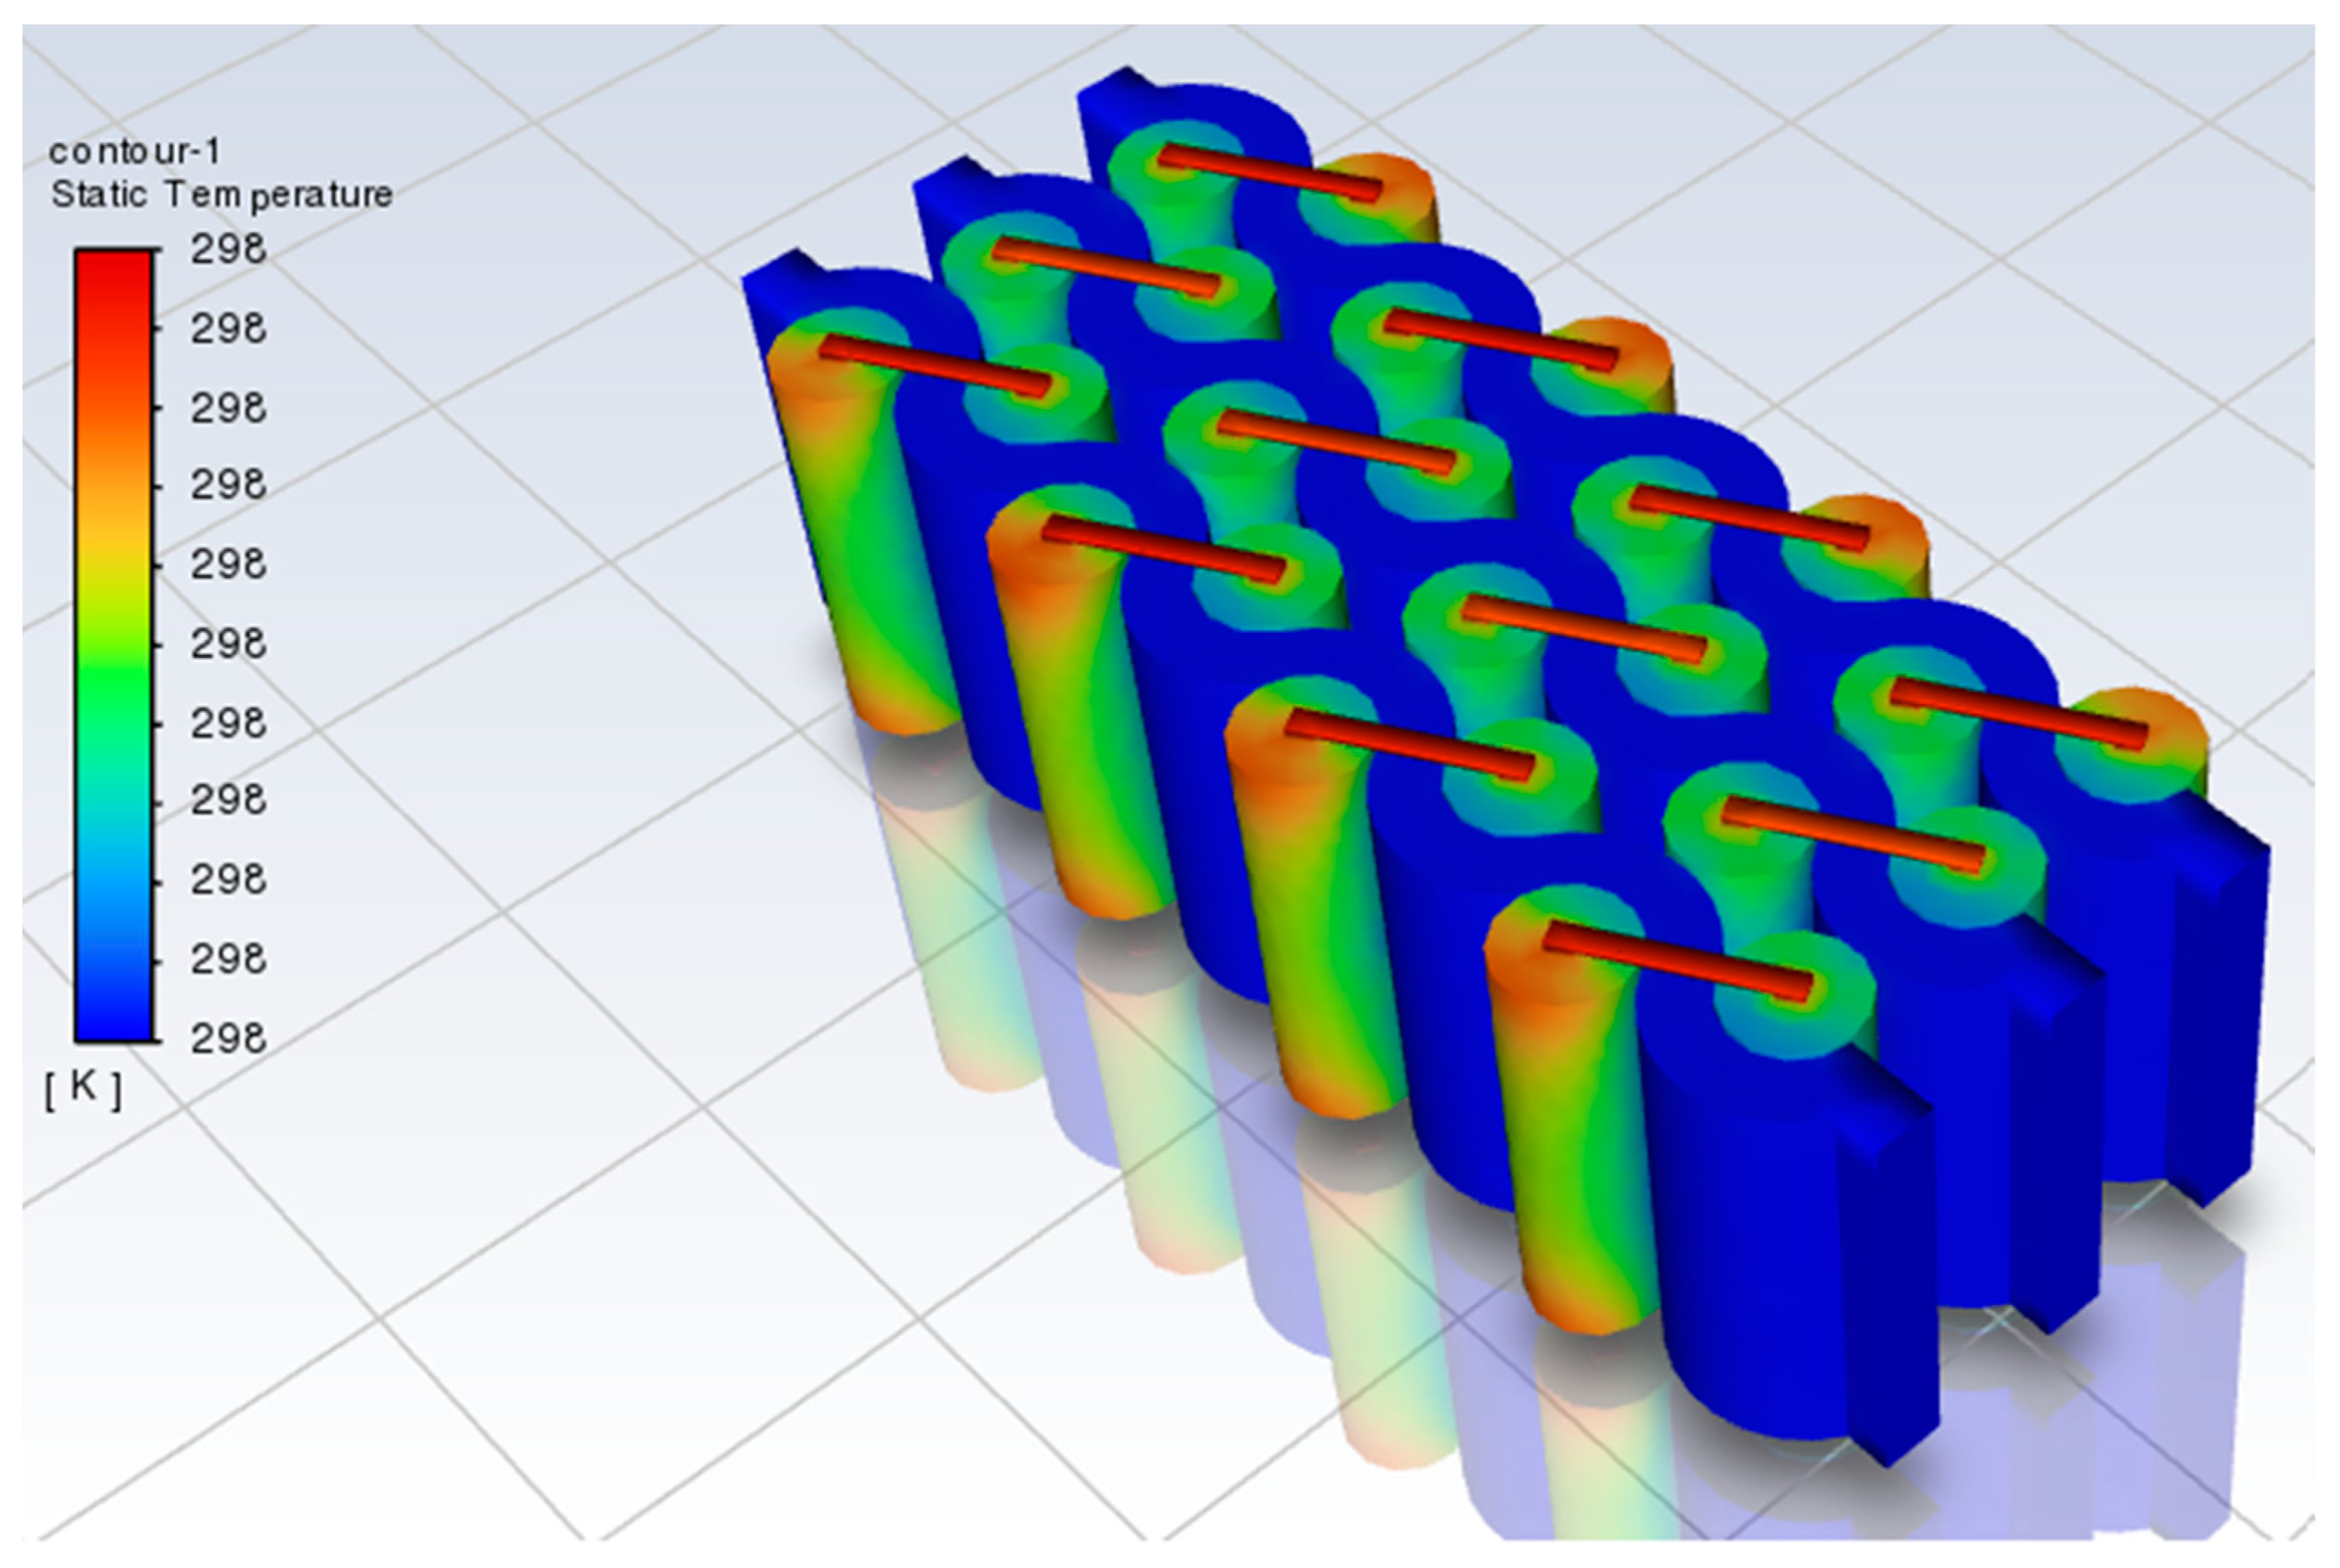
Figure 6.
Velocity path line of 3p8s model with .

Figure 7.
Temperature contour of 3p8s model with .
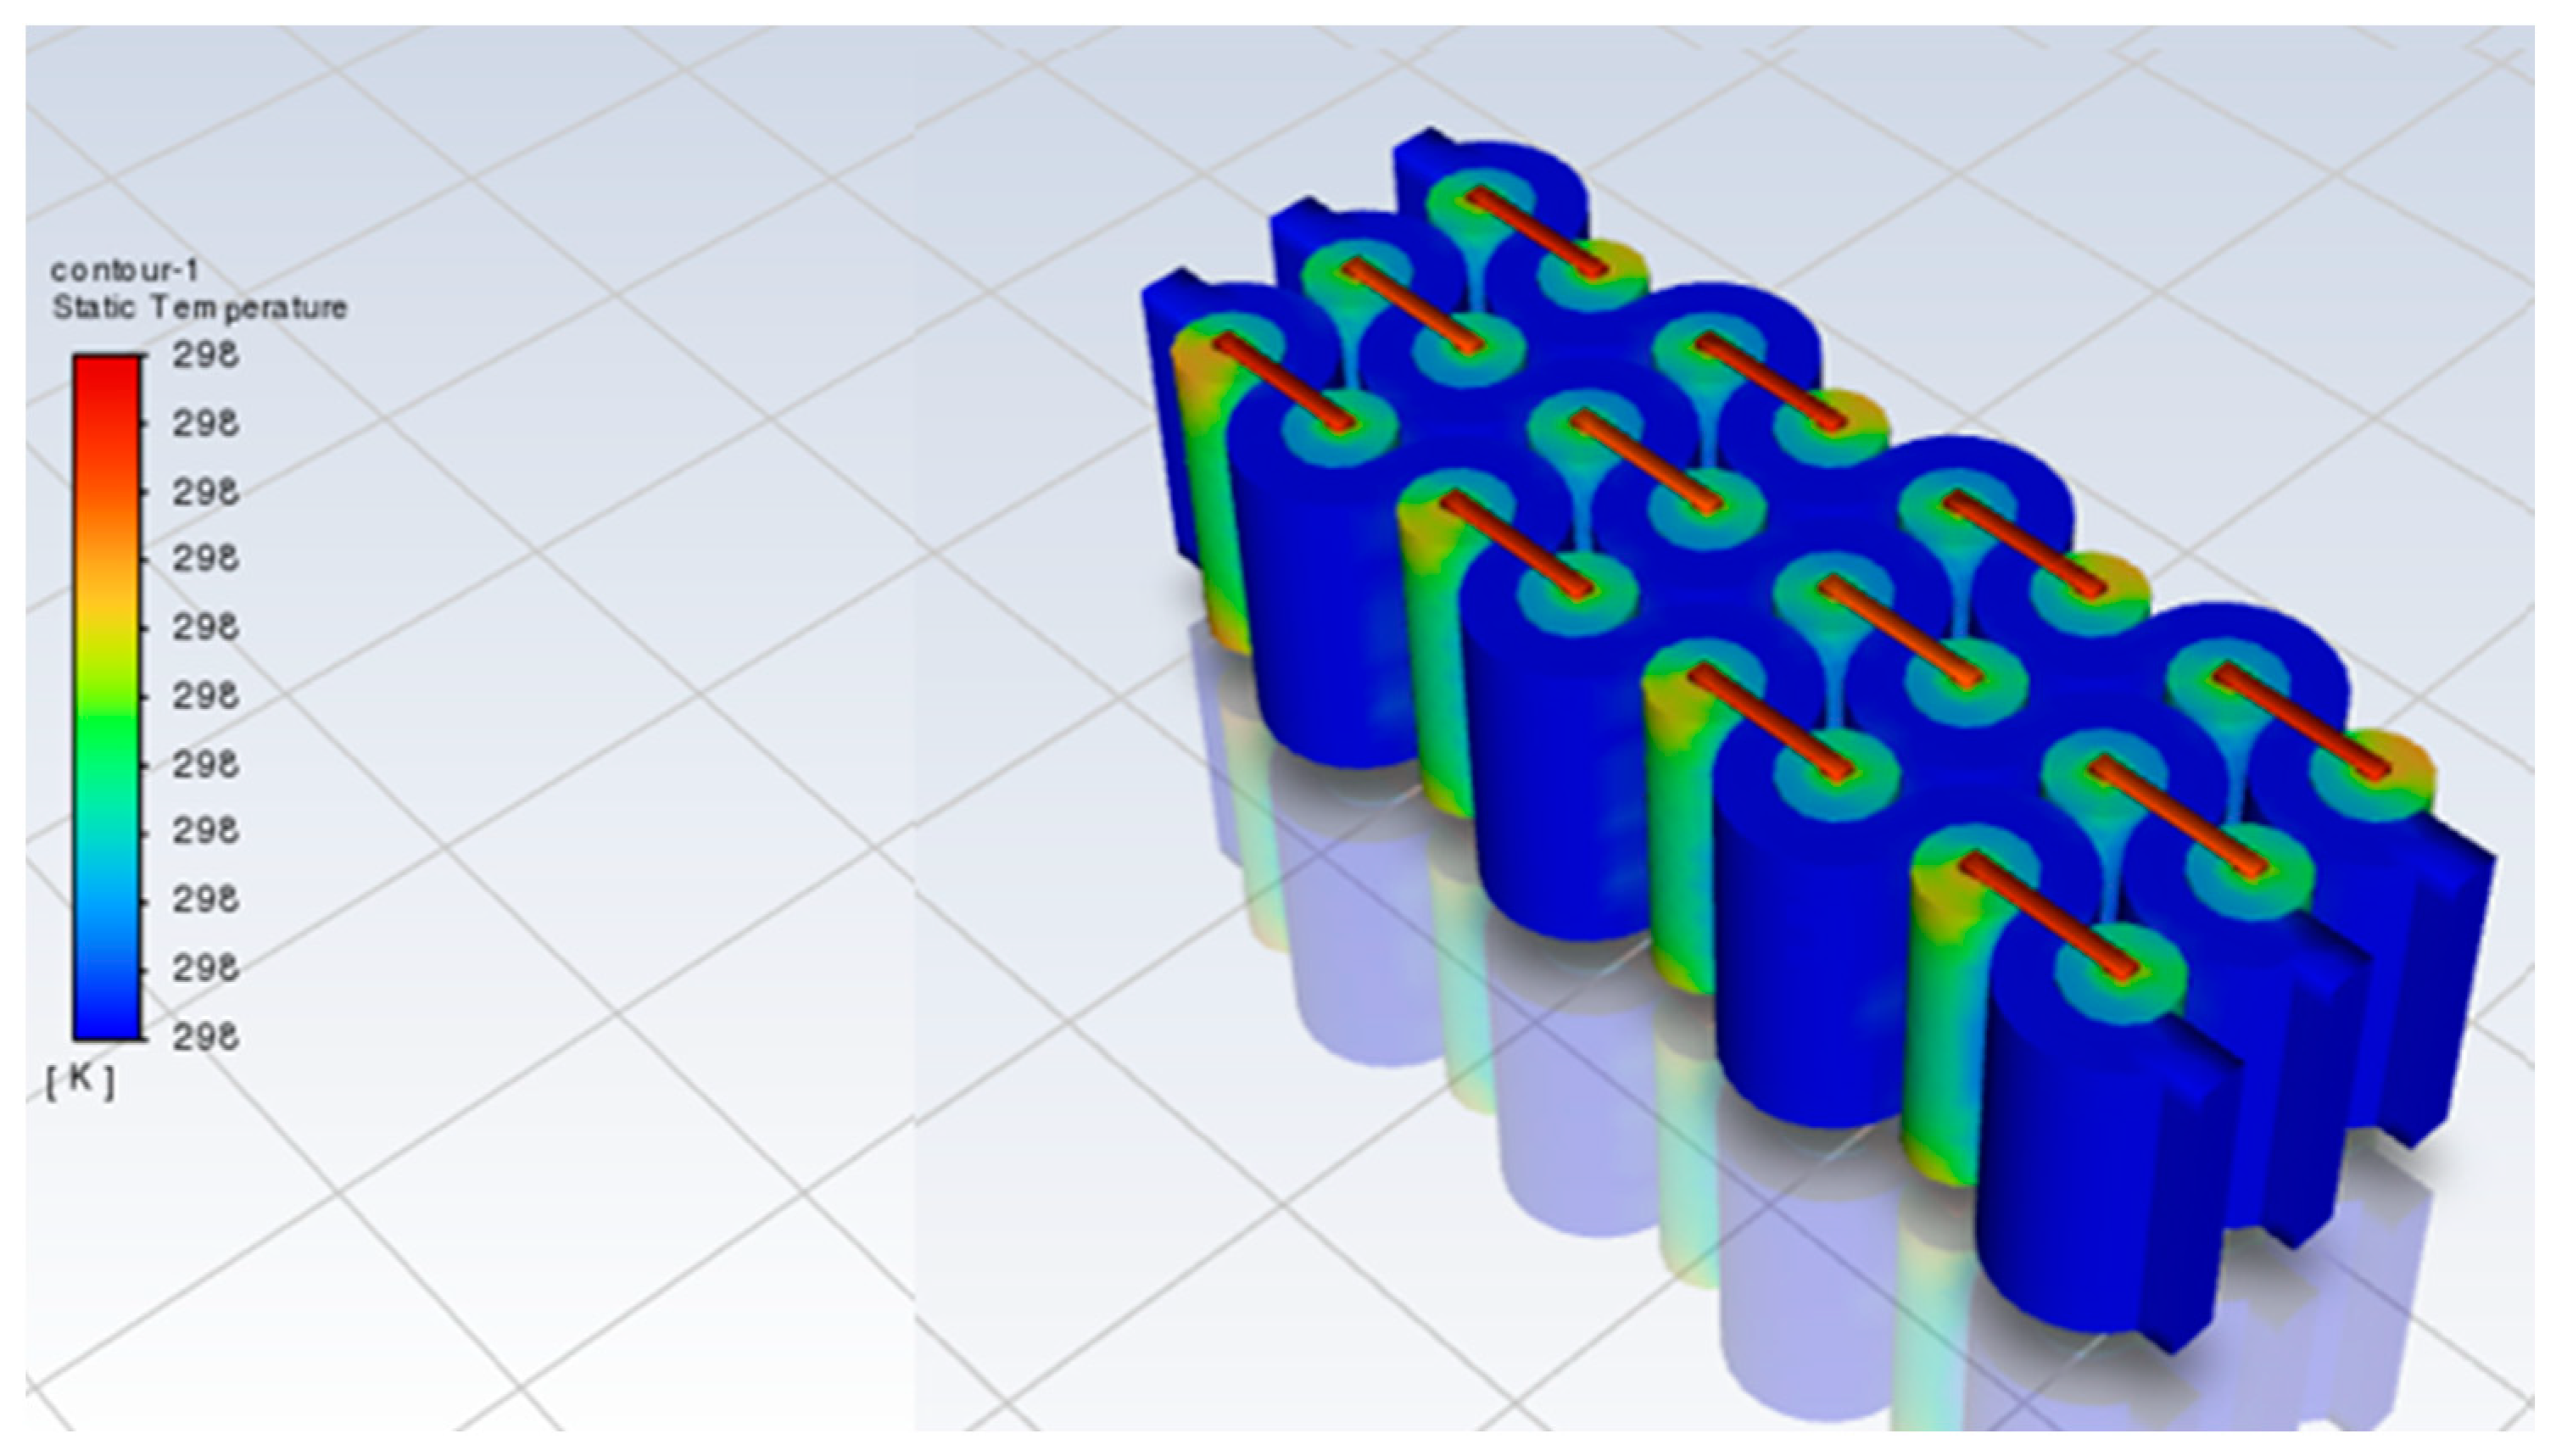
Figure 8.
Velocity path line of 3p8s model with .

Table 1.
The parameters of the cell’s model.
| Parameter Type | Parameters | Value |
|---|---|---|
| Dimension of cell/mm | Diameter | 21 |
| Height | 70 | |
| Thickness of components/μm | Positive electrode | 125 |
| Negative electrode | 126 | |
| Separator | 16 | |
| Aluminium foil | 20 | |
| Copper foil | 16 | |
| Electronic properties of cell | Nominal Voltage/V | 3.6 |
| Maximum Voltage/V | 4.2 | |
| Minimum Voltage/V | 2.75 | |
| Nominal capacity/Ah | 5.0 | |
| Internal resistance/mΩ | 15 | |
| Thermal properties of cell | Density/kg m−3 | 2615 |
| Specific heat capacity/J kg−1 K−1 | 1605 | |
| Thermal conductivity/W m−1 K−1 | 3 |
Table 2.
The boundary conditions of the model.
| Type | Boundary Condition |
|---|---|
| Cooling condition | Liquid cooling |
| Fluid dynamic conditions | Turbulence |
| Inlet | Velocity inlet |
| Outlet | Pressure outlet |
| Fluid temperature/K | 298 |
| Ambient temperature/K | 298 |
| Outlet pressure/Pa | 101,325 |
| Ambient pressure/Pa | 101,325 |
| Flow rate/m s−1 | 0.5 |
Table 3.
Summary result obtained for Panasonic NCR18650BF and Panasonic NCR21700A.
| Parameters | NCR18500BF | NCR21700A |
|---|---|---|
| Pack Energy | 113.4 kWh | 113.4 kWh |
| Final Pack Energy | 126 kWh | 126 kWh |
| Energy Required in 1 Module | 7.9 kWh | 7.9 kWh |
| Total V in 8 Series Cells | 28.8 V | 28.8 V |
| Total Capacity of Parallel Cells | 274.7 Ah (82 Parallel) | 275.0 Ah (55 Parallel) |
| Energy Produced by 1 Module | 7.91 kWh | 7.9 kWh |
| Energy Produced by 1 Battery Pack | 126.56 kWh | 126.0 kWh |
| Current Across Module | 399.75 A | 825.0 A |
| Current Across Pack | 6369 A | 13,200 A |
| Total Power of System | 184.2 kW | 380.2 kW |
| No. of Cells Per Module | 656 Cells | 440 Cells |
| No. of Cells Per Pack | 10496 Cells | 7040 Cells |
Table 4.
Summary of simulation results.
| Manipulated Variables | Responding Variables | |||||
|---|---|---|---|---|---|---|
| Cell’s Arrangement | Angle (Radian) | Max. Cell’s Temperature (K) | Average Cell’s Temperature (K) | Cell’s Potential (V) | Avg. Fluid Velocity (m/s) | Model Size (mm) |
| 3p8s | 298.130 | 298.024 | 28.825–32.943 | 0.492 | 103.0 (w) × 268.0 (l) × 74 (h) | |
| 3p8s | 298.157 | 298.040 | 28.826–32.943 | 0.508 | 98.5 (w) × 238.9 (l) × 74 (h) | |
| 3p5s [16] | 298.143 | 298.032 | 16.471–20.590 | 0.500 | 104.4 (w) × 176 (l) × 74 (h) | |
| 3p5s [16] | 298.301 | 298.119 | 16.467–20.590 | 0.500 | 99.5 (w) × 158.4 (l) × 74 (h) | |
Disclaimer/Publisher’s Note: The statements, opinions and data contained in all publications are solely those of the individual author(s) and contributor(s) and not of MDPI and/or the editor(s). MDPI and/or the editor(s) disclaim responsibility for any injury to people or property resulting from any ideas, methods, instructions or products referred to in the content. |
© 2023 by the authors. Licensee MDPI, Basel, Switzerland. This article is an open access article distributed under the terms and conditions of the Creative Commons Attribution (CC BY) license (https://creativecommons.org/licenses/by/4.0/).
Share and Cite
MDPI and ACS Style
Chan, C.K.; Chung, C.H.; Raman, J. Optimizing Thermal Management System in Electric Vehicle Battery Packs for Sustainable Transportation. Sustainability 2023, 15, 11822. https://doi.org/10.3390/su151511822
AMA Style
Chan CK, Chung CH, Raman J. Optimizing Thermal Management System in Electric Vehicle Battery Packs for Sustainable Transportation. Sustainability. 2023; 15(15):11822. https://doi.org/10.3390/su151511822
Chicago/Turabian StyleChan, Choon Kit, Chi Hong Chung, and Jeyagopi Raman. 2023. "Optimizing Thermal Management System in Electric Vehicle Battery Packs for Sustainable Transportation" Sustainability 15, no. 15: 11822. https://doi.org/10.3390/su151511822
Note that from the first issue of 2016, this journal uses article numbers instead of page numbers. See further details here.