

Effects of Water—Binder Ratio on Strength and Seismic Behavior of Stabilized Soil from Kongshavn, Port of Oslo


1
Department of Investments Technology and Environment, Swedish Transport Administration, Neptunigatan 52, 201 23 Malmö, Sweden
2
Division of Building Materials, Department of Building and Environmental Technology, Lunds Tekniska Högskola (LTH), Lund University, 221 00 Lund, Sweden
3
Laboratory of Image Synthesis and Analysis (LISA), École Polytechnique de Bruxelles, Université Libre de Bruxelles (ULB), Avenue Franklin D. Roosevelt 50, 1050 Brussels, Belgium
*
Author to whom correspondence should be addressed.
Sustainability 2023, 15(15), 12016; https://doi.org/10.3390/su151512016
Submission received: 22 June 2023
/
Revised: 27 July 2023
/
Accepted: 2 August 2023
/
Published: 4 August 2023
(This article belongs to the Special Issue Sustainability in Architecture and Engineering)
Abstract
:In many civil engineering problems, soil is stabilized by a combination of binders and water. The success of stabilization is evaluated using seismic tests with measured P-wave velocities. Optimization of process, laboratory testing and data modelling are essential to reduce the costs of the industrial projects. This paper reports the optimized workflow of soil stabilization through evaluated effects from the two factors controlling the development of strength: (1) the ratio between water and binder; (2) the proportions of different binders (cement/slag) were changed experimentally in a mixture of samples to evaluate the strength of soil. The experimental results show an optimal combination of 30% cement and 70% slag with a binder content of 120 kg/m3 and a maximum water binder ratio (w/b) of 5. Such proportions of mixture demonstrated effective soil stabilization both on a pilot test scale and on full scale for industrial works. The correlation between the compressive strength and relative deformation of specimens revealed that strength has the highest values for w/b = 5 and the lowest for w/b = 7. In case of high water content in soil and wet samples, the condition of a w/b ≤ 5 will require a higher amount of binder.
1. Introduction
Many civil engineering and construction projects in harbours face challenges of the recycling of dredged marine sediments [1,2,3]. Dredging is an essential procedure performed regularly in ports and harbours. It aims to increase water depth in ports to ensure and control safe ship transportation. Collected sediments are then deposited and usually employed for industrial purposes as building materials. The examples of application of the dredged marine sediments include manufacture of bricks [4,5], construction of roads [6] or construction of base courses in runways and pavements [7]. However, collected raw marine sediments are unsuitable for direct reuse due to the poor engineering properties (low strength, stiffness and compaction, high moisture, and viscosity characteristics of soil), and contamination with toxic pollutants [8,9]. Therefore, recycled soil used for pavements and construction industry needs to be stabilized before reuse, since during exploitation it undergoes significant plastic deformations due to the high traffic loads. To withstand such loads, it is essential to improve its resilient characteristics, which include elastic and plastic strain responses [10]. In addition, dredged soil should be treated in order to improve its ecological properties and to reduce environmental hazards prior to reuse [11].
Since the recycling of dredged marine sediments is of great significance to sustainable development, economic prosperity, societal needs and well-being, many approaches have been developed with the aim of optimization of the soil treatment process in coastal engineering works: reducing the costs of works [12], improving the workflow process [13], increasing the effectiveness of stabilization [14,15], and immobilization of the environmental pollutants [16]. To solve these problems, many approaches have been developed to optimize soil treatment for reusing it as safe and environmentally-friendly construction material [17]. These include solidification/stabilization (s/s) of soil to increase its strength and workability [18], removal and immobilization of toxic substances, heavy metals and contaminants through leaching [19,20,21,22] and reducing the high costs of works related to the management and reuse of dredged sediments [23,24].
The mechanical behaviour of low performing soils such as dredged sediments can be strengthened with binders. To this end, solidification/stabilization (s/s) is used to increase bearing capacity of soil through the improved strength, and the results are encouraging [25,26,27,28]. A popular approach to s/s soil processing is to use binders as stabilizing agents, and then apply geotechnical methods of evaluating the soil’s strength and environmental properties [29,30]. Apart from this, methods of deep mixing aim to improve soft, high moisture and cohesive clayey soil, which is typical for marine sediments [31,32]. Stabilization of soil with binders requires considering soil properties, which differ significantly according to their types and structure: fine-grained clay, middle-grained sand or coarse-grained gravel. In various types of soil, key physio-mechanical parameters differ substantially. This includes different mineral content, moisture, density, cohesion and plasticity, swelling potential, volumetric weight and porosity [33,34]. Therefore, the s/s treatment of soil also requires optimal selection binders, which should be adjusted to specific soil types in order to improve the characteristics of strength, compressibility, and bulking [35].
The literature abounds with diverse approaches of various soil stabilization techniques for improving soil properties. Typically, they include major binders (cement, slag, fly ash or lime) and their blended mixtures [36,37,38]. For example, the effects of fly ash content were investigated in stabilized gravel [39], clay [40] and soft soil [41]. The use of cement, slag and nanosilica was successfully tested to increase the freezing-thawing durability in soft clays [42]. The benefits of ash-slag cementitious materials were reported for solidification of soft soils [43]. Furthermore, the effects of the improved lime-based binders were evaluated on different proportions of slag [44], hydrated Portland cement [45,46] and ash [47] in the admixture content for stabilization of clayey soils. The experimental use of the alkali-based materials was reported for improving properties of sandy clay [48]. Finally, various types of cement [49,50], calcined lime/slag blends [51] or cement/slag mixtures [52] were assessed to analyse the behavior of high-moisture content fine-grained soils after stabilization.
New mainstream directions in civil and geotechnical engineering include the use of the optimized blends of novel and alternative admixtures besides the traditional binders used in civil engineering [53,54,55,56]. Sustainable binders can be used for amendment of strength, durability and absorption of native clayey soil and include novel binders used as admixtures. For instance, these include such novel binders as polymeric materials [57,58,59], pozzolan-blended binders [60], recycled waste materials [61] or glass powder [62]. Such improvements aim at increasing the long-term effects from novel admixtures on soil strength. With this regard, another factor for success in soil stabilization includes a period of treatment [63,64]. As a general rule, the effects of s/s process increase with curing time, which is reflected in the development of the physical and mechanical properties of soil. For instance, existing studies reported a difference in mineralogical evolution, compressive strength, porosity, and pH of the s/s soil and cemented materials over curing time, according to the tests taken in key control days [65,66]. Other studies evaluated the effects of changed quantity and content of binders on the stabilization of soft soils [67,68].
These and many related approaches are based on proposing more efficient binder recipes to improve the engineering properties of soil [69,70,71]. Nevertheless, they still require considering other factors such as the ratio of water with regard to binder content in each test case for the analysis of strength. Hence, besides the selection of binder types, effective soil stabilization requires a dosage of suitable binders and the addition of water in balanced proportions with regard to the structure of soil. Our new formulation of the soil stabilization problem builds on experiments with the water–binder ratio, which affects the hydration process in cementitious materials and is evaluated using seismic methods [72,73]. The developed workflow framework is adjusted to sediments collected in the harbour of Port of Oslo as a continuation of our previous work [74]. Here, we employ a series of engineering and environmental tests to evaluate the engineering properties of soil after stabilization with various w/b ratio.
Evaluating soil strength after stabilization may be performed using either traditional methods with a UCS testing machine, or using applied geophysical methods. These include the non-destructive ultrasonic tests, which are based on the determination of P-wave velocities and compression characteristics of the soil [75]. The goal of such methods is to evaluate the increase in cementation of soil through recorded P-wave’s velocity, which increases along with densities, stiffness and strength of materials [76,77,78]. Hence, the acoustic acquisition and calculation of the elastic wave velocities serves as an indicator and descriptor of success in soil stabilization. As a result, seismic sonic methods have been used with great success for evaluation of strength properties of the stabilized soil [79,80,81].
Further examples include tested variability of stiffness and damping using analysis of seismic responses [82] and evaluation of building structures using tuned mass dampers and frequency evaluation of seismic signals [83]. The effects of the hydration of cement and cementitious binders, used in materials science to study the evolution of soil hardening have been studied previously [84,85,86] and prove the increase of strength and stiffness of stabilized soil. Likewise, the idea of using seismic methods in geotechnical engineering has been used for nondestructive testing for evaluating soil integrity and structural failure based on the relationship between the velocity and the strength and stiffness of materials [87].
The effects of varying water–binder ratios on the strength of stabilized soil, which rarely occur in practice, make it challenging to conduct tractable investigations and compare how changes in percentage directly affect the material’s properties. The existing studies mostly use a fixed combinations of binders as stabilizing agents and evaluate the soil properties using a given ratio. In contrast, analysis of various water–binder ratios requires a systematic laboratory-based investigation using a series of tests that include multiple observations of soil behaviour processed further by means of the statistical analysis. To fill this gap, this study proposes a research strategy that involves testing multiple soil samples treated with varying combinations of water-to-binder ratio in a stabilizing mixture.
In light of the above discussion, in this paper we study the benefits of exploiting the effects of optimized and parameterized binder proportions taken as factors and water content on strength and deformation of soil. The optimized workflow is proposed to achieve the most effective procedure and reduce high costs of soil processing in the construction industry. The best combination of stabilizing agents for soil treatment ensures the control of the soil quality for geotechnical suitability of foundations before construction works in a harbour. Thus, if the conditional ratio of stabilizing agents is known through modelling, then solidification of soil can be achieved by sampling the specimens at a finite number of trials and checking each test to see if the target stabilization degree is achieved. To this end, we introduce a new method for improving the stabilization efficiency by setting up an updated sampling procedure, which includes four Batches of specimens stabilized with various amounts of water and a combination of binders. Thus, we use the activated carbon (powdered charcoal) for pre-treatment of soil materials one month before the stabilization, and apply the Belite Calcium Sulfoaluminate (BCSA) type cement, which has environmental quality compared to the Portland cement due to low CO2 emissions. The soil pre-treated with these materials demonstrated better environmental characteristics.
2. Project Scope and Goals
The Department of Building Materials at Lund University has been commissioned by the Norconsult to investigate the possibilities of stabilizing/solidifying contaminated dredged masses from Oslo Harbour, Kongshavn. The assignment has been carried out partly at the Building Materials department, partly at the Swedish Geotechnical Institute (SGI). The stabilization/solidification methodology has been used in several projects in Sweden [88,89], including the port of Gävle and the port of Gothenburg (Arendal 2). In both of these projects, a large amount of contaminated dredged material has been stabilized to be used in the construction of the port area. The Port of Oslo has an important infrastructure; therefore, the safety of the constructions should be ensured with proper and robust stabilization of soil. The soil conditions here are explained by the high moisture of weak expansive soil since samples include the dredged marine sediments that should be stabilized. Compared to other locations, such as remotely located towns and small-sized settlements, the soil in the port region should be stabilized to have a high bearing capacity to bear high loads of intensive transport and intensive traffic. Moreover, the priority and scale of the project is high. Therefore, the methodology is used both as a pilot test and as a full-scale project with sample points collected in locations shown in Figure 1.
Table 1 summarizes different projects and reported locations with major sample points where dredged masses or contaminated soil are stabilized/solidified based on the STABCON report [90] and other sources. For instance, a recent project in Gothenburg (Sweden) includes a pilot trial and a full-scale project, which has been carried out and completed. Furthermore, similar projects have been carried out in Gävle and in other locations in Sweden as well as selected places in Finland and Norway. The mixing tests in all these works aim to investigate the possibility of using binders in various proportions to stabilize the contaminated soil material with regard to geotechnical (strength) and environmental (leaching and permeability) properties. The goal is to process soil collected as dredged sediments from the coastal areas and to prepare it for further reuse and recycling in the industrial and construction works.
3. Materials and Methods
Soil samples evaluated in this study were collected as dredged sediments from the Port of Oslo, Norway. The tests points are located in the Kongshavn harbour and marked No. 1_2, 3, 4, 5, 6 and 8. The geotechnical and chemical analyses of the dredged masses were carried out with the aim of determining the strength parameters of the soil and the degree of contamination. The analyses were conducted by the Eurofins in Norway. In these tests, soil samples from the test points 3 and 4 were combined while others were evaluated separately.
3.1. Determination of Material Parameters
Before soil stabilization and environmental tests, the soil specimens were examined for major characteristics: (1) water content, (2) density, and (3) grain size analysis. The tests were performed using methods and standard equipment available in the laboratory of SGI, such as hydrometer and sieve analysis.
3.1.1. Water Content and Density
Figure 2 shows the water content in each tested sample point. The current water ratio for each sample point is represented on the X-axis. For each sample point, eight determinations were made and visualized on the Y-axis. The sample point No. 5 with the highest water ratio shows the highest dispersion, which is natural and expected, as high water ratios give the fastest separation in soil material. Samples are coloured differently to distinguish specimens. General statistical information such as means, standard deviation, maximal and minimal values are recorded and visualized in the graphs. Curved lines indicate the histograms of data distribution, which show water content in soil samples received from the dredged sediments. In connection with the determination of the water ratio, the evaluation of the bulk density of various soil samples was also carried out based on the collected dredged sediments.
Figure 3 shows the graph of soil density based on the analysis of the dredged masses (X-axis), where sample point 5 has the lowest bulk density. Such results show that water percentage is the highest in this type of soil. Overall, the bulk density in the examined soil specimens varied from 1.3 to 1.9 g/cm3. The observed three peaks are in the ranges from 1.34 to 1.44, then from 1.5 to 1.6 and—a more dispersed interval—from 1.6 to 1.9. Such values are typical for fine-grained sandy clays constituting marine sediments around Oslo.
The variations of density by observations evaluated using tests estimating water percentage is shown in Figure 3. Here, the assumption tested by the experiments is first, that the development of density in cement-slag-stabilized sediments is related to the water moisture, and second, that using this soil–water relationship, one can model the complete process starting from the early reactions of soil hardening and the development of the stabilization reaction until the main hydration peak with changed density of the evaluated sediment soil samples. Besides, this involves the effects from various locations of samples and different w/b ratios that contribute to the differences in density of the tested soil specimen. In all eight of these experiments, the maximum density of soil samples was recorded as 1.9 g/cm3. This density was found to yield the best results in terms of soil structure when a w/b ratio of 5.2 was reached at the optimal water content, as shown in Figure 3.
3.1.2. Grain Distribution
The dominating soil type in the collected samples of the dredged sediment shows mostly silts with a very fine grain distribution, see Figure A1. Figure 4 shows grain distribution in a batch of the dredged material, which was transported to the SGI for soil particle size analysis to analyze grain distribution. The additional results of this analysis are reported as graphs of grain distribution in Figure A1.
Figure 3.
Density of soil specimens.

Grain distribution in specimens were compared for several test points collected in Sweden and other Nordic countries where several projects with s/s have been implemented, Figure 1. Regarding the composition of the collected dredged soil sediments, soil samples collected from the Port of Oslo contain more clay compared to those from Arendal, Figure 5. This also compares the data from Oslo, Gothenburg and Östrand in Sundsvall.
3.2. Soil Homogenization and Selection of Binders
The selection of binders used for stabilization of soil was adjusted according to our previous studies and several similar projects in Sweden. In mixing tests, a binder ratio of 30% CEM I (SS-EN 197-1) [91] and 70% slag (SS-EN 15167-1) [92] was selected as the most effective combination of binders and homogenized with soil using the KitchenAid eccentric mixer. After mixing, the soil samples were placed in the sampling sleeves, Figure 6. Before mixing binders into the dredged sediment masses, each specimen was homogenized for at least five minutes using a mixer. Normally, in large-scale projects, a Hobart mixer is used for large quantities of mortar or dredged soil material [93,94,95]. However, in this case, because the experiments were performed on a small-scale level, the volumes of soil were too small to use a Hobart mixer. The mixing on a large scale can be performed using a Hobart mixer, which yields practically the same results. In this case, the functionality of the device is solely dependent on the volume of soil, and the mixing process itself produces identical outcomes. Consequently, the use of the smaller device was only adapted for the small portion of the materials tested. This practice is acceptable in the SGI laboratory for small-scale experiments where parts of the soil are tested. Hence, the mixing procedure was performed using the KitchenAid type eccentric mixer, see Figure 6a.
Clayey soil masses and binders were mixed for five minutes to obtain a good homogeneity. As a form of manufacturing the test soil samples, the piston sampling sleeves were used, according to Swedish practice, see Figure 6b showing a standard sampling sleeve. The sleeve has a diameter of approximately 50 mm and a height of 170 mm. The sleeve in the photo is fitted with a lower cover. During the fabrication of the samples, the stabilized dredge masses were placed in the sleeves in several layers. Between each new layer, the sleeves were tapped several times on a table to expel any air that may be trapped in the sleeve during the filling procedure. After the fabrication of the test samples, the sleeves were placed into a water bath, i.e., stored under water.
On the fourteenth day, the specimens were de-moulded. After the de-moulding, the samples were trimmed to a length of 100 mm. This means that the samples have a slenderness factor of 2, which implies that soil samples had a height corresponding to twice the diameter. This is according to Swedish standard practice and means that ordinary geotechnical testing can be carried out without the conversion factors. After homogenization, a certain amount of dredged material and binder was weighed. To calculate the amount of binder, the content of water of the dredged material was calculated based on the water ratio and density of the dredged material, see Table 2.
The tests were implemented using various concentrations of water in a mixture of sediments collected from the Port of Oslo with respect to the amount of binder and water/binder ratio (w/b). The selection of the most optimal w/b value was argued based on the previous research performed in Arendal 2 and Gothenburg (southern Sweden) [96]. During the soil-testing procedure, the experiments were carried out with w/b of 5–7 of the dredged materials, where the lowest level corresponds to the highest amount of binder in relation to the amount of water in the dredged materials, i.e., “high binder–low water” . Accordingly, the highest level of w/b ratio indicates the highest percentage of water and the lowest amount of binder. The w/b ratio in fabricated specimens is reported in Table 2. Here, the data include density of soil samples, and water/binder amounts indicating the percentage of the added binder to the mixture.
Figure 6.
(a): A KitchenAid eccentric mixer used for homogenization of the soil specimens. Photo: Per Lindh; (b): A standard sampling sleeve used for sampling soil specimens. Photo: Per Lindh.
Figure 6.
(a): A KitchenAid eccentric mixer used for homogenization of the soil specimens. Photo: Per Lindh; (b): A standard sampling sleeve used for sampling soil specimens. Photo: Per Lindh.

The ratio of water to binder is recorded separately for slag and cement, and computed using formulae provided in notations for Table 2. Because the compressive strength and the UCS behavior of the stabilised sediments can change significantly over time under different combinations of binders and water/binder proportions, more than one test should be used. Hence, a series of such tests provides sufficient information, which is necessary for characterizing the potential stiffness and strength behavior of soil. Therefore, we used several dozens of samples of soil collected in several test sites (TS). These specimens were stabilized using various w/b percentages to analyze soil performance with changed conditions. Specifically, a total of 70 test samples were fabricated, each with a varied w/b ratio, using soil samples collected from the Port of Oslo.
For w/b ratios equal to 5 and 6, five specimens were fabricated for each sample test point. Of these, three specimens were used for testing strength and seismic measurements, one was used for permeability tests and one specimen was kept in reserve. Such reserve specimens were also used in some cases, when some specimens were damaged during the de-moulding. For two sample points (Sample No. 1_2 and Sample No. 3), samples were also produced with w/b = 7 to check the robustness and reliability of the recipe.
3.3. Seismic Measurements
Seismic measurements on the samples were carried out using special equipment, which measures the natural frequency of the samples. In this study, we used the Integrated Circuit-Piezoelectric (ICP) Accelerometer developed by the PicoCoulomB (PCB) Piezotronics Group Inc. These tests were conducted at the Swedish Geotechnical Institute (SGI) using a pair of vibration source-receivers equipped with the ICP Accelerometer. These instruments indicated changes in pulse velocity, which correspond to the stiffening of the stabilized soil resulting from the reactions between the cementitious binders, water, and soil—a chemical process. Based on the elastic wave frequency, the compression wave velocity (VP) of the samples, also known as P-wave velocity, was calculated. The P-wave velocity is linked to the material’s modulus of elasticity (E) and enables the evaluation of soil strength gained during stabilization.
Existing examples of seismic testing devices include the piezoelectric transducers used in similar studies [97,98,99]. The seismic testing devices are capable of measuring the velocity of seismic waves that travel through the soil sample. This velocity varies with material composition and stiffness, making it a valuable descriptor of soil properties. There are numerous categories of transducers with different setting parameters and functionalities for measuring seismic refraction by estimating the travel time of the seismic body waves.
These devices find applications in evaluating the nature and depth of the subsurface, which can be computed using the data on the velocity of P-waves in the soil layers. An example of such transducers includes disk-shaped piezo-ceramic transducers. Refs. [100,101], accelerometers transmitting the signals and sensors receiving the data [102,103], and resonant column testing, which may be used in the two modes: either fixed-free or free-free boundary conditions [104].
Of these, the most widely used approach is the resonant column testing applied in this study, and with many examples of applications for seismic testing in cementitious materials [105,106,107,108]. Hence. in this case, the resonance frequency of P-waves was measured at different time periods to evaluate the development of the strength in the specimen and changes in its dynamics with time, which indicates the increase in stiffness and density of soil specimens. The equipment for measuring P-wave velocity was readily available at SGI, and the methods used followed a process of seismic measurements to evaluate the P-wave velocity of the specimens. This process was conducted in accordance with the existing workflow scheme [109].
3.4. Compressive Strength Measurements
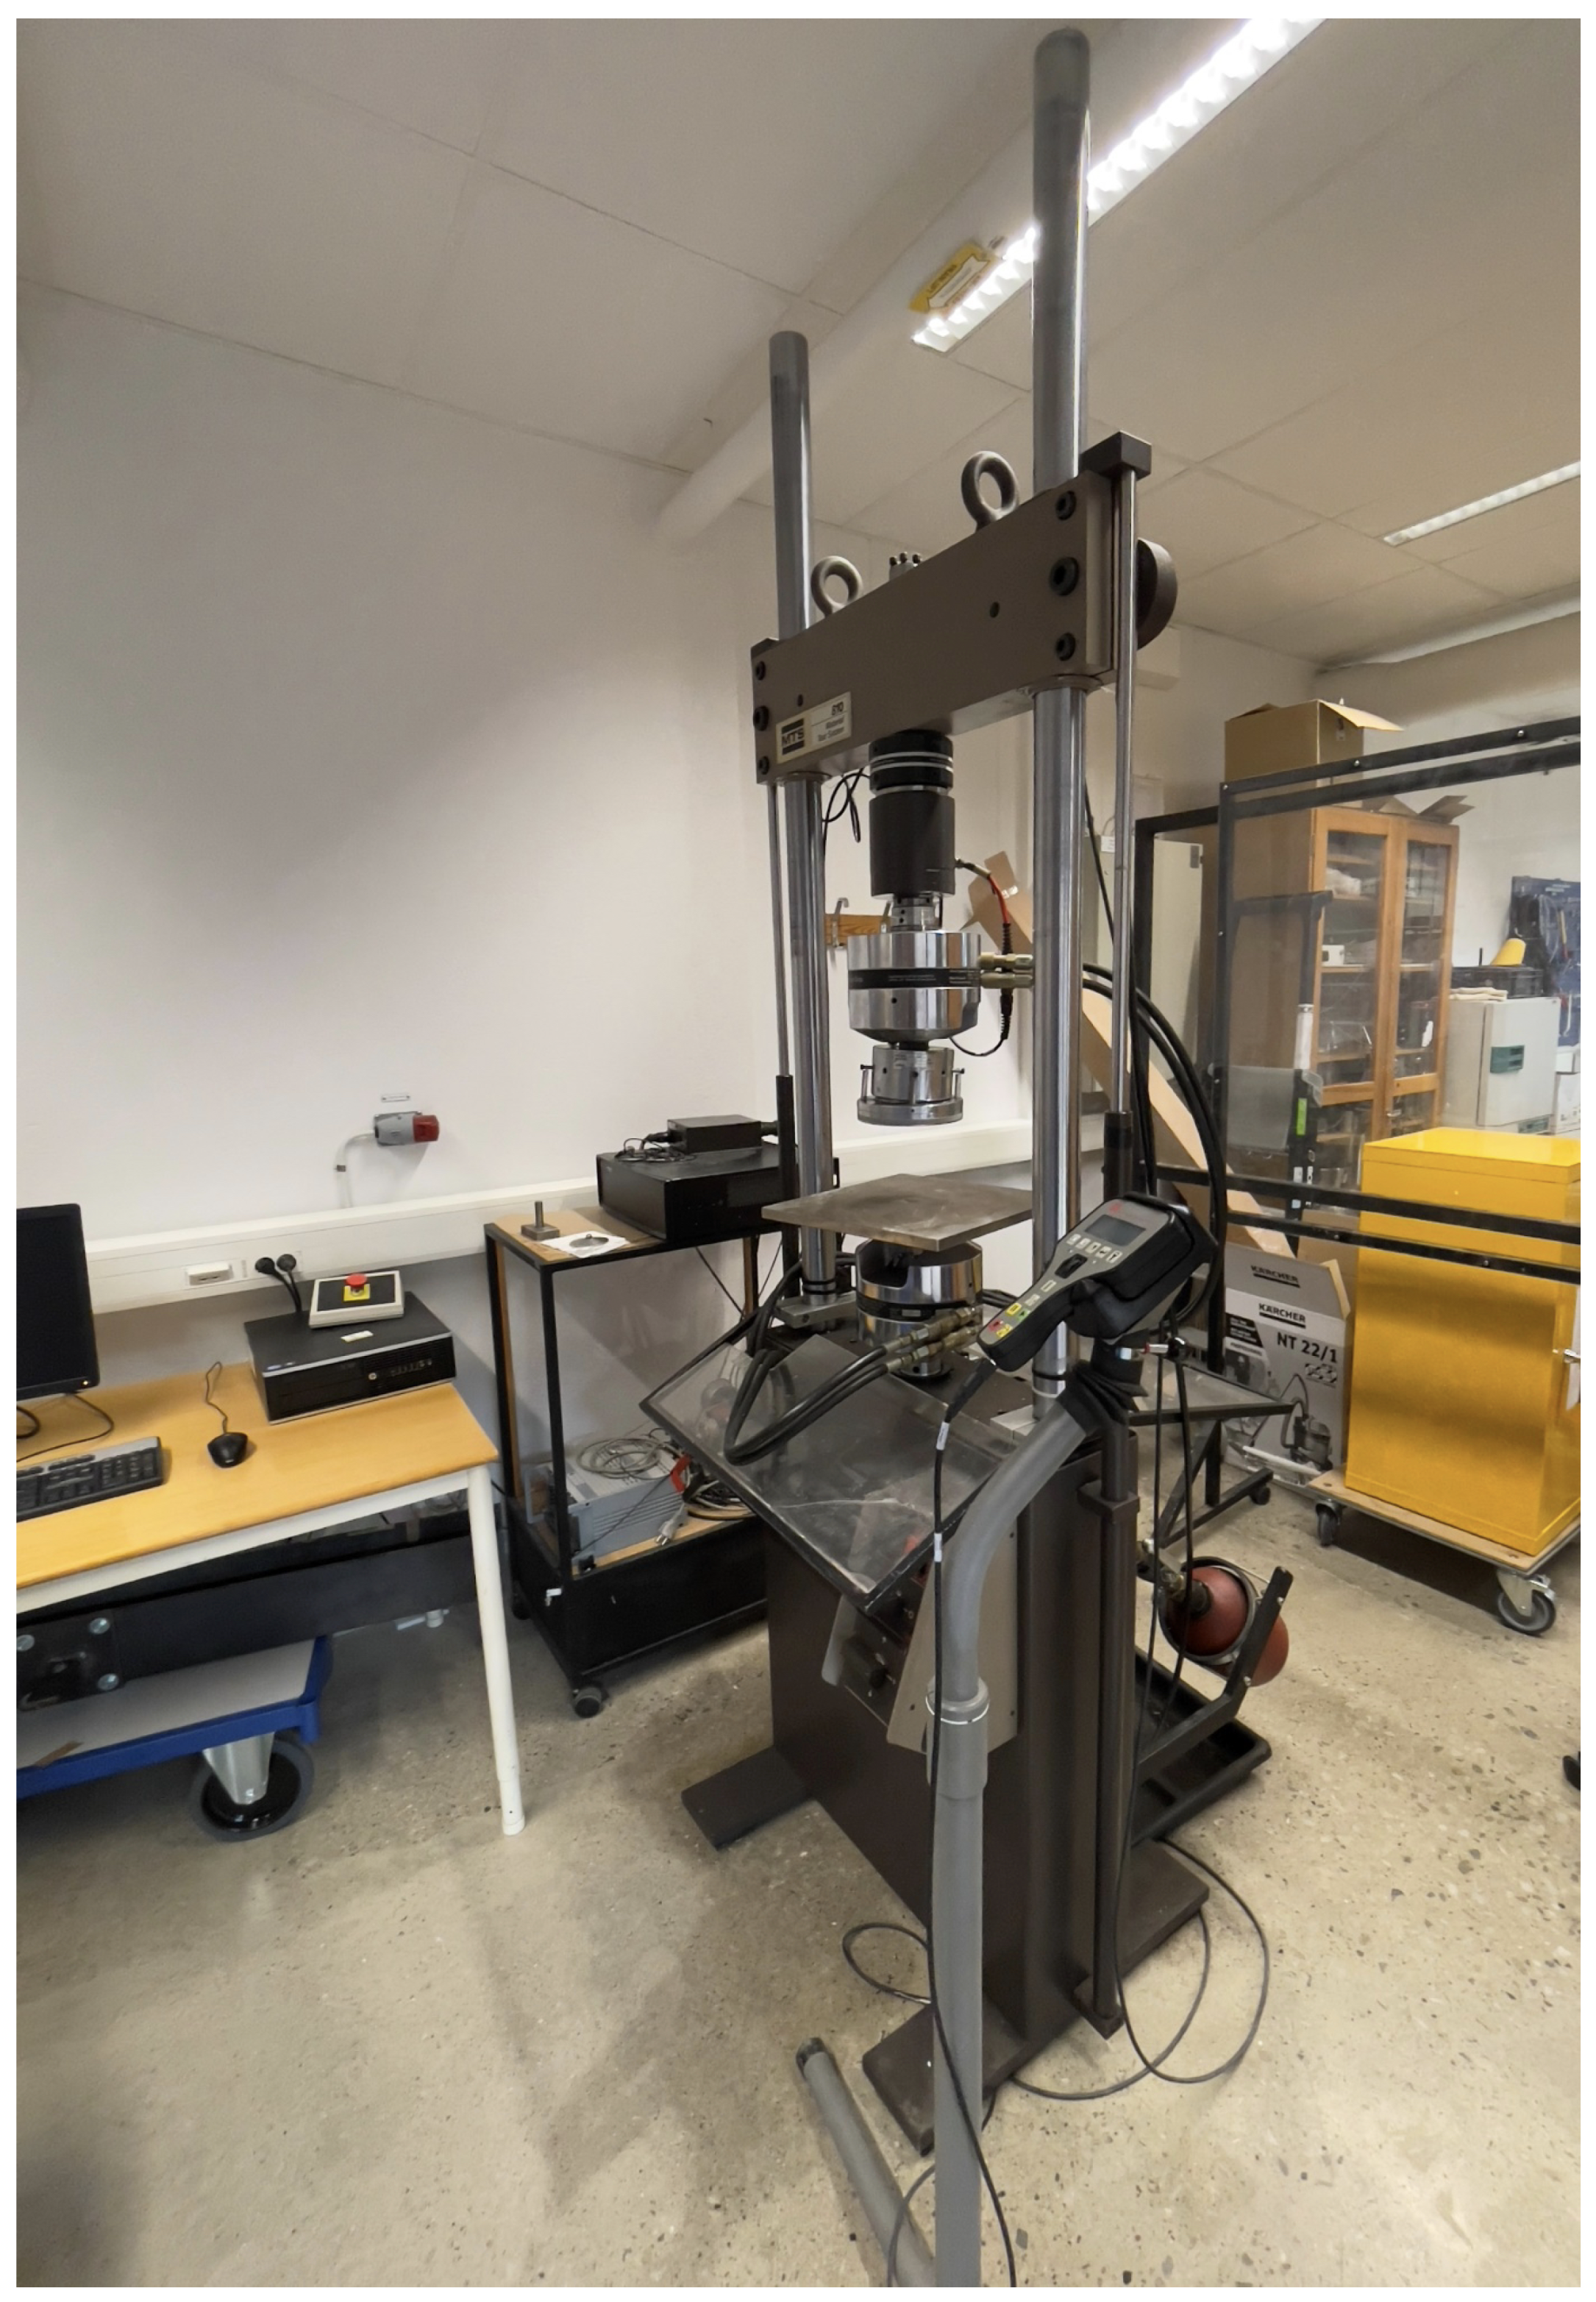
After the trimming of soil specimens and measuring their resonance frequency, the samples were placed into the plastic bags. To ensure the high humidity in the plastic bags, a piece of the moistened paper was placed in each plastic bag. After the curing procedure, soil samples were pressed to failure in a 100 kN pressure press of the brand MTS. The instrument is shown in Figure 7, which shows the MTS 810 servohydraulic universal testing machine used for test compressing the specimens.
Since the first servohydraulic universal testing machine designed for soil testing, the instrument was constantly improved, which resulted in a variety of existing and modified instrument devices and apparatuses. Current advances in technical progress and rapid development of scientific instruments of soil testing in the 20th century resulted in various types of adjusted modifications of UCS testing machines with enhanced properties and improved functionality. The machines used for testing soil in this study included the MTS 810 servohydraulic universal testing machine available in the Swedish Geotechnical Institute. It has the advantages of maximum force capacity of 10 t in both compression and tension, making it suitable for testing the compressive strength of the specimens. The MTS 810 servohydraulic universal testing machine represents an advanced technique for evaluating real-time soil strength dynamics during compressive tests of soil stabilized with binder materials, as shown in Figure 7.
Figure 7.
MTS 810 servohydraulic universal testing machine with maximum force capacity of 10 t in compression/tension used for test compressive strength of the specimens. Photo: Per Lindh.
Figure 7.
MTS 810 servohydraulic universal testing machine with maximum force capacity of 10 t in compression/tension used for test compressive strength of the specimens. Photo: Per Lindh.
The loading rate was 1% of the height of the specimen per minute, i.e., 1.0 mm/min, which is in accordance with the standard SS-EN 16907-4 [110]. However, it should be mentioned that the Swedish Geotechnical Institute (SGI) uses a standard of 1.2 mm/min, which corresponds to the technical characteristics adjusted to the local needs. Nevertheless, this small difference has no significance for the determination of the compressive strength of the soil material. With regard to these tests, the additional experiments were also carried out using the calorimeters to assess different reactions from w/b and then evaluating the P-wave velocities passing through soil samples.
4. Results and Discussion
The results from the laboratory-based tests both at LTH and at SGI show that dredged sediment masses are well suited to be stabilized/solidified with an inorganic binder consisting of 30% cement type CEM I (according to CEN 197-1) and 70% ground granulated blast-furnace slag (GGBFS) according to EN 15167-1 [92]. The first requirement for the amount of binder should be at least 120 kg/m3. A secondary condition is that the weight ratio between the weight of water contained in a mixture and the weight of the added binder should be ≤5. Besides, it should be pointed out that in the case of high water percentage in the original dredged masses, such as marine sediments with high percentage of water, the secondary condition will be a w/b ≤ 5 result in a higher amount of binder.
4.1. Binder Content Related to Strength
Figure 8 shows a graph, which illustrates variation in the values of compressive strength with different proportions between cement and slag where the effects from binders are clearly visible. Here, the mechanical properties of soil were evaluated against the development of UCS in two ways: first, as a function of stabilization by cement (as it is common in ordinary cement measurements, dark blue coloured), and second, as a function of stabilization with slag (i.e., soil strength measured for a selected soil sample stabilized with slag, brown colour in Figure 8). These tests were carried out on the dredged masses collected from the Arendal 2 in Gothenburg. In the tests, the total amount of binder remains the same while the ratio between cement and slag varies from 0% slag to 90% slag. Samples with 70% slag give the highest compressive strength. Black dots represent the results from the tests on the Uniaxial Compressive Strength (UCS). Strength development in soil stabilized with varying combinations of cement and slag was evaluated. The best combination of binders was detected to control their effects on strength development, which is obtained at a slag admixture of 70% of the total amount of binder, Figure 8. In this way, the highest content of binders with the maximal achieved strength in soil samples can be evaluated.
The results of the evaluation of geotechnical properties of soil are based on the performed resonance frequency measurement and tests of UCS. As the resonance frequency measurements are non-destructive, the same specimens were measured on several occasions and the development of the P-wave velocity over time was followed, see Figure 9. Here, the graph shows a correlation of P-wave velocity in relation to the curing age of the soil. More specifically, the variation of P-wave velocity with different soil samples collected in various test sites and stabilized with cement and slag shows that there is a good linear correlation between the curing time and the mechanical properties of soil indicating a general gain in strength over time of curing, which is reflected in increased velocity of P-waves. The points separating the lines into the segments shown in the image represent measurements of soil. These samples were taken and measured over a control period of time to evaluate the dynamics of P-waves, which indicates gain in strength on a trend line. The samples here were stored at 20 °C. The blue points correspond to the w/b = 5, green points correspond to w/b = 6, and red points correspond to w/b = 7, respectively. Different points give different growth, which can depend on both grain distribution in individual soil samples, and the impurity of content, Figure 9. The results are comparable for different samples plotted per one gram of binder. This indicates that a significantly earlier time can be used to predict, for example, the 50th day of strength.
In the curves of Figure 9, we noted an almost linear correlation between the curing time and the increase in speed (i.e., sound velocity) and the frequency of measured P-waves passing the soil samples, which indicates the improvement of the mechanical parameters of soil, such as elastic (Young’s) modulus, and indicates a gain in soil strength over the period of curing. Moreover, one can conclude from the analysis of Figure 9 that for a selected binder blend (w/b 5–7 for different test sites; see the legend in upper right corner of Figure 9). Stiffness and strength development (which corresponds to the E modulus) is approximately linearly related to the curing period, and is also well correlated with the values of P-wave, their sound velocity and frequency.
Table 3 summarizes the data on the measured samples and the results of the compressive strength (UCS, kPa) using mechanical tests with varied w/b ratios. More specifically, Table 3 shows the values of the compressive strength according to the different w/b ratios for specimens collected in various test sites (TS). The measurements of the UCS correspond to the columns 3, 6 and 9 in Table 3). The UCS tests were carried out according to the existing Swedish standard SS-EN 16907-4 [110] with recommended deformation rate of 1 mm/min for soil specimens with a height of 100 mm. The results are summarized in Table 3. For the point 1_2, the w/b = 5–7 were tested for each specimen. As the ratio between water and binder controls the strength, samples with w/b = 5 had higher strength compared to the samples with w/b = 6 or 7, which proved the expected results.
The specimens within the same w/b, for instance, ID No. 1_1 to 1_4, show smaller variation in strength values. The same applies to the other w/b ratios. Test samples No. 1_1 and test body 1_2, however, show a different stiffness compared to other samples. Such variation in stiffness is normal and is explained by natural individual parameters of the soil masses. The results of the tests on the compressive strength and water/binder ratio for specimens collected from the sampling point No. 3 are also shown in the same dataset, Table 3. Specimen 4_4 from TS 4 obtained a significantly higher strength compared to others with the same w/b and should therefore be considered as an outlier.
4.2. Water–Binder Ratio
Table 4 shows the compressive strength with relation to the effects of changed water/binder ratio (w/b) for the test points No. 5, 6 and 8, and additionally, the P-wave velocity for test site 5. Here, soil stabilized by the blended cement-slag mixtures and water added in various proportions into the mixture indicates good performance in stabilization. This is achieved due to balanced w/b proportions. This combination outperforms that of soil treated by cement-only binders. With regard to the obtained results of the UCS tests, P-wave measurements were performed to analyze the correlation of the P-wave velocity against the compressive strength in evaluated soil samples. Therefore, after testing the P-wave velocity, the values of the compressive strength were calculated based on the recorded data on the speed of waves, which correlate with the strength of the materials. These results are reported in Table 4.
4.3. Soil Deformation
Figure 10 shows a graph of correlation between the pressure (kPa) and relative deformation of the soil specimens collected from the sample tests site point No. 1_2. The values of the compressive strength were categorized as different lines recorded by the measurements of specimens. Overall, the values of the compression did not exceed 900 kPa. Originally recorded by the UCS device, the data were modelled and evaluated statistically using the Statistica software 14.0.1. The effectiveness of the UCS tests is ensured by the high precision measurements and force capacity in the MTS 810 testing machine, which operates for various temperature and soil conditions. The stability precision ensures a wide total range of UCS values, since this MTS 810 machine measures soil strength at a high level of precision. The MTS machine was used for a complete period of testing, i.e., over 60 days, as in case of this study (2 months), which enabled us to analyze the dynamics of gain in strength.
The segments of lines are separated by measured strength values, appearing as fragments on the general trend lines, which depict the dynamics in relative deformation individually for various soil specimens. In contrast to the soil samples from test sites 1 to 8, the use of blended mixtures with different ratios of water/binder in cement/slag blends in tests 11–13 demonstrates more stable results of compression and strength gain. After achieving the peak compression, the deformation values stabilize at approximately 2% of the values in soil samples compared to the original raw materials.
Figure 10.
Correlation between compression (kPa) and relative deformation of 10 specimens collected from the sample test site No. 1_2.
Figure 10.
Correlation between compression (kPa) and relative deformation of 10 specimens collected from the sample test site No. 1_2.

The increase in relative deformation continues rapidly until the values of the compression strength reach 800 kPa, after which they stabilize and then decrease. Possible distortions and noise on the samples 11 to 13 are identified and classified as unstable responses to the content of the binder by the selected soil samples, since these specimens were compressed with relatively low strength that does not exceed 300 kPa. Samples 1 to 8 demonstrate a stable dynamics in measurements. In all cases, the relative deformation was measured until a value of 2.2%. The comparison of the plots for soil samples collected in test sites (TS) from 1 to 13 suggests the direct effects from the water/binder ratio on the hydration of cement that leads to the gain in strength (UCS). Such findings are necessary to account for the identification of the best combinations of binders and w/b ratio, while optimizing binder blends and selecting the proportions of water in recipes.
Figure 11 shows a graph of the pressure-deformation relationship for soil samples collected from the test point No. 3 with three different levels of w/b, which are clearly visible in the graph. Randomly coloured line traces indicate selected sample specimens tested for evaluation of soil deformation. The first number in the numbering is the test point, in this case point No. 1_2. The second number is a serial number. Samples 1 to 4 have w/b = 5, samples 6 to 8 have w/b = 6 and samples 11 to 13 have w/b = 7. The variations in strength prove the expected results with the highest values for w/b = 5 and the lowest strength for w/b = 7, respectively.
As the curves in specimens 11 to 14 are almost identical with regard to the development of relative deformation and do not exceed 200 kPa in maximal values, this indicates that the measurement of UCS tests will give a good prediction of the deformation–strength relationship and will also extrapolate for the strength over the time exceeding the testing period. One can see in Figure 11 that the highest compression (over 800 kPa) is achieved by the soil collected in test sites 1 to 3. Furthermore, middle values correspond to the soil collected in sites TS 6 to 9 of the testing samples, with maximal values below 330 kPa. The development of the compressive strength is related with the elastic modulus of soil.
Figure 11.
Correlation between the compression (kPa) and relative deformation of 11 specimens from the sample test site No. 3.
Figure 11.
Correlation between the compression (kPa) and relative deformation of 11 specimens from the sample test site No. 3.

Accordingly, for the sample point No. 3, the expected pattern is shown in the same way in soil specimens with values of water/binder ratio between 5–7, see Figure 11. Here, the fragments of the modelled lines were annotated and randomly coloured using the IDs of soil samples and records on deformation value against the compression (kPa). However, the specimens collected from the sample test point 3_1 exhibit a slightly lower level of strength compared to other two test samples with w/b 5. For samples from the point No. 3, less variation in stiffness was detected compared to the samples collected from the test point No. 1_2. Here, we also demonstrated the relationship between the compressive strength and a relative deformation, which reaches peak at 850 kPa, after which it stabilizes and then decreases.
4.4. P-Wave Velocity vs. UCS
Figure 12 shows a graph of the measured P-wave velocity as a function of the UCS. In this experiment, we evaluated the ability of ultrasonic testing to leverage from the P-wave velocities to strength gain in the soil samples. The variations at a higher strength are completely normal. Since these data are presented by the independent soil samples, we first test P-wave responses passing through specimens of each soil sample test based on their individual characteristics, such as water content, density and grain size. We then evaluate the P-waves in soil samples stabilized with various w/b ratios at the start and end times, and the selected intervals in between. The behaviour of strength over time in samples of soil stabilized by cement approximately resembles the logarithmic curve showing the relationship of the hardening of the materials with their increase in strength.
Then, we extracted the information from the measured records, indicating the P-wave speed changing over the measured time, to evaluate the dynamics in strength gain for each soil sample. The technical details of the P-wave values were recored in the metadata, including wave speed, maximal and mean values with relation to the UCS. The analysis of the graph in Figure 12 shows the following data. The P-wave velocity shows a stable increase from 415 m/s to 1170 m/s, which is achieved by the compressive strength of 1220 kPa. The speed of P-waves when passing the soil samples was monitored in a straightforward way by measuring the speed from sensors received by the ICP Accelerometer. The development of P-wave velocities continues even after the cementation of the soil mixed with binders during stabilization for a measured period, as depicted in Figure 12.
Figure 12.
P-wave velocity as a function of the compressive strength. The dotted blue line signifies a general trend for the increase in the compressive strength of soil; blue dots signify values of the compressive strength for measured soil samples.
Figure 12.
P-wave velocity as a function of the compressive strength. The dotted blue line signifies a general trend for the increase in the compressive strength of soil; blue dots signify values of the compressive strength for measured soil samples.

The parabola function well represents the relationship between P-wave velocity and compressive strength in Figure 12, which clearly depicts its nonlinear nature. The correlation of P-wave-velocity and compressive strength well differs from the curves presented in earlier plots and has a steeper curvature, since it represents the relationship of the speed of the elastic waves on the stiffness or porosity of the solid material. The tests were performed on soil samples, which have varying w/b ratios in the binder mixture cement/slag content. Since the behaviour of elastic waves released by the accelerator and processed back by the receiver differs for samples stabilized with blended mixtures, various values for dots in Figure 12 well illustrates the effects and minor variations of w/b mixtures in slag-cement binders on soil strength. Nevertheless, the trend curve shows a general direction of the relationship between P-waves and strength in soil as a parabola function. Soil samples stabilized with cement/slag binders and different w/b ratios can be distinguished as individual dots on a graph.
In a sense, long-term stabilized samples exhibit a higher degree of strength and correspondingly high P-wave velocities, while the ones recently stabilized have lower values and are comparable (e.g., for P-wave velocities of 440 or 600 m/s), indicating a similar behavior of the soil. However, the highest P-wave speed values (values over 100 m/s) were recorded for the highest UCS and long-term curing time, showing a higher dispersion of values. This is not surprising, as the balanced viscosity of the water-binder ratio in cementitious binders and their rheological parameters are well-known effective factors for soil strength. The strength is assessed using indirect descriptors that differ for individual samples.
Tests with iteratively changed binder parameters were used to select the best combinations by utilizing various w/b ratios in a recipe of blended binders. The differences in P-wave behavior and UCS indirectly indicate variations in the porosity of soil stabilized with various blended mixes (cement/slag) and w/b ratios, and these are compared with the soil samples recently stabilized, as shown in Figure 12.
Figure 13 illustrates a graph of the P-wave velocity in relation to the UCS for the Oslo project, compared with selected Swedish projects involving the stabilization of dredged soil sediments. The results obtained in this survey align well with those from the earlier Swedish projects. Thus, with regards to compressive strength and the relationship between P-wave velocity and strength, the test results from this study confirm the expected estimations, as shown in Figure 13.
The results presented in this study demonstrate that the stabilization of dredged marine sediments with an adjusted ratio of water-binder, evaluated using sonic tests, proves to be an efficient and powerful framework. This approach takes into account multiple variables that affect soil hardening and their attributes.
Figure 13.
P-wave velocity as a function of the UCS.

In Figure 13, the P-wave velocity has been evaluated from samples collected from Arendal (A), Västerås (V), Oslo (O), and Timrå (two sites T1 and T2) after the curing period. The analysis of the UCS data interprets the degree of cement hydration, indicating the soil stabilization process from the speed of the P-waves that correlate with increased soil strength during stabilization. The maximal level of soil strength is achieved at the w/b ratio of 5 where P-waves reach the recorded velocity of 1161 m/s. Such a good performance has a theoretical explanation of the optimized plasticity and viscosity of the binder recipe, which improves the mechanical properties of the cured soil. In particular, we derive the development of P-wave velocity with curing time up to 60 days to demonstrate the effects from the two factors: the dynamics of strength over time and the influence of water–binder percentage on soil setting.
This part of the study was conducted as a critical test case to comparatively evaluate the behavior of the treated soil samples relative to the locations and environmental conditions of the original raw materials. The regression analysis demonstrates the statistical processing of the data collected in Oslo (represented by black crosses) at the end of the curing period for different combinations of w/b ratios. We visually analyzed the similarity between the curves for these soil samples, which were tested with varied w/b proportions and collected from different locations. The goal was to compare the effects of increasing the ratio of stabilizing agents while decreasing water content.
The graph illustrates a clear visual similarity in curves, with soil collected from the Timrå site exhibiting steeper curves compared to the other locations. This indicates soil samples with the highest percentage of binders relative to water content.
4.5. Environmental Parameters
The results of the environmental engineering tests performed using shake tests are presented in Table 5 and Table 6. As a comparison, shake tests were also performed on stabilized samples. However, the shake tests are not completely representative as the material is crushed down to less than 4 mm, which is not the purpose of stabilization/solidification. Nevertheless, these results show a significant reduction in leached heavy metals–arsenic (As); lead (Pb), cadmium (Cd), chromium (Cr), mercury (Hg), nickel (Ni) and zinc (Zn), sum PAH-16 and tributyltenn (TBT), according to the performed shake tests with L/S 10, PAH, PCB and TBT, see Table 5. The leaching tests were performed using Swedish standard SS-EN 12457-2 [111]. The extended uncertainty is 51% according to the standard SS-EN 12457-2. It was calculated with a coverage factor equal to 2, which gives a confidence level of approximately 95%.
From a pure civil engineering perspective, it seems more reasonable to model each soil sample as the superposition of factors that include variations in binder proportions and water content [112,113,114]. Shared across all the soil samples of the same probe, such experiments enable us to evaluate the effects of the water–binder dosage on the stabilization process and environmental properties. Thus, such an approach enables us to evaluate leaching of heavy metals and toxic substances, with regard to the individual properties of soil: density, moisture, grain size, type, texture, content of clay/sand, amount of organic matter. In this paper, we demonstrated that this representation allows us to account for the differences between various dosages in water–binder mixtures and their effects on stabilization in the same class of soil samples. Furthermore, we showed the non-linearity in the soil modelling process when we evaluated the relationship between the soil texture and water–binder percentage.
Our results are relevant for the analysis of geotechnical properties of soil since they provide new information about the strength parameters of soil stabilized with various water–binder mixtures. Adjusted proportions of binders allow us to focus on soil hardening through the stabilization workflow with an optimized water–binder ratio. We furthermore demonstrated that the water–binder ratio is an important factor in s/s soil treatment techniques aimed at improving the initially poor engineering properties of dredged marine sediments prior to reuse as construction materials. Thus, the measurements of UCS investigated here provide a concrete illustration of the role of w/b recipes in the hardening of clayey soil (dredged sediments collected from the harbour of Oslo) stabilized with cement/slag in various ratios. Since the ratio of these binders remained constant, and we only changed the water content, this enabled us to see the effects of a stiff/wet binder on the hydration of cement and, thus, soil stabilization with various proportions of water/binder.
5. Conclusions
In this paper, we developed an effective framework for modelling the w/b effects on stabilization of clayey dredged materials collected from the harbour of Oslo, Norway. We proposed two methods for evaluating soil strength stabilized using different water/binder ratios, namely, using UCS tests implemented by the MTS 810 servohydraulic universal testing machine, and using sonic tests with evaluated velocities of pulsed P-waves. Inspired by the existing approaches of seismic methods applied to civil engineering problems [115,116], we prove that a combination of state-of-the-art methods with non-destructive seismic tests can model the dependency of soil strength on binder proportions, w/b ratio and curing time. Specifically, the analysis of the presented data shows that the lowest P-wave seismic velocity of 1200 m/s is demonstrated by the highest strength and corresponding UCS values, which is achieved by the optimal proportion of water with the lowest content of binder, i.e., w/b = 7.99, and the lowest absolute content of binder, such as 2.022 mB/g. This shows the performance of physical mechanisms in soil particles operating during the hydration of cement in the process of soil stabilization, and the setting of soil-binder mixtures, which were evaluated by seismic tests.
Under the framework of the presented modelling of stabilized soil properties, it was shown that various w/b dosages provide essential information at the variable feature level for modelling the dependency of soil strength on a binder content. Besides, the improved binder properties enhance key characteristics of the construction materials, such as compressive, tensile and shear strength, ductility and flexure [117,118,119]. Finally, the optimal combination of the w/b ratio is obtained for dredged clayey sediments in a laboratory scale, which can be generalized at the large-scale project level. Hence, as noticed in Table 4, summarizing the results of the compressive strength in various w/b proportions of binders used for soil stabilization, seismic (P-wave velocities) and mechanical measurements show an agreement in a significant increase in the strength of soil samples over the period of curing with increased binder content and w/b = 5 when the strength measured by UCS tests exceeded 500 kPa, and P-waves were higher than 1000 m/s. This proves positive effects from the water/binder ratio of 5 on clayey soil stabilization.
The proposed modelling of soil properties at a laboratory scale minimizes the costs of the project-run works where large quantities of sediments must be dredged repeatedly for the needs of marine transportation. In view of this, the contributions of the this paper are threefold:
- We proved that dependency of strength of clayey soil on w/b ratio can be modelled by a linear combination of tested specimens showing the gain of strength, and the improved ecological properties of soil—leaching of heavy metals and toxic substances.
- The assumptions on the effects from the changed w/b dosage on the behaviour of the marine sediments is tested by adding various percentages of admixtures of cement/slag as binders.
- We developed a novel framework for testing high-plasticity clayey sediments collected in Oslo harbour, Norway, and proposed two methods for evaluating soil strength using the standard UCS approach and measured P-wave velocities.
- We showed that the combination of the P-waves and UCS methods for evaluating soil properties outperforms the standard state-of-the-art approach in two ways.
- –
- First, the P-wave velocities are non-destructive tests, which can be performed using portable devices and contain necessary information related to soil strength.
- –
- Second, the analyzed sensitivity of the ICP Accelerometer for measured resonance frequencies of sediments proved its high perception to varied levels of stiffness and viscosity of soil samples stabilized with different w/b dosages.
The essential practical advantage of the presented work consists in the optimization of the soil stabilization process in marine harbours prior to construction works where large quantities of soil are to be stabilized. For instance, optimization of the processing of millions of tons of the dredged sediment material using s/s techniques increases cost-effectiveness. Thus, the optimization of s/s techniques in such large-scale projects is crucial. The optimization of the w/b dosage supports finding the best analytical solution for cost-effective s/s treatment of soil from marine harbours, when sediments are collected regularly and in large quantities. Using our data, the information on soil strength depending on the w/b ratio and deformation of clayey soil specimens in the process of compression can be generalized in large-scale projects. Overall, the results of seismic and UCS measurements demonstrated in this study show a similar trend and agreement in the estimated strength of stabilized specimens. The strength increased over the curing time in stabilized soil samples, as indicated by both seismic and UCS measurements.
Author Contributions
Supervision, conceptualization, methodology, data curation, visualization, software, validation, resources, investigation, funding acquisition, and project administration, P.L. (Per Lindh); writing—original draft preparation, methodology, software, formal analysis, writing—review and editing, and investigation, P.L. (Polina Lemenkova). All authors have read and agreed to the published version of the manuscript.
Funding
This research received no external funding.
Institutional Review Board Statement
Not applicable.
Informed Consent Statement
Not applicable.
Data Availability Statement
Not applicable.
Acknowledgments
The authors thank the reviewers for reading, suggestions and comments that improved an earlier version of this manuscript.
Conflicts of Interest
The authors declare no conflict of interest.
Abbreviations
The following abbreviations are used in this manuscript:
| GGBFS | Ground Granulated Blast-Furnace Slag |
| UCS | Uniaxial Compressive Strength |
| MTS | Material Testing Systems |
| SGI | Swedish Geotechnical Institute |
| w/b | water/binder |
Appendix A. Grain Distribution Plots
Figure A1.
Grain distribution in sediments showing dominated fine-grained silts (<0.063 mm): (a) soil samples with weight percent of grain content from 18 to 87%; (b) soil samples with weight percent of grain content from 20 to 94%; (c) soil samples with weight percent of grain content from 19 to 83%; (d) soil samples with weight percent of grain content from 8 to 53%; (e) soil samples with weight percent of grain content from 12 to 73%; (f) soil samples with weight percent of grain content from 10 to 48%.

References
- Lim, Y.C.; Shih, Y.J.; Tsai, K.C.; Yang, W.D.; Chen, C.W.; Dong, C.D. Recycling dredged harbor sediment to construction materials by sintering with steel slag and waste glass: Characteristics, alkali-silica reactivity and metals stability. J. Environ. Manag. 2020, 270, 110869. [Google Scholar] [CrossRef]
- Lindh, P.; Lemenkova, P. Geochemical tests to study the effects of cement ratio on potassium and TBT leaching and the pH of the marine sediments from the Kattegat Strait, Port of Gothenburg, Sweden. Baltica 2022, 35, 47–59. [Google Scholar] [CrossRef]
- Wang, H.; Zentar, R.; Wang, D.; Ouendi, F. New Applications of Ordinary Portland and Calcium Sulfoaluminate Composite Binder for Recycling Dredged Marine Sediments as Road Materials. Int. J. Geomech. 2022, 22, 04022068. [Google Scholar] [CrossRef]
- Hussain, M.; Levacher, D.; Leblanc, N.; Zmamou, H.; Djeran-Maigre, I.; Razakamanantsoa, A.; Saouti, L. Reuse of harbour and river dredged sediments in adobe bricks. Clean. Mater. 2022, 3, 100046. [Google Scholar] [CrossRef]
- Slimanou, H.; Eliche-Quesada, D.; Kherbache, S.; Bouzidi, N.; Tahakourt, A. Harbor Dredged Sediment as raw material in fired clay brick production: Characterization and properties. J. Build. Eng. 2020, 28, 101085. [Google Scholar] [CrossRef]
- Wang, D.; Zentar, R.; Abriak, N.E. Temperature-Accelerated Strength Development in Stabilized Marine Soils as Road Construction Materials. J. Mater. Civ. Eng. 2017, 29, 04016281. [Google Scholar] [CrossRef]
- Yoobanpot, N.; Jamsawang, P.; Simarat, P.; Jongpradist, P.; Likitlersuang, S. Sustainable reuse of dredged sediments as pavement materials by cement and fly ash stabilization. J. Soils Sediments 2020, 20, 3807–3823. [Google Scholar] [CrossRef]
- Calmano, W.; Förstner, U.; Kersten, M.; Krause, D. Behaviour of Dredged Mud after Stabilization with Different Additives. In Contaminated Soil: First International TNO Conference on Contaminated Soil, Utrecht, The Netherlands, 11–15 November 1985; Springer: Dordrecht, The Netherlands, 1986; pp. 737–746. [Google Scholar] [CrossRef] [Green Version]
- Pedersen, K.B.; Benamar, A.; Ammami, M.T.; Portet-Koltalo, F.; Kirkelund, G.M. Electrokinetic Remediation of Dredged Contaminated Sediments. In Electrokinetic Remediation for Environmental Security and Sustainability; John Wiley & Sons, Ltd.: Hoboken, NJ, USA, 2021; Chapter 5; pp. 99–139. [Google Scholar] [CrossRef]
- Puppala, A.J.; Mohammad, L.N.; Allen, A. Permanent Deformation Characterization of Subgrade Soils from RLT Test. J. Mater. Civ. Eng. 1999, 11, 274–282. [Google Scholar] [CrossRef]
- Crocetti, P.; González-Camejo, J.; Li, K.; Foglia, A.; Eusebi, A.; Fatone, F. An overview of operations and processes for circular management of dredged sediments. Waste Manag. 2022, 146, 20–35. [Google Scholar] [CrossRef]
- Svensson, N.; Norén, A.; Modin, O.; Karlfeldt Fedje, K.; Rauch, S.; Strömvall, A.M.; Andersson-Sköld, Y. Integrated cost and environmental impact assessment of management options for dredged sediment. Waste Manag. 2022, 138, 30–40. [Google Scholar] [CrossRef]
- Grubb, D.G.; Chrysochoou, M.; Smith, C.J. Dredged Material Stabilization: The Role of Mellowing on Cured Properties. In Proceedings of the GeoCongress 2008, New Orleans, LA, USA, 9–12 March 2008; ASCE: Reston, VA, USA, 2008; pp. 772–779. [Google Scholar] [CrossRef]
- Yu, C.; Cui, C.; Zhao, J.; Zheng, J. A novel approach to utilizing dredged materials at the laboratory scale. Constr. Build. Mater. 2021, 313, 125568. [Google Scholar] [CrossRef]
- Dermatas, D.; Dutko, P.; Balorda-Barone, J.; Moon, D.H. Geotechnical Properties of Cement Treated Dredged Sediment to Be Used as Transportation Fill. In Dredging ’02; ASCE: Reston, VA, USA, 2002; pp. 1–14. [Google Scholar] [CrossRef]
- Wang, F.; Xu, J.; Zhang, Y.; Shen, Z.; Al-Tabbaa, A. MgO-GGBS Binder–Stabilized/Solidified PAE-Contaminated Soil: Strength and Leachability in Early Stage. J. Geotech. Geoenviron. Eng. 2021, 147, 04021059. [Google Scholar] [CrossRef]
- Calmano, W. Stabilization of Dredged Mud. In Environmental Management of Solid Waste: Dredged Material and Mine Tailings; Springer: Berlin/Heidelberg, Germany, 1988; pp. 80–98. [Google Scholar] [CrossRef] [Green Version]
- Zhang, W.; Zhao, L.; McCabe, B.A.; Chen, Y.; Morrison, L. Dredged marine sediments stabilized/solidified with cement and GGBS: Factors affecting mechanical behaviour and leachability. Sci. Total Environ. 2020, 733, 138551. [Google Scholar] [CrossRef] [PubMed]
- Slama, A.B.; Feki, N.; Levacher, D.; Zairi, M. Valorization of harbor dredged sediment activated with blast furnace slag in road layers. Int. J. Sediment Res. 2021, 36, 127–135. [Google Scholar] [CrossRef]
- Lindh, P.; Lemenkova, P. Leaching of Heavy Metals from Contaminated Soil Stabilised by Portland Cement and Slag Bremen. Ecol. Chem. Eng. S 2022, 29, 537–552. [Google Scholar] [CrossRef]
- Zhang, W.; Zhao, L.; Yuan, Z.; Li, D.; Morrison, L. Assessment of the long-term leaching characteristics of cement-slag stabilized/ solidified contaminated sediment. Chemosphere 2021, 267, 128926. [Google Scholar] [CrossRef] [PubMed]
- Chi, L.; Li, M.; Zhang, Q.; Liang, X.; Huang, C.; Peng, B.; Sun, H. Cobalt immobilization performance and mechanism analysis of low carbon belite calcium sulfoaluminate cement. Constr. Build. Mater. 2023, 386, 131545. [Google Scholar] [CrossRef]
- da Rocha, C.G.; Marin, E.J.B.; Samaniego, R.A.Q.; Consoli, N.C. Decision-Making Model for Soil Stabilization: Minimizing Cost and Environmental Impacts. J. Mater. Civ. Eng. 2021, 33, 06020024. [Google Scholar] [CrossRef]
- Wang, L.; Chen, L.; Tsang, D.C.; Li, J.S.; Baek, K.; Hou, D.; Ding, S.; Poon, C.S. Recycling dredged sediment into fill materials, partition blocks, and paving blocks: Technical and economic assessment. J. Clean. Prod. 2018, 199, 69–76. [Google Scholar] [CrossRef]
- McLeod, N.W. Principles and Practice of Mechanical and Waterproofed Mechanical Soil Stabilization. Soil Sci. Soc. Am. J. 1944, 8, 448–451. [Google Scholar] [CrossRef]
- Yongfeng, D.; Songyu, L.; Jian’an, H.; Kan, L.; Yanjun, D.; Fei, J. Strength and Permeability of Cemented Soil with PAM. In Grouting and Deep Mixing 2012; ASCE: Reston, VA, USA, 2012; pp. 1800–1807. [Google Scholar] [CrossRef]
- Rashidi, M.; Ashtiani, R.S. Scale Effects in the Indirect Tensile and Unconfined Compressive Strength Tests of Cement-Stabilized Base Materials. In Proceedings of the Geo-Congress 2019, Philadelphia, PA, USA, 24–27 March 2019; ASCE: Reston, VA, USA, 2019; pp. 628–639. [Google Scholar] [CrossRef]
- Zhang, J.; Yu, X. Study on the Development Characteristics of the Strength of Inorganic Binder Modified Saline Soil. In Proceedings of the ICCTP 2011, Nanjing, China, 14–17 August 2011; ASCE: Reston, VA, USA, 2011; pp. 3701–3705. [Google Scholar] [CrossRef]
- Rios, S.; Cristelo, N.; da Fonseca, A.V.; Ferreira, C. Stiffness Behavior of Soil Stabilized with Alkali-Activated Fly Ash from Small to Large Strains. Int. J. Geomech. 2017, 17, 04016087. [Google Scholar] [CrossRef] [Green Version]
- Zhang, X.; Li, D.; Lang, L. Evaluation of strength development in cemented dredged sediment admixing recycled glass powder. Constr. Build. Mater. 2022, 342, 127996. [Google Scholar] [CrossRef]
- Lindh, P.; Lemenkova, P. Shear bond and compressive strength of clay stabilised with lime/cement jet grouting and deep mixing: A case of Norvik, Nynäshamn. Nonlinear Eng. 2022, 11, 693–710. [Google Scholar] [CrossRef]
- Ye, G.; Shu, H.; Zhang, Z.; Kang, S.; Zhang, S.; Wang, Q. Solidification and field assessment of soft soil stabilized by a waste-based binder using deep mixing method. Bull. Eng. Geol. Environ. 2021, 80, 5061–5074. [Google Scholar] [CrossRef]
- Grubb, D.G.; Chrysochoou, M.; Smith, C.J.; Malasavage, N.E. Stabilized Dredged Material. I: Parametric Study. J. Geotech. Geoenviron. Eng. 2010, 136, 1011–1024. [Google Scholar] [CrossRef]
- Wang, D.; Zentar, R.; Abriak, N.E. Durability and Swelling of Solidified/Stabilized Dredged Marine Soils with Class-F Fly Ash, Cement, and Lime. J. Mater. Civ. Eng. 2018, 30, 04018013. [Google Scholar] [CrossRef]
- Grubb, D.G.; Malasavage, N.E.; Smith, C.J.; Chrysochoou, M. Stabilized Dredged Material. II: Geomechanical Behavior. J. Geotech. Geoenviron. Eng. 2010, 136, 1025–1036. [Google Scholar] [CrossRef]
- Nguyen, T.T.M.; Rabbanifar, S.; Brake, N.A.; Qian, Q.; Kibodeaux, K.; Crochet, H.E.; Oruji, S.; Whitt, R.; Farrow, J.; Belaire, B.; et al. Stabilization of Silty Clayey Dredged Material. J. Mater. Civ. Eng. 2018, 30, 04018199. [Google Scholar] [CrossRef]
- Couvidat, J.; Benzaazoua, M.; Chatain, V.; Bouzahzah, H. Environmental evaluation of dredged sediment submitted to a solidification stabilization process using hydraulic binders. Environ. Sci. Pollut. Res. 2016, 23, 17142–17157. [Google Scholar] [CrossRef]
- Pu, H.; Mastoi, A.K.; Chen, X.; Song, D.; Qiu, J.; Yang, P. An integrated method for the rapid dewatering and solidification/stabilization of dredged contaminated sediment with a high water content. Front. Environ. Sci. Eng. 2021, 15, 67. [Google Scholar] [CrossRef]
- Nordmark, D.; Vestin, J.; Lagerkvist, A.; Lind, B.B.; Arm, M.; Hallgren, P. Geochemical Behavior of a Gravel Road Upgraded with Wood Fly Ash. J. Environ. Eng. 2014, 140, 05014002. [Google Scholar] [CrossRef]
- Min, Y.; Wu, J.; Li, B.; Zhang, J. Effects of Fly Ash Content on the Strength Development of Soft Clay Stabilized by One-Part Geopolymer under Curing Stress. J. Mater. Civ. Eng. 2021, 33, 04021274. [Google Scholar] [CrossRef]
- Taj, T.H.; Rahman, F.; Islam, M.R.; Rahman, M.A.; Hossain, M.I.; Hossain, S.A.; Islam, M.M. Alkali Activated Fly Ash and Slag Combination for Soil Cement Mixing Piles. In Proceedings of the International Conference on Transportation and Development, Seattle, WA, USA, 31 May–3 June 2022; ASCE: Reston, VA, USA, 2022; pp. 133–142. [Google Scholar] [CrossRef]
- Eissa, A.; Bassuoni, M.T.; Ghazy, A.; Alfaro, M. Improving the Properties of Soft Clay Using Cement, Slag, and Nanosilica: Experimental and Statistical Modeling. J. Mater. Civ. Eng. 2022, 34, 04022031. [Google Scholar] [CrossRef]
- Zhu, S.J.; Qin, Y.; Hwang, J.Y. Solidification of Dredged Sludge by Hydraulic ASH-SLAG Cementitious Materials. In Characterization of Minerals, Metals, and Materials 2016; John Wiley & Sons, Ltd.: Hoboken, NJ, USA, 2016; Chapter 31; pp. 255–261. [Google Scholar] [CrossRef]
- Muthukkumaran, K.; Anusudha, V. Study on Behavior of Copper Slag and Lime–Treated Clay under Static and Dynamic Loading. J. Mater. Civ. Eng. 2020, 32, 04020230. [Google Scholar] [CrossRef]
- Heitor, A.; Parkinson, J.; Kotzur, T. The Role of Soil Stabilization in Mitigating the Impact of Climate Change in Transport Infrastructure with Reference to Wetting Processes. Appl. Sci. 2021, 11, 1080. [Google Scholar] [CrossRef]
- Lindh, P.; Lemenkova, P. Simplex Lattice Design and X-ray Diffraction for Analysis of Soil Structure: A Case of Cement-Stabilised Compacted Tills Reinforced with Steel Slag and Slaked Lime. Electronics 2022, 11, 3726. [Google Scholar] [CrossRef]
- Li, J.; Zhou, Y.; Wang, Q.; Xue, Q.; Poon, C.S. Development of a Novel Binder Using Lime and Incinerated Sewage Sludge Ash to Stabilize and Solidify Contaminated Marine Sediments with High Water Content as a Fill Material. J. Mater. Civ. Eng. 2019, 31, 04019245. [Google Scholar] [CrossRef]
- Corrêa-Silva, M.; Rouainia, M.; Miranda, T.; Cristelo, N. Predicting the mechanical behaviour of a sandy clay stabilised with an alkali-activated binder. Eng. Geol. 2021, 292, 106260. [Google Scholar] [CrossRef]
- Bazne, M.O.A.; Howard, I.L.; Vahedifard, F. Stabilized Very High—Moisture Dredged Soil: Relative Behavior of Portland-Limestone Cement and Ordinary Portland Cement. J. Mater. Civ. Eng. 2017, 29, 04017110. [Google Scholar] [CrossRef]
- Li, J.S.; Xue, Q.; Wang, P.; Zhang, T.T.; Zhao, Y. Comparison of solidification/stabilization of lead contaminated soil between magnesia–phosphate cement and ordinary portland cement under the same dosage. Environ. Prog. Sustain. Energy 2016, 35, 88–94. [Google Scholar] [CrossRef]
- Gu, K.; Jin, F.; Al-Tabbaa, A.; Shi, B. Initial Investigation of Soil Stabilization with Calcined Dolomite-GGBS Blends. In Ground Improvement and Geosynthetics; ASCE: Reston, VA, USA, 2014; pp. 148–157. [Google Scholar] [CrossRef]
- Lindh, P.; Lemenkova, P. Permeability, compressive strength and Proctor parameters of silts stabilised by Portland cement and ground granulated blast furnace slag (GGBFS). Arch. Mech. Eng. 2022, 69, 667–692. [Google Scholar] [CrossRef]
- Nagy, A.C.; Cîrcu, A.P.; Ilieş, N.M.; Moldovan, D.V.; Gherman, C.; Péter, A. Soil stabilization with modern hydraulic binders. Variations of geotechnical parameters. ce/papers 2018, 2, 1021–1026. [Google Scholar] [CrossRef]
- Yi, Y.; Liska, M.; Al-Tabbaa, A. Properties of Two Model Soils Stabilized with Different Blends and Contents of GGBS, MgO, Lime, and PC. J. Mater. Civ. Eng. 2014, 26, 267–274. [Google Scholar] [CrossRef]
- Ismail, M.A.; Joer, H.A.; Sim, W.H.; Randolph, M.F. Effect of Cement Type on Shear Behavior of Cemented Calcareous Soil. J. Geotech. Geoenviron. Eng. 2002, 128, 520–529. [Google Scholar] [CrossRef]
- Lam, K.P.; Kou, H.L.; Xie, B.; Chu, J.; He, J. Use of a Waste-Based Binder for High Water Content Soil Treatment. J. Mater. Civ. Eng. 2018, 30, 06018009. [Google Scholar] [CrossRef]
- Jeremiah, J.J.; Abbey, S.J.; Booth, C.A.; Kashyap, A. Geopolymers as Alternative Sustainable Binders for Stabilization of Clays—A Review. Geotechnics 2021, 1, 439–459. [Google Scholar] [CrossRef]
- Moustafa, A.B.; Bazaraa, A.R.; Nour El Din, A.R. Soil stabilization by polymeric materials. Die Angew. Makromol. Chem. 1981, 97, 1–12. [Google Scholar] [CrossRef]
- Liu, J.; Che, W.; Lan, X.; Hu, M.; Qi, M.; Song, Z.; Sun, M.; Jing, M.; Qian, W.; Qi, C. Performance and mechanism of a novel biopolymer binder for clayey soil stabilization: Mechanical properties and microstructure characteristics. Transp. Geotech. 2023, 42, 101044. [Google Scholar] [CrossRef]
- Consoli, N.C.; Marin, E.J.B.; Samaniego, R.A.Q.; Heineck, K.S.; Johann, A.D.R. Use of Sustainable Binders in Soil Stabilization. J. Mater. Civ. Eng. 2019, 31, 06018023. [Google Scholar] [CrossRef]
- Tabassum, T.; Rahman, R.; Bheemasetti, T.V. Thermal-mechanical properties of stabilized clayey sand subgrade soils. Transp. Geotech. 2022, 37, 100880. [Google Scholar] [CrossRef]
- Filho, H.C.S.; Saldanha, R.B.; da Rocha, C.G.; Consoli, N.C. Sustainable Binders Stabilizing Dispersive Clay. J. Mater. Civ. Eng. 2021, 33, 06020026. [Google Scholar] [CrossRef]
- Howard, I.L.; Anderson, B.K. Time-Dependent Properties of Very High Moisture Content Fine Grained Soils Stabilized with Portland and Slag Cement. In Geotechnical Frontiers 2017; ASCE: Reston, VA, USA, 2017; pp. 891–899. [Google Scholar] [CrossRef]
- Igea Romera, J.; Martínez-Ramírez, S.; Lapuente, P.; Blanco-Varela, M.T. Assessment of the physico-mechanical behaviour of gypsum-lime repair mortars as a function of curing time. Environ. Earth Sci. 2013, 70, 1605–1618. [Google Scholar] [CrossRef] [Green Version]
- Chrysochoou, M.; Grubb, D.G.; Drengler, K.L.; Malasavage, N.E. Stabilized Dredged Material. III: Mineralogical Perspective. J. Geotech. Geoenviron. Eng. 2010, 136, 1037–1050. [Google Scholar] [CrossRef]
- Shrestha, R.; Al-Tabbaa, A. Development of Predictive Models for Cement Stabilized Soils. In Grouting and Deep Mixing 2012; ASCE: Reston, VA, USA, 2012; pp. 221–230. [Google Scholar] [CrossRef]
- Oliveira, P.J.V.; Correia, A.A.S.; Lopes, T.J.S. Effect of Organic Matter Content and Binder Quantity on the Uniaxial Creep Behavior of an Artificially Stabilized Soil. J. Geotech. Geoenviron. Eng. 2014, 140, 04014053. [Google Scholar] [CrossRef]
- Oliveira, P.J.V.; Correia, A.A.S.; Garcia, M.R. Effect of Stress Level and Binder Composition on Secondary Compression of an Artificially Stabilized Soil. J. Geotech. Geoenviron. Eng. 2013, 139, 810–820. [Google Scholar] [CrossRef]
- Khajeh, A.; Jamshidi Chenari, R.; Payan, M. A Simple Review of Cemented Non-conventional Materials: Soil Composites. Geotech. Geol. Eng. 2020, 38, 1019–1040. [Google Scholar] [CrossRef]
- Huang, X.; Shi, Z.; Wang, Z.; Dong, J.; Wang, X.; Zhao, X. Microstructure and performances of sludge soil stabilized by fluorogypsum-based cementitious binder. Constr. Build. Mater. 2022, 325, 126702. [Google Scholar] [CrossRef]
- Hallal, M.M.; Sadek, S.; Najjar, S.S. Evaluation of Engineering Characteristics of Stabilized Rammed-Earth Material Sourced from Natural Fines-Rich Soil. J. Mater. Civ. Eng. 2018, 30, 04018273. [Google Scholar] [CrossRef]
- Guo, W.; Qiu, J.; Chen, Q.; Wang, X.; Yang, T. Low-Temperature Calcination of Belite-Calcium Sulphoaluminate Cement Clinker and the Hydration Process. J. Mater. Civ. Eng. 2021, 33, 04021350. [Google Scholar] [CrossRef]
- Chi, L.; Wang, Z.; Lu, S.; Wang, H.; Liu, K.; Liu, W. Early assessment of hydration and microstructure evolution of belite-calcium sulfoaluminate cement pastes by electrical impedance spectroscopy. Electrochim. Acta 2021, 389, 138699. [Google Scholar] [CrossRef]
- Lindh, P.; Lemenkova, P. Optimized Workflow Framework in Construction Projects to Control the Environmental Properties of Soil. Algorithms 2023, 16, 303. [Google Scholar] [CrossRef]
- Yesiller, N.; Hanson, J.L.; Usmen, M.A. Ultrasonic Assessment of Stabilized Soils. In Soft Ground Technology; ASCE: Reston, VA, USA, 2012; pp. 170–181. [Google Scholar] [CrossRef] [Green Version]
- Zhang, J.; Shen, Y.; Yang, G.; Zhang, H.; Wang, Y.; Hou, X.; Sun, Q.; Li, G. Inconsistency of changes in uniaxial compressive strength and P-wave velocity of sandstone after temperature treatments. J. Rock Mech. Geotech. Eng. 2021, 13, 143–153. [Google Scholar] [CrossRef]
- Lindh, P.; Lemenkova, P. Seismic monitoring of strength in stabilized foundations by P-wave reflection and downhole geophysical logging for drill borehole core. J. Mech. Behav. Mater. 2023, 32, 20220290. [Google Scholar] [CrossRef]
- Abdi, Y.; Khanlari, G.R.; Jamshidi, A. Correlation Between Mechanical Properties of Sandstones and P-Wave Velocity in Different Degrees of Saturation. Geotech. Geol. Eng. 2018, 36, 1–10. [Google Scholar] [CrossRef]
- Lopes, S.; Lebedev, M. Research note: Laboratory study of the influence of changing the injection rate on the geometry of the fluid front and on P-wave ultrasonic velocities in sandstone. Geophys. Prospect. 2012, 60, 572–580. [Google Scholar] [CrossRef]
- Lindh, P.; Lemenkova, P. Seismic velocity of P-waves to evaluate strength of stabilized soil for Svenska Cellulosa Aktiebolaget Biorefinery Östrand AB, Timrå. Bull. Pol. Acad. Sci. Tech. Sci. 2022, 70, e141593. [Google Scholar] [CrossRef]
- Cristelo, N.; Cunha, V.M.; Dias, M.; Gomes, A.T.; Miranda, T.; Araújo, N. Influence of discrete fibre reinforcement on the uniaxial compression response and seismic wave velocity of a cement-stabilised sandy-clay. Geotext. Geomembr. 2015, 43, 1–13. [Google Scholar] [CrossRef] [Green Version]
- Wang, L.; Nagarajaiah, S.; Shi, W.; Zhou, Y. Seismic performance improvement of base-isolated structures using a semi-active tuned mass damper. Eng. Struct. 2022, 271, 114963. [Google Scholar] [CrossRef]
- Wang, L.; Shi, W.; Zhou, Y. Adaptive-passive tuned mass damper for structural aseismic protection including soil-structure interaction. Soil Dyn. Earthq. Eng. 2022, 158, 107298. [Google Scholar] [CrossRef]
- Ardah, A.; Abu-Farsakh, M.; Chen, Q. Evaluating the Performance of Cementitious Treated/Stabilized Very Weak and Wet Subgrade Soils for Sustainable Pavement. In Proceedings of the Geo-Chicago, Chicago, IL, USA, 14–18 August 2016; ASCE: Reston, VA, USA, 2016; pp. 567–576. [Google Scholar] [CrossRef]
- Sree Lakshmi Devi, G.; Venkata Siva Rama Prasad, C.; Srinivasa Rao, P. Compressive Strength of Quaternary Blended Self-Compacting Concrete Made with Supplementary Cementitious Materials through Regression Analysis. In Recent Advances in Civil Engineering; Kumar, P.G., Subramaniam, K.V.L., Santhakumar, S.M., Satyam, D.N., Eds.; Springer: Singapore, 2022; pp. 317–329. [Google Scholar]
- Corrêa-Silva, M.; Cristelo, N.; Rouainia, M.; Araújo, N.; Miranda, T. Constitutive Behaviour of a Clay Stabilised with Alkali-Activated Cement Based on Blast Furnace Slag. Sustainability 2022, 14, 13736. [Google Scholar] [CrossRef]
- Yu, J.D.; Kim, N.Y.; Lee, J.S. Nondestructive Integrity Evaluation of Soil Nails Using Longitudinal Waves. J. Geotech. Geoenviron. Eng. 2018, 144, 04018080. [Google Scholar] [CrossRef]
- Zeffer, A. Sedimentprovtagning i Småbåtshamnar i Stenungsund [Sediment Sampling in Marinas in Stenungsund]; Stenungsunds Kommun: Stenungsund, Sweden, 2011; 62p, Available online: https://www.stenungsund.se/download/18.bfcc70136be7fac7b8000131/Sedimentprovtagning+i+Stenungsund+111219.pdf (accessed on 21 June 2023). (In Swedish)
- Carling, M.; Ländell, M.; Håkansson, K.; Myrhede, E. Täckning av Deponier med Aska och Slam—Erfarenheter från Tre Fältförsök [Covering Landfills with Ash and Sludge—Experiences from Three Field Trials]; VA-Forsk Svenskt Vatten AB: Stockholm, Sweden, 2006; 122p. (In Swedish) [Google Scholar]
- SGI. Stabilisering och Solidifiering av Förorenade Muddermassor. Stabcon; Technical Report 1-1009-0647; Stabilization and Solidification of Contaminated Dredge Masses. SGI Information 20; Swedish Geotechnical Institute (SGI): Linköping, Sweden, 2011. [Google Scholar]
- SS-EN 197-1:2011; Cement—Part 1: Composition, Specifications and Conformity Criteria for Common Cements. Swedish Institute for Standards (SIS): Stockholm, Sweden, 2011. Available online: https://www.sis.se/en/produkter/construction-materials-and-building/construction-materials/cement-gypsum-lime-mortar/ssen197120112/ (accessed on 14 June 2023).
- SS-EN 15167-1:2006; Ground Granulated Blast Furnace Slag for Use in Concrete, Mortar and Grout—Part 1: Definitions, Specifications and Conformity Criteria. Swedish Institute for Standards (SIS): Stockholm, Sweden, 2006. Available online: https://www.sis.se/en/produkter/standardization/vocabularies/construction-materials-and-building-vocabularies/ssen1516712006/ (accessed on 17 June 2023).
- de Oliveira, D.G.; Thewes, M.; Diederichs, M.S. Clogging and flow assessment of cohesive soils for EPB tunnelling: Proposed laboratory tests for soil characterization. Tunn. Undergr. Space Technol. 2019, 94, 103110. [Google Scholar] [CrossRef]
- Ramírez, A.L.; Korkiala-Tanttu, L. Stabilization of Malmi soft clay with traditional and low-CO2 binders. Transp. Geotech. 2023, 38, 100920. [Google Scholar] [CrossRef]
- Asi, I.M. Stabilization of Sebkha Soil Using Foamed Asphalt. J. Mater. Civ. Eng. 2001, 13, 325–331. [Google Scholar] [CrossRef]
- Lindh, P.; Lemenkova, P. Resonant Frequency Ultrasonic P-Waves for Evaluating Uniaxial Compressive Strength of the Stabilized Slag–Cement Sediments. Nord. Concr. Res. 2021, 65, 39–62. [Google Scholar] [CrossRef]
- Dutta, T.; Otsubo, M.; Kuwano, R.; Sato, T. Estimating multidirectional stiffness of soils using planar piezoelectric transducers in a large triaxial apparatus. Soils Found. 2020, 60, 1269–1286. [Google Scholar] [CrossRef]
- Astuto, G.; Molina-Gómez, F.; Bilotta, E.; da Fonseca, A.V.; Flora, A. Some remarks on the assessment of P-wave velocity in laboratory tests for evaluating the degree of saturation. Acta Geotech. 2023, 18, 777–790. [Google Scholar] [CrossRef]
- Brignoli, E.G.; Gotti, M.; Stokoe, K.H. Measurement of shear waves in laboratory specimens by means of piezoelectric transducers. Geotech. Test. J. 1996, 19, 384–397. [Google Scholar] [CrossRef]
- Suwal, L.P.; Kuwano, R. Disk shaped piezo-ceramic transducer for P and S wave measurement in a laboratory soil specimen. Soils Found. 2013, 53, 510–524. [Google Scholar] [CrossRef] [Green Version]
- Irfan, M.; Uchimura, T. Measuring Shear and Compression Wave Velocities in Laboratory Triaxial Tests Using Disk Shaped Composite P/S Piezoelectric Transducer. In Proceedings of the IACGE 2013, Chengdu, China, 25–27 October 2013; IACGE: Irvine, CA, USA, 2013; pp. 414–421. [Google Scholar] [CrossRef]
- Shabani, A.; Kioumarsi, M. Seismic assessment and strengthening of a historical masonry bridge considering soil-structure interaction. Eng. Struct. 2023, 293, 116589. [Google Scholar] [CrossRef]
- Tamura, S.; Tokimatsu, K.; Abe, A.; Sato, M. Effects of Air Bubbles on B-Value and P-Wave Velocity of a Partly Saturated Sand. Soils Found. 2002, 42, 121–129. [Google Scholar] [CrossRef] [Green Version]
- Drnevich, V.P.; Hardin, B.O.; Shippy, D.J. Modulus and damping of soils by the resonant-column method. Dyn. Geotech. Test. ASTM STP 1978, 654, 91–125. [Google Scholar] [CrossRef]
- Li, G.; Xue, Y.; Wang, R.; Zhang, H.; Dong, Z.; Yu, D. Multiphase wavefield inversion methodology for seismic analysis of soil-structure interaction systems. Soil Dyn. Earthq. Eng. 2023, 173, 108081. [Google Scholar] [CrossRef]
- Umut Umu, S. Assessment of sustainable expanded glass granules for enhancing shallow soil stabilization and dynamic behaviour of clay through resonant column tests. Eng. Sci. Technol. Int. J. 2023, 42, 101415. [Google Scholar] [CrossRef]
- Liu, Z.; Ning, F.; Hu, G.; Liu, L.; Liu, C.; Peng, L.; Wang, D.; Hu, W.; Zhang, Z. Characterization of seismic wave velocity and attenuation and interpretation of tetrahydrofuran hydrate-bearing sand using resonant column testing. Mar. Pet. Geol. 2020, 122, 104620. [Google Scholar] [CrossRef]
- Kanellopoulos, C.; Psycharis, N.; Yang, H.; Jeremić, B.; Anastasopoulos, I.; Stojadinović, B. Seismic resonant metamaterials for the protection of an elastic-plastic SDOF system against vertically propagating seismic shear waves (SH) in nonlinear soil. Soil Dyn. Earthq. Eng. 2022, 162, 107366. [Google Scholar] [CrossRef]
- Lindh, P.; Lemenkova, P. Dynamics of Strength Gain in Sandy Soil Stabilised with Mixed Binders Evaluated by Elastic P-Waves during Compressive Loading. Materials 2022, 15, 7798. [Google Scholar] [CrossRef]
- SS-EN 16907-4:2018; Earthworks—Part 4: Soil Treatment with Lime and/or Hydraulic Binders. Swedish Institute for Standards (SIS): Stockholm, Sweden, 2018.
- SS-EN 12457-2; Characterization of Waste—Leaching—Compliance Test for Leaching of Granular Waste Materials and Sludges—Part 2: One Stage Batch Test at a Liquid to Solid Ratio of 10 L/kg for Materials with Particle Size below 4 mm (without or with Size Reduction). Swedish Institute for Standards (SIS): Stockholm, Sweden, 2003. Available online: https://www.sis.se/en/produkter/environment-health-protection-safety/wastes/solid-wastes/ssen124572/ (accessed on 10 June 2023).
- Bumanis, G.; Zorica, J.; Bajare, D.; Korjakins, A. Effect of water–binder ratio on properties of phosphogypsum binder. In Proceedings of the 4th International Conference on Innovative Materials, Structures and Technologies (IMST 2019), Riga, Latvia, 25–27 September 2019; Volume 660, p. 012071. [Google Scholar] [CrossRef]
- Han, Y.; Qin, Y.; Wang, Y.; Zhang, X. The effect of different ages and water–binder ratios on the mechanical properties of circulating fluidized bed combustion desulfurization slag cement-soil. Case Stud. Constr. Mater. 2022, 17, e01660. [Google Scholar] [CrossRef]
- Hay, R.; Celik, K. Effects of water-to-binder ratios (w/b) and superplasticizer on physicochemical, microstructural, and mechanical evolution of limestone calcined clay cement (LC3). Constr. Build. Mater. 2023, 391, 131529. [Google Scholar] [CrossRef]
- Abudeif, A.M.; Abdel Aal, G.Z.; Abdelbaky, N.F.; Abdel Gowad, A.M.; Mohammed, M.A. Evaluation of Engineering Site and Subsurface Structures Using Seismic Refraction Tomography: A Case Study of Abydos Site, Sohag Governorate, Egypt. Appl. Sci. 2023, 13, 2745. [Google Scholar] [CrossRef]
- Harrypersad-Daniel, A.; Blake, O.; Ramsook, R. Determining the static Young’s modulus and Poisson’s ratio, and compressive strength of the friable Erin Formation rocks using P-wave velocity. J. Appl. Geophys. 2022, 198, 104557. [Google Scholar] [CrossRef]
- Venkatarama Reddy, B.V. Stabilised Compressed Earth Block Masonry. In Compressed Earth Block & Rammed Earth Structures; Springer Nature: Singapore, 2022; pp. 229–265. [Google Scholar] [CrossRef]
- Maher, A.; Schaefer, V.; Yang, D. In-Situ Deep Soil Mixing for Solidification of Soft Estuarine Sediments Shear Strength. In Proceedings of the GeoCongress 2008, New Orleans, LA, USA, 9–12 March 2008; ASCE: Reston, VA, USA, 2008; pp. 668–675. [Google Scholar] [CrossRef]
- Maher, M.H.; Ho, Y.C. Mechanical Properties of Kaolinite/Fiber Soil Composite. J. Geotech. Eng. 1994, 120, 1381–1393. [Google Scholar] [CrossRef]
Figure 1.
Map of the Nordic region showing locations of sampling test points for the stabilization/ solidification projects in Nordic countries: Norway, Sweden and Finland. Map source: Per Lindh.
Figure 1.
Map of the Nordic region showing locations of sampling test points for the stabilization/ solidification projects in Nordic countries: Norway, Sweden and Finland. Map source: Per Lindh.

Figure 2.
Water content in each sample point.

Figure 4.
Grain distribution in the different samples. Samples 1_2, 3 and 4 contain more clay compared to samples 5, 6 and 8. Sample 8 contains the least fine soil.
Figure 4.
Grain distribution in the different samples. Samples 1_2, 3 and 4 contain more clay compared to samples 5, 6 and 8. Sample 8 contains the least fine soil.

Figure 5.
Grain distribution for sediments collected in Oslo (Norway) and Gothenburg (Sweden).

Figure 8.
Variation of compressive strength with different proportions between cement and slag. Black dots signify measurements of UCS for soil samples stabilised with different proportions of slag/cement.
Figure 8.
Variation of compressive strength with different proportions between cement and slag. Black dots signify measurements of UCS for soil samples stabilised with different proportions of slag/cement.

Figure 9.
Development of P-wave velocity with curing time for sediment samples stabilized with various water/binder (w/b) ratios. Different colour lines show trends in P-wave velocity for stabilised soil samples collected from various test sites.
Figure 9.
Development of P-wave velocity with curing time for sediment samples stabilized with various water/binder (w/b) ratios. Different colour lines show trends in P-wave velocity for stabilised soil samples collected from various test sites.


Table 1.
Status of the compiled solidification/stabilization (s/s) soil and sediments projects in key locations of Nordic countries, based on STABCON and other sources (as for 2023).
Table 1.
Status of the compiled solidification/stabilization (s/s) soil and sediments projects in key locations of Nordic countries, based on STABCON and other sources (as for 2023).
| Location | Completed | Ongoing | Permission | Investigation |
|---|---|---|---|---|
| Norway | ||||
| Bærum | X | – | – | – |
| Gilhus | – | – | – | X |
| Grenland | – | – | – | X |
| Bergen | – | – | – | X |
| Trondheims hamn | X | – | – | – |
| Hammerfest | X | – | – | – |
| Sweden | ||||
| Hammarby sjöstad | X | – | – | – |
| Västra Kungsholmen | X | – | – | – |
| Oxelösunds hamn | – | – | X | – |
| Västervik/Örserum | X | – | – | – |
| Oskarshamn | – | – | – | X |
| Falkenbergs hamn | – | – | – | X |
| Göteborgs hamn | X | – | – | – |
| Gävle hamn | X | – | – | – |
| Örnsköldsviks hamn | – | – | – | X |
| Valdemarsvik | – | – | X | – |
| Köping | – | X | – | – |
| Västerås | – | X | – | – |
| Helsingborg | X | – | – | – |
| Malmö | X | – | – | – |
| Norra Djurgårdsstaden | – | – | – | X |
| Luleå hamn | – | – | – | X |
| Sundsvall, Östrand | – | – | – | X |
| Finland | ||||
| Sörnäs strand | X | – | – | – |
| Hamina hamn | X | – | – | – |
| Fredrikshamn | X | – | – | – |
| Mariehamn | X | – | – | – |
| Åbo hamn | X | – | – | – |
| Kokkola hamn | – | – | X | – |
X means ‘yes’; en dash means ‘no’.
Table 2.
Calculation of binder admixture, performed in the SGI laboratory.
| ID | w | w/b | |||||||
|---|---|---|---|---|---|---|---|---|---|
| 1_2 | 72.6 | 1.54 | 2.5 | 1.448 | 1.052 | 5 | 0.210 | 0.063 | 0.147 |
| 1_2 | 72.6 | 1.54 | 2.5 | 1.448 | 1.052 | 6 | 0.175 | 0.053 | 0.123 |
| 1_2 | 72.6 | 1.54 | 2.5 | 1.448 | 1.052 | 7 | 0.150 | 0.045 | 0.105 |
| 3 | 74.74 | 1.57 | 2.5 | 1.431 | 1.069 | 5 | 0.214 | 0.064 | 0.150 |
| 3 | 74.74 | 1.57 | 2.5 | 1.431 | 1.069 | 6 | 0.178 | 0.053 | 0.125 |
| 3 | 74.74 | 1.57 | 2.5 | 1.431 | 1.069 | 7 | 0.153 | 0.046 | 0.107 |
| 4 | 104 | 1.42 | 1.0 | 0.490 | 0.510 | 5 | 0.102 | 0.031 | 0.071 |
| 4 | 104 | 1.42 | 1.0 | 0.490 | 0.510 | 6 | 0.085 | 0.025 | 0.059 |
| 6 | 50 | 1.72 | 2.5 | 1.667 | 0.833 | 5 | 0.167 | 0.050 | 0.117 |
| 6 | 50 | 1.72 | 2.5 | 1.667 | 0.833 | 6 | 0.139 | 0.042 | 0.097 |
| 8 | 54 | 1.68 | 2.5 | 1.623 | 0.877 | 5 | 0.175 | 0.053 | 0.123 |
| 8 | 54 | 1.68 | 2.5 | 1.623 | 0.877 | 6 | 0.146 | 0.044 | 0.102 |
ID—sample number; w—water ratio, %; —density of soil (), ; , kg; = ; = (kg); w/b is defined as a ratio of water/binder indicating the amount of binder; is a = ; ; ; The computed values are given for kg of dredged soil material.
Table 3.
Compressive strength (kPa) measured by UCS tests with relation to the water/binder ratio (w/b) for specimens collected in sample test sites (TS) No. 1–4.
Table 3.
Compressive strength (kPa) measured by UCS tests with relation to the water/binder ratio (w/b) for specimens collected in sample test sites (TS) No. 1–4.
| TS 1_2 | w/b | UCS | TS 3 | w/b | UCS | TS 4 | w/b | UCS |
|---|---|---|---|---|---|---|---|---|
| 1_1 | 5 | 829 | 3_1 | 5 | 700 | 4_2 | 5 | 740 |
| 1_2 | 5 | 833 | 3_2 | 5 | 822 | 4_3 | 5 | 796 |
| 1_3 | 5 | 853 | 3_3 | 5 | 829 | 4_4 | 5 | 1237 |
| 1_4 | 5 | 859 | 3_6 | 6 | 298 | 4_6 | 6 | 373 |
| 1_6 | 6 | 529 | 3_7 | 6 | 304 | 4_7 | 6 | 439 |
| 1_7 | 6 | 569 | 3_8 | 6 | 318 | 4_8 | 6 | 512 |
| 1_8 | 6 | 597 | 3_9 | 6 | 295 | - | - | - |
| 1_11 | 7 | 297 | 3_11 | 7 | 162 | - | - | - |
| 1_12 | 7 | 272 | 3_12 | 7 | 148 | - | - | - |
| 1_13 | 7 | 298 | 3_13 | 7 | 133 | - | - | - |
| - | - | - | 3_14 | 7 | 150 | - | - | - |
Table 4.
Compressive strength (kPa) measured by UCS tests with regard to water/binder ratio (w/b) for samples collected in test sites (TS) No. 5, 6 and 8, and P-wave velocity (m/s) for TS 5.
Table 4.
Compressive strength (kPa) measured by UCS tests with regard to water/binder ratio (w/b) for samples collected in test sites (TS) No. 5, 6 and 8, and P-wave velocity (m/s) for TS 5.
| TS 5 | w/b | P-wave | UCS | TS 6 | w/b | UCS | TS 8 | w/b | UCS |
|---|---|---|---|---|---|---|---|---|---|
| 5_1 | 5 | 1161 | 539 | 6_1 | 5 | 993 | 8_1 | 5 | 1222 |
| 5_2 | 5 | 1160 | 538 | 6_2 | 5 | 985 | 8_2 | 5 | 1081 |
| 5_3 | 5 | 1154 | 532 | 6_3 | 5 | 987 | 8_3 | 5 | 991 |
| 5_6 | 6 | 871 | 303 | 6_6 | 6 | 688 | 8_6 | 6 | 584 |
| 5_7 | 6 | 873 | 304 | 6_7 | 6 | 697 | 8_7 | 6 | 453 |
| 5_8 | 6 | 873 | 304 | 6_8 | 6 | 618 | 8_8 | 6 | 633 |
Table 5.
Concentration of heavy metals and TBT (mg/kg) for test site Batch 1 sample B according to the leaching tests (Lab number U11853239).
Table 5.
Concentration of heavy metals and TBT (mg/kg) for test site Batch 1 sample B according to the leaching tests (Lab number U11853239).
| Sum PAH-16 | As | Pb | Cd | Cr | Hg | Ni | Zn | Cu | Mn | Sb | Se |
|---|---|---|---|---|---|---|---|---|---|---|---|
| 0.0383 | 0.0298 | 0.00552 | <0.0005 | 0.0379 | <0.0002 | 0.814 | <0.02 | 6.90 | 0.00430 | 0.00831 | <0.03 |
| Sum PCB-7 | Ca | Fe | K | Mg | Na | Al | B | Ba | Co | V | TBT |
| 0.000232 | 1590 | 0.129 | 792 | <0.9 | 4260 | 31.7 | 0.385 | 1.06 | 0.0894 | 0.261 | 0.0540 |
Table 6.
Analysis of the concentration of PCBs (mg/kg) in Batch 1, sample 2 (B1s2).
| TS | PCB 28 | PCB 52 | PCB 101 | PCB 118 | PCB 138 | PCB 153 | PCB 180 | Sum PCB-7 |
|---|---|---|---|---|---|---|---|---|
| B1s2 | <0.00007 | <0.00004 | 0.0000526 | 0.0000273 | 0.0000734 | 0.0000528 | 0.0000257 | 0.000232 |
Disclaimer/Publisher’s Note: The statements, opinions and data contained in all publications are solely those of the individual author(s) and contributor(s) and not of MDPI and/or the editor(s). MDPI and/or the editor(s) disclaim responsibility for any injury to people or property resulting from any ideas, methods, instructions or products referred to in the content. |
© 2023 by the authors. Licensee MDPI, Basel, Switzerland. This article is an open access article distributed under the terms and conditions of the Creative Commons Attribution (CC BY) license (https://creativecommons.org/licenses/by/4.0/).
Share and Cite
MDPI and ACS Style
Lindh, P.; Lemenkova, P. Effects of Water—Binder Ratio on Strength and Seismic Behavior of Stabilized Soil from Kongshavn, Port of Oslo. Sustainability 2023, 15, 12016. https://doi.org/10.3390/su151512016
AMA Style
Lindh P, Lemenkova P. Effects of Water—Binder Ratio on Strength and Seismic Behavior of Stabilized Soil from Kongshavn, Port of Oslo. Sustainability. 2023; 15(15):12016. https://doi.org/10.3390/su151512016
Chicago/Turabian StyleLindh, Per, and Polina Lemenkova. 2023. "Effects of Water—Binder Ratio on Strength and Seismic Behavior of Stabilized Soil from Kongshavn, Port of Oslo" Sustainability 15, no. 15: 12016. https://doi.org/10.3390/su151512016
Note that from the first issue of 2016, this journal uses article numbers instead of page numbers. See further details here.