


Effects of Climate-Change-Related Phenomena on Coastal Ecosystems in the Mexican Caribbean


1
Instituto de Ingeniería, Universidad Nacional Autónoma de México, Mexico City 04510, Mexico
2
Unidad Académica de Sistemas Arrecifales-Puerto Morelos, Instituto de Ciencias del Mar y Limnología, Universidad Nacional Autónoma de México, Puerto Morelos 77580, Mexico
*
Authors to whom correspondence should be addressed.
Sustainability 2023, 15(15), 12042; https://doi.org/10.3390/su151512042
Submission received: 27 June 2023
/
Revised: 21 July 2023
/
Accepted: 2 August 2023
/
Published: 6 August 2023
(This article belongs to the Special Issue Coastal Hazards Vulnerability, Disaster Management, and Climate Change Impacts: Adaptation and Mitigation Strategies)
Abstract
:The intensity of climate change impacts on coastal ecosystems is determined by a combination of global, regional, and local drivers. However, many studies on the impact of climate change on ecosystems only consider trends associated with global changes. To assess the global, regional, and local trends, this research analyzes different climates in the coastal zone of the Mexican Caribbean. These drivers include sea level rise in synergy with tectonic activity, sea surface temperature, atmospheric pressure, precipitation, waves and winds. Marine climate variability from 1980 to 2020 was assessed from historical records by local/governmental agencies and the European Centre for Medium-Range Weather Forecasting. An up-to-date diagnosis of local changes of the coastal ecosystems was made, the magnitudes of change differ from the global means, which must be considered when identifying local climate change impacts. Coastal ecosystems, such as mangroves, coastal dunes, sandy beaches and seagrass meadows, showed no changes consistent with geophysical drivers associated with climate change. The exception was coral reefs, where increasing SST is related to coral bleaching. Regional and local anthropic drivers or disturbances other than those related to climate change, including eutrophication, massive influxes of the brown algae Sargasso and changes in land use, induced degradation of the coastal ecosystems. Communities often do not have the capacity to cope with global climate change, but the main impacts on coastal ecosystems in the coastal zone studied were induced by regional and local drivers/disturbances that can be better managed using monitoring programmes and specific management strategies. Climate change induces pressures on coastal ecosystems that affect their functioning, physiology and species distribution; therefore, this study highlights the need to understand how climate-change-related phenomena will affect ecosystems and which geophysical drivers may have priority effects. It also highlights the importance of developing robust regional/local databases to enable stakeholders to diagnose the state of coastal ecosystems and to monitor the effectiveness of actions to prevent or reverse undesirable changes.
1. Introduction
Coastal zones are amongst the most dynamic environments on Earth and the only place where there is interaction between the terrestrial environment, the atmosphere, the sea, and freshwater [1]. Ocean currents, tides, waves, weathering, wind, river flows, and sea-level fluctuations constantly transform these areas [2], meaning they contain very dynamic ecosystems [3]. Coastal ecosystem services include global climate change mitigation using carbon capture and storage [4], coastal protection, erosion control, water quality maintenance [5], and contribute to the resilience of the coastal zone (i.e., the ability of the coast to recover from disturbances) [6].
Natural cycles and their fluctuations have caused the Earth’s climate to change several times in recent geological times over the last ~800,000 years [7]. However, since the nineteenth century, human activity has altered these natural cycles through the amount of greenhouse gasses emitted into the Earths’ atmosphere [8]. Burkett et al. [3] defined climate change as “any change in climate over time whether due to natural variability or as a result of human activity”. Climate change includes long term average weather conditions induced by global, regional and local drivers, inducing changes in the coastal zone and its ecosystems. Following Silva et al. [9], we define a driver as any natural or artificial process determining the magnitude and direction of ecosystem change.
Climate change projections often lack examination of local consequential trends, such as local rises in sea surface temperature or sea level. For example, Stocker et al. [10], forecasted a global sea level rise of up to 1 m by 2100 in response to global warming, and several authors consequently mentioned an expected sea level rise of ≥1 m for the Mexican Caribbean by 2100 [11,12,13]. However, Boretti [14], who compared local global sea level gauge data, predicted a rise of only 201–223 mm by 2100 for this region without considering global means.
This study analyses the long-term trends seen in the main climate change drivers in the coastal zone of Puerto Morelos, in the Mexican Caribbean, an area that has been relatively well-studied. The main coastal ecosystems in this area are mangroves, dunes, beaches, seagrass meadows, and coral reefs, which have undergone changes in recent decades induced by different disturbances [15]. A disturbance herein is “any event that is relatively discrete” in time and space “that disrupts the structure of an ecosystem, community, or population, and changes resource availability or the physical environment” [16]. Thus, a disturbance can be caused by drivers associated with climate change, natural processes, or local anthropic impacts. Our primary hypothesis is that the magnitude, persistence, or direction of climate drivers at the regional-local scale differ from the global mean values [17]. In other words, climate change is far from uniform throughout the globe. Furthermore, we hypothesize that if only climate change drivers were responsible for disturbances in the coastal ecosystems, we would expect these to be reflected in changes in the disturbance regimes of the coastal ecosystems around Puerto Morelos.
The global geophysical and regional-local drivers considered in this study were atmospheric pressure, sea level anomalies, sea surface temperature, wind, waves, storms, and precipitation. These features have the most relevance to climate change [18], so possible changes in long-term trends should be traceable through changes in the states of the local coastal ecosystems.
2. Study Area
Puerto Morelos used to be a fishing village on the Mexican Caribbean (20°50′53.6964″ N, 86°52′33.9816″ W) (Figure 1) [19]. Over recent decades, tourism has increased, resulting in larger and denser urbanization, bringing land and marine pollution and modifications to the coastline [20].
Apart from the village, one of the main tourist attractions of Puerto Morelos is the Reef National Park of Puerto Morelos (Parque Nacional Arrecifal de Puerto Morelos, PNAPM in Spanish). The fringing reef in PNAPM is part of the Mesoamerican Barrier Reef System (20°53.11′ N, −86°50.28″ W). The Park covers 9067 ha, 9029 ha of which are marine, and 38 ha are terrestrial. It is 21 km long and extends approximately 3 km from the coast [22]. Coastal ecosystems in PNAPM are mangroves, dunes, beaches, seagrass meadows, and coral reefs. The PNAPM was created in 1998 at the request of the local community, and a management program for the PNAPM was published in the early 2000s [23].
3. Data and Methods
We analyzed data going back 40 years (or the most extensive database available) of the global, regional, and local geophysical drivers.
3.1. Data Sources
Global geophysical data were obtained from the European Centre for Medium-Range Weather Forecasting (ECMWF), hereafter referred to as ERA5 [24]. ERA5 is a state-of-the-art global atmospheric reanalysis that provides comprehensive and high-quality weather and climate information such as sea level anomalies (SLA), sea surface temperature (SST), atmospheric pressure, wind, and waves. Reanalysis combines observations and models to produce historical records of weather and climate variables. It covers a period from 1979 to near-real time, with hourly temporal resolution and a spatial resolution of ~31 km [24]. Daily values of SLA, defined as sea surface height above the mean sea surface level at a given time and region, are available in this database. For the period 1993 to 2020, this work analyzed the area shown in Figure 1. The sea surface temperature (SST) data were obtained from two sources: ERA5 (1980–2020) and the Academic Service of Meteorological and Oceanographic Monitoring-UNAM (SAMMO) for 2002–2020. SAMMO is a service of the Institute of Marine Sciences and Limnology of UNAM. SAMMO carries out meteorological and oceanographic measurements in situ, using appropriate instruments that are continuously verified and/or calibrated [25]. Atmospheric pressure (AP), wind, and wave data for the Mexican Caribbean were retrieved from ERA5 from 1980 to 2020 and from 1979 to 2019, respectively. Precipitation (PP) data from 1992 to 2021 was provided by SAMMO [25], with data corresponding to the monthly accumulated rainfall (Table 1).
The information on tropical storms and hurricanes in the area was obtained from the NOAA Historical Hurricane Tracks [26] (see Table A1). Scientific journals were consulted to obtain recent information on tectonic uplift, and this was incorporated in the analyses of Sea Level Rise (SLR) and the current state of the ecosystems. The search was carried out using the Web of Science and Google Scholar databases and organized and cited by the Mendeley Reference Manager. Maps for mangroves, seagrass meadows, and coral reefs were obtained from the CONABIO Geoinformation website 2022 [27].
3.2. Data Analysis
Monthly and annual boxplots, with their corresponding trendlines, allow the study of annual and interannual behavior in SLA, SST, AP, and waves. SST was the only driver for which data were obtained from two sources, and Pearson’s coefficient analysis was performed to compare the regional records (ERA 5) against the local records (SAMMO). Wind and wave direction data were quadrant filtered, yielding east (45–135°), south (90–180°), and north (0–180°) plotted in separate wind and wave roses.
For the purpose of this research, inter-annual oscillations provide adequate information; therefore, we only present monthly boxplots for precipitation, and for all other variables, the statistical mode was obtained for the summer (21 June until 21 September) and winter (21 December until 21 March).
Only wind data between 17.5 m/s and 69.4 m/s (63 km/h to 250 km/h), corresponding to storms or hurricanes (see Appendix A), were included in the analysis. Given that no long-term local information on the speed and direction of winds and waves is available, we referred to [28] for winds and [29,30] for waves, which report that the reanalysis data from ERA5 performs well statistically. All the calculations and plots were made with the statistical package R, and all the geographical information was processed in Surfer.
4. Results
4.1. General Characterization of Climate Variables
The average values of the studied variables and their variability are shown in Table 2.
4.2. Climate Change
4.2.1. Sea Level Anomalies (SLA)
The annual mean SLA shows an increase of approximately 67 mm over 27 years, with very high annual variability (Figure 2a). Monthly median levels were minimal in March and maximal in October (Figure 2b). The mean SLA anomaly was slightly higher in winters than in summers; although the interannual variability was great, an increasing trend could be discerned, especially in the summer (Figure 2c).
4.2.2. Sea Surface Temperature (SST)
The annual mean temperatures from ERA5 range from 27.5 to 28.3 °C with an increase of 1.2 °C over 40 years (Figure 3a). The in situ buoy (SAMMO), indicates s a minimum increase of 0.4 °C in 18 years (Figure 3b). The records of STT from ERA5 correlated well with those measured locally. The in situ SST recorded a large number of outliers, which were not detected by the satellite (Figure 3d).
The winter and summer SST values from ERA 5 differed ~4 °C (Figure 4), and the average SST differed by <1.5 °C within each season. In situ, SST data were generally lower than those determined with Era 5, but peaks were 1 and 2 °C lower and higher in the winter and summer, respectively.
4.2.3. Atmospheric Pressure (AP)
No significant variations in AP are detected from 1980 until 2020 (Figure 5a), although some years have significant outliers, corresponding with low-pressure events such as hurricanes Allen (1980; min. 101,388 Pa), Gilbert (1988; min. 101,281 Pa), Ivan (2004; min. 101,585 Pa), and Wilma (2005; min. 101,223 Pa). The trend is of a 1.4 Pa increase over these 40 years. It is worth noting that since 2005, there have been no important meteorological events.
The lowest monthly AP is reported in August–October, during the hurricane season, and overall AP is lower in summers than in winters (Figure 5c).
4.2.4. Wind, Waves and Storms
At Puerto Morelos, most winds come from the east, followed almost equally by winds from the southeast and northeast (Figure 6a). The wind directions remained more or less the same over this period (Figure 6b). The winds from northerly and southerly directions occur more frequently in winter and summer, respectively (Figure 6b,c). The wind speeds range from 17.5 m/s to 69.4 m/s. The highest wind speeds correspond to hurricanes Allen, Gilbert, Roxane, and Emily and Wilma (Appendix A).
The highest waves (>9 m) were recorded in 1988 and 2005, in September and October, respectively (Figure 7a,b). Apart from the highest waves in the data, which are related to specific extreme events, there is no evidence of an increase in storminess over the 40-year period (Figure 7 and Figure 8). For the mean wave periods, no trend is seen in Figure 8a, but there is a clear difference between sea and swell waves, arguably responding to calm and storm conditions. The latter is confirmed in Figure 8b, where it is evident that the longer wave periods occur in the summer months with a higher frequency of hurricanes. Figure 8b also shows how ‘Nortes’ affect local storms in winter.
Most waves come from the east, followed by those from the southeast and northeast (Figure 9a). Waves from the southeast and east have become slightly more frequent over the last 40 years. The wave direction with the highest probability is the southeast. For the winter and summer, the dominant wave direction is the east, followed by the southeast and northeast (Figure 9b,c).
4.2.5. Precipitation (P)
In the Mexican Caribbean, it tends to rain more in the summer than in winter, with maximum accumulations of 330 mm and 30 mm minimum, respectively (Figure 10b).
4.3. Yucatan Peninsula Tectonic Activity
Plate tectonics modify local sea level variability. Globally, from the Pleistocene (2.6 million years ago) onwards, there has been elevation or subsidence in the continental margins of up to 10 cm/y [31]. The formation of the Yucatan Peninsula began in the Upper Cretaceous (145 to 66 MYA) period, continuing until the Lower Eocene (56 to 47 MYA). Throughout this period, the peninsula has been gradually emerging, lifting the platform above the current sea level. The orogenic movements during the Upper Miocene induced a faster rise of the peninsular mass, with a constant peripheral expansion (mainly towards the northwest), accompanied by frequent, occasional regressions of the sea. This gradual emergence continues today on the north and east of the peninsula [32]. The neotectonics activity is consistent with the geologic constitution of the peninsula, i.e., the tertiary marine sedimentary rocks testify to a gradual rise, at least from the Oligocene (28.1 MYA) [33].
4.4. The Present State of the Ecosystems
The main coastal ecosystems at Puerto Morelos have been studied to a greater or lesser degree over recent decades. A summary of the changes in the states of these ecosystems, together with an evaluation of their current states obtained from a literature review and maps recently published by scientific institutions in Mexico, are presented in Appendix B. All these ecosystems have changed over the last decades, but drivers/disturbances responsible for these changes are not the same for each ecosystem (Table 3).
5. Discussion
Locally recorded values of the geophysical drivers associated with climate change differ from the global averages, supporting our initial hypothesis that climate change is not uniform around the globe (Table 4).
Validation of global sea level data for a given region is difficult due to the lack of homogeneous local data sources, reference levels, and methods of analysis. Although global data are readily available, conclusions drawn from them may be flawed. In the state of the art, we found different estimates of sea level variation [11,12,13]; however, these estimates were not consistent; therefore, we used the maximum daily SLA from ERA5 for this study in Puerto Morelos, the sea level rise is 2.48 mm/year, corresponding to 67 mm over the 27 years, which is similar to that of [14], also using regional data. Regarding SLR, the state of Quintana Roo and northern Yucatan are geologically younger than the interior of the peninsula. The Yucatan peninsula has risen between 50 and 100 mm in the last 100 years [45], which could compensate for the consequences of sea-level rise in the area. However, studies on uplift since the Holocene are contradictory, with some authors claiming that uplift continues, although little information is available [36,45,46,47,48], while others say that the peninsula is subsiding [49,50].
The sea surface temperature increased by 1.2 °C according to ERA5 data (from 1980 to 2020) and 0.4 °C (from 1992 to 2020) using in situ measurements. The increase in temperature is what most authors agree on, both with regional information and global averages [8,43,51].
Annual modes of Atmospheric Pressure (AP) for winter and summer revealed high- and low-pressure seasons (Figure 5c). The lowest AP are associated with hurricanes and were recorded in 1980 (101,388 Pa), 1988 (101,282 Pa), and 2005 (101,223 Pa), Hurricanes Allen, Gilbert, and Wilma, respectively (Figure 5a). No trends of change with time were observed for AP, nor the wind directions and velocities, which is in line with [52]. Precipitation levels also showed no trend over time, and peaks identified in June and the other from September to November were also identified by [53].
Table 4 summarises the geophysical variable data obtained in this paper (local trend) compared with reviewed literature data (global-regional data).

Table 4.
Summary of changes in geophysical variables associated with climate change: global vs. local trends.
Table 4.
Summary of changes in geophysical variables associated with climate change: global vs. local trends.
| Variable | Global/Regional Trend (Per Year) | Local Trend (Per Year) | Observations |
|---|---|---|---|
| Sea Level Rise | +3.9 mm | +2.5 mm | Regional SLR for the north Atlantic and Caribbean [8] |
| Sea Surface Temperature | +1.5–4.0 °C * | +0.4–1.2 °C * | [8] gives scenarios for annual global sea SST |
| Atmospheric Pressure | no change | no change | Global trend from [52] |
| Wind | no change | no change | Similar results to regional data [52] |
| Waves | no change | no change | Similar results to regional data [52] |
| Precipitation | no change | no change | Similar results to regional data [53] |
* The local SST change covers the last 40 years and the global ~50 years [8].
Local trends in geophysical drivers allow the influence of these factors on ecosystem changes to be assessed, albeit interpretively. SLR is expected to influence coastal dynamics; however, most of the shoreline (Figure A4) has been in dynamic equilibrium until 2015. The only ecosystem visibly affected in Puerto Morelos by climate change is the coral reef (Table 3). Ocean warming causes bleaching [22], and acidification affects coral calcification, slowing coral growth. These impacts, combined with human-induced pressures, make corals vulnerable to disease and death [54]. Increasing SST may affect maximum wind speeds and increase hurricane intensity, although the full effects are still uncertain. In this research, we reviewed the number and characteristics of hurricanes passing near Puerto Morelos without finding clear evidence of an increase in their frequency or intensity (see Figure 5a and Appendix A). However, the coastal ecosystems of Puerto Morelos underwent changes over the last 60 decades that were not in line with trends in geophysical drivers related to climate change. Hurricanes, for example, have disturbed these ecosystems since historical times. Major storms, such as hurricanes, change the structure and dynamics of coastal ecosystems through extensive physical damage or through the selective removal of species. However, if the ecosystems are in good condition, like some mangroves or seagrass beds in Puerto Morelos, the damage is limited, or the ecosystems recover within one or several years. The species of mangrove determines the ability of the ecosystem to withstand the forces of wind and flooding after a hurricane. However, damage to mangroves is worse, and recovery is more difficult in densely urbanized areas than in less urbanized areas [55].
The coastal dunes of the region are in a critical situation (Figure A3), not because of sea level rise or the effect of hurricanes, but because urbanization, such as tourist infrastructure, has been built on the dunes themselves. This has also led to localized beach erosion. In 2005, an unprecedented hurricane season, beaches with healthy dunes increased in length (spreading the sand from the dunes over the beach) but quickly regained their usual size and dynamic stability. This lasted until 2015, the first year of a massive influx of Sargasso that returns periodically.
Hurricanes have little impact on well-developed reef lagoon seagrass meadows [56] or show recovery if left undisturbed [57,58]. The near-shore fringes of seagrass meadows have been severely impacted by Sargasso brown tides since 2015 [58]. The seagrass meadows of the Puerto Morelos reef lagoon have undergone a gradual shift in community composition due to eutrophication since the 1990s [42,59].
Although hurricanes have always caused coral mortality [54], it was reported that the hard-coral community in Puerto Morelos has not shown recovery in the 22 years since the impact of Gilbert. The recovery of the still-affected reef corals in Puerto Morelos after the 2005 hurricanes was slower than in nearby areas (25–35% in 11–13 years). Algal colonization probably inhibited coral settlement and development. Increased nutrient inputs from sewage discharges [60] also favor algal growth, further delaying coral recovery [43]. Recently, the rapid spread of stony coral tissue loss disease has caused significant mortality of stony corals throughout the Caribbean, including Puerto Morelos [44].
6. Conclusions
Although global climate-related changes are undeniable [8], the consequences of these changes vary in type and degree and depend on local and regional conditions. The sea level at Puerto Morelos is rising, but previous research provided unrealistic future scenarios for the Mexican Caribbean, and local SLR has been moderate with no impact to date, which also makes restoration projects (e.g., dunes) possible, but this may change if global warming continues to increase.
Local anthropic disturbances, such as infrastructure construction pollution of water bodies linked to wastewater discharge and touristic activities, are the main cause of the current degradation on the coasts of the Mexican Caribbean; this is good news, as these problems can be addressed via appropriate public policies and regulations. Notwithstanding, the full effects of the abnormal sargassum arrivals on the coastal ecosystems need to be studied further. Changes in prevailing currents and wind regimes due to climate change and eutrophication are thought to be responsible for this new phenomenon [61].
The historical data analyzed in this article cover the most recent 40 years. With the exception of severe coral bleaching, no serious disturbances due to climate change effects were observed in other ecosystems in Puerto Morelos. Although climate scientists traditionally use a period of at least 30 years to identify a genuine trend [62], this period may be too short to discern changes in ecosystem status. Chronic changes in the resistance and resilience of ecosystems under prevailing conditions are often not visible but can be evidenced by the presence of extreme (episodic) events [63].
The mass and energy balances on which the health of coastal ecosystems depend must have accurate, local data on which to base future targeted actions to conserve or restore the coastal ecosystems. We hope that this research will be used by decision-makers so that long-term monitoring actions can be instigated, particularly in tropical areas where such information is often lacking.
Author Contributions
Conceptualization, O.G., B.I.v.T. and E.M.; methodology, O.G.; validation, O.G., formal analysis, O.G. and E.M.; investigation, O.G., E.M., R.S. and B.I.v.T.; resources, O.G.; data curation, O.G., B.I.v.T., E.M. and R.S.; writing—original draft preparation, O.G., E.M. and R.S.; writing—review and editing, O.G., E.M., R.S. and B.I.v.T. All authors have read and agreed to the published version of the manuscript.
Funding
The authors would like to thank the grants obtained from Dirección General de Asuntos del Personal Académico (DGAPA) of Universidad Nacional Autónoma de México (UNAM) through “Programa de Apoyo a Proyectos de Investigación e Innovación Tecnológica” project RENACE, No. IG10032 and the support from Institute of Engineering, UNAM through project GII Sostenibilidad del Caribe Mexicano: Cambiando debilidades en fortalezas.
Institutional Review Board Statement
Not applicable.
Informed Consent Statement
Not applicable.
Data Availability Statement
Data sets were obtained from the ECMWF ERA5 reanalysis available at Copernicus Climate Change Service Climate data (C3S). https://cds.climate.copernicus.eu/cdsapp#!/dataset/reanalysis-era5-single-levels?tab=form (accessed on 10 April 2020). Local Sea Surface Temperature and precipitation data sets were obtained from The Academic Service of Meteorological and Oceanographic Monitoring-UNAM (SAMMO) by request. https://sammo.icmyl.unam.mx (accessed on 10 November 2020). Maps information from CONABIO Geoinformation Portal http://geoportal.conabio.gob.mx (accessed on 23 June 2022) and SIMAR–CONABIO https://simar.conabio.gob.mx/ (accessed on 23 June 2022).
Acknowledgments
The first author is funded by a Ph.D. scholarship awarded by the National Council of Humanities, Sciences and Technologies CONAHCYT. Thanks to Edgar Escalante Mancera and Miguel Ángel Gómez Reali from SAMMO-UNAM for providing SST and precipitation local data. Special thanks to Jill Taylor, who helped significantly improve the manuscript. Also, the invaluable improvements suggested by Izchel Gomez are greatly acknowledged.
Conflicts of Interest
The authors declare no conflict of interest.
Appendix A
Table A1.
Tropical storms and hurricanes were recorded for Puerto Morelos. TS: Tropical Storm, TD: Tropical Depression. Source: NOAA Historical Hurricane Tracks [26]. It is worth noting that in the Mexican Caribbean, La Niña events are related to an increased probability of hurricane landfalls in the Caribbean. Niña years also have lower temperatures and a greater probability of tropical storms than Niño years [64].
| Year | Name | Category | Date | Wind Speed(m/s) | Influence Radius (km) | Influence Time (Hours) | Persistence (Hours) |
|---|---|---|---|---|---|---|---|
| 1852 | Not named | H2 | 8-oct | 90 | 100 | 6 | 6 |
| 1857 | Not named | H2 | 28-sep | 90 | 100 | 6 | |
| 1857 | Not named | H1 | 26-sep | 75 | 80 | 6 | |
| 1857 | Not named | H1 | 26-sep | 75 | 80 | 12 | |
| 1857 | Not named | H1 | 19-aug | 65 | 80 | 12 | 36 |
| 1870 | Not named | TS | 02-nov | 50 | 40 | 2 | 2 |
| 1873 | Not named | H1 | 05-oct | 80 | 80 | 18 | |
| 1873 | Not named | H1 | 05-oct | 80 | 80 | 6 | 24 |
| 1877 | Not named | H1 | 29-sep | 70 | 80 | 8 | 8 |
| 1880 | Not named | H2 | 09-aug | 90 | 100 | 6 | |
| 1880 | Not named | H1 | 09-aug | 70 | 80 | 2 | |
| 1880 | Not named | TS | 06-oct | 50 | 40 | 4 | 12 |
| 1881 | Not named | TS | 16-aug | 40 | 40 | 2 | 2 |
| 1887 | Not named | H2 | 17-sep | 85 | 100 | 6 | |
| 1887 | Not named | H1 | 17-sep | 75 | 80 | 1 | 7 |
| 1888 | Not named | H1 | 06-sep | 70 | 80 | 3 | |
| 1888 | Not named | TS | 09-oct | 60 | 40 | 2 | 5 |
| 1891 | Not named | H4 | 10-oct | 110 | 150 | 18 | |
| 1891 | Not named | H2 | 10-oct | 85 | 100 | 12 | 30 |
| 1893 | Not named | H2 | 29-sep | 85 | 100 | 6 | |
| 1893 | Not named | H1 | 29-sep | 80 | 80 | 6 | 12 |
| 1895 | Not named | H2 | 27-aug | 85 | 100 | 6 | 6 |
| 1903 | Not named | H2 | 13-aug | 85 | 100 | 6 | 6 |
| 1909 | Not named | H3 | 25-aug | 90 | 100 | 6 | |
| 1909 | Not named | TS | 08-aug | 40 | 40 | 4 | 10 |
| 1912 | Not named | TS | 13-oct | 55 | 40 | 3 | 3 |
| 1913 | Not named | TS | 25-jun | 50 | 40 | 3 | 3 |
| 1916 | Not named | H1 | 03-jul | 65 | 80 | 4 | 4 |
| 1922 | Not named | H2 | 18-oct | 95 | 100 | 12 | 12 |
| 1931 | Not named | TS | 25-jun | 45 | 40 | 1 | 1 |
| 1933 | Not named | H4 | 22-sep | 125 | 150 | 12 | 12 |
| 1935 | Not named | TD | 30-aug | 25 | 40 | 0.5 | 0.5 |
| 1936 | Not named | TS | 15-aug | 35 | 40 | 4 | |
| 1936 | Not named | TS | 13-jul | 40 | 40 | 3 | 7 |
| 1938 | Not named | H3 | 26-aug | 105 | 100 | 6 | 6 |
| 1942 | Not named | H2 | 28-aug | 90 | 100 | 6 | 6 |
| 1944 | Not named | H1 | 20-sep | 70 | 80 | 6 | 6 |
| 1951 | Charlie | H4 | 20-aug | 115 | 150 | 6 | 6 |
| 1964 | Not named | TD | 04-jun | 30 | 40 | 6 | 6 |
| 1967 | Beulah | H2 | 17-sep | 90 | 100 | 6 | 6 |
| 1969 | Not named | TD | 12–13jun | 25 | 40 | 18 | 18 |
| 1973 | Delia | TD | 02-sep | 30 | 40 | 6 | 6 |
| 1974 | Not named | TD | 24-sep | 30 | 40 | 4 | 4 |
| 1975 | Eloise | TS | 21-sep | 45 | 40 | 5 | |
| 1975 | Not named | TD | 10-nov | 30 | 40 | 4 | 9 |
| 1979 | Henri | TD | 15-sep | 25 | 40 | 3 | 3 |
| 1980 | Allen | H5 | 07-aug | 165 | 200 | 6 | 6 |
| 1988 | Gilbert | H5 | 09-sep | 160 | 200 | 12 | |
| 1988 | Keith | TS | 21-nov | 60 | 40 | 2 | 14 |
| 1992 | Isidore | TD | 24sep | 38 | 60 | 12 | 36 |
| 1995 | Roxane | H3 | 10–11 oct | 100 | 100 | 3 | 3 |
| 2003 | Claudette | TS | 11-jul | 50 | 40 | 6 | 6 |
| 2004 | Ivan | H5 | 14-sep | 145 | 200 | 1 | 1 |
| 2005 | Emily | H4 | 18-jul | 115 | 150 | 1 | |
| 2005 | Wilma | H4 | 22-oct | 115 | 150 | 48 | 49 |
| 2007 | Olga | TD | 15-dec | 30 | 40 | 3 | 3 |
| 2008 | Dolly | TS | 21-jul | 45 | 40 | 1 | 1 |
| 2010 | Paula | H2 | 13-oct | 85 | 100 | 6 | 6 |
| 2011 | Rina | TS | 28-oct | 50 | 40 | 4 | 4 |
| 2020 | Delta | H2 | 07-oct | 90 | 100 | 2 | |
| 2020 | Zeta | H1 | 27-oct | 75 | 80 | 1 | 3 |
Appendix B
The State and Changes in the Coastal Ecosystems of Puerto Morelos
- Mangroves
The mangrove species currently found at Puerto Morelos are Rhizophora mangle (red mangrove), Avicennia germinans (black mangrove), Laguncularia racemosa (white mangrove), and Conocarpus erectus (button mangrove), with R. mangle being the dominant species [20] Herrera-Silveira et al. [37] studied the 1996-ha mangrove forest of Puerto Morelos from 2010 to 2013 and found that 798.6 ha (40%) was in a good state of conservation, 718.7 ha (36%) average, and 479 ha (24%) in a poor condition. Sánchez-Quinto et al. [20] reported that from 2009 to 2011, the mangrove density decreased from 4450 to 4400 individuals per ha, and 20% (400 ha) of the forest cover disappeared between 2010 and 2018.
Perera-Valderrama et al. [40] reported that the density of the mangrove forest in Puerto Morelos is in a good state of conservation. Figure A1 shows the mangrove coverage in 2020. The red area shows coverage loss, the green area has new coverage, and the yellow area has well-preserved mangroves. The good state of conservation of the mangroves at Puerto Morelos is evidenced by the blue carbon stocks, which have normal to high values, regarding the mangroves in Mexico, i.e., 100 to 270 Mg ha−1 [4].
Figure A1.
Mangrove cover in 2020 (data from [21]).
Figure A1.
Mangrove cover in 2020 (data from [21]).

The mangroves at Puerto Morelos are delimited by a Pleistocene ridge [37] that has no direct connection with the sea and is closed by a sand barrier, forming a mangrove wetland episodically interconnected with the sea when the storm tide overtops the barrier or when the barrier opens [65] (Figure A2). The main threats to these mangrove forests are tourist development and the pollution of water and soil. Because of the episodic connections between the sea and the mangrove forest, the area is vulnerable to hydrological changes, causing water stress and a decrease in resilience (Figure A2a–d) [20].
Figure A2.
Mangrove forest in the Puerto Morelos tourist area (Author’s photos, 2021). (a) Tourist infrastructure in the mangrove area, (b) Mangrove forest cover to the south, (c) Mangrove forest cover to the north, (d) Pleistocene ridge between the mangrove forest and the sea.
Figure A2.
Mangrove forest in the Puerto Morelos tourist area (Author’s photos, 2021). (a) Tourist infrastructure in the mangrove area, (b) Mangrove forest cover to the south, (c) Mangrove forest cover to the north, (d) Pleistocene ridge between the mangrove forest and the sea.


- 2.
- Coastal Dunes
Of all Mexican coastal states, Quintana Roo has one of the lowest rates of dune coverage and dune vegetation due to tourist urbanization. Along the Cancún-Puerto Morelos tourist corridor, 66% of the coastal dunes are urbanized, fragmented, or both, and only 34% are in a good state of conservation [38], while in Puerto Morelos itself, several tourist complexes have recently been constructed on top of the dunes [66], as seen in Figure A3.
Figure A3a,b shows buildings placed extremely close to the shore, where the dune vegetation or the dune itself had been removed. Some resorts in Puerto Morelos are trying to restore the dunes and their vegetation (Figure A3c), and others still have small patches of dune vegetation on their waterfront (Figure A3d). Such efforts need to be strengthened to favor the coverage of dunes and dune vegetation in the area.
Figure A3.
Coastal dunes in the Puerto Morelos tourist area (Author’s photos, using Phantom IV Pro, 2021). (a) Aerial view with low tourist pressure and without dune, (b) Aerial view of a tourist development without dune, (c) Restoration of dune vegetation, (d) Patches of dune vegetation within a tourist development.


- 3.
- Shoreline dynamics
The coastal dynamics at Puerto Morelos were evaluated by comparing the shoreline position for 2005, 2006, 2009, 2013, 2014, 2015, and 2016, as seen in Figure A4. An anomaly was found in 2005 as a result of Hurricane Wilma and that record-breaking hurricane season. Two sets of coastline position data were analyzed to assess the possible 2005 bias: one taking into consideration 2005 and the other not. The average accretion and erosion of the coastline was 25.6 m/year and 16.3 m/year, respectively. Escudero M. et al. [39] found that in the stretches of the beach protected by coral reefs, there was almost no coastal erosion.
Figure A4.
Coastline dynamics in Puerto Morelos for 2005, 2006, 2009, 2013, 2014, 2015 and 2016 years.
Figure A4.
Coastline dynamics in Puerto Morelos for 2005, 2006, 2009, 2013, 2014, 2015 and 2016 years.

- 4.
- Seagrass meadows
In the PNAPM, seagrass meadows cover approximately 1622 ha of the bottom of the reef lagoon [40] (Figure A5). Kuffner [54] identified three distinct zones of seagrasses parallel to the fringing reef: the narrow coastal strip, the intermediate zone, and the area adjacent to the reef (Figure A6a). There are three main species: Thalassia testudinum, Syringodium filiforme, and Halodule wrightii, with T. testudium being the dominant species in the area regarding total biomass (Figure A6b,c). Until the early 1990s, seagrass meadows were still considered relatively pristine [67], but since then, communities have gradually changed; the faster-growing seagrass species, such as S. filiforme and macro-algae, are becoming more dominant [41,58]. de Almeida et al. [42] reported that for the northern protected zone (20° 57′–21° 00′ N; 86° 47′–86° 49′ W), T. testudinum is the dominant one; however, S. filiforme had a higher density.
de Almeida et al. [42] stated that Wilma had not affected seagrass meadows apart from burying a coastal fringe. Ladd et al. [60] found that the spatial structure of the seagrass meadows throughout the reef lagoon has changed since the massive influxes of sargassum began to arrive in the area. The seagrass meadows have an important role in sequestering organic carbon and thus mitigating the rising CO2 atmospheric levels. López-Mendoza et al. [68] report that the Cancun–Riviera Maya corridor has a burial rate of 2 to 252 gm−2 yr−1 and a 1 m stock of 32.3 to 82.6 Mg ha−1. T. testudinum meadows showed Corg storage of approximately 40 to 100 years, which is the time that the seagrass meadows have been in the area.
Figure A5.
Seagrasses coverage in 2022 (data from [21]).
Figure A5.
Seagrasses coverage in 2022 (data from [21]).

de Almeida et al. [42] also reported that the marine conditions of seagrass meadows in the Mexican Caribbean have not changed as a result of climate change but due to anthropic activities. According to [54], in this part of the Caribbean, seagrasses thrive at high light intensities and a sea temperature of 27 °C to 31 °C. The main threats to the seagrass meadows in this area are hurricanes, the mass influxes of sargassum, eutrophication, invasive algae, and predation by sea turtles (Figure A6d).
Figure A6.
Seagrass meadows. (a) Sea turtle grazing on seagrasses (Photo by Isis Martinez), (b) Thalassia testudinum (Photo by Valery Ávila), (c) Syringodium filiforme and Thalassia testudinum (Photo by Valery Ávila), (d) Seagrass meadows adjacent to the reef zone (Photo by Alex Vega).
Figure A6.
Seagrass meadows. (a) Sea turtle grazing on seagrasses (Photo by Isis Martinez), (b) Thalassia testudinum (Photo by Valery Ávila), (c) Syringodium filiforme and Thalassia testudinum (Photo by Valery Ávila), (d) Seagrass meadows adjacent to the reef zone (Photo by Alex Vega).

- 5.
- Coral Reefs
The Mesoamerican Barrier Reef System is about 1000 km long, aiding connectivity between habitats and biological communities. Ref. [69] found that the ecoregion where the PNAPM lies has the highest functional potential of reefs in the Greater Caribbean. The spatial distribution of coral reef coverage in shallow waters from Cabo Catoche to Xcalak (1000 km2) is shown in Figure A7, combining the categories: coral structure, octocorals, and octocorals and corals, with an average maximum depth of 18 m [21,70].
According to the Essential Report Card for the Mesoamerican Reef 2022, the general status of the PNAPM goes from medium to poor state of conservation according to values of living coral cover, density, colony sizes, and species composition. Caballero-Aragón et al. 2020 and 2019 [71,72] rated it as a medium-poor state due to the low coral recruitment rate, its biomass of commercial fish species, and several diseases affecting the zone. McField, M. et al. [73] reported a decrease in the coverage of live corals from 2018 to 2020, but the reduction in live coral cover has not affected the functional groups of reef-building corals. The reef-building coral species in the area are Acropora palmata and Orbicella spp., as shown in Figure A8 [69,74].
Figure A7.
Coral reef cover to the year 2021 (data from [21]).
Figure A7.
Coral reef cover to the year 2021 (data from [21]).

Figure A8.
Coral reefs within the PNAPM. (a) Acropora palmata meadows, Limones Reef. (Photo: Sandra Mendoza), (b) Aerial photo of the A. palmata and Orbicella spp. Meadows (c) A. palmata meadows in the Akumal region (Photo: Eduardo Ávila), (d) A. palmata and Orbicella spp. at Picudas reef (Photo: Eduardo Ávila).

The coral community in Puerto Morelos is currently suffering from the effects of diseases and bleaching. Diseases have become the most important cause of coral cover loss in the Caribbean [71,75], the most lethal being the stony coral tissue loss disease (SCTLD). Thirty coral species in the Caribbean have been reported to be infected by this disease, and this number is increasing [44]. Other common diseases in the Mexican Caribbean are: Black band [76,77,78,79,80,81,82,83,84,85,86], Shutdown reaction [87], Aspergillosis [88,89,90], White pox [91,92], Yellow band [93,94,95], and Dark spots [96,97,98]. Another severe problem in the area is bacterial bleaching [99,100,101,102,103,104,105,106,107], which is due to the increase in sea surface temperature [54,108].
The main causes of environmental degradation in the PNAPM reefs include global warming [109], sea surface temperature increase [110] and hurricanes, but the most significant seems to be local impacts such as eutrophication, overfishing, sedimentation, dredging, coastline modification, infrastructure development, plastic waste, invasive species, navigation and diving activities [40,44,111].
References
- Coastal Engineering Research Center [CERC]. Coastal Engineering Manual; Coastal Engineering Research Center: Ft. Belvoir, VA, USA, 2000. [Google Scholar]
- Silva-Casarín, R.; Villatoro Lacouture, M.M.; Ramos Durón, F.J.; Pedroza Paez, D.; Ortiz Perez, M.A.; Mendoza Baldwin, E.G.; Delgadillo Calzadilla, M.A.; Escudero Castillo, M.C.; Féliz Delgado, A.; Cid Salinas, A. Caracterización de la Zona Costera y Plantemaineto de Elementos Técnicos para la Elaboración de Criterios de Regulación y Manejo Sustentable; UNAM—Instituto de Ingeniería: Ciudad de México, México, 2014; pp. 11–62. [Google Scholar]
- Burkett, V.; Codignotto, J.O.; Forbes, D.L.; Mimura, N.; Beamish, R.J.; Ittekkot, V. IPCC. In Climate Change Impacts, Adaptation and Vulnerability; McCarthy, J.J., Canziani, O.F., Leary, N.A., Dokken, D.J., White, K.S., Eds.; Cambridge University Press: Cambridge, UK; New York, NY, USA, 2001; pp. 23–101. [Google Scholar]
- Cuellar-Martínez, T.; Ruiz-Fernández, A.C.; Sanchez-Cabeza, J.A.; Pérez-Bernal, L.; López-Mendoza, P.G.; Carnero-Bravo, V.; Agraz-Hernández, C.M.; van Tussenbroek, B.I.; Sandoval-Gil, J.; Cardoso-Mohedano, J.G.; et al. Temporal records of organic carbon stocks and burial rates in Mexican blue carbon coastal ecosystems throughout the Anthropocene. Glob. Planet. Chang. 2020, 192, 103215. [Google Scholar] [CrossRef]
- Barbier, E.B.; Hacker, S.D.; Kennedy, C.; Koch, E.W.; Stier, A.C.; Silliman, B.R. The value of estuarine and coastal ecosystem services. Ecol. Monogr. 2011, 81, 169–193. [Google Scholar] [CrossRef]
- Martínez, M.L.; Silva, R.; López-Portillo, J.; Feagin, R.A.; Martínez, E. Coastal ecosystems as an ecological membrane. J. Coast Res. 2020, 95, 97–101. [Google Scholar] [CrossRef]
- Natural Resources Defense Council. Available online: https://www.nrdc.org/ (accessed on 31 March 2022).
- Masson-Delmotte, V.; Zhai, P.; Pirani, A.; Connors, S.L.; Péan, C.; Berger, S.; Caud, N.; Chen, Y.; Goldfarb, L.; Gomis, M. Climate Change 2021: The Physical Science Basis. Contribution of Working Group I to the Sixth Assessment Report of the Intergovernmental Panel on Climate Change; Cambridge University Press: Cambridge, UK; New York, NY, USA, 2021; pp. 325–360. [Google Scholar]
- Silva, R.; Martínez, M.L.; Van Tussenbroek, B.I.; Guzmán-rodríguez, L.O.; Mendoza, E.; López-portillo, J. A framework to manage coastal squeeze. Sustainability 2020, 12, 10610. [Google Scholar] [CrossRef]
- Stocker, T.F.; Qin, D.; Plattner, G.-K.; Tignor, M.; Allen, S.K.; Boschung, J.; Nauels, A.; Xia, Y.; Bex, V.; Midgley, P.M. Climate Change 2013: The Physical Science Basis. Contribution of Working Group I to the Fifth Assessment Report of the Intergovernmental; Cambridge University Press: Cambridge, UK; New York, NY, USA, 2013; 1535p. [Google Scholar] [CrossRef] [Green Version]
- Pedrozo-Acuña, A.; Damania, R.; Laverde-Barajas, M.A.; Mira-Salama, D. Assessing the consequences of sea-level rise in the coastal zone of Quintana Roo, México: The costs of inaction. J. Coast. Conserv. 2015, 19, 227–240. [Google Scholar] [CrossRef]
- Pfeffer, W.T.; Harper, J.T.; O’Neel, S. Kinematic constraints on glacier contributions to 21st-century sea level rise. Science 2008, 321, 1340–1343. [Google Scholar] [CrossRef]
- Ruíz-Ramírez, J.D.; Euán-Ávila, J.I.; Rivera-Monroy, V.H. Vulnerability of Coastal Resort Cities to Mean Sea Level Rise in the Mexican Caribbean. Coast. Manag. 2019, 47, 23–43. [Google Scholar] [CrossRef]
- Boretti, A. A realistic expectation of sea level rise in the Mexican Caribbean. J. Ocean. Eng. Sci. 2019, 4, 379–386. [Google Scholar] [CrossRef]
- Gómez, I.; Silva, R.; Lithgow, D.; Rodríguez, J.; Banaszak, A.T.; van Tussenbroek, B. A Review of Disturbances to the Ecosystems of the Mexican Caribbean, Their Causes and Consequences. J. Mar. Sci. Eng. 2022, 10, 644. [Google Scholar] [CrossRef]
- White, P.S.; Pickett, S. Natural disturbance and patch dynamics: An introduction. In The Ecology of Natural Disturbance and Patch Dynamics; Academic Press: New York, NY, USA, 1985; pp. 3–13. [Google Scholar]
- Cazenave, A.; Nerem, R.S. Present-day sea level change: Observations and causes. Rev. Geoph. 2004, 42, 1–20. [Google Scholar] [CrossRef]
- McLean, R.F.; Tsyban, A.; Burkett, V.; Codignott, J.O.; Forbes, D.L.; Mimura, N.; Beamish, R.J.; Ittekkot, V. Coastal Zones and Marine Ecosystems. In Climate Change 2001: Impacts, Adaptation, and Vulnerability. Contribution of Working Group II to the Third Assessment Report of the Intergovernmental Panel on Climate Change; McCarthy, J.J., Canziani, O.F., Leary, N.A., Dokken, D.J., White, K.S., Eds.; Cambridge University Press: Cambridge, UK, 2001; pp. 343–379. [Google Scholar]
- Pacchiano Alemán, R. Programa de Manejo Parque Nacional Costa Occidental de Isla Mujeres, Punta Cancún y Punta Nizuc; SEMARNAT-Secretaría de Medio Ambiente y Recursos Naturales: Diario Oficial de la Federación. México. 2016; Available online: https://www.dof.gob.mx/nota_detalle.php?codigo=5446471&fecha=02/08/2016#gsc.tab=0 (accessed on 30 May 2020).
- Sánchez-Quinto, A.; Costa, J.C.; da Zamboni, N.S.; Sanches, F.H.C.; Principe, S.C.; Viotto, E.V.; Faroni-Perez, L. Development of a conceptual framework for the management of biodiversity and ecosystem services in the Mexican Caribbean. Biota Neotrop. 2020, 20, 1–18. [Google Scholar] [CrossRef]
- SIMAR-CONABIO. Available online: https://simar.conabio.gob.mx/ (accessed on 28 June 2022).
- Carabias Lillo, J.; Provencio, E.; De la Maza Elvira, J.; Gutiérrez Carbonell, D.; Gómez Cruz, M. Programa de Manejo Parque Nacional Arrecife de Puerto Morelos; CONANP: Ciudad de México, México, 2000; p. 224. [Google Scholar]
- INEGI. Censos Económicos 2014. Available online: http://www.inegi.org.mx/ (accessed on 4 May 2021).
- Copernicus Climate Change Service. Available online: https://cds.climate.copernicus.eu/ (accessed on 10 April 2020).
- Servicio Académico de Monitoreo Meteorológico Oceanográfico. Available online: https://sammo.icmyl.unam.mx/ (accessed on 10 November 2020).
- Historical Hurricane Tracks. Available online: https://coast.noaa.gov/ (accessed on 15 March 2022).
- CONABIO Geoinformation Portal. Available online: http://geoportal.conabio.gob.mx (accessed on 23 June 2022).
- Olauson, J. ERA5: The new champion of wind power modelling? Renew. Energy 2018, 126, 322–331. [Google Scholar] [CrossRef] [Green Version]
- Odériz, I.; Silva, R.; Mortlock, T.R.; Mendoza, E. Climate Drivers of Directional Wave Power on the Mexican Coast. Ocean Dyn. 2020, 70, 1253–1265. [Google Scholar] [CrossRef]
- Hersbach, H.; Bell, B.; Berrisford, P.; Hirahara, S.; Horányi, A.; Muñoz-Sabater, J.; Nicolas, J.; Peubey, C.; Radu, R.; Schepers, D.; et al. The ERA5 global reanalysis. Q. J. R. Meteorol. Soc. 2020, 146, 1999–2049. [Google Scholar] [CrossRef]
- Kopp, R.E.; Hay, C.C.; Little, C.M.; Mitrovica, J.X. Geographic Variability of Sea-Level Change. Curr. Clim. Chang. Rep. 2015, 1, 192–204. [Google Scholar] [CrossRef] [Green Version]
- Olivera Gómez, A.Y. Reconstrucción paleo ecológica del sur de Quintana Roo, México, durante el Holoceno. In Contribuciones De La Ciencia Al Manejo Costero Integrado De La BAHÍA De Chetumal Y Su Área De Influencia; Rosado-May, F.J., Romero Mayo y, A., R. Navarrete, D.J., Eds.; Universidad de Quintana Roo, Q. Roo: Chetumal, México, 2002; pp. 5–15. [Google Scholar]
- Lugo-Hubp, J.; Aceves-Quesada, J.F.; Espinasa-Pereña, R. Rasgos geomorfológicos mayores de la península de Yucatán. Rev. Del Inst. De Geol. 1992, 10, 143–150. [Google Scholar]
- Sapper, K. Geología de la Península de Yucatán. In Enciclopedia Yucatanense; Enciclopedia Yucatanense: Mérida, México, 1945; Volume 1, pp. 207–213. [Google Scholar]
- Robles-Ramos, R. Geología y Geohidrología. In Los Recursos Del Sureste Y Su Aprovechamiento; Instituto Mexicano de Recursos Naturales Renovables: Ciudad de México, México, 1958; pp. 55–92. [Google Scholar]
- Espejel, I. A Phytogeographical Analysis of Coastal Vegetation in the Yucatan Peninsula. J. Biogeogr. 1987, 14, 499. [Google Scholar] [CrossRef] [Green Version]
- Herrera-Silveira, J.A.; Teutli-Hernández, C.; Zaldívar-Jiménez, A.; Pérez- Ceballos, R.; Cortés-Balán, O.; Osorio-Moreno, I.; Ramírez-Ramírez, J.; Caamal-Sosa, J.; Andueza-Briceño, M.T.; Torres, R.y.H. Hernández-Aranda. Programa Regional para la Caracterización y el Monitoreo de Ecosistemas de Manglar del Golfo de México y Caribe Mexicano: Península de Yucatán. Centro de Investigación y de Estudios Avanzados-Mérida. SNIB-CONABIO, proyecto No. FN009. México city. 2014. Available online: http://www.conabio.gob.mx/institucion/proyectos/resultados/InfFN009.pdf (accessed on 30 May 2020).
- Martínez, M.; Moreno-Casasola, P.; Espejel, I.; Jiménez-Orocio, O.; Infante-Mata, D.; Rodríguez-Revelo, N. Diagnóstico General de las Dunas Costeras de México, Comisión Nacional Forestal; SEMARNAT: México City, México, 2014; p. 359. [Google Scholar]
- Escudero, M.; Reguero, B.G.; Mendoza, E.; Secaira, F.; Silva, R. Coral Reef Geometry and Hydrodynamics in Beach Erosion Control in North Quintana Roo, Mexico. Front. Mar. Sci. 2021, 8, 1–35. [Google Scholar] [CrossRef]
- Perera-Valderrama, S.; Cerdeira-Estrada, S.; Martell-Dubois, R.; Rosique-de la Cruz, L.O.; Caballero-Aragón, H.; Ressl, R.; Santamaría-del Ángel, E.; Álvarez-Filip, L.; Reyes-Bonilla, H.; Alva-Basurto, J.C.; et al. Protocolos De Monitoreo De La Biodiversidad Marina En Áreas Naturales Protegidas Del Caribe Mexicano; Ressl, H., Ed.; CONABIO: México City, México, 2020; p. 156. [Google Scholar] [CrossRef]
- van Tussenbroek Brigitta, I. Dynamics of seagrasses and associated algae in coral reef lagoons. Hidrobiológica 2011, 21, 293–310. [Google Scholar]
- de Almeida, L.R.; Ávila Mosqueda, S.V.; Silva, R.; Mendoza, E.; van Tussenbroek, B.I. Mapping the structure of mixed seagrasss meadows in the Mexican Caribbean. Front. Mar. Sci. 2022, 9, 1063007. [Google Scholar] [CrossRef]
- 43. Wilkinson, T.; Wiken, E.; Creel, J.B.; Hourigan, T.; Agardy, T.; Herrmann, H.; Janishevski, L.; Madden, C.; Morgan, L.; Padilla, M. Ecorregiones marinas de América del Norte; Comisión para la Cooperación Ambiental: Montreal, QC, Canada, 2009; p. 200. [Google Scholar]
- Álvarez-Filip, L.; Estrada-Saldívar, N.; Pérez-Cervantes, E.; Molina-Hernández, A.; González-Barrios, F.J. A rapid spread of the stony coral tissue loss disease out-break in the Mexican Caribbean. PeerJ 2019, 7, e8069. [Google Scholar] [CrossRef] [PubMed] [Green Version]
- Flores, J.L. Dinámica de emersión del suelo y sucesión de la vegetación en el Arrecife Alacranes del Canal de Yucatán. Biótica 1984, 9, 41–64. [Google Scholar]
- Coke, J.G. Underwater Caves of the Yucatan Peninsula. In Encyclopedia of Caves, 3rd ed.; Elsevier: Amsterdam, The Netherlands, 2019. [Google Scholar] [CrossRef]
- Moseley, G.E.; Smart, P.L.; Richards, D.A.; Hoffmann, D.L. Speleothem constraints on marine isotope stage (MIS) 5 relative 616 sea levels, Yucatan Peninsula, Mexico. J. Quat. Sci 2013, 28, 293–300. [Google Scholar] [CrossRef]
- Sánchez, R.J.P. Evolución geológica del sureste mexicano, Golfo de México. Boletín De La Soc. Geológica Mex. 2007, 19–42. [Google Scholar] [CrossRef]
- Simms, A.R. Last interglacial sea levels within the Gulf of Mexico and northwestern Caribbean Sea. Earth Syst. Sci. Data 2020, 620, 1419–1439. [Google Scholar] [CrossRef]
- Otvos, E.G. Tectonic lineaments of Pliocene and Quaternary shorelines, northeast Gulf Coast. Geology 1981, 9, 398–404. [Google Scholar] [CrossRef]
- INAPESCA. Available online: https://www.gob.mx/inapesca (accessed on 2 February 2022).
- Rioja-Nieto, R.; Garza-Pérez, R.; Á lvarez-Filip, L.; Mariño-Tapia, I.; Enríquez, C. The Mexican caribbean: From Xcalak to holbox. In World Seas: An Environmental Evaluation; Academic Press: Cambridge, MA, USA, 2019; pp. 637–653. [Google Scholar]
- Rodríguez-Martínez, R.E.; Ruíz-Rentería, F.; van Tussenbroek, B.; Barba-Santos, G.; Escalante-Mancera, E.; Jordán-Garza, G.E. Environmental state and tendencies of the Puerto Morelos CARICOMP site, Mexico. Revista de Biología Tropical 2010, 58, 23–43. [Google Scholar]
- Kuffner, I.B. Sea-level rise could overwhelm coral reefs Frictionless when flat. Nature 2018, 558, 378–379. [Google Scholar] [CrossRef] [Green Version]
- Baldwin, A.; Egnotovich, M.; Ford, M.; Platt, W. Regeneration in fringe mangrove forests damaged by hurricane Andrew. Plant Ecol. 2001, 157, 151–164. [Google Scholar] [CrossRef]
- van Tussenbroek, B.I.; Barba Santos, M.G.; Van Dijk, J.K.; Sanabria Alcaraz, S.M.; Téllez Calderón, M.L. Selective elimination of rooted plants from a tropical seagrass bed in a back-reef lagoon: A hypothesis tested by hurricane Wilma (2005). J. Coast Res. 2008, 24, 278–281. [Google Scholar] [CrossRef]
- van Tussenbroek Brigitta, I.; Cortés, J.; Collin, R.; Fonseca, A.C.; Gayle, P.M.H.; Guzmán, H.M.; Jácome, G.E.; Juman, R.; Koltes, K.H.; Oxenford, H.A. Caribbean-wide, long-term study of seagrass beds reveals local variations, shifts in community structure and occasional collapse. PLoS ONE 2014, 9, e90600. [Google Scholar] [CrossRef] [Green Version]
- van Tussenbroek, B.I.; Hernández-Arana, H.A.; Rodríguez-Martínez, R.E.; Espinoza-Avalos, J.; Canizales-Flores, H.M.; Gon-zález-Godoy, C.E.; Barba-Santos, M.G.; Vega-Zepeda Collado-Vides, A.L. Severe impacts of brown tides caused by Sargassum spp. on near-shore Caribbean seagrass communities. Mar. Poll. Bull. 2017, 122, 272–281. [Google Scholar] [CrossRef] [PubMed]
- Ávila Mosqueda, S.V. Variabilidad Espacial en Comunidades de Pastos Marinos Asociada a Afluencias Masivas de Sargassum spp. Master’s Thesis, Universidad Nacional Autónoma de México, Mexico City, Mexico, 2021. Available online: http://132.248.9.195/ptd2021/mayo/0811636/In-65dex.html (accessed on 17 December 2021).
- Ladd, M.C.; Collado-Vides, L. Practical applications of monitoring results to improve managing for coral reef resilience: A case study in the Mexican Caribbean. Biodivers. Conserv. 2013, 22, 1591–1608. [Google Scholar] [CrossRef]
- Wang, C.; Enfield, D.B. The tropical Western Hemisphere warm pool. Geoph. Res. Lett. 2001, 28, 1635–1638. [Google Scholar] [CrossRef]
- Naomi, O. The Scientific Consensus on Climate Change: How do We Know We’re not Wrong? Springer International Publishing: Berlin/Heidelberg, Germany, 2018. [Google Scholar]
- Dakos, V.; Matthews, B.; Hendry, A.P.; Levine, J.; Loeuille, N.; Norberg, J.; Nosil, P.; Scheffer, M.; De Meester, L. Ecosystem tipping points in an evolving world. Nat. Ecol. Evol. 2019, 3, 355–362. [Google Scholar] [CrossRef] [Green Version]
- Tartaglione, C.A.; Smith, S.R.; O’Brien, J.J. ENSO impact on hurricane landfall probabilities for the Caribbean. J. Clim. 2003, 16, 2925–2931. [Google Scholar] [CrossRef]
- Islebe, G.; Sánchez, O. History of late holocene vegetation at quintana roo, caribbean coast of mexico. Plant Ecol. 2002, 670, 187–192. [Google Scholar] [CrossRef]
- Martínez, M.L.; Lithgow, D.; Vázquez, G.; García Franco, J.G. Diagnóstico de las necesidades y probabilidades de restauración en las dunas costeras de Quintana Roo. In Experiencias Mexicanas en la Restauración de los Ecosistemas; Chapter: 18. Eds Eliane Ceccon, Cristina Martínez; UNAM/CRIM/UAEM/CONABIO: México City, México, 2016; pp. 409–430. [Google Scholar]
- Ruíz-Rentería, F.; van Tussenbroek, B.I.; Jordan-Dahlgren, E. Puerto Morelos, Quintana Roo, Mexico. In Caricomp—Caribbean Coral Reef, Seagrass and Mangrove Sites; Kjerfve, B., Ed.; Unesco: Paris, France, 1998; pp. 57–66. [Google Scholar]
- 68. López-Mendoza, P.G.; Ruiz-Fernández, A.C.; Sanchez-Cabeza, J.A.; van Tussenbroek, B.I.; Cuellar-Martinez, T.; Pérez-Bernal, L.H. Temporal trends of organic carbon accumulation in seagrass meadows from the northern Mexican Caribbean. Catena 2020, 194, 104645. [Google Scholar] [CrossRef]
- Melo-Merino, S.M.; Lira-Noriega, A.; González-Barrios, F.J.; Reyes-Bonilla, H.; Alvarez-Filip, L. Functional divergence from ecological baselines on Caribbean coral reefs. Ecography 2022, 3, e05811. [Google Scholar] [CrossRef]
- Coral reefs coverage map of the Mexican Caribbean: Cabo Catoche – Xcalak. Available online: https://simar.conabio.gob.mx/arrecifesam/ (accessed on 28 June 2022).
- Caballero-Aragón, H.; Perera-Valderrama, S.; Cerdeira-Estrada, S.; Martell-Dubois, R.; Rosique-de la Cruz, L.; Alvarez-Filip, L.; Ressl, R. Puerto Morelos coral reefs, their current state and classification by a scoring system. Diversity 2020, 12, 272. [Google Scholar] [CrossRef]
- Caballero-Aragón, H.; Perera-Valderrama, S.; Cerdeira-Estrada, S.; Martell-Dubois, R.; Rosique-de la Cruz, L.; Á lvarez-Filip, L.; Pérez-Cervantes, E.; Estrada-Saldivar, N.; Ressl, R. Dataset of coral reefs monitoring, Puerto Morelos, Mexico. Data Brief. 2022, 42, 108253. [Google Scholar] [CrossRef] [PubMed]
- McField, M.; Kramer, P.; Giró Petersen, A.; Soto, M.; Drysdale, I.; Craig, N.; Rueda-Flores, M. Mesoamerican Reef Report Card. 2020. Available online: https://www.researchgate.net/publication/322603385_2018_Mesoamerican_Reef_Report_Card?channel=doi&linkId=5a6254b20f7e9b6b8fd64421&showFulltext=true (accessed on 15 March 2023).
- Roff, G.; Joseph, J.; Mumby, P. Multi-decadal changes in structural complexity following mass coral mortality on a Caribbean 701 reef. Bio-geosciences 2020, 17, 5909–5918. [Google Scholar]
- Weil, E. Coral reef diseases in the Wider Caribbean. In Coral Health and Disease; Rosenberg, E., Loya, Y., Eds.; Springer Science & Business Media: Berlin/Heidelberg, Germany, 2013. [Google Scholar]
- Antonius, A. The “band” diseases in coral reefs. In Proceedings of the 4th International Coral Reef Symposium, Manila, Philippines, 18–22 May 1981; pp. 7–14. [Google Scholar]
- Antonius, A. Coral diseases in the Indo-Pacific: A first record. Mar. Ecol. 1985, 6, 197–218. [Google Scholar] [CrossRef]
- Rutzler, K.; Santavy, D.; Antonius, A. The black band disease of Atlantic reef corals. III. Distribution, ecology and development. Mar. Ecol. 1983, 4, 329–358. [Google Scholar] [CrossRef]
- Edmunds, P.J. Extent and effect of black band disease on a Caribbean reef. Coral Reefs. 1991, 10, 161–165. [Google Scholar] [CrossRef]
- Carlton, R.G.; Richardson, L.L. Oxygen and sulfide dynamics in a horizontally migrating cyanobacterial mat: Black band disease of corals. FEMS Microbiol. Ecol. 1995, 18, 155–162. [Google Scholar] [CrossRef]
- Kuta, K.G.; Richardson, L.L. Abundance and distribution of black band disease on coral reefs in the northern Florida Keys. Coral Reefs 1996, 15, 219–223. [Google Scholar] [CrossRef]
- Kuta, K.G.; Richardson, L.L. Ecological aspects of black band disease of corals: Relationships between disease incidence and environmental factors. Coral Reefs 2002, 21, 393–398. [Google Scholar] [CrossRef]
- Richardson, L.L.; Kuta, K.G. Ecological physiology of the black band cyanobacterium Phormidium corallyticum. FEMS Microbiol. Ecol. 2003, 43, 287–298. [Google Scholar] [CrossRef]
- Myers, J.L.; Richardson, L.L.; Sekar, R. Molecular detection and ecological significance of the cyanobacteria Geitlerinema and Leptolyngbya in black band disease of corals. Appl. Environ. Microbiol. 2007, 73, 5173–5182. [Google Scholar] [CrossRef] [Green Version]
- Rasoulouniriana, D.; Siboni, N.; Ben-Dov, E.; Kramarsky-Winter, E.; Loya, Y.; Kushmaro, A. Pseudoscillatoria coralii gen. nov., sp. nov., a cyanobacterium associated with coral black band disease (BBD). Dis. Aquat. Org. 2009, 87, 91–96. [Google Scholar] [CrossRef] [PubMed]
- Kuehl, K.; Jones, R.; Gibbs, D.; Richardson, L.L. The roles of temperature and light in black band disease (BBD) progression on corals of the genus Diploria in Bermuda. J. Inv. Path. 2011, 106, 366–370. [Google Scholar] [CrossRef] [PubMed]
- Antonius, A. Kranke Korallenriff Zerstörung. Umsch. Wiss. Und Tech. 1976, 15, 493–494. [Google Scholar]
- Alker, A.P.; Smith, G.W.; Kim, K. Characterization of Aspergillus sydowii (Thom et Church), a fungal pathogen of Caribbean Sea fan corals. Hydrobiology 2001, 460, 105–111. [Google Scholar] [CrossRef]
- Ward, J.R.; Kim, K.; Harvell, C.D. Temperature affects coral disease resistance and pathogen growth. Mar. Ecol. Prog. Ser. 2007, 329, 115–121. [Google Scholar] [CrossRef] [Green Version]
- Marfenina, O.E.; Fomicheva, G.M.; Vasilenko, O.V.; Naumova, E.M.; Kulko, A.B. Sporulation in saprotrophic and clinical strains of Aspergillus sydowii (Bain. and Sart.) Thom and Church under various environmental conditions. Microbiology 2010, 79, 753–758. [Google Scholar] [CrossRef]
- Patterson, K.L.; Porter, J.W.; Ritchie, K.B.; Polson, S.W.; Mueller, E.; Peters, E.C.; Santavy, D.L.; Smith, G.L. The etiology of white pox disease, a lethal disease of the Caribbean elkhorn coral, Acropora palmata. Proc. Natl. Acad. Sci. USA 2002, 13, 8725–8730. [Google Scholar] [CrossRef]
- Looney, E.E.; Sutherland, K.P.; Lipp, E.K. Effects of temperature, nutrients, organic matter, and coral mucus on the survival of the coral pathogen Serracia marcescens PDL 100. Environ. Microbiol. 2010, 12, 2479–2485. [Google Scholar] [CrossRef]
- Riegl, B. Effects of the 1996 and 1998 positive sea- surface temperature anomalies on corals, coral diseases, and fish in the Arabian Gulf (Dubai, UAE). Mar. Biol. 2002, 140, 29–40. [Google Scholar]
- Harvell, C.D.; Altizer, S.; Cattadori, I.M.; Harrington, L.; Weil, E. Climate change and wildlife diseases: When does the host matter most? Ecology 2009, 90, 912–920. [Google Scholar] [CrossRef]
- Cervino, J.M.; Hayes, R.L.; Goreau, T.J.; Smith, G.W. Zooxanthellae regulation in yellow blotch/band and other coral diseases contrasted with temperature related bleaching: In situ destruction vs. expulsion. Symbiosis 2004, 37, 63–85. [Google Scholar]
- Gil-Agudela, D. Garzón-Ferreira.: Spatial and seasonal variation of dark spots disease in coral communities of the Santa Marta area (Columbian Caribbean). Bull. Mar. Sci. 2002, 69, 619–629. [Google Scholar]
- Borger, J.L.; Steiner, C.C. The spatial and temporal dynamics of coral disease in Dominica, West Indies. Bull. Mar. Sci. 2005, 77, 137–154. [Google Scholar]
- Porter, J.W.; Torres, C.; Sutherland, K.P.; Meyers, M.K.; Callahan, M.K.; Ruzicka, R.; Colella, M. Prevalence, severity, lethality, and recovery of dark spots syndrome among three Floridian reef building corals. J. Exp. Mar. Biol. Ecol. 2011, 408, 79–87. [Google Scholar] [CrossRef]
- Kushmaro, A.; Rosenberg, E.; Fine, M.; Ben-Haim, Y.; Loya, Y. Effect of temperature on bleaching of the coral Oculina patagonica by Vibrio AK-1. Mar. Ecol. Prog. Ser. 1998, 171, 131–137. [Google Scholar] [CrossRef] [Green Version]
- Toren, A.; Landau, L.; Loya, Y.; Rosenberg, E. Effect of temperature on adhesion of Vibrio strain AK-1 to Oculina patagonica and on coral bleaching. Appl. Environ. Microbiol. 1998, 64, 1379–1384. [Google Scholar] [CrossRef]
- Ben-Haim, Y.; Banim, E.; Kushmaro, A.; Loya, Y.; Rosenberg, E. Inhibition of photosynthesis and bleaching of zooxanthellae by the coral pathogen Vibrio shiloi. Environ. Microbiol. 1999, 1, 223–229. [Google Scholar] [CrossRef]
- Banin, E.; Israely, M.; Fine, Y.; Loya, Y.; Rosenberg, E. Role of endosymbiotic zooxanthellae and coral mucus in the adhesion of thecoral-bleaching pathogen Vibrio shiloi to its host. Appl. Environ. Microbiol. 2001, 199, 33–37. [Google Scholar]
- Israely, T.; Banin, E.; Rosenberg, E. Growth, differentiation and death of Vibrio shiloi in coral tissue as a function of seawater temperature. Aquat. Microb. Ecol. 2001, 24, 1–8. [Google Scholar] [CrossRef] [Green Version]
- Ben-Haim, Y.; Thompson, F.L.; Thompson, C.C.; Cnockaert, M.C.; Hoste, B.; Swings, J.; Rosenberg, E. Vibrio corallyticus sp. nov a temperature-dependent pathogen of the coral Pocillopora damicronis. Int. J. Syst. Evol. Microbiol. 2003, 53, 309–315. [Google Scholar] [CrossRef] [Green Version]
- Ben-Haim, Y.; Zicherman-Keren, M.; Rosenberg, E. Temperature- regulated bleaching and lysis of the coral Pocillopora damicornis by the novel pathogen Vibrio corallyticus. Appl. Environ. Microbiol. 2003, 69, 4236–4242. [Google Scholar] [CrossRef] [Green Version]
- Mills, E.; Shechtman, K.; Loya, Y.; Rosenberg, E. Bacteria appear to play important roles in both causing and preventing the bleaching of the coral Oculina patagonica. Mar. Ecol. Progress. 2013, 489, 155–162. [Google Scholar] [CrossRef] [Green Version]
- Higuchi, T.; Agostini, S.; Casareto, B.E.; Yoshinaga, K.; Suzuki, T.; Nakano, Y.; Fujimura, H.; Suzuki, Y. Bacterial enhancement of bleaching and physiological impacts on the coral Montipora digitata. J. Exp. Mar. Biol. Ecol. 2013, 440, 54–60. [Google Scholar] [CrossRef]
- Ilosvay Elías, X.E.; Contreras-Silva, A.I.; Alvarez-Filip, L.; Wild, C. Coral Reef Recovery in the Mexican Caribbean after 2005 Mass Coral Mortality—Potential Drivers. Diversity 2020, 12, 338. [Google Scholar] [CrossRef]
- Eakin, C.M.; Morgan, J.A.; Heron, S.F.; Smith, T.B.; Liu, G.; Alvarez-Filip, L.; Baca, B.; Bartels, E.; Bastidas, C.; Bouchon, C.; et al. Caribbean corals in crisis: Record thermal stress, bleaching, and mortality in 2005. PLoS ONE 2010, 5, e13969. [Google Scholar] [CrossRef] [Green Version]
- Palacios-Hernández, E.; Carrillo Salvador, L.; Meza Romero, I.; Ávalos Cueva, D. Variabilidad espacio temporal de la temperatura superficial del mar, en el mar caribe. Ra Ximhai 2017, 13, 243–265. [Google Scholar] [CrossRef]
- Lamb, J.B.; True, J.D.; Piromvaragorn, S.; Willis, B.L. Scuba diving damage and intensity of tourist activities increases coral disease prevalence. Biol. Conserv. 2014, 178, 88–96. [Google Scholar] [CrossRef]
Figure 1.
The Puerto Morelos coastal unit. The PNAPM ecosystems are shown. Red: Mangroves. Green: Seagrass meadows. Purple: Coral reef. Data from [21].
Figure 1.
The Puerto Morelos coastal unit. The PNAPM ecosystems are shown. Red: Mangroves. Green: Seagrass meadows. Purple: Coral reef. Data from [21].
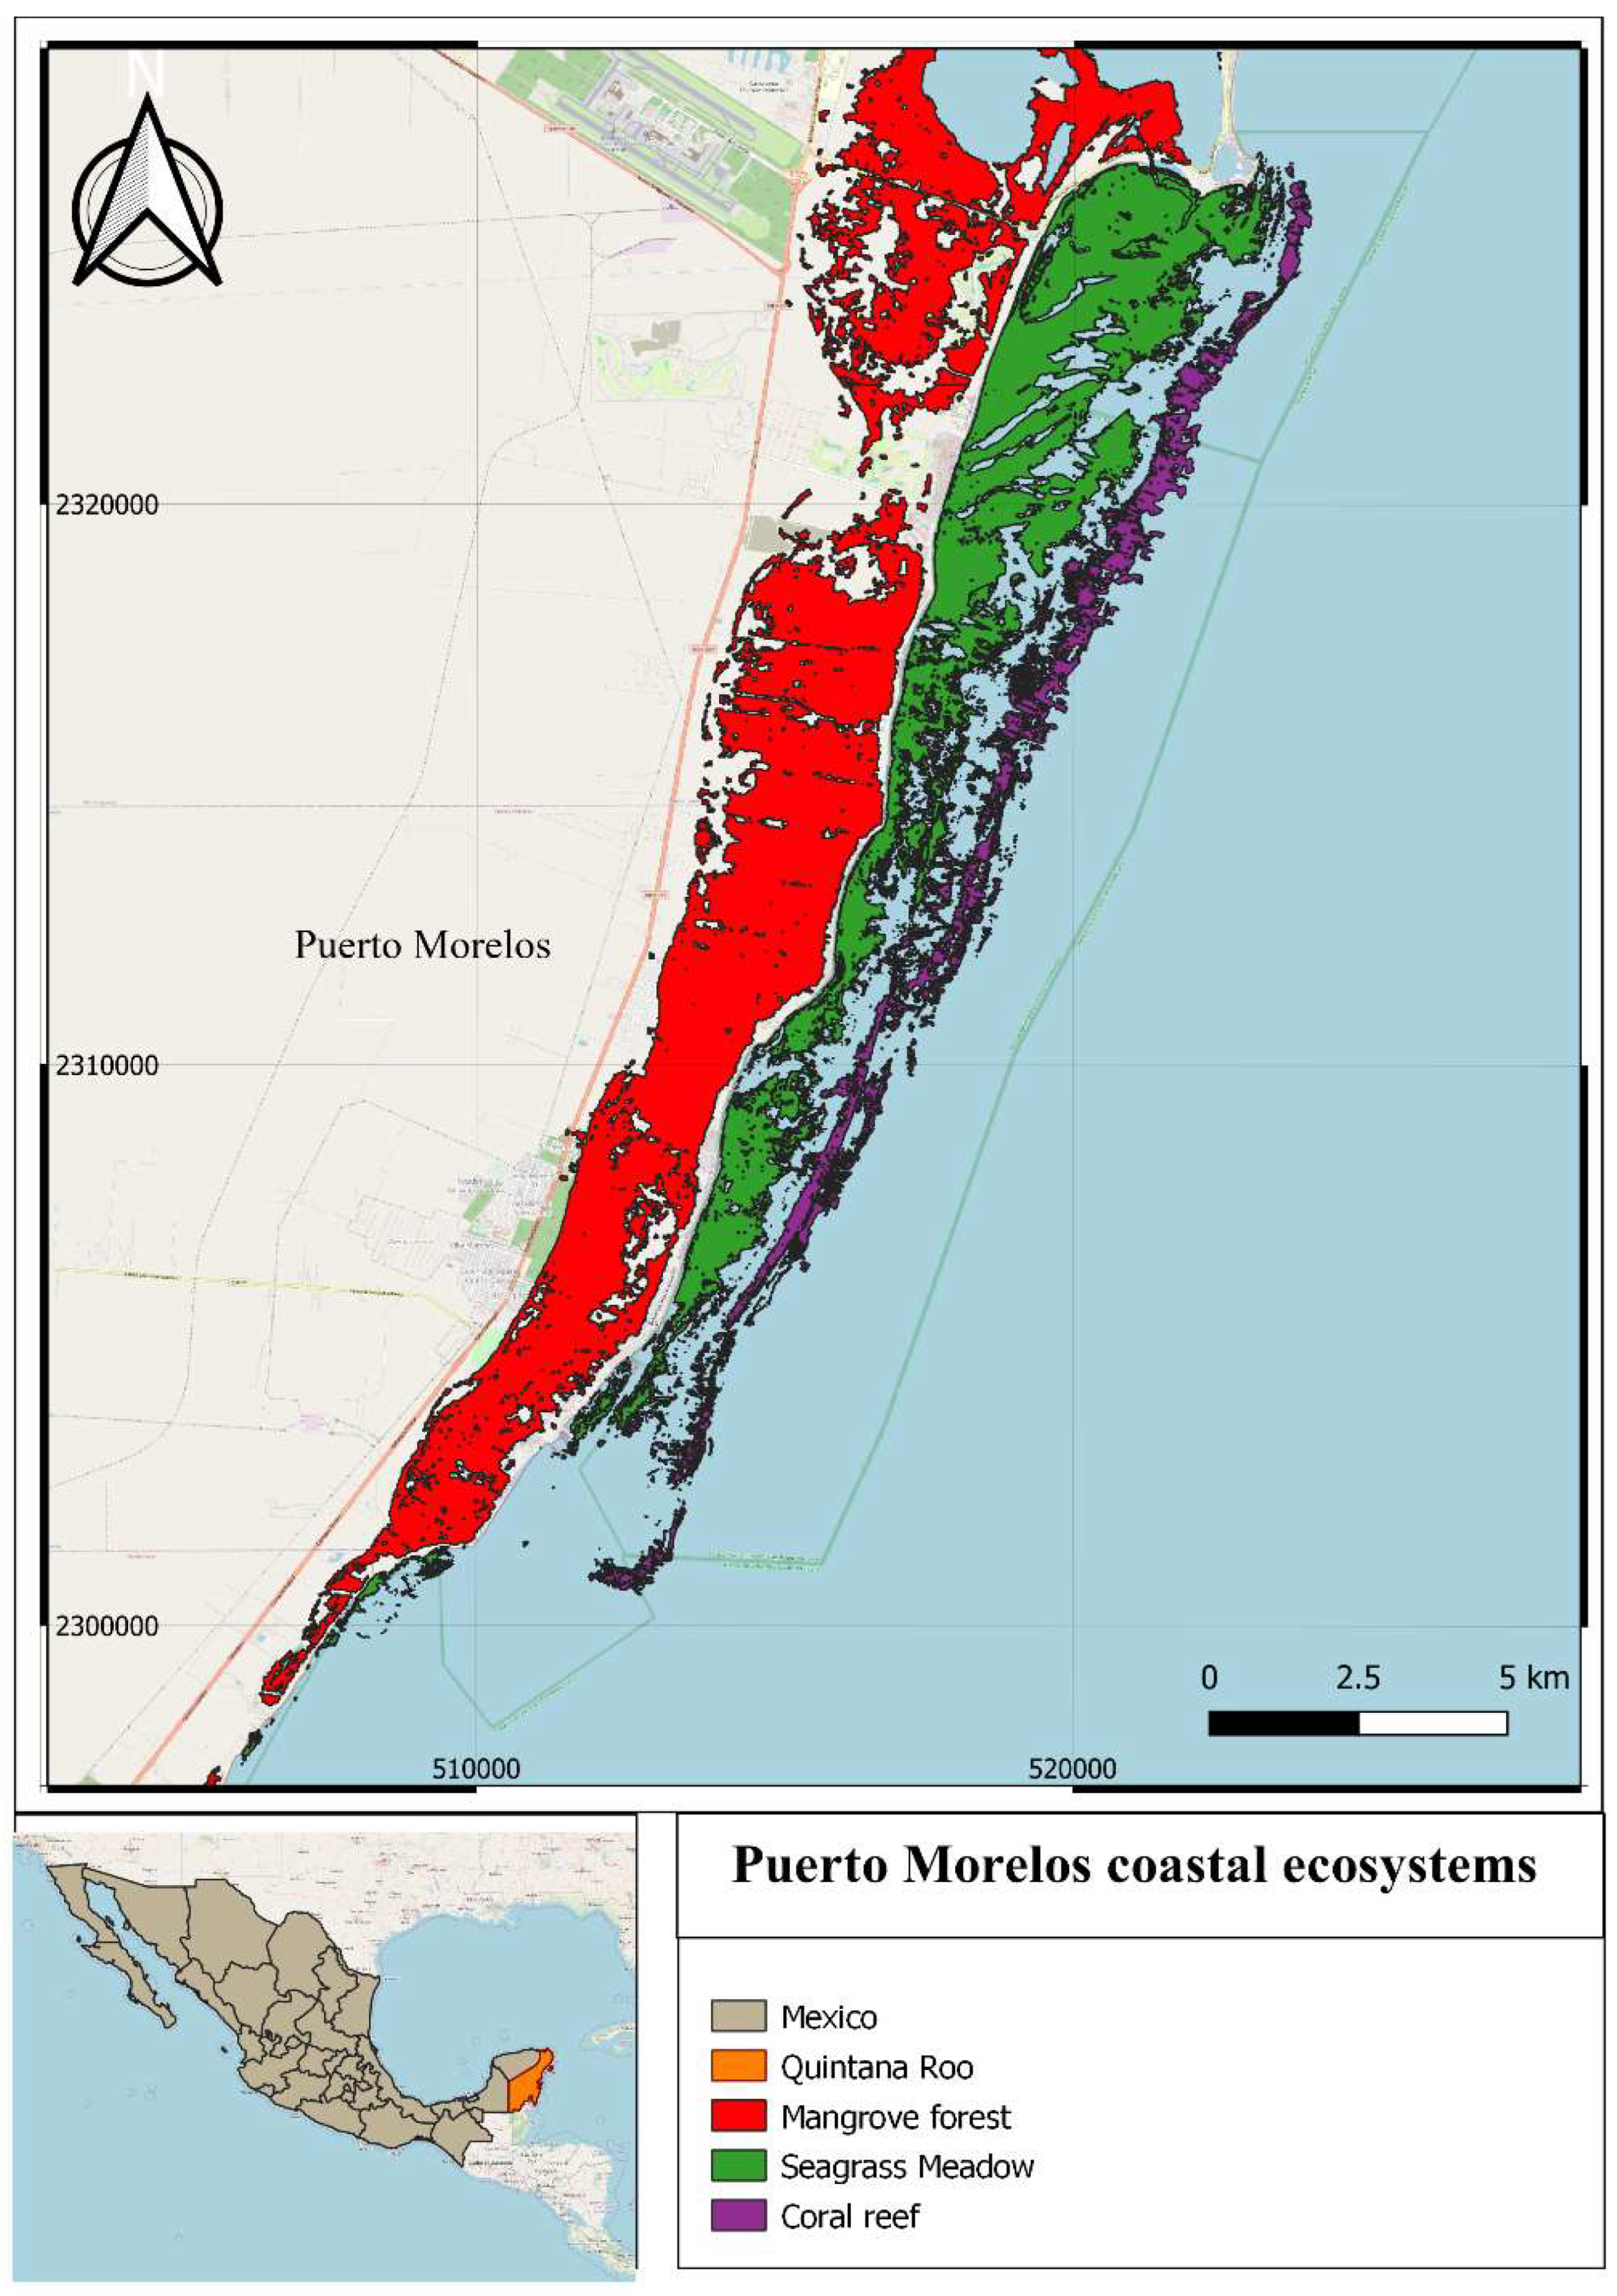
Figure 2.
SLA determined with ERA5 at Puerto Morelos (a) annual SLA from 1993–2020, the blue line corresponds to the trend, (b) monthly SLA for the same period, and (c) mode values in summer and winter months. Each dot corresponds to the yearly mode value for that season. In the boxplots, the central line is the median value, the bottom and top lines of the box represent the 25th and 75th percentiles, and points indicate the outliers.


Figure 3.
SST for Puerto Morelos (a) annual 1980–2020, data from ERA5, the blue line corresponds to the trend, (b) monthly for the same period, data from ERA5, (c) annual 2002–2020, data from SAMMO, (d) monthly for the same period, data from SAMMO. In the boxplot, the central line is the median value, the bottom and top lines of the box represent the 25th and 75th percentiles, and points indicate the outliers.


Figure 4.
STT mode values in summer and winter months. Each dot corresponds to the yearly mode value for that season.
Figure 4.
STT mode values in summer and winter months. Each dot corresponds to the yearly mode value for that season.

Figure 5.
Atmospheric Pressure (AP) determined with ERA5 for Puerto Morelos (a) annual 1980–2020, the blue line corresponds to the trend, (b) monthly AP for the same period, and (c) mode values in summer and winter months. Each dot corresponds to a single mode value per year. In the boxplots, the central line is the median value, the bottom and top lines of the box represent the 25th and 75th percentiles, and points indicate the outliers.

Figure 6.
Wind roses for Puerto Morelos, determined with ERA5 data. (a) Yearly wind direction. (b) winter and (c) summer of the wind directions.
Figure 6.
Wind roses for Puerto Morelos, determined with ERA5 data. (a) Yearly wind direction. (b) winter and (c) summer of the wind directions.

Figure 7.
Wind waves for Puerto Morelos, determined with ERA5: (a) annual 1979–2019, blue line corresponds to the trend and (b) monthly, for the same period. In the boxplot, the central line is the median value, and the bottom and top lines of the box represent the 25th and 75th percentile points, indicating the outliers.

Figure 8.
Peak wave period for Puerto Morelos, determined with ERA5: (a) annual 1979–2019, blue line corresponds to the trend and (b) monthly, for the same period. In the boxplot, the central line is the median value, and the bottom and top lines of the box represent the 25th and 75th percentile points, indicating the outliers.

Figure 9.
Wave roses for Puerto Morelos, determined with ERA5 data. (a) yearly wave direction, (b) winter, and (c) summer wave directions.
Figure 9.
Wave roses for Puerto Morelos, determined with ERA5 data. (a) yearly wave direction, (b) winter, and (c) summer wave directions.

Figure 10.
Precipitation for Puerto Morelos, determined with SAMMO data (a) monthly 1992–2021 and (b) mode values in summer and winter months. Each dot corresponds to a single mode value per year. In boxplot, the central line is the median value, and the bottom and top lines of the box represent the 25th and 75th percentile points, indicating the outliers.

Table 1.
Description of data series used in this study. Sea Surface Temperature (SST), Atmospheric Pressure (AP), and Sea Level Anomalies (SLA). SAMMO: Academic Service of Meteorological and Oceanographic Monitoring-Universidad Nacional Autónoma de México (UNAM). ERA5: ECMWF Reanalysis v5 of the European Space Agency.
| Data Source | Instrument | Parameter | Initial Year | Final Year | Frequency |
|---|---|---|---|---|---|
| SAMMO | HOBO (1 m) | SST | 2002 | 2020 | 24 h |
| Pluviometer (mm) | Precipitation | 1992 | 2021 | Monthly | |
| ERA 5 | Reanalysis | SST, AP | 1980 | 2020 | 24 h |
| Wind and waves | 1979 | 2019 | 24 h | ||
| SLA | 1993 | 2020 | 24 h |
Table 2.
Box plot statistics for Sea Level Anomalies (SLA), Sea Surface Temperature (SST), Atmospheric Pressure (AP), Precipitation (PP), and waves.
Table 2.
Box plot statistics for Sea Level Anomalies (SLA), Sea Surface Temperature (SST), Atmospheric Pressure (AP), Precipitation (PP), and waves.
| SLA (mm) | SST (°C) | AP (Pa) | PP (mm) | Waves | |||
|---|---|---|---|---|---|---|---|
|
Tp (s) |
Hs (m) | ||||||
| Data Source | ERA5 | SAMMO | ERA5 | ERA5 | SAMMO | ERA5 | |
| Period | 1993–2020 | 2002–2020 | 1980–2020 | 1980–2020 | 1992–2021 | 2019–2020 | 2019–2020 |
| Min | −206.5 | 19.6 | 25.04 | 96,841 | 0.00 | 2.62 | 0.00 |
| 1st Q | −23.1 | 26.73 | 26.98 | 101,287 | 24.18 | 5.90 | 0.24 |
| Median | 31.9 | 28.13 | 28.05 | 101,471 | 58.65 | 6.79 | 0.47 |
| Mean | 31.82 | 28.05 | 28 | 101,474 | 87.62 | 6.87 | 0.58 |
| 3rd Q | 80.8 | 29.3 | 28.99 | 101,658 | 123.85 | 7.93 | 0.79 |
| Max | 282.2 | 34.03 | 30.85 | 103,040 | 462.70 | 16.59 | 11.23 |
Table 3.
Summary of preservation state of the coastal ecosystems of Puerto Morelos and identified drivers and disturbances that induce longer-term (lasting > 1 year) changes in these ecosystems. At a global level, the (geophysical) drivers are influenced by climate change. State of preservation: green (good), yellow (fair), and red (poor).
| Identified Drivers/Disturbances | ||||
|---|---|---|---|---|
| Ecosystem (State) | Observed Changes | Local Level | Regional Level | Global Level |
Mangroves | Total 1996 ha; conservation state of 40% good, 36% fair, and 24% poor [37]. | Wastewater discharge, urbanization | Hurricanes | |
Dunes | Reduction from 92 ha in 2011 to 79 ha in 2017 [38]. | Urbanization | Hurricanes | |
Beach | More or less stable until 2004, severe erosion since 2015 [39]. | Urbanization | Hurricanes, Sargasso influx | |
| Seagrass meadows | Total 1622 [40] ha Gradual decline in overall condition [41]. Since 2015, loss of near-coastal meadows [42]. | Wastewater discharge | Hurricanes, Sargasso influx | |
| Coral reefs | Increasing algal cover [43], coral bleaching and diseases affecting stony corals [44]. | Aquatic activities, wastewater discharge | Hurricanes, Sargasso influx | Increasing SST, acidification |
Disclaimer/Publisher’s Note: The statements, opinions and data contained in all publications are solely those of the individual author(s) and contributor(s) and not of MDPI and/or the editor(s). MDPI and/or the editor(s) disclaim responsibility for any injury to people or property resulting from any ideas, methods, instructions or products referred to in the content. |
© 2023 by the authors. Licensee MDPI, Basel, Switzerland. This article is an open access article distributed under the terms and conditions of the Creative Commons Attribution (CC BY) license (https://creativecommons.org/licenses/by/4.0/).
Share and Cite
MDPI and ACS Style
Guzmán, O.; Mendoza, E.; van Tussenbroek, B.I.; Silva, R. Effects of Climate-Change-Related Phenomena on Coastal Ecosystems in the Mexican Caribbean. Sustainability 2023, 15, 12042. https://doi.org/10.3390/su151512042
AMA Style
Guzmán O, Mendoza E, van Tussenbroek BI, Silva R. Effects of Climate-Change-Related Phenomena on Coastal Ecosystems in the Mexican Caribbean. Sustainability. 2023; 15(15):12042. https://doi.org/10.3390/su151512042
Chicago/Turabian StyleGuzmán, Odette, Edgar Mendoza, Brigitta I. van Tussenbroek, and Rodolfo Silva. 2023. "Effects of Climate-Change-Related Phenomena on Coastal Ecosystems in the Mexican Caribbean" Sustainability 15, no. 15: 12042. https://doi.org/10.3390/su151512042
Note that from the first issue of 2016, this journal uses article numbers instead of page numbers. See further details here.