1. Introduction
The presence of indoor air pollution within enclosed environments poses a significant concern due to its potential to cause severe health issues. Indoor pollution is responsible for the death of approximately 3.2 million people each year, according to the estimation made by World Health Organization in 2020 [
1]. This issue is even more important when considering that people spend most of their time indoors (87%), with only a small percentage of their time spent in vehicles (6%) or outdoors (7%) [
2]. Furthermore, in most cases, indoor air contaminants level are typically 2–5% higher than outdoor pollutants [
3].
Providing students with a safe and healthy learning environment is an important factor that has received considerable attention in recent years. Indoor air quality (IAQ) in educational buildings, such as high occupancy environments where younger generations spend most of their time, plays a pivotal role in creating an optimal and safe learning environment for students. With the potential to impact the health, productivity, learning ability, and overall well-being of occupants [
4], ensuring high IAQ in educational facilities is an essential step toward creating a healthier and more productive environment for educational institutions.
Several studies have been conducted on assessing and enhancing the IAQ in educational buildings, mostly focusing on schools. The most common indoor pollutants that have been studied are NO2, particulate matter (mostly PM2.5 and PM10), and formaldehyde (HCHO). Furthermore, the importance of evaluating the IAQ after employing retrofitting strategies has been researched in numerous studies.
CONTAM has been tested and validated in numerous studies as a practical tool to assess the IAQ in built environments, as well as to analyze building airflow rates and ventilation. This software is developed by the National Institute of Standards and Technology (NIST) and is capable of coupling with EnergyPlus in order to perform a co-simulation and exchange simulation data such as temperatures, airflow rates, and schedules. While a single zone in CONTAM can be modeled as computational fluid dynamics (CFD), the remaining zones should be assumed well-mixed. Therefore, a more efficient approach for multi-zonal modeling would be to consider all zones as well-mixed, as this approach reduces simulation and computation time [
5,
6,
7,
8].
CONTAM is preferred over other IAQ modeling tools due to its established reputation as a reliable and widely-used IAQ modeling software, user-friendly interface, and specialized focus on contaminant transport in multi-zone environments. It offers the advantage of active community support, extensive documentation, and compatibility with other tools and databases, such as EnergyPlus and TRNSYS. Researchers find CONTAM reliable and accessible for simulating complex indoor environments and understanding pollutant dispersion, making it a popular choice for IAQ assessments [
9,
10,
11,
12,
13].
Sung et al. [
14] researched the IAQ of three school classrooms that were 10, 20, and 80 years old, respectively. The study involved both real measurements and simulation using CONTAM, with a focus on PM
2.5 as the primary contaminant. They also measured indoor CO
2 concentrations. In this study, the researchers examined the effects of various refurbishment measures on IAQ, such as replacing windows and doors and increasing wall airtightness along with implementing mechanical and natural ventilation and filtration. In another study focusing on the nursery, primary, and secondary schools in London, CONTAM was utilized to investigate the impact of energy efficiency measures on the IAQ along with the air penetration rates in the buildings [
15].
A number of researchers have also employed CONTAM in IAQ analysis studies of different types of built environments. Shrestha et al. [
16] and Yan et al. [
13] conducted a multi-zonal study with CONTAM within office buildings assuming all zones as well-mixed. The researchers compared different strategies aimed at reducing the risk of SARS-CoV-2 infection and identified the most effective methods for controlling the contaminants’ dispersion. Another study was conducted on an office building in Trondheim, Norway, focusing on the PM
2.5 pollution of the building by utilizing the CONTAM and EnergyPlus co-simulation [
17]. Additionally, Budaiwi and Mohammed [
18] employed CONTAM to assess energy efficiency techniques in a mosque and an auditorium while ensuring acceptable IAQ levels. The study examined CO
2 and formaldehyde (HCHO) as pollutants to evaluate IAQ.
Mannan and Al-Ghamdi [
19] conducted a comprehensive review of worldwide IAQ studies. They identified common indoor pollutants, their sources, and their health impacts, discussing IAQ standards and regulations in various countries. The review categorized studies into residential and commercial buildings, including educational buildings and offices. The authors highlighted gaps in IAQ research, stressing the need for detailed studies on indoor contaminant sources and building materials. They emphasized the importance of adhering to standardized regulations in future research.
There are a minority of studies focused on IAQ of higher educational buildings. Among these, Lama, Fu, and Lee [
20] carried out a study in the UK to evaluate the IAQ of a higher education building. The study involved monitoring CO
2 levels, temperature, and humidity, as well as conducting questionnaire surveys. Their findings showed that the IAQ in large and crowded rooms was of poor quality, and they suggested several possible factors that could contribute to this issue.
Another study conducted in Egypt by Ismaeel, Alamoudy, and Sameh [
21] discussed the impact of a university building renovation on IAQ. The study concluded that renovation practices were responsible for poor IAQ in the building leading to several health problems, such as the escalation of sick building syndromes (SBS). Furthermore, Argunhan and Avci [
22] evaluated the IAQ in the classrooms of a university building in Turkey, considering radon, PM
0.5, PM
1.0, PM
2.5, PM
5.0, and PM
10 as the indoor pollutions along with the CO
2 temperature and humidity as the other parameters of IAQ. They compared their measurements with the standards developed in various countries to assess the IAQ.
In the present study, a multi-zonal analysis of the IAQ in a higher educational building in the UK, the London College, has been conducted to first investigate the current condition of IAQ in terms of airborne contaminants’ levels considering both indoor and outdoor sources, including NO2, SARS-CoV-2, and PM2.5 as well as the CO2 as the indicator of building’s ventilation performance. Then, possible methods of mitigating the pollution and enhancing the IAQ have been examined.
NO2 and PM2.5 are among the most prevalent indoor pollutants, and various studies have investigated their concentration and impact on the IAQ. Moreover, IAQ is often assessed using CO2 levels, which can indicate how well a space is ventilated. In other words, high CO2 concentration suggests inadequate ventilation and has detrimental effects on human health. Additionally, PM2.5 refers to particulate matter that has a diameter of 2.5 μm or smaller, which can cause respiratory problems and other health complications. Monitoring PM2.5 levels is crucial to assess and mitigate the risks associated with airborne particulate matter.
Furthermore, NO
2 is one of the major contaminants emitted from cars and other combustion vehicles, which is responsible for many respiratory and vascular diseases [
23]. Moreover, SARS-CoV-2, a highly infectious virus that is responsible for causing the COVID-19 disease, is selected as the biological contaminant in the building, and its dispersion and mitigation methods will be investigated.
The strategies that are considered in mitigating the contaminants include increasing the ventilation rate, the installation of background ventilation and air cleaners, and opening doors where the windows are fixed. In fact, the effectiveness of various methods that can be applied and installed either individually or combined in the building are studied, providing valuable insights for the building’s owners to make informed decisions in improving the IAQ of their property.
2. Materials and Methods
2.1. Case Introduction
A higher educational building, the London College, located in the west of London with a total floor area of 2500 m2, is simulated using CONTAM to analyze the pollutants’ concentration and dispersion within each zone as well as their penetration from the outdoor environment.
The London College (see
Figure 1) is a three-level building located in Greater London. The floor heights of the building on each level differ, with the ground and first floors measuring 3.6 m and the second floor measuring 3.15 m, including the plenums. The plant room is located above the second floor, where an air handling unit (AHU) operates with 100% outdoor air providing ventilation to the entire building. Each room is equipped with supply and return diffusers. The building maintains a total ventilation rate of 10,000 m
3/h, which remains active all the time.
Due to its proximity to Heathrow Airport, the building has been designed to mitigate noise pollution. As a result, all the windows in the building are fixed and cannot be opened, thereby eliminating the possibility of natural ventilation through the windows. However, to compensate for the fixed windows, the impact of installing background ventilation and opening the doors, as non-mechanical ventilation methods, on the IAQ are analyzed in the model.
The larger classrooms in the building accommodate a maximum of 40 occupants, with at least two classes scheduled each day. On the other hand, the smaller classrooms are occupied once a week, hosting an average of 20 occupants per class. The laboratories, on average, are occupied by 15 people once a week. In addition to the classrooms and laboratories, the building mainly encompasses a library, a kitchen, a café, a lounge, a server room, as well as several staff rooms. The building is closed on Sundays and is active for the rest of the week.
2.2. Simulation Approach in CONTAM
Various indoor and outdoor contaminants can be defined in CONTAM with flexible schedules and generation rates. By conducting a comprehensive simulation of the entire building in CONTAM, the airflow patterns between different floors and walls, as well as the movement of contaminants through cracks, ducts, and leakages, can be analyzed.
The IAQ modeling in CONTAM is based on a combination of a multi-zone airflow model and mass balance equations. The key component of the modeling approach utilized in this paper is presented as follows [
12]:
Multi-zone model: CONTAM uses a multi-zone modeling approach, where the indoor space can be divided into several interconnected zones. Each zone can have different boundary conditions, such as temperature, ventilation rates, and contaminant sources;
Airflow network: This model uses an airflow network representation, which includes building components such as rooms, doors, windows, and ventilation systems. Airflow within building systems, including infiltration, exfiltration, and movement between rooms and floors, is influenced by several factors, such as pressure difference, mechanical mechanisms, external wind pressures on the building, and buoyancy effects resulting from temperature variations between indoor and outdoor air;
Mass balance equations: The core of CONTAM’s modeling approach relies on mass balance equations, which track the transport and mixing of air and contaminants between different zones and the outdoor environment. These sets of equations can be further categorized to address the contaminant and airflow analysis in the model;
In this regard, the CONTAM model utilizes Equation (1) as the basis for contaminant dispersal analysis, which is derived from the conservation of mass for all species in a control volume. In Equation (1),
is the rate of air mass flow from control volume i to j.
is removal coefficient,
is species generation rate,
is the filter coefficient in the path,
is the kinetic reaction coefficient between species α and β, and
is the concentration of contaminant α in control volume i.
In addition, the infiltration and exfiltration flow rates (Q) through the leakages are calculated in CONTAM using the power law Equation (2), where
is flow discharge coefficient,
is leakage area,
is the air density,
is the reference pressure difference,
is the indoor-outdoor pressure difference, and n is the flow exponent. More details regarding the theoretical background of the CONTAM model can be found in [
12].
The previous study by the authors [
24] provides a comprehensive description of the simulation process and the modeling methodology employed in the CONTAM.
2.3. Assumptions and Analysis Method
2.3.1. Building Model
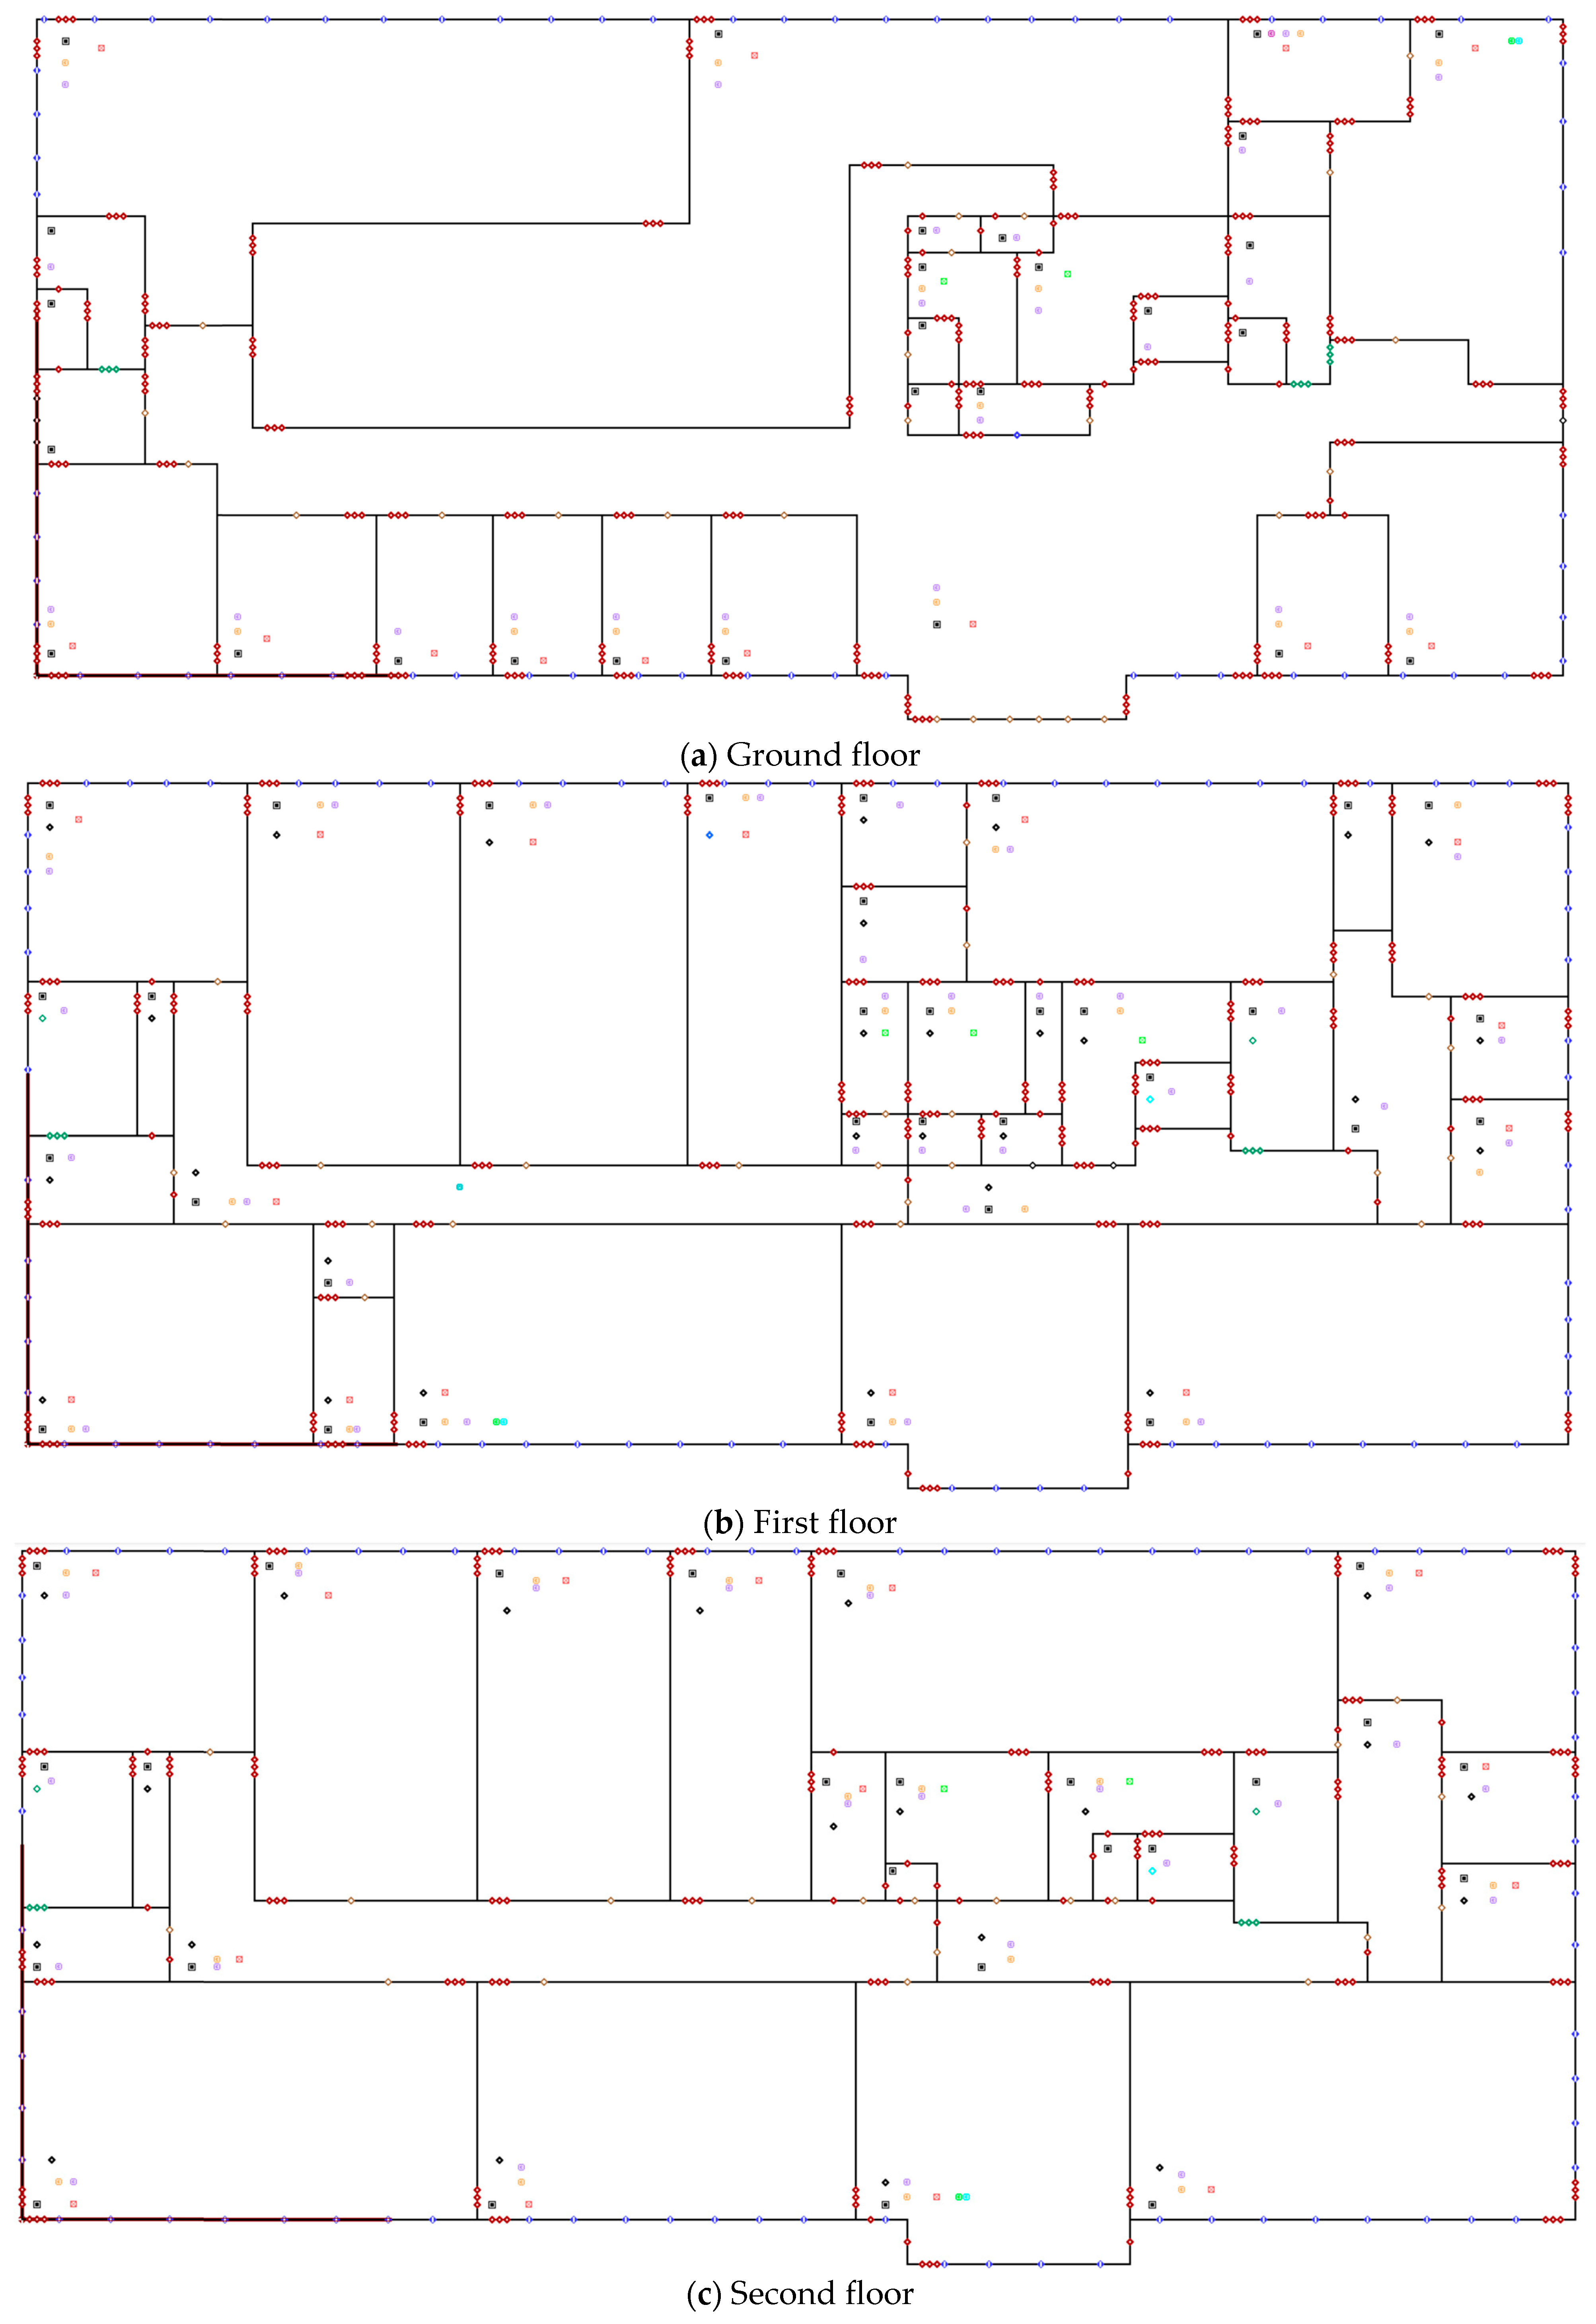
The building has been modeled in CONTAM, as shown in
Figure 2, which displays the three-story building model. Plenums are considered separate floors with the same plan. In this model, interior and exterior wall and floor leakages are defined to calculate the airflow between the outdoor area and different zones and floors. Wall leakages are defined in three elevations to capture the stack effect [
10].
Additionally, an air handling unit (AHU) with supply and return diffusers is incorporated in the ventilated zones. In the kitchen and bathrooms, exhaust fans are considered to provide more ventilation and create a negative pressure in order to prevent odor and contaminants from dispersion to the other zones.
The simulation time step is set to 3 min. All the zones are considered as well-mixed. Consequently, the concentration of contaminants, temperature, and airflows remains constant in the whole zone. Furthermore, London Test Reference Year (TRY) weather data from the Chartered Institution of Building Services Engineers (CIBSE) is used in the simulation.
2.3.2. Contaminants
This study assumes a lack of indoor sources of NO2 to solely study the impact of outdoor pollution on the indoor environment.
As the source of CO
2 is occupant exhalation, the CO
2 source is created within all of the occupied zones, which represents the presence of people. The outdoor CO
2 concentration and also its initial level in all zones are assumed to be 400 ppm. CO
2 generation rate depends on several factors, including activity level, gender, age, etc. In this study, an average amount of CO
2 generation rate based on the activity level of people in different zones is considered [
25].
Furthermore, cooking activities in the kitchen are considered an indoor source of PM2.5. Another major indoor source of PM2.5 is smoking, which is not allowed in this building and therefore is not considered. The café, where the served food is prepared in the kitchen, operates from 9:00 to 17:00 on workdays and Saturdays.
The kitchen is scheduled for cooking twice a day (every day except for Sundays), with each session lasting for half an hour. The first cooking session begins at 7:30, followed by the second session at 11:00. There is a door between the kitchen and the café, which is always open. A large commercial extraction hood is active in the kitchen during cooking time. The hood has been modeled in CONTAM by assuming an 80% capturing efficiency [
26] and reducing the PM
2.5 emission rate based on the method used in a previous study [
27].
Table 1 presents an overview of the assumptions and input parameters for defining CO
2 and contaminants in CONTAM.
The outdoor PM2.5 source represents outdoor vehicles from nearby roads and other outdoor sources. To obtain outdoor PM2.5 concentration data, the study utilizes information from Air Quality in England (AQE). AQE collects measured data from air quality monitoring stations located in London and other regions of England.
To ensure accuracy, a station near the case study area has been specifically selected as the source of this data. Furthermore, the same source [
28] has been used to obtain the outdoor level of NO
2.
Figure 3 illustrates the amount of ambient PM
2.5 and NO
2 throughout 2022, as provided by AQE [
28]. The ambient pollutants are associated with the model by defining a .CTM file in CONTAM. The penetration factor through the walls is assumed to be 1.0 [
29].
In order to model the SARS-CoV-2 virus, data from previous studies were utilized. These studies provided information on the generation rate, assumed to be 65 quanta/h [
13,
30], as well as the deposition and deactivation rates, which are 0.24 h
−1 [
31] and 0.63 h
−1 [
32], respectively.
It is also assumed that a student is the source of the virus spread. The source presents in three zones: a classroom on the first floor from 11:00 to 12:00, then goes to the cafe on the ground floor and stays there from 12:00 to 13:00, and finally moves to the electronic lab on the second floor and presents there from 13:00 to 14:00.
In order to assess the risk of SARS-CoV-2 infection, the probability of infection and basic reproductive number (R
0) is calculated. These terms have been previously [
13,
31,
33] utilized for the same purpose and are defined as hereunder:
where
is the expected number of infections, and I is the number of infectors. When the R
0 is below 1, it indicates that the virus cannot be transmitted to other occupants. Reducing the basic reproductive number (R
0) indicates a decrease in the transmission risk within a particular population. To assess the infection risk among occupants, the study employs the Wells
–Riley equation [
11,
13], which has been widely used in previous research.
where
is the probability (or risk) of infection,
is the infection cases,
is the number of susceptibles, I is the number of infectious sources (infectors), p is the pulmonary ventilation rate of a person (breathing rate) per hour, q is the quanta generation rate per hour, t is the exposure time to the certain microorganism (in hours), Q is the room ventilation rate, and
is the number of quanta that have been inhaled. In Equation (5),
is the mask inhale efficiency,
is the percentage of mask-wearing, and C is the quanta’s concentration (quanta/m
3). In this study, considering a light activity (whispering and speaking) level for occupants, p is assumed to be 0.75 m
3/h [
34].
2.4. Model Validation
In order to validate the CONTAM model, CO2 concentration has been measured in two selected zones (classroom and office) to be further compared with the simulation results. To perform the measurements, two sets of NDIR CO2 sensors were used: the Temtop M2000 2nd data logger was employed for the office, while the Netatmo weather station was used for the classroom. For consistent data collection, the sensors were installed at a height of approximately 1.2 m from the floor and kept at a minimum distance of 1.5 m from any openings (such as doors) and occupants. Data were collected at 15 min intervals throughout the week.
During the monitoring period, the office was occupied from Monday (15 May) to Friday (19 May) with a maximum of 6 occupants. The doors in the office were mostly open during working hours. Furthermore, the classroom was occupied 4 times a week (15, 16, 18, 20 May).
The comparison of the simulation results and measurements is illustrated in
Figure 4. It can be observed from
Figure 4 that the pattern of measured CO
2 concentration in both zones aligns with the simulated results of the model. Moreover, two sets of statistical metrics have been calculated for both measured and simulated data.
Firstly, the correlation coefficient was computed to assess the strength of the linear relationship between the measured and simulated values. The correlation coefficient ranges from −1 to +1, where a value of +1 indicates a perfect linear relationship, and values closer to 0 indicate a weaker correlation. Secondly, the mean relative error (MRE) was utilized to evaluate the accuracy of the simulated results in the model by comparing the average relative deviation between the simulated and measured values.
The statistical analysis results indicate that in the classroom, the correlation coefficient between the measured and simulated values is 0.885, while the MRE is 13%. In the office, the correlation coefficient is 0.78, and the MRE is 9.7%. These values are considered acceptable when compared to findings from other research and guidelines [
35,
36]. However, it is worth noting that the model could still contain some errors attributed to unforeseeable occupant activities.
3. Results
In the simulation, first, the impact of existing ventilation and the condition of the building on the pollution concentration is investigated. Subsequently, various strategies are implemented in the simulation to explore alternative solutions for improving the IAQ, and their effectiveness is compared. To provide a detailed analysis, the results are presented over a short period of one year, specifically from 6 February to 11 February, including weekdays (Monday to Saturday) while excluding Sundays when the building is unoccupied. As the college is closed on Sundays, there are not any active sources of CO2 and PM2.5, and the IAQ is already at an acceptable level. Therefore, there is no need to apply any mitigation strategy.
3.1. Gaseous Pollutant and CO2
The AHU in the building, which operates by bringing in 100% outdoor air, could be beneficial in enhancing the IAQ only if the outdoor air is clean. Otherwise, this ventilation approach is a path to introduce outdoor pollutants inside the building. This study aims to examine this fact by comparing the indoor NO2 concentration under different cases. For the sake of comparison, in a hypothetical scenario, it is considered that AHU operates with no outdoor air, and only recirculated air moves through the ducts. Additionally, another case is considered where the AHU is completely turned off throughout the entire building.
It is worth mentioning that outdoor pollutants infiltrate the building through the walls, floors, and roof gaps and leakages. Therefore, the level of air tightness in these areas plays a significant role in this process.
Figure 5 illustrates a comparison of the NO
2 concentration in an office room under three different cases: inactive ventilation, ventilation without any outdoor air (0% OA), and ventilation with 100% OA.
When the AHU is inactive, outdoor pollutants only enter through the leakages, resulting in the lowest indoor levels. However, the operation of the ventilation system, even without outdoor air, circulates the pollutants between different zones leading to higher concentrations compared to the inactive system. The indoor and ambient NO2 concentrations are most closely aligned when the AHU is active and supplies 100% OA to the zones. This situation exacerbates the penetration of contaminants through the walls and surfaces.
According to the World Health Organization (WHO), the NO
2 level should not exceed 200 µg/m
3 in one hour of exposure, and the average annual concentration should be below 40 µg/m
3 [
23]. As per
Figure 3, the NO
2 level never reaches 200 µg/m
3, and the average amount of NO
2 is 36 µg/m
3. Therefore, indoor NO
2 levels are already at a safe level, and no further action is required. However, if the ambient air contains high and unsafe levels of pollution, installing filters in the room or in the supply diffusers of AHU is a viable approach to decrease the indoor pollutants concentration. This measure prevents outdoor pollutants from infiltrating indoors, effectively decreasing their presence inside the building.
Assuming a constant outdoor CO
2 level of 400 ppm, incorporating 100% OA in ventilation is a positive step in diluting indoor CO
2. This is shown in
Figure 6, which presents the CO
2 concentration in three selected zones with different occupancy schedules: a ground-floor office with up to six occupants, a first-floor classroom occupied four times a week with up to 30 occupants, and a second-floor laboratory fully occupied on Saturdays with up to 18 people and staff-only on other days.
Figure 7 depicts the occupancy schedule of the zones that have been used in presenting the CO
2 level results. The schedules are based on the actual occupancy plan of the building. The goal is to decrease the CO
2 in these zones, which represents the enhancement of the IAQ in the whole building.
Figure 6 shows that without ventilation and 0% OA, CO
2 levels significantly exceed the 1000 ppm safety limit [
37], emphasizing the importance of ventilation. Even with the AHU set to 100% OA with varying ventilation rates, crowded rooms, such as classrooms and laboratories, still have CO
2 concentrations above safe levels, indicating the necessity for further action to achieve acceptable indoor air quality.
In order to solve this issue, two strategies are considered to be added to the model with increased ventilation rate (16,000 m
3/h): 1—installing background ventilation, including trickle vents in windows and air brick vents in external walls, which allows in and out airflows between the zones and ambient environment (see
Figure 8). 2—fully opening the doors.
A trickle vent is one of the passive background ventilation methods which can be implemented in retrofitting process and is especially effective in buildings with several windows. Trickle vents with the equivalent area of 6000 mm
2 from Titon manufacturer [
38] have been chosen to be defined as orifice flow paths in the CONTAM model.
In addition to trickle vents, air bricks from the same manufacturer with an equivalent area of 10,500 mm
2 are added to the model. These background ventilations are in compliance with the UK building regulation part F and will stay open all the time.
Figure 9 presents a comparison of the effect of these methods on the indoor environment.
Installing background ventilation results in achieving a CO
2 level below 1000 ppm in all three zones. However, wind speed and direction directly affect the efficiency of background ventilation in purifying indoor air, as shown in
Figure 9a: on Wednesday and Thursday (the third and fourth days in the Figure), the CO
2 level is higher compared to the rest of the week.
Figure 10 illustrates the airflow rate from one of the trickle vents and air bricks in the office. The positive flow direction is from outdoors to the office. By analyzing
Figure 9a and
Figure 10 together, it becomes apparent that on the days when the airflow from outdoors to indoors decreases, CO
2 levels increase. The airflow is influenced by the varying outdoor wind and is not constant.
As a result, the airflow from background ventilations fluctuates on different days. Consequently, the impact of background ventilation in purifying the indoor air is not consistent and can be less effective on certain days.
Conversely, keeping the doors open is a more reliable method. This can be proved by analyzing the results in
Figure 9b. According to this Figure, the office’s CO
2 concentration pattern remains relatively consistent throughout the week, which indicates that this method’s impact is almost constant compared to the fluctuations observed in
Figure 9a.
Nonetheless, this approach is not as effective as background ventilation and does not make a significant reduction in CO2 level compared to background ventilation, but it still contributes to improving the IAQ and reaching a safe level.
3.2. Particulate Matter and Biological Pollutants
PM2.5 concentration reaches the peak level in the kitchen, which is the source zone, and the main focus is on cleaning this zone. Despite having the kitchen’s door open during cooking, the neighboring café has a significantly lower amount of PM2.5, which is due to the negative pressure in the kitchen caused by the operation of the extractor hood.
Previously mentioned ventilation strategies, including AHU and background ventilation, are also effective in diluting PM
2.5 and SARS-CoV-2. However, installing in-room air cleaners with HEPA filters is only effective on particles and airborne pollutants, such as viruses, dust, and pollen, and, therefore, has no impact on CO
2 and NO
2. In the case of PM
2.5, an air purifier with a removal rate of 2.4 h
−1 for PM
2.5 [
39] is modeled in the kitchen.
Table 2 provides the average level of PM
2.5 in the kitchen within a week (except Sunday) under different conditions. As presented in
Table 2, the operation of the hood makes a significant reduction in the mean amount of PM
2.5 concentration, which is almost 68% lower than the case without the hood and with increased ventilation. In this case, 7.43% of the results during the simulation period are below 15 µg/m
3, which is the acceptable level of indoor PM
2.5 [
40]. Therefore, the kitchen hood should always be working when the cooking is active. Otherwise, not only will PM
2.5 levels in the kitchen be unsafe, but it will also spread to the neighboring zones.
Furthermore, background ventilation and air purifiers lead to an additional 12% and 49% reductions in the mean concentration when they are operating along with the hood. In the case of air cleaners, only 4.79% of the time in one week does the PM2.5 level exceed the safety limit, which is the best result of the study.
The daily average amount of PM
2.5 is presented in
Figure 11. As can be observed from
Figure 11, the average PM
2.5 level in the case without AHU is lower than the case with ventilation, as the operation of AHU with outdoor air brings in more PM
2.5 from outdoors. However, when the AHU is inactive, the maximum level is 6% and 12% higher than the baseline and increased ventilation rate scenarios.
In addition to PM
2.5 reduction, the installation of an air purifier is also an effective method for diluting the virus in the rooms. In this regard, an air cleaner with a HEPA filter with a removal rate of 0.003 s
−1 [
41] for the SARS-CoV-2 virus is modeled in CONTAM by defining a deposition source in the model.
Table 3 presents the average probability of infection and basic reproductive number (R
0) for different scenarios between 11:00 to 24:00 for the SARS-CoV-2 virus, considering that the source presents one hour in each of the three zones (classroom, café, and laboratory). Among the zones, the classroom has the highest ventilation rate and lowest occupancy density resulting in the lowest probability of infection in the baseline case.
According to
Table 3, increasing the ventilation rate by 60% leads to an average decrease of 19.3% in the probability of infection, while incorporating background ventilation results in an additional average decrease of 42.3%. Background ventilations are 6% more effective in the café than in the classroom and laboratory as it is located in a corner with two exterior walls and several windows, which allows for more background ventilation. Moreover, as shown in
Table 3, opening the door in the classroom has a similar effectiveness to installing background ventilation, and the R
0 is the same (0.82) in both cases.
However, in terms of reducing the R0, opening the doors is 11% less effective than the background ventilation in the laboratory and is 31% more effective in the café. The increased impact of opening the door in the café can be attributed to the assumption that the café’s door to the kitchen is consistently open. Thus, when the door to the corridor is also opened, it further enhances the airflow within the café area, resulting in greater effectiveness.
However, the most effective solution for mitigating the SARS-CoV-2 transmission is the installation of an air cleaner. Even with the baseline ventilation rate, the air cleaner proves to be highly effective and results in the lowest probability of infection and R
0 in all zones. The calculated amount of basic reproductive number in the café is shown in
Figure 12. As the virus source enters the cafe at 12:00, the R
0 increases, and it takes 50 min in the baseline case to exceed 1, which indicates that the virus can infect another person.
4. Discussion
A higher educational building in London has been modeled in CONTAM in order to conduct a multi-zonal analysis and improvement of IAQ. The penetration of two outdoor pollutants, including PM2.5 and NO2, through the exterior structure of the building and ventilation ducts, has been investigated. Furthermore, three indoor airborne contaminants, including PM2.5, CO2, and SARS-CoV-2, have been defined in CONTAM, considering their generation rates along with their deposition and deactivation rates. In the building’s model, the airflow paths have been defined for the interior and exterior walls, roof, and floors to model the pollutants’ dispersion between the zones through these leakages.
The results highlighted the significance of ventilation in both transmitting and dilution of contaminants. In the absence of AHU or ventilation with 0% outdoor air, fewer outdoor contaminants infiltrate the building. However, this leads to a significant accumulation of indoor pollutants since they are not effectively diluted by mechanical ventilation.
On the other hand, if the ambient air is not sufficiently polluted to exceed the air quality safety standards, 100% OA in ventilation is vital to enhance the indoor environment by providing fresh air indoors. Therefore, prior to deciding whether the AHU should operate with 100% OA, it is essential to investigate the outdoor condition of the building’s location.
In this study, the impact of installing background ventilation on the IAQ in a building with fixed windows has been investigated, which proved to be a practical and effective solution for providing natural ventilation and can also be considered for other case studies with a similar situation.
In this case, background ventilation involving the installation of trickle vents on all windows, as well as air bricks on the exterior walls, have been investigated. This method’s impact is highly affected by wind speed and direction, and its effectiveness can vary between different sides of the building or throughout different times of the year. In this study, this method was implemented in the model in combination with an increase in baseline ventilation rate by 60%, resulting in achieving below 1000 ppm CO2 level in all the selected rooms.
Furthermore, the PM2.5 mean level in the kitchen has been decreased by 12% by installing background ventilation, while a commercial kitchen hood also operates with 80% capturing efficiency. This method also has a positive impact on diluting the SARS-CoV-2 as in all the source rooms, the basic reproductive number dropped below 1, which indicates that the virus cannot infect another person. This is especially effective if the room has multiple exterior walls in different directions or encompasses several windows.
Another approach was opening the door to compensate for the lack of natural ventilation by opening the windows. This approach also proved to be effective in improving the IAQ by decreasing all the defined contaminants. Its impact on the SARS-CoV-2 mitigation in the classroom was similar to background ventilation while being 31% more effective in the café as its door to the kitchen was considered to be open all the time, and opening its door to the corridor further increased the airflow within the cafe area.
Overall, in areas where noise pollution is not a concern, it is recommended to keep the doors open during the occupied period. By doing so, better natural ventilation can be achieved, the air exchange will be facilitated, and the IAQ will be improved.
The impact of the installation of an air cleaner with a HEPA filter on PM2.5 and SARS-CoV-2 was also examined. The results revealed that it is the most efficient method of mitigating the contaminants, even with the baseline ventilation rate, because it directly captures the pollutants within the zones before spreading to the neighboring rooms.
During one working week, only 4.79% of the time, the PM2.5 level exceeded 15 µg/m3, and the average level was 3.04 µg/m3 when the air cleaner and kitchen hood were active. Therefore, if implementing the other suggested strategies is not feasible in a similar case study, using HEPA air cleaners should be considered a promising method for enhancing the IAQ.
The findings of this study, examining the influence of increasing ventilation rate and OA percentage, and filter installation on IAQ, are consistent with previous CONTAM-based studies which were conducted on various case studies [
13,
16,
17]. Moreover, the range of CO
2 concentrations in the classroom, which were both simulated and measured, is similar to the study by Di Gilio [
42]. They also concluded that the natural ventilation alone is insufficient to ensure adequate air exchange due to limitations in the building structure. Therefore, in the current study, natural and mechanical ventilation were combined to achieve a safe level of indoor air. Moreover, the impact of wall leakages and level of air tightness on contaminant transmission, discussed in the results section, is also affirmed in another study [
43].
5. Conclusions
The findings of this study are useful while selecting efficient strategies for IAQ enhancement considering a building’s condition, location, and structure. Several solutions have been investigated, and more than one of them was effective in achieving safe levels considering the primary indoor pollutants.
This study emphasizes the importance of utilizing background ventilation and keeping doors open in enclosed spaces with fixed windows to promote natural airflow. It also highlights the effectiveness of air purifiers in reducing the concentration of particles and biological contaminants. By implementing these measures, the study suggests that IAQ can be significantly enhanced, creating a healthier and safer environment. Therefore, in terms of improving the IAQ in buildings, these strategies can be selected and utilized individually or in combination to achieve better outcomes.
In future IAQ analysis studies, it is suggested to include other significant contaminants originating from indoor and outdoor sources, such as volatile organic compounds (VOCs), formaldehyde (HCHO), and NO2, in addition to biological contaminants, such as viruses. Furthermore, conducting analysis across all seasons of the year would allow for comparisons and evaluations of potential differences and challenges.
The current study assumes fixed windows, while in most cases, operable windows often contribute to improving IAQ. However, the findings of this study provide valuable insights for the owners of buildings with similar situations to enhance the IAQ with alternative methods. Additionally, the outdoor air in this study is clean and does not exceed the safe limits, while it can be polluted in another case study that can be investigated in the future.
Another aspect that can be addressed in the future is comparing the cost and environmental footprint of the recommended strategies. Furthermore, their impact on energy consumption is investigated in the author’s previous paper [
24], which was conducted in another case study. Including such comparative analyses would enhance the overall understanding of IAQ improvement strategies.


 ,
, 


