
Optimization Method of Subway Station Guide Sign Based on Pedestrian Walking Behavior

1
School of Civil Engineering, Xi’an University of Architecture and Technology, Xi’an 710055, China
2
Operation Branch of Xi’an Rail Transit Group Co., Ltd., Xi’an 710055, China
*
Author to whom correspondence should be addressed.
Sustainability 2023, 15(17), 12690; https://doi.org/10.3390/su151712690
Submission received: 3 July 2023
/
Revised: 10 August 2023
/
Accepted: 16 August 2023
/
Published: 22 August 2023
(This article belongs to the Special Issue Sustainable Management of Transportation Infrastructure Projects)
Abstract
:The appropriate distribution of the guide signs in subway stations can allow passengers to obtain direction and wayfinding information quickly and accurately. The existing setting methods of subway station guide signs mainly consider the locations of facilities and pedestrian flowlines in the station. Therefore, this research proposes an optimization method based on pedestrian walking behavior to set guide signs more realistically and increase the guidance efficiency of signs. Firstly, through on-site investigation, this research analyzed the walking behavior characteristics of pedestrians and measured the average speed of pedestrians in different spaces to quantify the walking characteristics. Then, the guidance level of guide signs was defined to describe the guide ability of each sign and was the basis for determining the distribution of the guide signs. The constraint of the distance between two adjacent guide signs was added according to the short-term memory of pedestrian walking identification. Moreover, the variable of the number of floors between the two adjacent signs was added to avoid calculating floor-by-floor. Finally, Xi’an Xiaozhai Station was selected as an example to verify the proposed optimization method using the AnyLogic 8.7.6. The results show that the guide sign optimization method based on pedestrian walking behavior proposed in this paper can obtain an accurate distribution of guide signs, which can decrease the outbound time by 18.51s at the most, and the thickness at the bottleneck decreases by 5.90%.
1. Introduction
Under increasing travel pressure, passengers have a greater need for guide signs in subway stations. The reasonable distribution of guide signs can allow passengers to obtain wayfinding information faster, more accurately, and more continuously in the station, which helps to improve passengers’ safety, convenience, and travel efficiency [1,2]. The proper setting of the positions of the guide signs can ensure that passengers quickly find the correct route and reduce their stay time; the appropriate number of guide signs can ensure the continuity of guidance information. Therefore, it is necessary to study the reasonable layout of guide signs to ensure that pedestrians can obtain information and reach their destinations safely and quickly [3,4].
Most of the existing setting methods for subway station guide signs consider the locations of facilities and pedestrian flowlines. From the perspective of subway station facilities, Dada [5] determined the importance scores of the equipment and facilities through a survey of users, which was used as the basis for the setting up of the signs. Qu et al. [6] studied a continuous model of passengers’ distribution characteristics at elevators and stair facilities and obtained the distribution time spent at these two facilities through simulation. According to the characteristics of the random distribution of passengers in the comprehensive passenger transport hub, Lin [7] established a hierarchical layout model of guide signs with the goal of obtaining the optimal spatial visual index and shortest service distance of weighted facilities. Zhang et al. [8] analyzed the relationship between the mechanism of passenger wayfinding behavior and the sequential setting of guide signs and suggested that the guide signs should be reasonably arranged at the gates, escalators, and passages, with more stop points in the station. From the perspective of the passenger flowline in the subway station, Xiong and Yao [9] analyzed the relationship among the position, content, and wayfinding results of the guide signs. According to the rules of passenger flowlines and guide signs in the wayfinding process, the ideal point method was used to analyze the influence of the distance, number of signs, and recognition on passenger path selection. Ding [10] discussed a layout generation algorithm for suspended guide signs in subway stations by studying the passenger flowlines and the visibility of suspended guide signs in subway stations. Ouyang and Liu [11] abstracted the subway station into a topology diagram to study the setting method of the guide signs.
Not only the static conditions but also the dynamic characteristics of pedestrians should be considered [12]. In the layout of the guide signs, further considering the walking behavior of pedestrians can more accurately reflect the actual situation and increase the guidance efficiency of the signs. Walking behavior refers to how pedestrians move in every space. Existing research suggests that it can help to optimize facility design. For example, Zhou et al. [13] used it to improve subway station stairs, Hua [14] used it to improve subway station traffic organization, and Shao et al. [15] used it to optimize guide signs at Shanghai Hongqiao Airport. However, no researcher has proposed a systematic method to place guide signs based on walking behavior. The existing research on the walking behavior in the subway station mainly includes the following. Yu [16] investigated the comprehensive transportation hub of Beijing South Railway Station according to the visual perception mechanism. Su and Zhao [17] analyzed the streamline and wayfinding behavior of pedestrians in the rail transit hub through follow-up investigation. Wu et al. [18] considered the heterogeneity of pedestrians in the subway station (occupied space, pace, stride) and explored the characteristics and laws of passenger wayfinding behavior. Lei et al. [19] studied the relationship between pedestrian walking speed and flow density in closed corridors. To incorporate walking behavior into a mathematical model, it is essential to quantify it as a parameter. From the perspective of flow balance, Li et al. [20] fully considered people’s exit and route choice behavior and optimized evacuation guidance signs. However, the current data on this walking parameter may be outdated due to urban traffic development and COVID-19, which have changed the walking parameters of pedestrians. Therefore, it is necessary to collect new data on this parameter for the study of pedestrian behavior and guide sign layouts.
In order to fill the above gaps, on the one hand, this study focuses on the walking behavior of passengers in subway stations, introduces the method of the pedestrian tracking experiment, conducts field investigations on representative subway stations, analyzes the walking characteristics in different spaces through the experimental results, and updates the data on pedestrian walking speeds. On the other hand, this paper puts forward a method to set the guide signs of subway stations considering the pedestrian walking behavior, to improve the layout and function of the guide sign system. According to this method, once the operation unit obtains the flowline diagram of the subway station and the walking speeds of pedestrians in different spaces, obtained through the pedestrian tracking experiment, by introducing the index of the guiding level, the optimization results for guiding signs in the subway station can be obtained in a targeted manner. This method fully considers the diversity of the subway station space and pedestrian behavior in different areas and can be applied to different stations. In order to verify the effectiveness of this method, this study optimizes the guide sign layout at Xiaozhai Station as an example. The results show that this method can effectively improve the guiding effect for passengers.
In the first place, this study collects data on pedestrian walking behavior characteristics at different locations of typical transfer subway stations through field investigation and quantifies the walking behavior of pedestrians in terms of speed. Then, we improve the distance constraint between two adjacent signs via short-term memory and consider different floors. The guidance level of the guide sign is defined to describe the guide ability of the sign for the pedestrian. The guidance level model is improved based on the walking characteristics of pedestrians, and the optimization method for guiding signs considering the walking behavior of pedestrians is established. Finally, the guide sign layout of Xiaozhai Station in Xi’an is optimized using the optimization method. The simulation result using AnyLogic verify the optimization method’s effectiveness and scientificity.
2. Pedestrian Walking Behavior Characteristics
Walking behavior refers to how a single pedestrian moves in a space. In this section, we use field experiments to analyze how walking behavior varies among different spaces and quantify it as the average speed of pedestrians. Through the field pedestrian wayfinding tracking experiment, the behavior characteristics, walking routes, and passing times of pedestrians in subway stations under the action of guiding signs are collected. On this basis, this paper analyzes the law of pedestrian behavior characteristics in subway stations, and the factors affecting pedestrian behavior are analyzed according to different positions to provide a basis for the setting of pedestrian guidance signs.
2.1. Pedestrian Walking Behavior Experiment
To better obtain the walking behavior characteristics of pedestrians in different areas of the subway station, a pedestrian tracking experiment [21] is designed in the subway station to obtain the pedestrian behavior characteristics of different positions in the station and collect the walking speeds of pedestrians in different spaces, to quantify the differences in walking behavior. This experiment ignores the walking distance error caused by overtaking or avoiding in the process of pedestrian walking. For ease of calculation, the walking route is approximated as some straight sections. At the same time, in order to ensure that the experiment can obtain pedestrian walking data in a specific space type, the definition of different spaces is slightly smaller than the actual situation, so it is assumed that the pedestrian walking behavior characteristics at different space conversions remain unchanged. The investigators should avoid interfering with other passengers or staff members.
2.1.1. Experimental Site
Xiaozhai Station was selected as the experimental site because it is a typical transfer station with diverse passenger flows from commercial centers, schools, residential areas, offices, and leisure facilities. In order to avoid the occasional nature of the experimental data, the flat peak hours of the typical working day, 09:00–11:00 and 15:00–17:00, on the working day of November 2022, were selected for the experiment.
2.1.2. Experimental Subjects
The age and gender of subway station passengers were investigated before the experiment, and the actual composition characteristics of subway station passengers were obtained. Through the survey, it was concluded that the proportion of male passengers and female passengers was 51% and 49%, passengers under 18 years old accounted for 4.5%, passengers aged 19–44 accounted for 85.1%, passengers aged 45–59 accounted for 7.5%, and passengers over 60 years old accounted for 2.9%. Based on the above results, according to the passengers’ gender and age ratios, we selected the experimental samples.
2.1.3. Equipment
The files and equipment used in this pedestrian tracking experiment were as follows: (1) design papers of the experimental subway station; (2) all possible walking routes in a diagram drawn by pre-investigation; (3) setting timing measurement control nodes in different spaces; (4) record handbook and questionnaire; (5) timing equipment distributed to every investigator; (6) photographic equipment to record the whole wayfinding process to check for possible missing data.
2.1.4. Experimental Steps
To obtain all the walking behavioral characteristics’ data in the station, two investigators tracked one participant, with one responsible for recording the time and the other for recording the route, behavioral characteristics, and location. The specific test steps were as follows.
Step 1: Before the experiment begins, researchers should understand the spatial structure of subway stations, possible routes, and measurement control nodes in different spaces. This can effectively avoid invalid data caused by investigators’ errors in the experiment.
Step 2: The investigators randomly wait outside the platform screen door for the train to enter the station.
Step 3: After the train arrives at the subway station, each investigator randomly selects a passenger as a follow-up target and records their departure time and location without affecting their normal departure or transfer behavior. The investigator should maintain an appropriate distance to avoid attracting the target’s attention or causing discomfort. If not, they will affect the normal walking behavior of the subjects due to psychological effects, making it impossible to collect walking behavior data accurately. It is also essential to record the entire wayfinding process of the participants in the form of a video. Some of the missing walking information can be supplemented according to the saved video during the experiment.
Step 4: Record the actual walking distance between adjacent control nodes on the plan map and record the time at which pedestrians arrive at the control nodes of various spaces.
Step 5: After the pathfinding process is complete, record basic pedestrian information. This information includes age, gender, education, occupation, familiarity with subway stations, etc., to analyze walking behavior.
Step 6: Adjust tracking passenger selection according to sample diversity and composition requirements. Repeat steps 2–5 until the required number of samples is collected.
2.1.5. Experimental Data
Partial survey data are shown in Table 1.
2.2. Analysis of Pedestrians’ Walking Behavior Characteristics in Different Spaces
The subway station space can be divided into the horizontal channel, vertical walking facilities, station hall layer, and platform layer. The walking behavior of pedestrians in each space has different characteristics. This section helps to systematically understand the behavior of pedestrians in different spaces of the subway station and then provides theoretical support for the optimization design of the guide signs in the next station.
2.2.1. Horizontal Channel
The channel connects different functional spaces to provide a buffer for pedestrians to walk in different spaces. According to the channel opening degree, the channel can be divided into open, closed, and semi-closed channels [22]. This part respectively analyzes the behavioral characteristics of pedestrians in these three types.
- (1)
- Open channel
The open channel leads to the square, shopping mall, or other architectural spaces beyond the gate machine. Passengers have a wide field of vision, but also face a large and dense crowd that moves rapidly. The channel has many turns that affect pedestrians’ choices. When few people use the channel, pedestrians tend to choose the inner side of the shortest path. When many people use the channel, they walk on the right or left according to their country’s traffic habits to avoid collisions.
- (2)
- Semi-closed channel
The semi-closed channel is directly connected to the commercial space in the basement of the building. It evacuates pedestrians to the ground or other functional spaces indirectly through the interior of the building. Passengers here have a sense of direction confusion and face ample passenger flow and also have to deal with people intertwined from different directions. Therefore, this channel is easily affected by the passenger flow of the commercial space that it connects with.
- (3)
- Closed channel
Closed channels connect different functional spaces directly through the independent channel, such as a single-direction outbound channel, transfer channel, or two-way transfer channel with dividers. Pedestrians walk faster here because they wish to leave this environment quickly. The main reasons are that the pedestrians have a clear purpose and an increased psychological desire to leave this environment as soon as possible.
2.2.2. Interlayer Facilities
The interlayer facility is responsible for transporting pedestrians to other floors in the subway station, mainly including walking stairs, escalators, and lifts. Pedestrians generally prefer to take the escalator. However, they may choose the stairs if there are too many people in line or they are in a hurry. The escalators and lifts have fixed speeds and volumes and limit the walking behavior as fixed characteristics of pedestrians when there is a large flow.
Pedestrians tend to walk near the handrail up and down the stairs. When walking on stairs not divided into upward and downward parts, pedestrians tend to consciously walk on the right or left according to the traffic habits of the country to avoid collisions, as shown in Figure 1. Pedestrian behavior on stairs is related to the depth, height, and inclination of the stair steps and the information in the station and is closely related to pedestrians’ physiological and time requirements. Pedestrians are easily affected by the train’s arrival when walking up and down the stairs directly connected to the platform. When pedestrians find that the train needed has entered the station or a large number of people are queued in front of the screen door in the process of traveling downstairs, their walking speed will be accelerated. When walking on the stairs not connected to the platform, the pedestrian is relaxed, and their walking speed is slow. Therefore, the speed of pedestrians moving up and down the stairs directly connected to the platform is generally more significant than the speed when moving downstairs when the platform is not connected.
2.2.3. Station Hall Layer
The station hall mainly connects the entrance, exit, and platform, including the charge and non-charge areas. The station hall especially plays the role of gathering and diverting pedestrians. The pedestrian flowline in the station hall is complex, and there are many conflict, separation, and confluence points. Inbound flowlines, outbound flowlines, and transfer flowlines all have to pass through the station hall, resulting in station hall traffic interweaving, pedestrian overtaking, staying, and other phenomena.
In the station hall environment without iron horse isolation, pedestrians display a self-organization phenomenon with the same target under the guidance of guide signs. As shown in Figure 2, passengers can easily stop and wait near the exist. Exits, striking advertisements, and signs are easily selected as meeting points, leaving passengers waiting for fellow passengers in these locations. Passengers are prone to stagnation near the exit gate machine due to finding IC cards or opening payment applications. These staying passengers will reduce the actual walking space of pedestrians, resulting in the need for outbound passengers to avoid these staying passengers, decreasing the smoothness and continuity of the outbound flowline and affecting the efficiency of outbound pedestrian movement.
2.2.4. Platform
A platform is a place for pedestrians to enter, exit, and wait for the train. It has the functions of accommodating, passing, and evacuating. The passenger flow has the characteristics of high concentration, an uneven spatial and temporal distribution, and multiple conflict points. The pedestrian’s speed on the platform is affected by the train situation, the speed of other pedestrians nearby, and the pedestrian density. When the train stops at the station, pedestrians exit the train to find the necessary information. They rush to the stairs to leave the platform quickly, resulting in pulsed pedestrian congestion characteristics. At this time, the pedestrian flow has the characteristics of heavy density, small personal space, and a slow walking speed. As shown in Figure 3, fan-shaped accumulation occurs when pedestrians queue for the elevator. Pedestrians unfamiliar with the station tend to look and stay when they exit the train.
2.3. Walking Behavior Quantification—Average Speed in Different Spaces
Based on the above analysis, the speed in different locations in the subway station is different. The speed of pedestrians was obtained by recording videos at different positions of the station. Through investigation and statistics, the average speeds at different positions in the subway station was shown in Table 2.
3. Guide Sign Setting Optimization Model Based on Guidance Level
The guidance level can describe the general advantages and disadvantages of the guidance effect. Optimizing the label distribution to maximize the guidance level can ensure the maximum realization of human and social needs. The essential role of pedestrian guidance signs is also show here; specifically, by providing guidance information to pedestrians, people can reach their destination points to meet their specific needs and, at the same time, achieve specific social values. The guiding level of the identification is related to the guiding passenger flow, the guiding distance, and the number of crossing points.
According to the description in the Introduction, this section improves the existing induction level model based on the walking behavior characteristics of pedestrians in subway stations. The subway station guide sign optimization model is established to maximize the guidance level of the number and locations of the guide signs according to the passenger flow.
3.1. Model Assumptions
Firstly, according to the streamlined characteristics of passengers, it is necessary to set alternative points for guiding signs on the passenger’s route. Secondly, since the size of each boot identifier and the information it can hold are limited, it is necessary to limit the boot information contained in the boot identifier. Therefore, the following model assumptions are proposed:
- (1)
- According to the above analysis, it is assumed that the locations where the alternative points of the guide signs are set are general, such as the entrance, the stairway, the passenger streamline intersection, and the corner;
- (2)
- The guide sign at each candidate point is assumed only to show information within three nodes near the position.
3.2. Model Construction
The establishment of the optimization model of the subway station’s guide sign positions requires us to maximize the guiding level of the guide sign positions according to the passenger flow. According to the candidate points of the determined guide sign and the guide passenger flow of each candidate point, the number and position of the guide sign are determined. The established optimization model is shown in Equation (1).
Here,
—The alternative points of the guide identification are 1, 2,…, ;
—The target point for passengers to reach; the value is 1, 2,…, ;
—0–1 function; if the guide sign is set at the alternative point , ; otherwise, it is 0;
—Assignment coefficient; when the passenger arrives at the target location and is guided by the guide sign option , ; otherwise, it is 0;
—Guided passenger volume, which means that the passenger flow is guided by the guide sign when reaching the target point ;
—Weight coefficient, which represents the weight relationship between the guiding effect of the guiding identifier on the passenger flow and the guiding distance;
—Number of crossing points, which represents the number of crossing points passed from receiving information from the boot identifier to the destination point .
The constraints of this model are as follows.
- (1)
- To ensure that the passengers of each streamline can effectively obtain information in the subway station, it is necessary to ensure that all passenger streamlines are guided at least once, which means that there is at least one alternative point to set the guide sign.
In this equation,
—Number of passengers entering the subway station;
—The set of alternative points of the guide sign in different directions after the -th passenger enters the subway station.
- (2)
- Passengers from different origin locations can travel to any destination point, and they must be guided at least once before reaching the destination. To ensure that guide signs can provide services to all types of passengers, each target point in the subway must be displayed at least once.
In this equation,
—Collection of guide sign alternatives passed before reaching the target point .
- (3)
- The number of target points included in a specific guide sign should be fully considered and constrained. In the exact location, if more than the guiding information is needed, it will prevent passengers from frequently recognizing the sign information and slow down their walking speed. This will lead to the slow dispersion of the passenger flow, a crowded passenger flow, and a waste of resources. At the same time, if the amount of target information is insufficient, it will not provide sufficient wayfinding information for passengers and cause crowd congestion when finding the correct route. Therefore, the amount of guidance flag information at the exact location is restricted.
In this equation,
—Number of guidance identifiers set in the guide sign; , and is an integer, representing a total of target points’ information to choose from.
- (4)
- The distance between the guide signs needs to be constrained to protect information coherence. On the one hand, if the distance between the guide signs is too long, this will cause pedestrians to forget the guide information of the previous sign so that they cannot reach the next sign smoothly, which will easily lead to pedestrian hesitation, stagnation, wandering, asking for directions, and other behavior. On the other hand, a short distance between the guide signs will cause information redundancy so that pedestrians frequently identify the guide information, resulting in a slow pace, reducing traffic efficiency, and increasing the cost, reducing the appearance of the station. Guide signs for different floors should also follow the principle of coherent information. Therefore, the distance between each pair of guide signs should abide by minimum and maximum limits based on the pedestrian walking characteristics. Confirmation of these two criteria is explained in detail in Section 3.3.
In the above,
—Number of markers actually laid between alternative points and ;
—The shortest distance between alternative points and ;
—The maximum distance between identifiers at position ;
—The minimum distance between identifiers at position ;
—When , the alternative point and guide the same target point , and when , the alternative point and guide different target points ;
—Number of floors crossed between signs;
—The average speed corresponding to different positions ;
—Time required to reach the maximum distance at position ;
—Time required to reach the minimum distance at position .
3.3. Parameter Determination
- (1)
- Weight coefficient ()
In this study, the weight coefficient is defined as the balance and weight relationship between the guiding effect of the guide sign on the passenger flow and the guiding distance. When the passenger is far away from the target point, the passenger’s dependence on the guide sign is high. When the distance from the target point is short, the passenger can judge the direction of travel according to the environment, and the dependence on the guide sign is small. Therefore, the value is 1.5 when it is far away from the target point (the number of candidate points passed by the target point is three or more), and the value is 1 when it is closer.
- (2)
- Number of streamlined intersections ()
Field investigation needs to determine the number of streamlined intersection points to draw a streamlined map in a subway station.
- (3)
- Alternate points and number of alternative points
In this paper, the alternative point of the guide sign is defined as being within the scope of the guide sign layout of the subway station. The locations of the alternative points of the guide sign mainly depend on the needs of the passengers in the route-finding process and the spatial structure of the subway station [23]. Therefore, the alternative points of the guide sign are set at the entrances and exits, stairways, passenger streamline intersections, and corners. In Figure 4, 10 alternative points can be determined according to the location of facilities, target points, and flowlines in the subway station. Thus, the number of alternative points can be obtained.
- (4)
- Guided passenger flow ()
According to the locations of the alternative points, the passenger flow through each guide sign during the peak period is investigated and counted, so that the guided passenger flow of each guide sign alternative point can be obtained.
- (5)
- The longest distance between signs ()
It can be seen from Figure 5 that the information memory of the guide sign decreases rapidly within 20 s, and people forget the guide sign information faster. As time passes, the information retention capacity tends to be stable, and the forgetting speed is low.
Pedestrians’ memory of signs shows a significant downward trend in 10~20 s. For pedestrians unfamiliar with the environment, the coherence and enrichment of information are particularly important. If the information is repeated, it can be maintained for a long time in short-term memory. When there is still 75% memorized, the value of is around 15 s [24]. can be calculated by Equation (7).
- (6)
- The shortest distance between the identification ()
The wayfinding process can be divided into three stages: the spatial cognition stage, the wayfinding decision-making stage, and the wayfinding execution stage. These three stages are interrelated and will occur alternately before the completion of the routing process. Information processing behavior is divided into the recognition stage, action stage, and confusion stage [25], as shown in Figure 6.
Pedestrians’ instantaneous memory in 3 s is a information block, so, based on satisfying the pedestrian’s instantaneous memory law, the integrity of the guidance information is guaranteed to meet the pedestrian’s wayfinding needs. can be calculated by Equation (8).
To sum up, the definitions and values of these parameters are arranged in Table 3.
4. Case Analysis of Xiaozhai Station, Xi’an
Xiaozhai Station is a transfer station for Line 2 and Line 3 in Xi’an, China. Passengers have various travel purposes and a higher passenger flow intensity. Higher requirements are put forward for the layout of guidance signs. Therefore, this experiment selects Xiaozhai Subway Station in Xi’an as an empirical case for analysis to verify the scientificity of the improved guide sign setting method.
4.1. Parameter Determination
4.1.1. Passenger Walking Streamline Trajectory and Guide Sign Alternative Point Location
According to the user data obtained from the survey, the streamline of these passengers on the platform layer and the station hall layer are drawn. The alternative points of the guide sign are set according to the method of determining the alternative points in the above model requirements. The platform and station hall layers of the passenger flowline and guide alternative point locations are shown in Figure 7 and Figure 8. In the station hall floor shown in Figure 7, the stairs and escalator exits are regarded as the starting points, and the six station exits are regarded as the destination. In the platform floor shown in Figure 8, the screen door is simplified into eight starting points, and the entrance of the stairs is regarded as the destination.
4.1.2. Alternative Points to Guide Passenger Flow
The guiding passenger flow of each alternative station for guiding signs on the platform layer and the station hall layer is obtained according to the survey results regarding the passenger flow through each guiding sign and the proportion of passengers unfamiliar with the subway station environment. The specific results are shown in Table 4 and Table 5.
4.2. Model Solution
4.2.1. Platform Layer Analysis and Calculation
According to the above-determined alternative points of guide signs and the target points of passenger travel, the objective function expression of the platform layer guide sign location optimization model is obtained:
According to the passenger flowline obtained from the above experiments, the parameter values of the guiding coefficient , the guiding passenger flow , and the corresponding number of intersection points in the objective function are determined, as shown in Table 6.
The model under different numbers of guidance signs is solved by LINGO, the guidance level under different settings of guidance signs is obtained accordingly, and the growth trend chart of the guidance level is produced, as shown in Figure 9.
4.2.2. Station Hall Layer Analysis and Calculation
Similarly, according to the determined alternative points of the guide signs at the station and hall level and the target points of passenger travel, as well as the locations of the alternative points of the guide signs obtained through experiments and the guided passenger flow received from the survey, the objective function of the optimization model of the guide signs at the station and hall level and its parameters and constraints are obtained. The LINGO 18.0 is used to solve the model under the constraint of the number of different guide signs and we obtain Figure 10.
4.3. Simulation
The AnyLogic software is used to simulate Xiaozhai Station in Xi’an. The passenger flow data of different locations are input into the corresponding module, and the logical structure is designed according to the passenger entry and exit station and transfer process to realize a simulation under the normal operation state of the station.
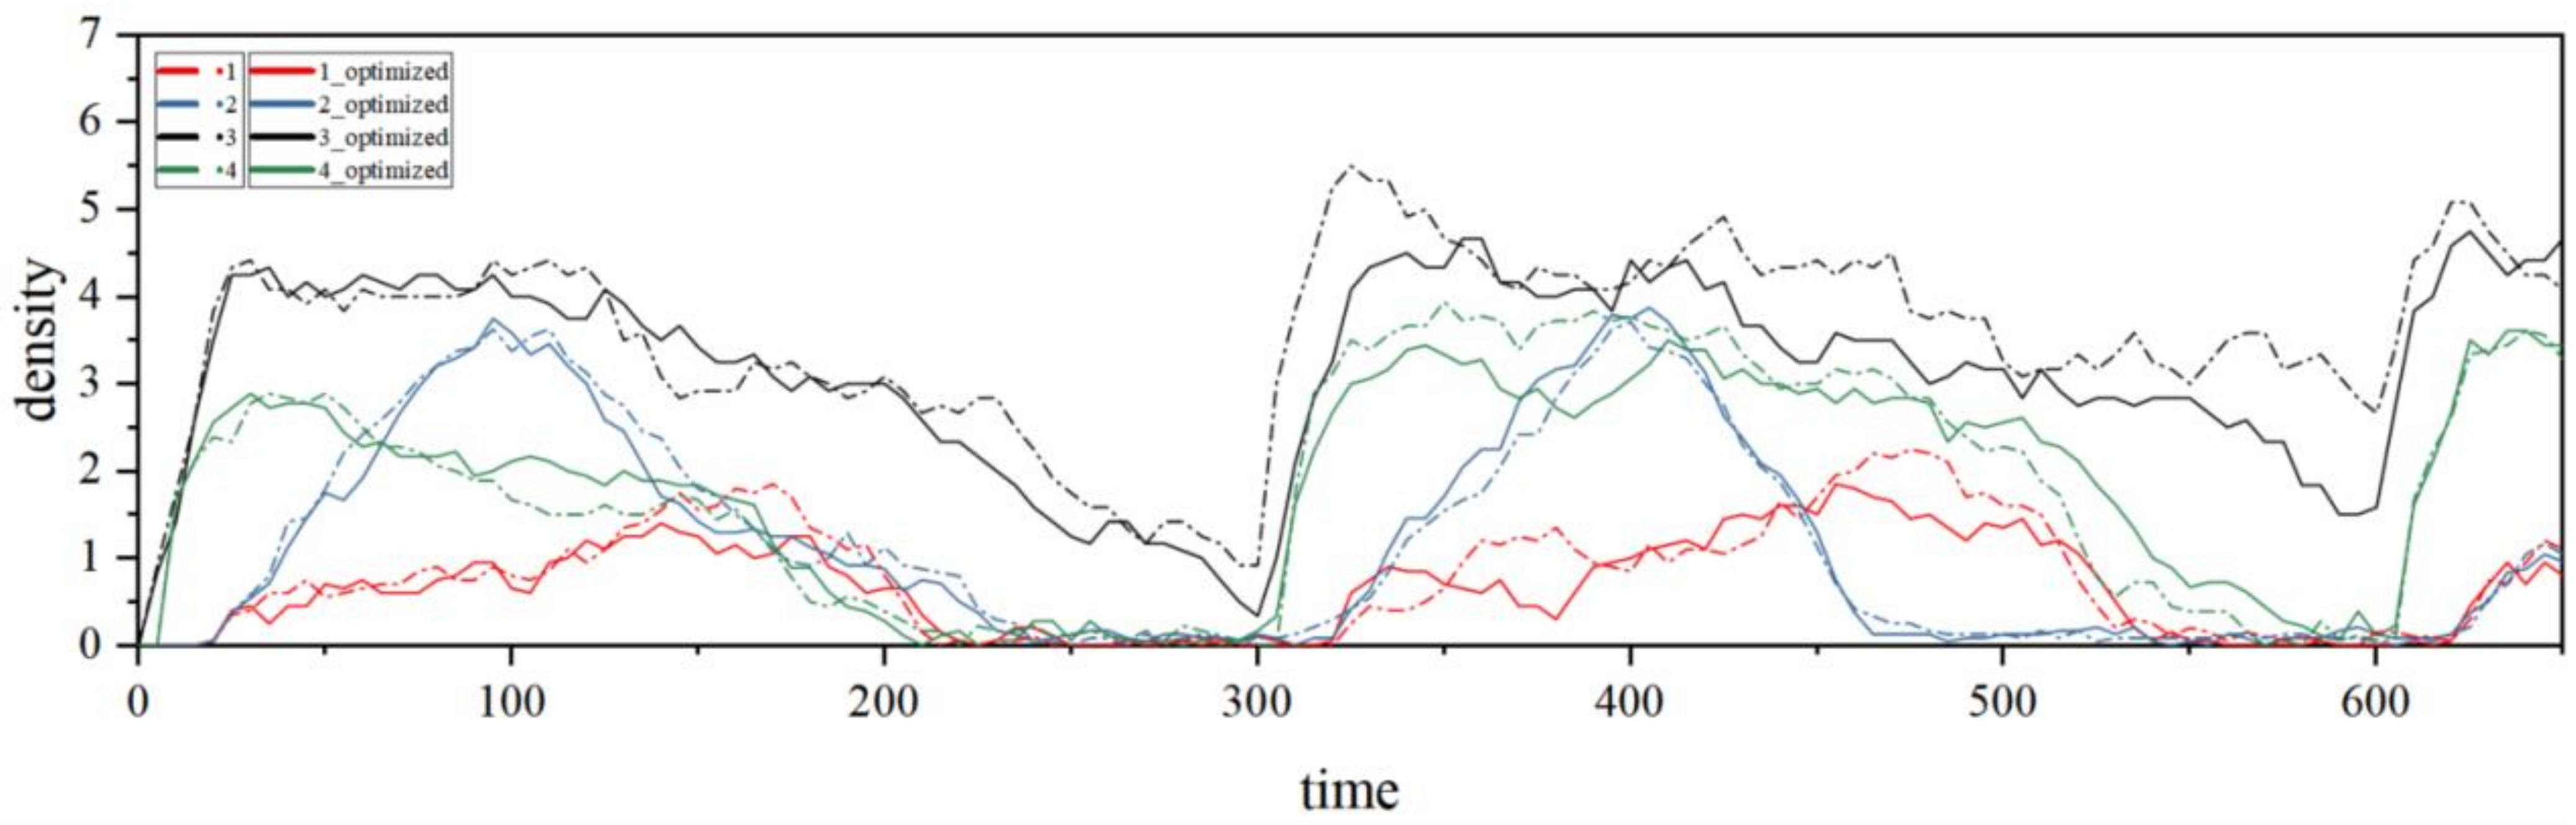
The passenger departure time before and after optimization is compared by simulation, as shown in Table 7. The departures of Line 2 and Line 3 and transfers from Line 2 to Line 3 and Line 3 to Line 2 decreased by 18.51, 9.09, 3.58, and 14.73, respectively. Pedestrian density maps can directly reflect the optimization effect of guiding signs. The higher the pedestrian density, the color of the area in the graph becomes warmer, while the colder color represents the value of the lower pedestrian density. Comparing the pedestrian density maps in Figure 11, the area of high pedestrian density in the optimized station is significantly smaller. Four bottleneck locations in the station are selected to calculate their pedestrian density. As shown in Figure 12, the pedestrian density at the bottleneck significantly reduces after optimization.
5. Discussion
To ensure that the guide sign setting optimization method fits the actual situation of the given station, this study conducts a pedestrian wayfinding tracking experiment to determine the locations of the alternative points of the guide signs and clearly define the parameters in the location optimization model of the guide signs, to obtain more reliable data and make the calculation results of the model more accurate. Taking Xiaozhai Station as a case, the model is used to optimize the guide signs, the Lingo software is used to solve the model, and, finally, the optimal locations of the guide signs are obtained. Through the experiment, we also update the research on the walking behavior of passengers in different types of spaces in the subway and measure the average walking speeds corresponding to different spaces.
There are some differences between the measurement of the passenger walking speed in the subway station in this study and that in the previous literature [26,27,28,29,30,31]. After investigation and analysis, the reasons for this difference are found to be as follows. First, it is related to the characteristics of the city. As a famous tourist city, Xi’an attracts many tourists, resulting in a higher proportion of passengers unfamiliar with the subway and a greater reliance on directional signs when navigating [32]. Second, the guide sign design of each city is different, and the varied information arrangements will reduce the reading speeds of passengers. Thirdly, it should also be mentioned that, in the experiment, we found that passengers who were unfamiliar with subway stations were more inclined to consult navigation software on their cellphones when looking for exits, which could lead to wandering and stagnation at the station layer.
This study had some limitations. First, this study investigated pedestrian behavior in a typical subway station, and the surrounding environment influenced the results. Second, the optimization method proposed in this paper relies on the field investigation data, and only by ensuring the accuracy of the data can the guide signs be well optimized. Third, the study approximated the pedestrian route as a straight-line segment for the measurement of the walking distance in different spaces, ignoring the walking distance errors caused by avoidance and overtaking.
The built environment and land features around subway stations are related to the types and behaviors of subway passengers. In the future, these factors can be further introduced into the optimization method of guiding sign setting to improve the guiding efficiency of guide signs and provide better services for passengers. At the same time, it will be possible to use multiple types of subway stations and various lines of passenger flow to improve further the model and its adaptability in different regions and subway structures.
6. Conclusions
Correctly setting the locations and number of guide signs is crucial in improving the utilization efficiency and quality of service for public safety in the subway station. The research results of this paper can provide theoretical support and technical guidance for the optimization of pedestrian guidance signs in transfer station subway stations. The main findings of the study are as follows.
- (1)
- Pedestrians’ walking speeds in different spaces of subway stations show apparent differences, and the walking speed can quantify the walking behavior of pedestrians. The average walking speeds at the horizontal channels, stairs, station hall, and the platform was measured by field investigation.
- (2)
- By adding the parameter v, which characterizes the walking behavior characteristics of pedestrians, and the parameter Lc, which describes the number of layers between signs to optimize the traditional guidance level model, the model can be more realistic and practical.
- (3)
- The proposed optimization method can shorten the passenger outbound time, improve the distribution efficiency, and effectively reduce the density in the station. The outbound time can be decreased by 18.51 s at the most, and the thickness at the bottleneck can be decreased by 5.90%.
Author Contributions
Conceptualization, Y.S. and B.L.; methodology, Y.S. and B.L.; software, Y.S.; validation, Y.S. and T.X.; formal analysis, B.L.; investigation, Y.S., T.X. and N.L.; resources, B.L., D.L., L.L. and X.C.; data curation, B.L.; writing—original draft preparation, Y.S.; writing—review and editing, B.L., T.X., N.L., D.L., L.L. and X.C.; visualization, Y.S. and T.X.; supervision, B.L., D.L., L.L. and X.C.; project administration, Y.S. and B.L. All authors have read and agreed to the published version of the manuscript.
Funding
This research was funded by the Social Development Project of Shaanxi Provincial Department of Science and Technology, 2021SF-486; Shaanxi Provincial Transportation Technology Project, 20-05R.
Institutional Review Board Statement
The study was conducted in accordance with the Declaration of Helsinki, and approved by the Ethics Committee of School of Civil Engineering, Xi’an University of Architectural and Technology (protocol code: 2022-LS1026, date of approval: 20 October 2022).
Informed Consent Statement
Informed consent was obtained from all subjects involved in the study.
Data Availability Statement
The data presented in this study are available on request from the corresponding author.
Acknowledgments
The authors thank the Social Development Project of Shaanxi Provincial Department of Science and Technology (2021SF-486) and Shaanxi Provincial Transportation Technology Project (20-05R).
Conflicts of Interest
The authors declare no conflict of interest. The funders had no role in the design of the study; in the collection, analyses, or interpretation of data; in the writing of the manuscript; or in the decision to publish the results.
References
- Chen, C. Urban characteristics and application of subway-oriented sign design. China Manag. Inf. Technol. 2015, 18, 235–236. [Google Scholar]
- Lin, Y.; Kang, L.; Shi, Y.J. Multi-objective modeling and optimization for layout of pedestrian-guidance signs with IFD-NSGA-Ⅱ algorithm. J. Syst. Manag. 2013, 4, 553–559. [Google Scholar]
- Chen, T.D. Urban Rail Transit Signage Optimization and Simulation Research. Ph.D. Thesis, Beijing Jiaotong University, Beijing, China, 2020. [Google Scholar] [CrossRef]
- Tosic, V.; Babic, O. Quantitative evaluation of passenger terminal orientation. J. Adv. Transp. 1984, 18, 279–295. [Google Scholar] [CrossRef]
- Dada, E.S. Quantitative Measures of Orientation in Airport Terminals. Ph.D. Thesis, The University of Calgary, Calgary, AB, Canada, 1997. [Google Scholar]
- Qu, Y.; Gao, Z.; Xiao, Y.; Li, X. Modeling the pedestrian’s movement and simulating evacuation dynamics on stairs. Saf. Sci. 2014, 70, 189–201. [Google Scholar] [CrossRef]
- Lin, J.X. Research on Classification Oriented Sign Layout Method of Comprehensive Passenger Transportation Hub Based on Passenger Visual Perception Behavior. Ph.D. Thesis, Beijing Jiaotong University, Beijing, China, 2017. [Google Scholar]
- Zhang, D.M.; Zhang, Q.; Lan, L.K. Research on the Sequential Setting of directional Signs in Urban rail Transit Stations based on passenger wayfinding Behavior. Transp. Energy Conserv. Environ. Prot. 2021, 17, 152–155. [Google Scholar]
- Xiong, Z.; Yao, Z. Design method of guide sign for rail transit Station based on Wayfinding Experiment. Transp. Syst. Eng. Inf. 2018, 18, 80–85. [Google Scholar]
- Ding, L. Research on Visual Field and Layout Design of Hanging Guidance Signs in Subway Stations. Master’s Thesis, Beijing Jiaotong University, Beijing, China, 2021. [Google Scholar]
- Ouyang, K.M.; Liu, S.F. A simulation method for rail transit sign operation. Int. J. Simul. Model. 2021, 4, 742–753. [Google Scholar] [CrossRef]
- Daamen, W. SimPed: A pedestrian simulation tool for large pedestrian area. In Proceedings of the 2002 European Simulation Interoperability Workshop (EuroSIW), London, UK, 24–26 June 2002. [Google Scholar]
- Zhou, H.; Zhang, N.; Wang, H.C. Measurement and Analysis of the Microscopic Characteristics of Pedestrian Traffic on the Stairs of Metro Station. Urban Rail Transit Res. 2015, 18, 60–67. [Google Scholar]
- Hua, S.S. Analysis of the Microscopic Characteristics of Local Pedestrians in Subway Station. Master’s Thesis, Chang’an University, Xi’an, China, 2019. [Google Scholar]
- Shao, M.; Xie, C.; Sun, L.; Jiang, L. Optimal Layout of Static Guidance Information in Comprehensive Transportation Hubs Based on Passenger Pathfinding Behavior. Sustainability 2019, 11, 3684. [Google Scholar] [CrossRef]
- Yu, D. Simulation Evaluation of Guiding Signage Layout Based on Wayfinding Behaviour in Rail Transit Hub. Master’s Thesis, Beijing Jiaotong University, Beijing, China, 2012. [Google Scholar]
- Su, Y.; Zhao, D.F. Study on pedestrian flow and way-finding characteristics in integrated rail transit hub. Urban Rail Transit Res. 2014, 17, 40–44. [Google Scholar]
- Wu, H.L.; Yuan, Z.Z.; Li, H.X.; Cao, Z.C.; Zhang, S.L. Simulation model of subway station staircase capacity considering pedestrian heterogeneity. Transp. Syst. Eng. Inf. 2016, 16, 141–147. [Google Scholar]
- Lei, B.; Xu, J.; Li, M.; Li, H.; Li, J.; Cao, Z.; Hao, Y.; Zhang, Y. Enhancing Role of Guiding Signs Setting in Metro Stations with Incorporation of Microscopic Behavior of Pedestrians. Sustainability 2019, 11, 6109. [Google Scholar] [CrossRef]
- Li, M.; Xu, C.; Xu, Y.; Ma, L.; Wei, Y. Dynamic Sign Guidance Optimization for Crowd Evacuation Considering Flow Equilibrium. J. Adv. Transp. 2022, 2022, 2555350. [Google Scholar] [CrossRef]
- Arthur, P.; Passini, R. Wayfinding: People, Signs, and Architecture; McGraw-Hill Book Co.: New York, NY, USA, 1992. [Google Scholar]
- Li, M.X. Research on the Reasonable Setting of Passenger Guidance Signs in Large Railway Passenger Station. Master’s Thesis, Southwest Jiaotong University, Chengdu, China, 2014. [Google Scholar]
- Ricker, T.J.; Spiegel, L.R.; Cowan, N. Time-based loss in visual short-term memory is from trace decay, not temporal distinctiveness. J. Exp. Psychol. Learn. Mem. Cogn. 2014, 40, 1510. [Google Scholar] [CrossRef]
- Shin, H.J.; Park, H.M. A Study on The Sign System Following Installation of Screen Doors in Subway Platforms. J. Korean Soc. Railw. 2007, 10, 290–295. [Google Scholar]
- Hao, Y.R.; Lei, B.; Zhang, Y.; Sun, Y.Y. Optimization of Subway Guide Sign Information Based on Pedestrian Cognitive Law. Traffic Inf. Saf. 2021, 4, 99–107. [Google Scholar]
- Lam, W.H.K.; Morrall, J.F.; Ho, H. Pedestrian flow characteristics in Hong Kong. Transp. Res. Rec. 1995, 1487, 56–62. [Google Scholar]
- Robert, E.D.; Paul, L.O. Human Factores in Traffic Safety; Lawyers & Judges Publishing Company: Tucson, AZ, USA, 2005. [Google Scholar]
- Rastogi, R.; Ilango, T.; Chandra, S. Design implications of walking speed for pedestrian facilities. J. Transp. Eng. 2010, 137, 687–696. [Google Scholar] [CrossRef]
- Pinna, F.; Murrau, R. Age Factor and Pedestrian Speed on Sidewalks. Sustainability 2018, 10, 4084. [Google Scholar] [CrossRef]
- Zhao, X.; Wu, Y.P.; Ren, G.; Ji, K.; Qian, W.W. Clustering Analysis of Ridership Patterns at Subway Stations: A Case in Nanjing, China. J. Urban Plan. Dev. 2019, 145, 04019005. [Google Scholar] [CrossRef]
- SayedMohammed, S.; Verma, A.; Dias, C.; Alhajyaseen, W.; Almukdad, A.; Aghabayk, K. Crowd Evacuation through Crossing Configurations: Effect of Crossing Angles and Walking Speeds on Speed Variation and Evacuation Time. Sustainability 2022, 14, 15366. [Google Scholar] [CrossRef]
- Yu, L.; Wang, Z.; Chen, F.; Li, Y.; Wang, W. Subway passengers’ wayfinding behaviors when exposed to signage: An experimental study in virtual reality with eye-tracker. Saf. Sci. 2023, 162, 106096. [Google Scholar] [CrossRef]
Figure 1.
Pedestrian walking characteristics on the stairs. (a) Interlayer facilities in Xiaozhai Station; (b) diagram of walking behavior on interlayer facilities.
Figure 1.
Pedestrian walking characteristics on the stairs. (a) Interlayer facilities in Xiaozhai Station; (b) diagram of walking behavior on interlayer facilities.

Figure 2.
Passenger stall near exit gate machine. (a) The scene at Xiaozhai Station; (b) flowline when avoiding staying passengers.
Figure 2.
Passenger stall near exit gate machine. (a) The scene at Xiaozhai Station; (b) flowline when avoiding staying passengers.

Figure 3.
Fan-shaped accumulation when pedestrians queue for the elevator.
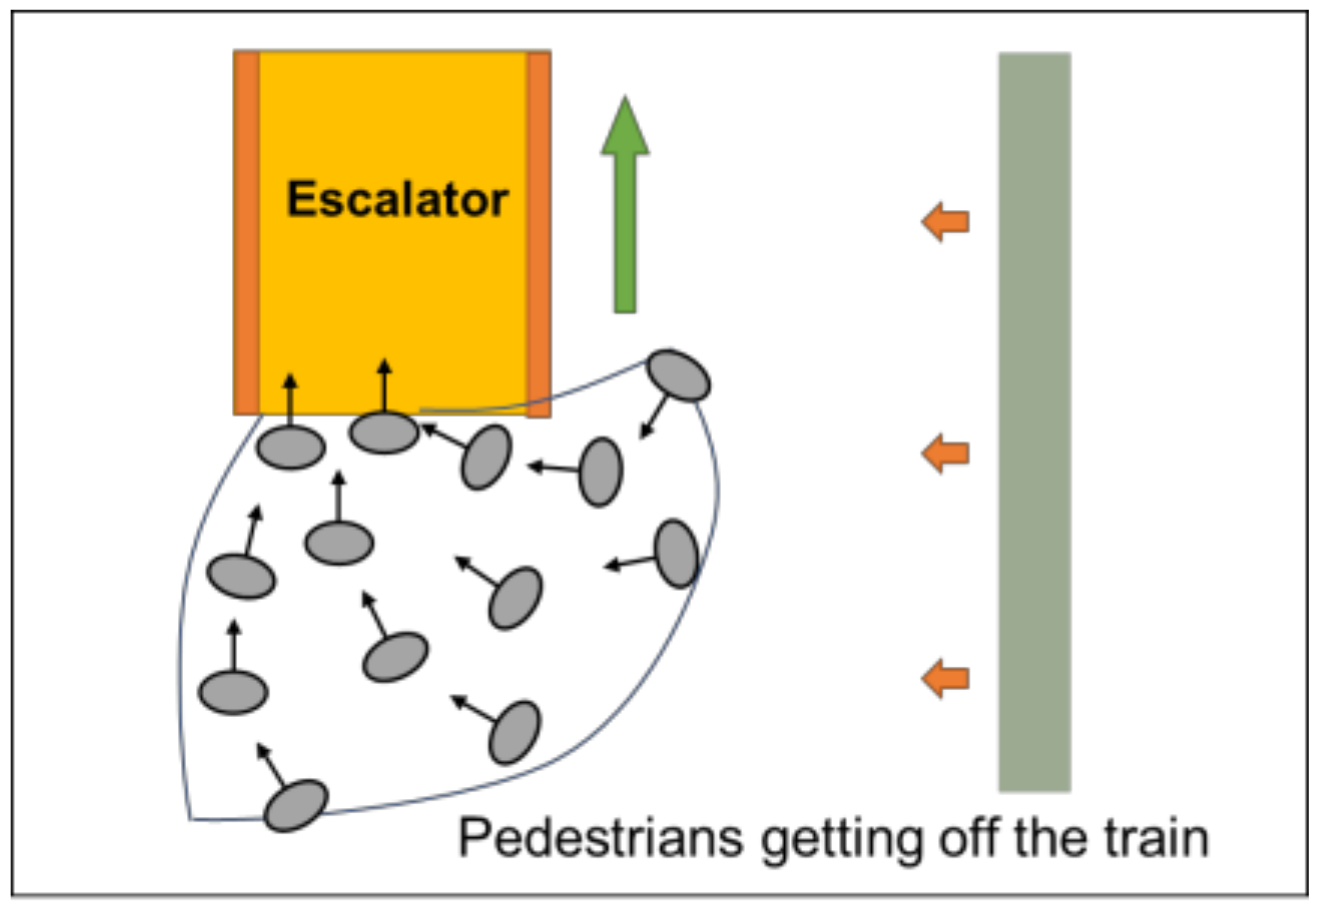
Figure 4.
Schematic diagram of information required for model establishment.
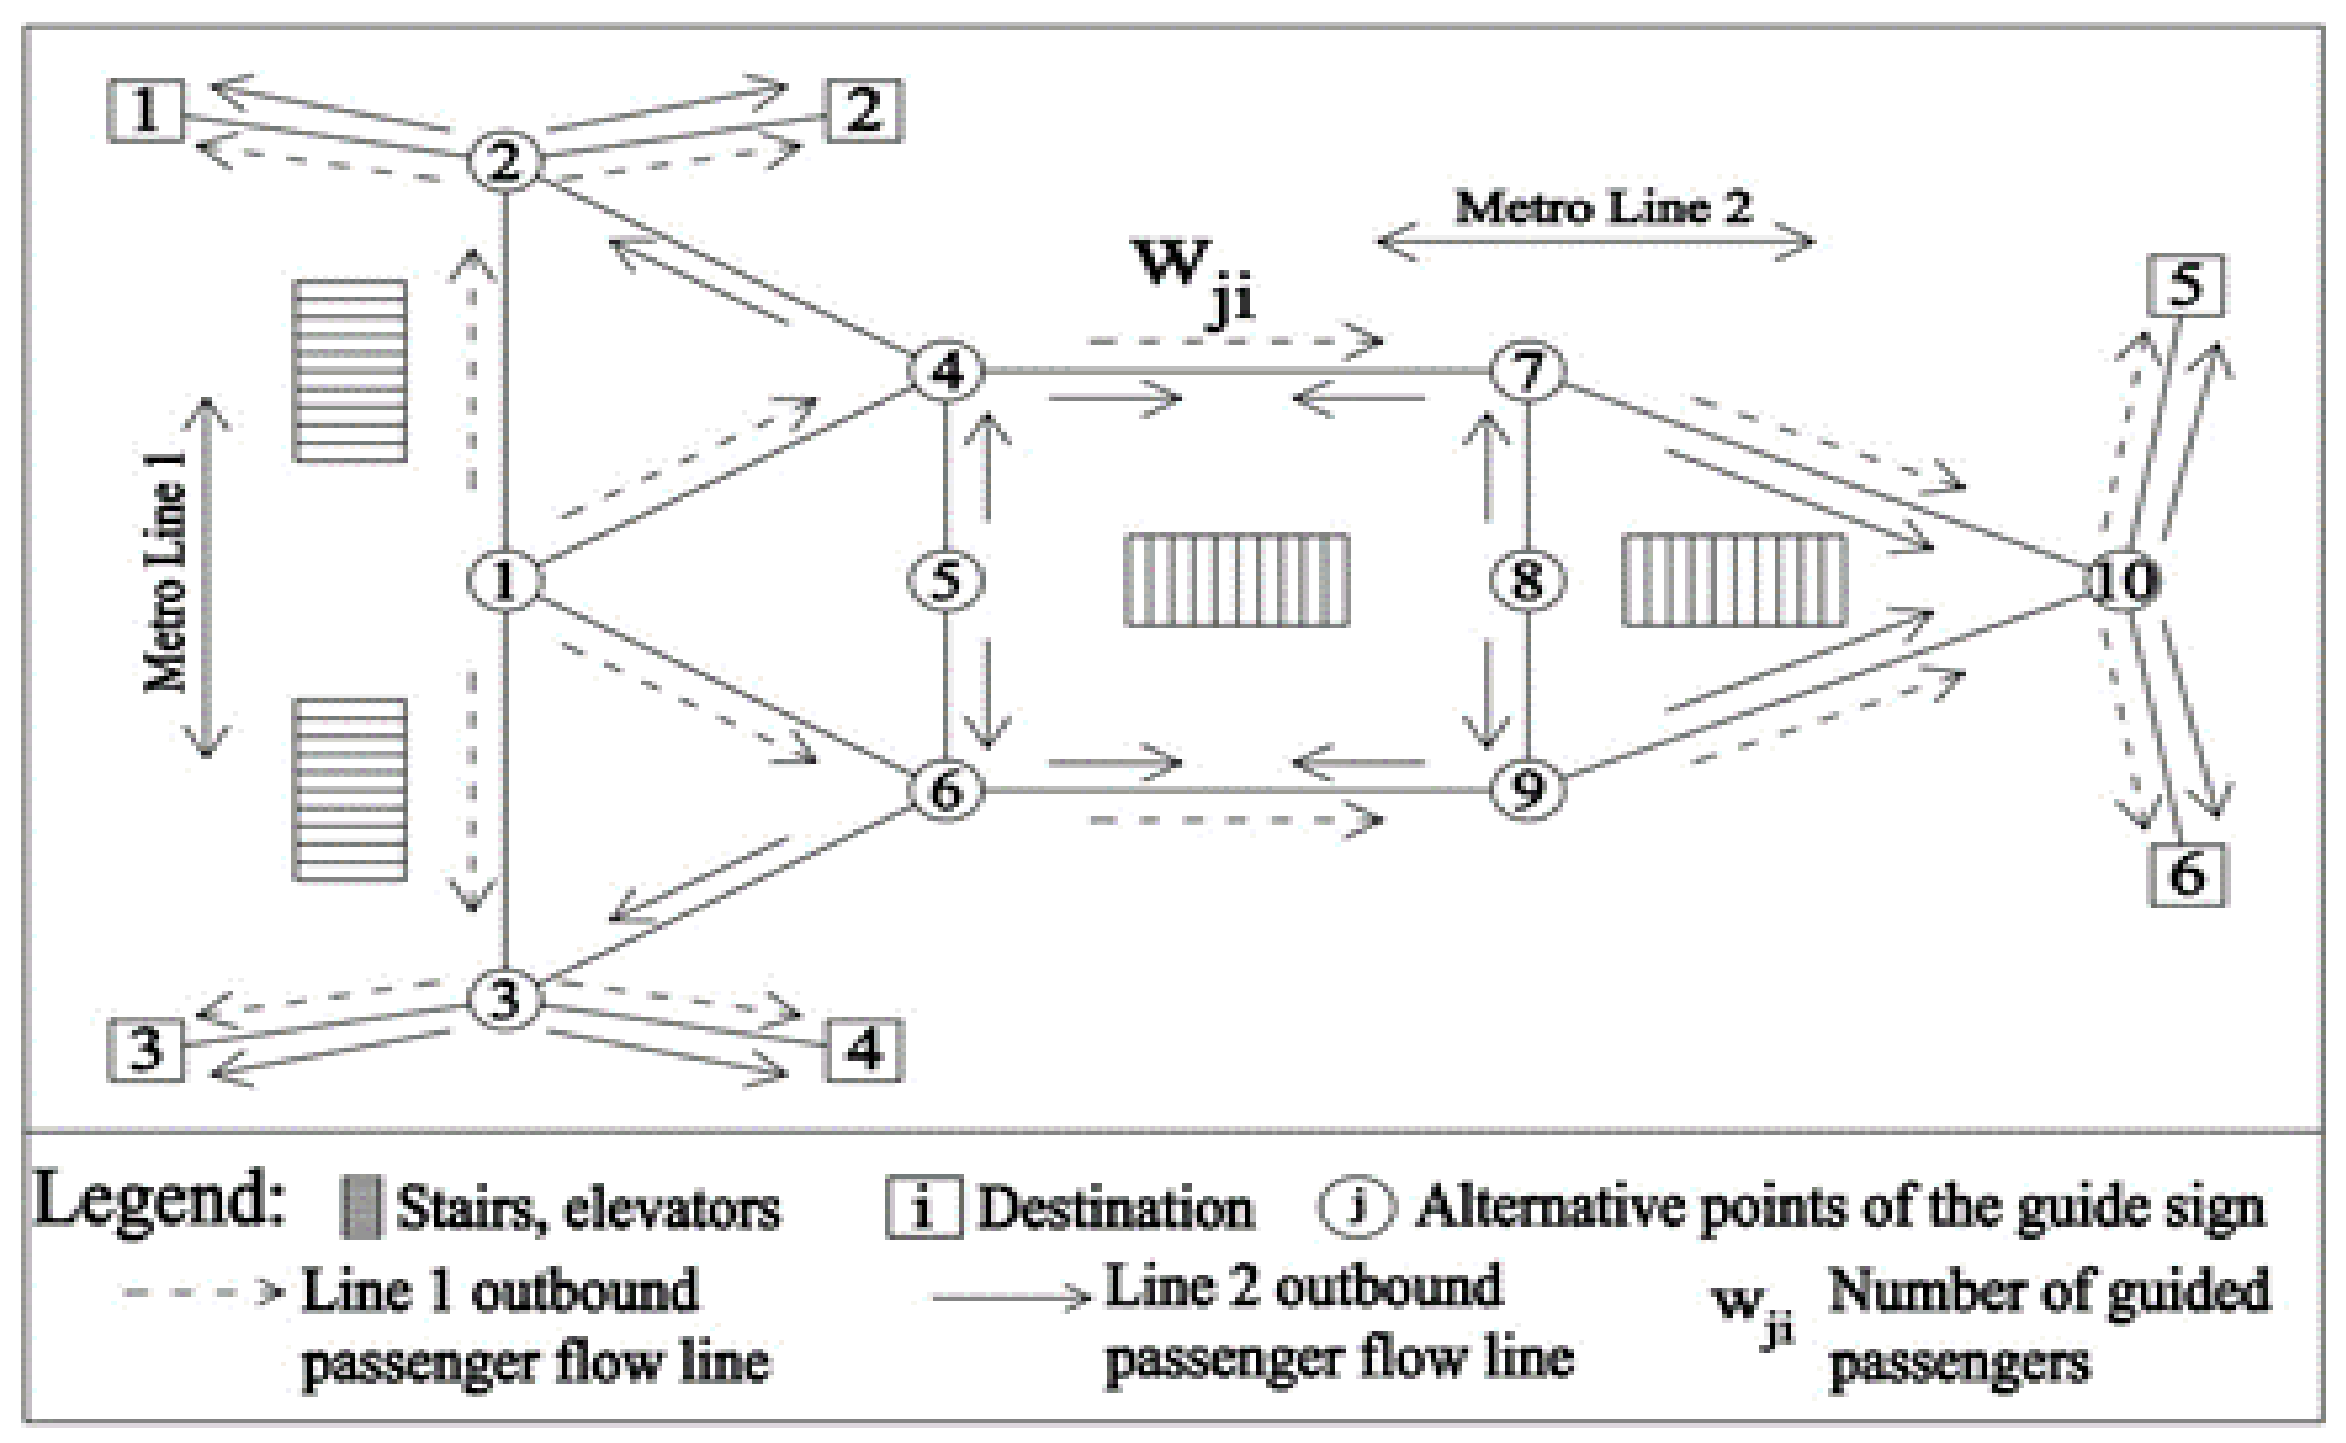
Figure 5.
Model curve leading to information memory forgetting.
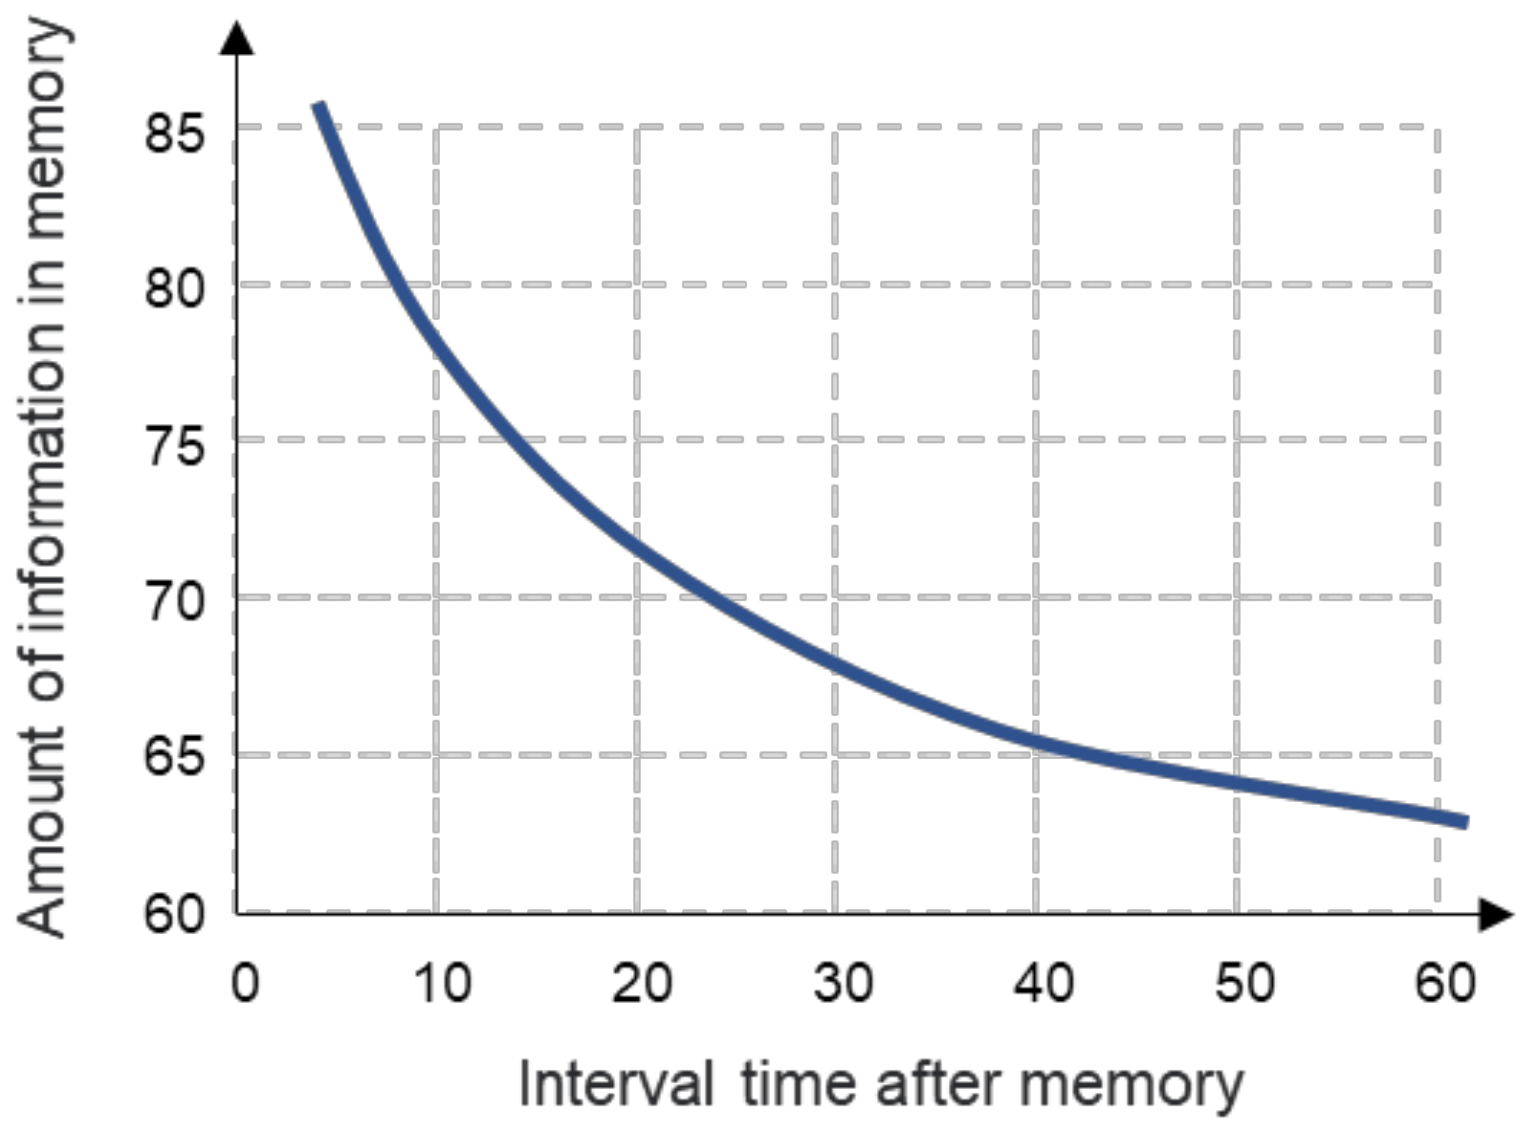
Figure 6.
Stages of information processing behavior.
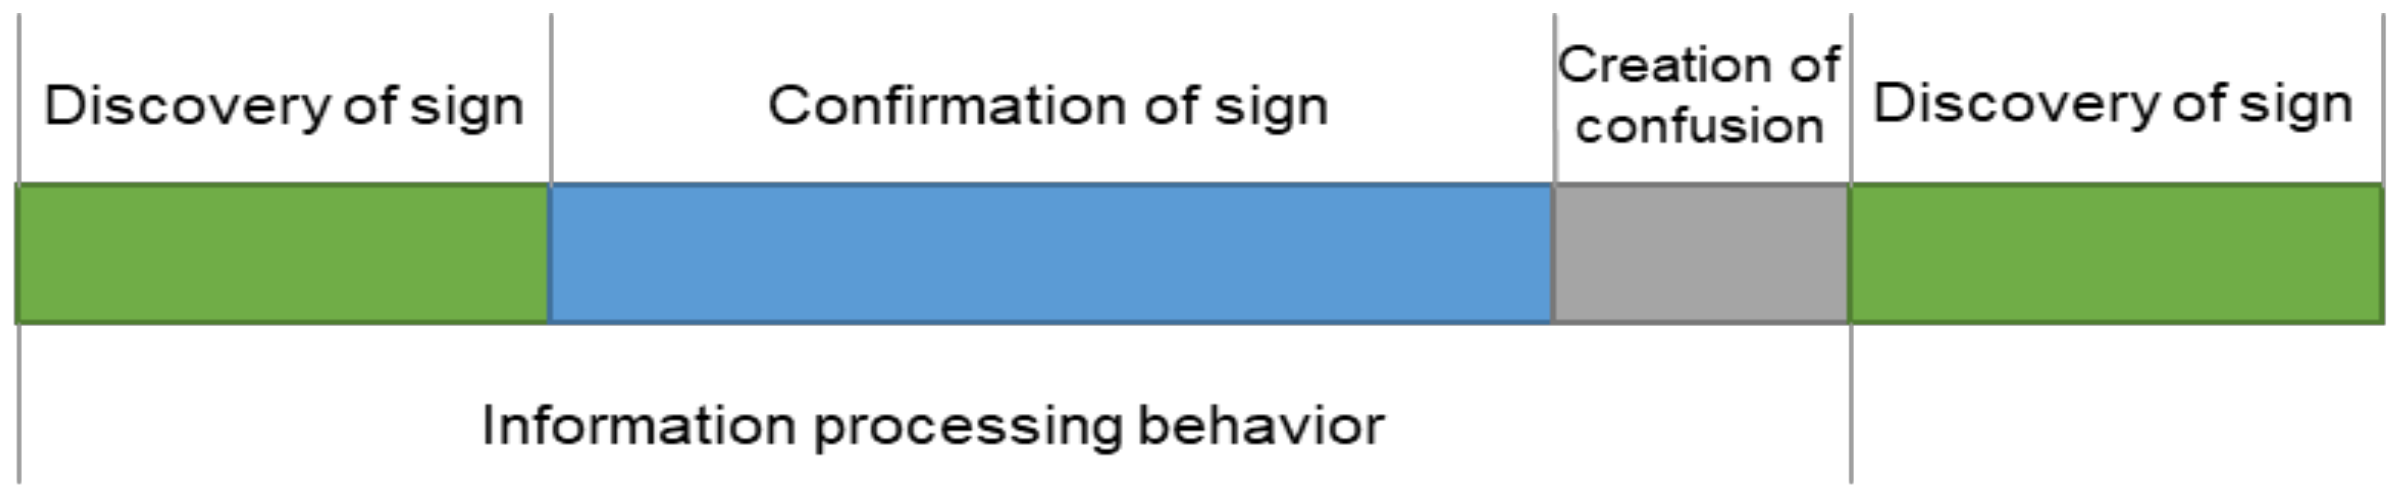
Figure 7.
Passenger streamlines and alternative points in the station hall.

Figure 8.
Passenger streamlines and alternative points in the platform hall.
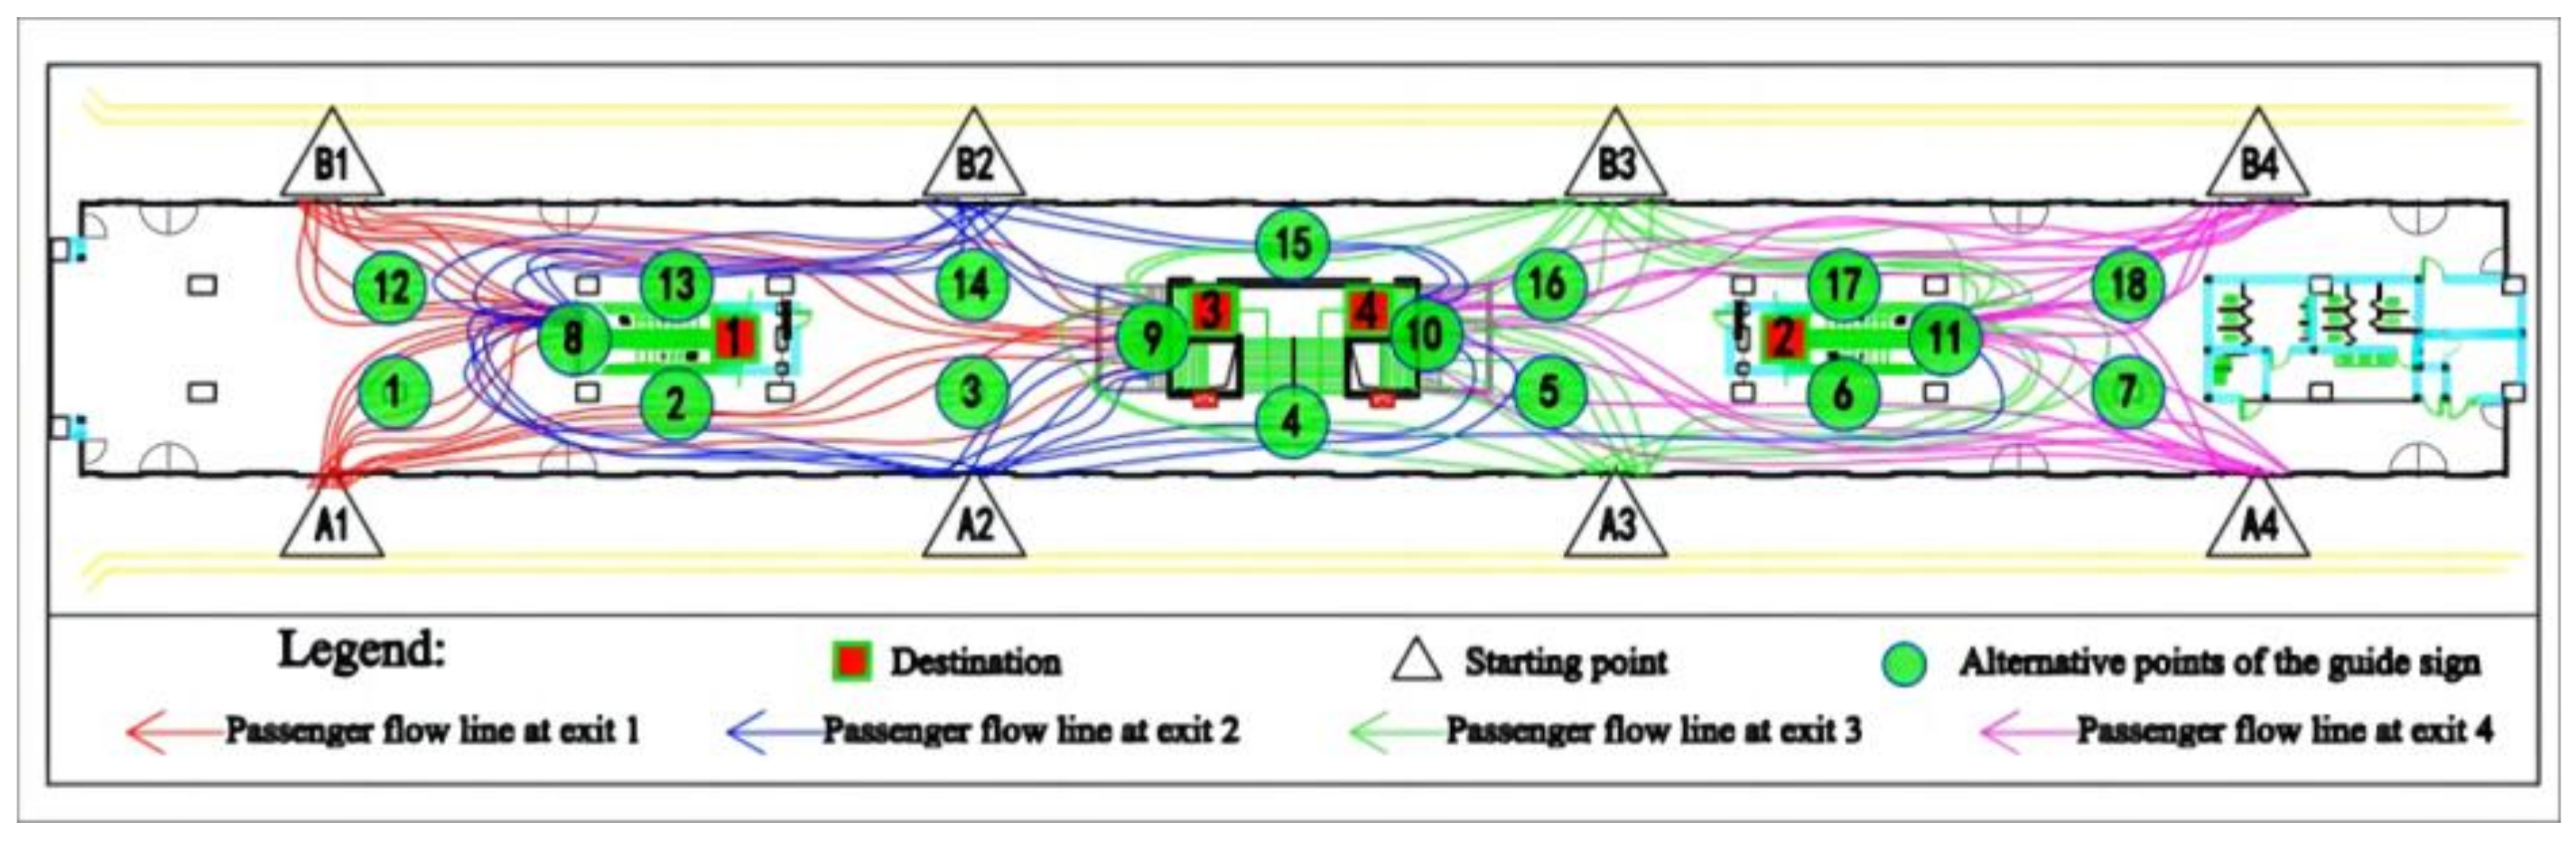
Figure 9.
Result of platform floor: (a) sign guide level growth trend; (b) schematic diagram of guide sign setting.
Figure 9.
Result of platform floor: (a) sign guide level growth trend; (b) schematic diagram of guide sign setting.
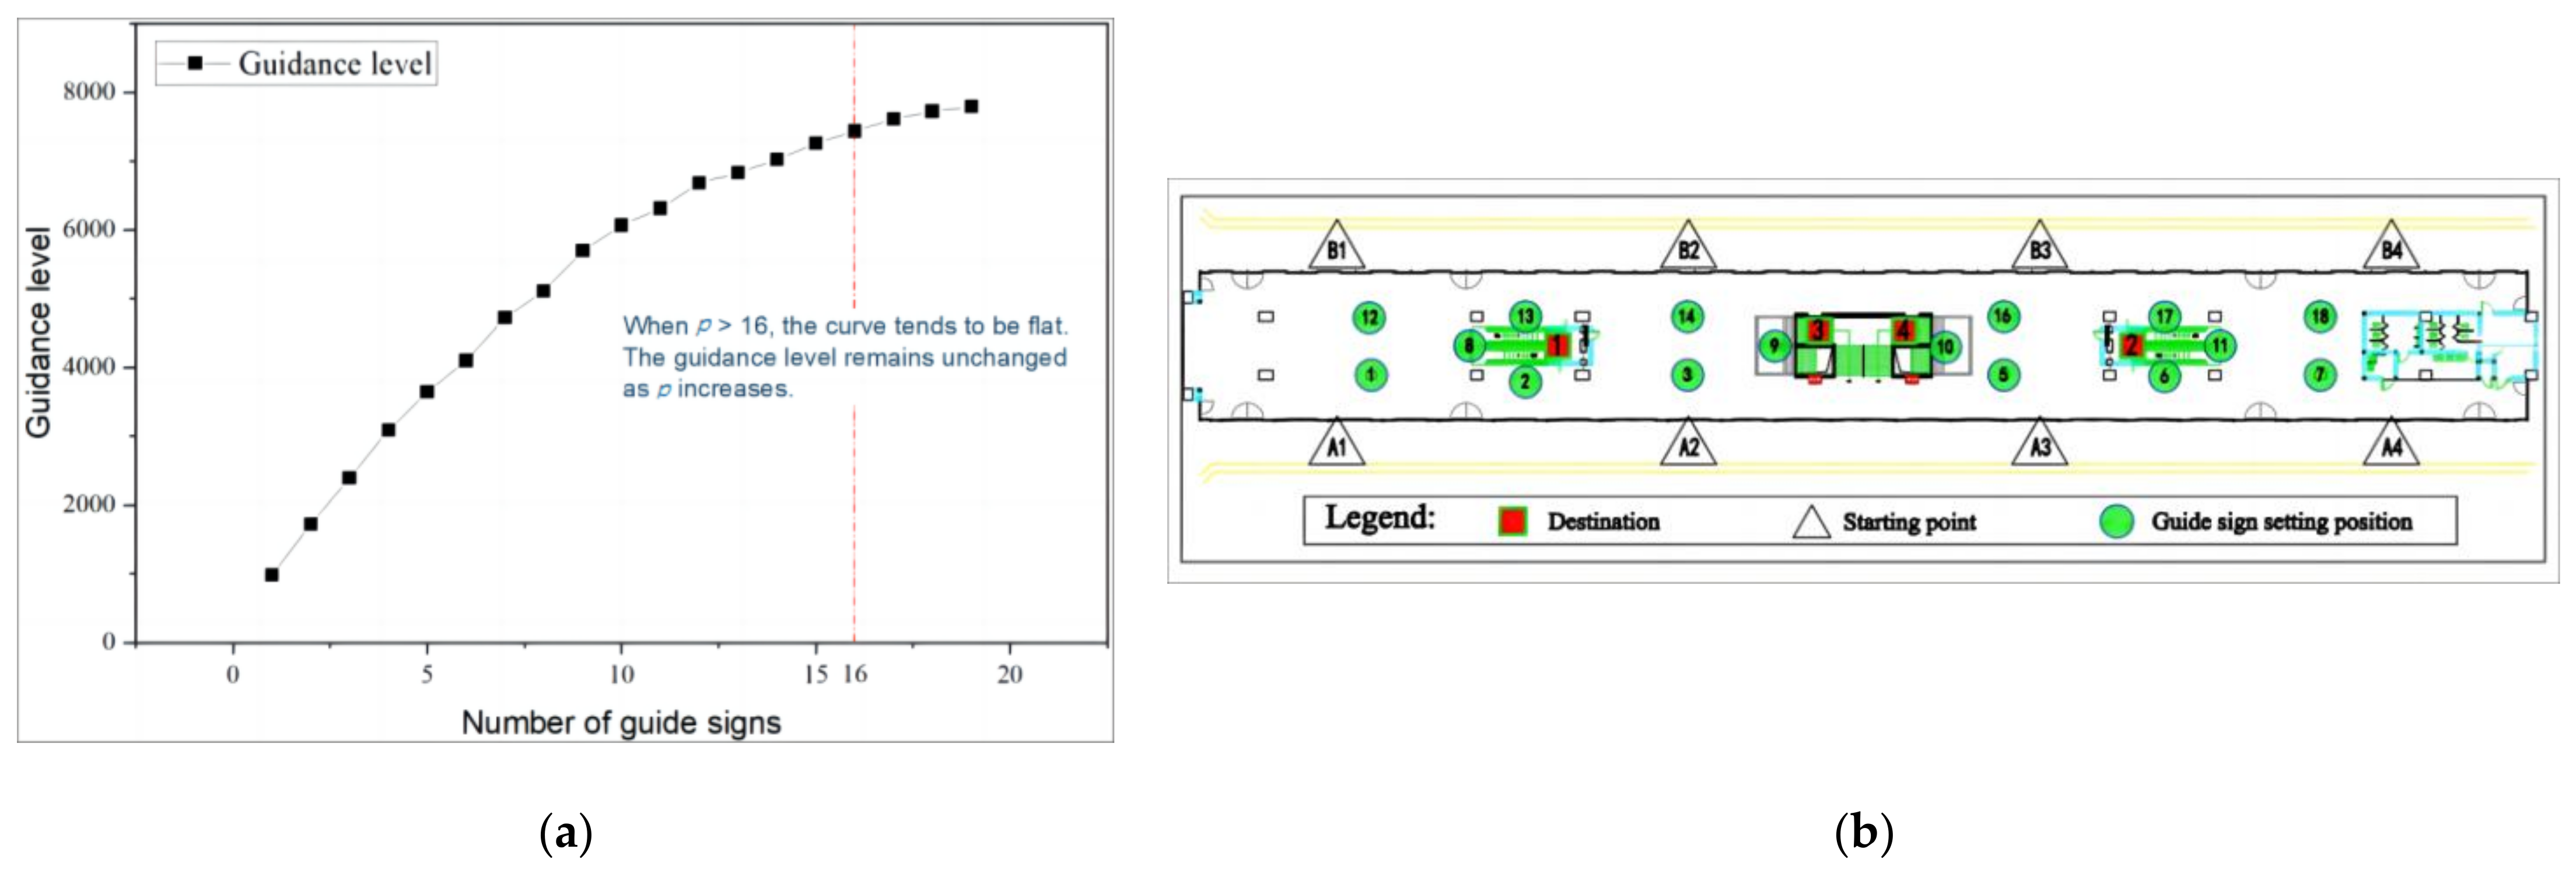
Figure 10.
Result of platform floor: (a) sign guide level growth trend; (b) schematic diagram of guide sign setting.
Figure 10.
Result of platform floor: (a) sign guide level growth trend; (b) schematic diagram of guide sign setting.
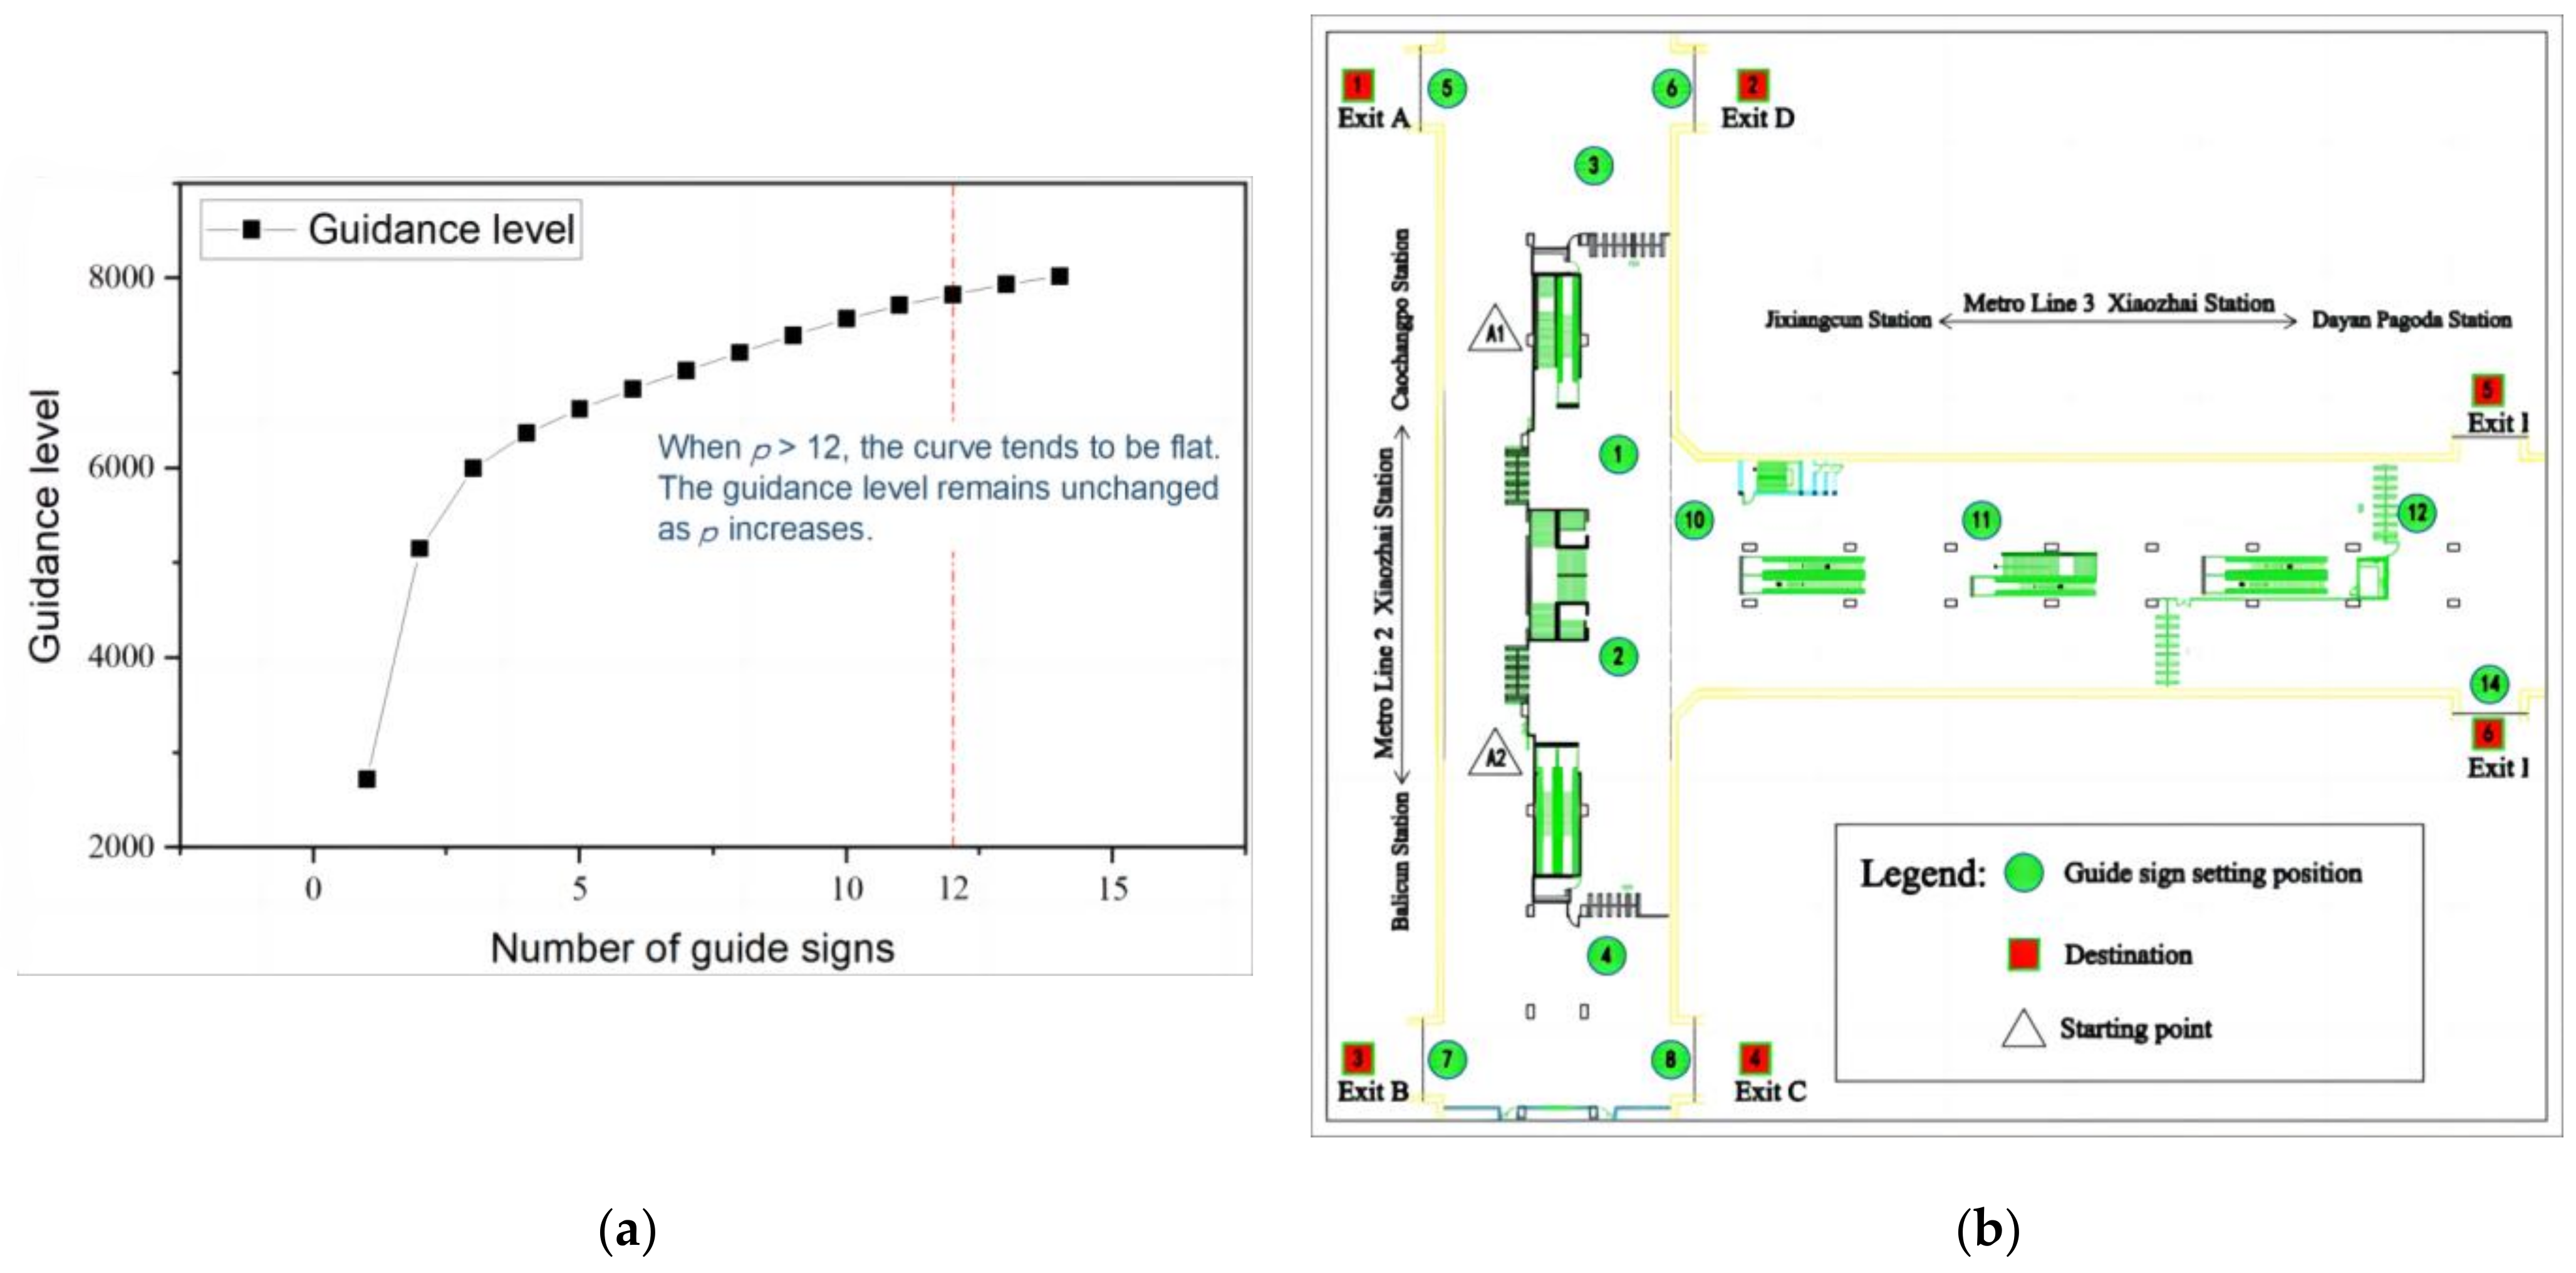
Figure 11.
Density map comparison: (a) before improvement; (b) after improvement.
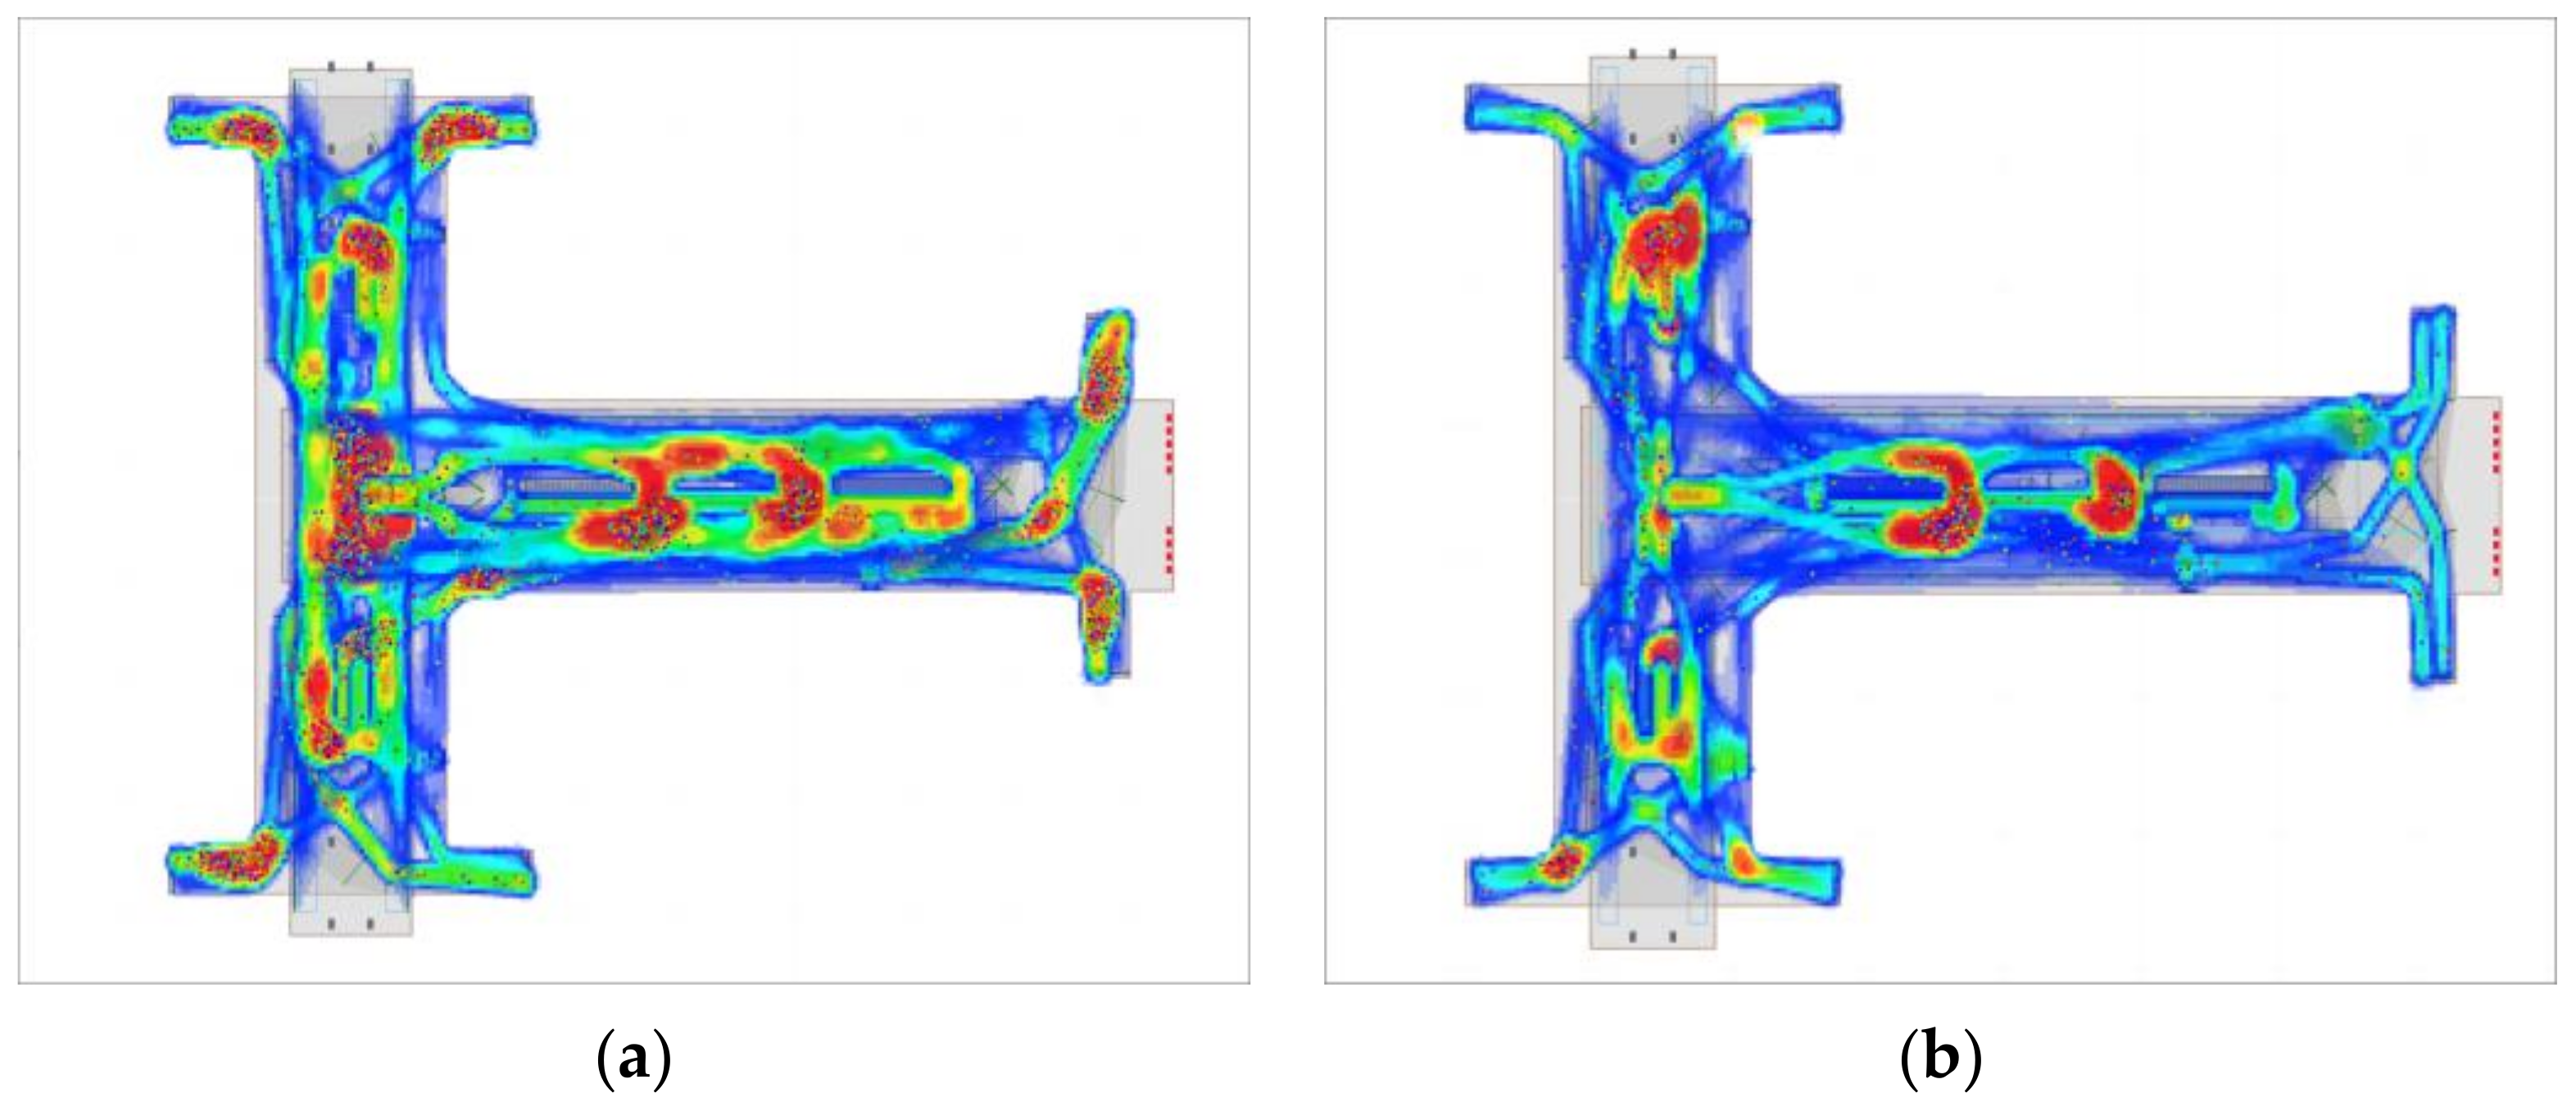
Figure 12.
Density comparison at bottleneck.

Table 1.
Partial statistics of passenger walking samples at Xiaozhai Station.
| Age | Gender | Level of Education | Walking Time of Each Space (s) | ||||||
|---|---|---|---|---|---|---|---|---|---|
| Platform | Interlayer Facilities | Station Hall | Horizontal Channel | ||||||
| Stair | Elevator | Open | Semi- Confined Channel | ||||||
| Adjacent Platforms | Non-Adjacent Platform | ||||||||
| 25 | Female | Bachelor | 27 | 40 | 43 | - | 96 | - | 89 |
| 22 | Female | College | 33 | 38 | 74 | - | 82 | 9 | - |
| 37 | Male | High | 29 | - | - | 41 + 27 + 25 | 49 | 16 | 72 |
| 15 | Male | Middle | 8 | - | 37 | 41 | 88 | 13 | - |
| 61 | Female | Primary | 12 | - | 69 | 41 | 119 | - | 93 |
| 31 | Male | Bachelor | 36 | 45 | 52 | - | 62 | - | 47 |
Table 2.
Average speeds at different positions in subway station.
| Location Type | Average Speed | |
|---|---|---|
| Horizontal channel | Open type | 0.85 m/s |
| Semi-closed type | 0.80 m/s | |
| Stairs | Adjacent platform | 0.69 m/s |
| Non-adjacent platform | 0.53 m/s | |
| Station hall layer | 1.21 m/s | |
| Platform layer | 1.35 m/s | |
Table 3.
Parameter summary.
| Type | Symbol | Definition | Value |
|---|---|---|---|
| Invariant parameters | Weight coefficient | 1 or 1.5 | |
| Time required to reach the maximum distance at position | 15 s | ||
| Time required to reach the minimum distance at position | 3 s | ||
| The average speed corresponding to different positions | Table 1 | ||
| Unknown parameters | Number of crossing points | Obtained by pedestrian tracking experiment | |
| Number of alternative points | |||
| Guided passenger volume |
Table 4.
Guide passenger flow statistics for the alternative points of the guide mark at the platform level.
Table 4.
Guide passenger flow statistics for the alternative points of the guide mark at the platform level.
| Starting Point | Destination | Passed Guided Point | Guided Passenger Volume | Starting Point | Destination | Passed Guided Point | Guided Passenger Volume |
|---|---|---|---|---|---|---|---|
| A1 | 1 | 1, 8 | 130 | B1 | 1 | 12, 8 | 84 |
| 3 | 1, 2, 3, 9 | 68 | 3 | 12, 13, 14, 9 | 78 | ||
| A2 | 1 | 3, 2, 1, 8 | 159 | B2 | 1 | 14, 13, 12, 8 | 149 |
| 3 | 3, 9 | 35 | 3 | 14, 9 | 47 | ||
| 4 | 3, 4, 5, 10 | 13 | 4 | 14, 15, 16, 10 | 20 | ||
| A3 | 4 | 5, 10 | 66 | B3 | 4 | 16, 10 | 67 |
| 3 | 5, 4, 3, 9 | 17 | 3 | 16, 15, 14, 9 | 32 | ||
| 2 | 5, 6, 7, 11 | 137 | 2 | 16, 17, 18, 11 | 135 | ||
| A4 | 2 | 7, 11 | 110 | B4 | 2 | 18, 11 | 131 |
| 3 | 7, 6, 5, 10 | 76 | 3 | 18, 17, 16, 10 | 67 |
Table 5.
Guided passenger flow statistics for alternative points of guide signs in station hall layer.
Table 5.
Guided passenger flow statistics for alternative points of guide signs in station hall layer.
| Starting Point | Destination | Passed Guided Point | Guided Passenger Volume | Starting Point | Destination | Passed Guided Point | Guided Passenger Volume | ||||
|---|---|---|---|---|---|---|---|---|---|---|---|
| A1 | 1 | 1, 3 | 5 | 231 | 93 | A2 | 1 | 2, 1, 3 | 5 | 196 | 78 |
| 2 | 6 | 138 | 2 | 6 | 118 | ||||||
| 3 | 1, 2, 4 | 7 | 189 | 92 | 3 | 2, 4 | 7 | 188 | 99 | ||
| 4 | 8 | 97 | 4 | 8 | 89 | ||||||
| 5 | 1, 10, 11, 12 | 13 | 102 | 45 | 5 | 2, 10, 11, 12;2, 9, 11, 12 | 13 | 59; 70 | 15 | ||
| 28 | |||||||||||
| 6 | 14 | 57 | 6 | 14 | 44 | ||||||
| 42 | |||||||||||
Table 6.
Statistics of each parameter of the objective function.
| 1 | 1, 3 | , | 130, 68 | 2, 4 |
| 2 | 1, 3 | , | 159, 68 | 3, 3 |
| 3 | 1, 3, 4 | , , | 159, 35, 13 | 4, 2, 4 |
| 4 | 3, 4 | , | 17, 13 | 3, 3 |
| 5 | 2, 3, 4 | , , | 137, 17, 66 | 4, 4, 2 |
| … | … | … | … | … |
| 16 | 2, 3, 4 | , , | 135, 32, 67 | 4, 4, 2 |
| 17 | 2, 4 | , | 135, 67 | 3, 3 |
| 18 | 2, 4 | , | 131, 67 | 2, 4 |
Table 7.
Comparison of time consumption.
| Time Consumption before Optimization (s) | Time Consumption after Optimization (s) | Time Reduction (s) | Reduction Percentage (s) | |
|---|---|---|---|---|
| departure of Line 2 | 313.89 | 295.38 | 18.51 | 5.90% |
| departure of Line 3 | 305.52 | 296.43 | 9.09 | 2.98% |
| transfer from Line 2 to Line 3 | 184.02 | 180.44 | 3.58 | 1.95% |
| transfer from Line 3 to Line 2 | 311.33 | 296.6 | 14.73 | 4.73% |
Disclaimer/Publisher’s Note: The statements, opinions and data contained in all publications are solely those of the individual author(s) and contributor(s) and not of MDPI and/or the editor(s). MDPI and/or the editor(s) disclaim responsibility for any injury to people or property resulting from any ideas, methods, instructions or products referred to in the content. |
© 2023 by the authors. Licensee MDPI, Basel, Switzerland. This article is an open access article distributed under the terms and conditions of the Creative Commons Attribution (CC BY) license (https://creativecommons.org/licenses/by/4.0/).
Share and Cite
MDPI and ACS Style
Suo, Y.; Lei, B.; Xun, T.; Li, N.; Lei, D.; Luo, L.; Cao, X. Optimization Method of Subway Station Guide Sign Based on Pedestrian Walking Behavior. Sustainability 2023, 15, 12690. https://doi.org/10.3390/su151712690
AMA Style
Suo Y, Lei B, Xun T, Li N, Lei D, Luo L, Cao X. Optimization Method of Subway Station Guide Sign Based on Pedestrian Walking Behavior. Sustainability. 2023; 15(17):12690. https://doi.org/10.3390/su151712690
Chicago/Turabian StyleSuo, Yifei, Bin Lei, Tianxiang Xun, Na Li, Dongbo Lei, Linlin Luo, and Xiaoqin Cao. 2023. "Optimization Method of Subway Station Guide Sign Based on Pedestrian Walking Behavior" Sustainability 15, no. 17: 12690. https://doi.org/10.3390/su151712690
Note that from the first issue of 2016, this journal uses article numbers instead of page numbers. See further details here.