

Machine Learning Techniques in Predicting Bottom Hole Temperature and Remote Sensing for Assessment of Geothermal Potential in the Kingdom of Saudi Arabia
 ,
,  ,
,  , ,
, ,
Abstract
:1. Introduction
2. Geological Setting and Study Area Description
3. Materials and Methods
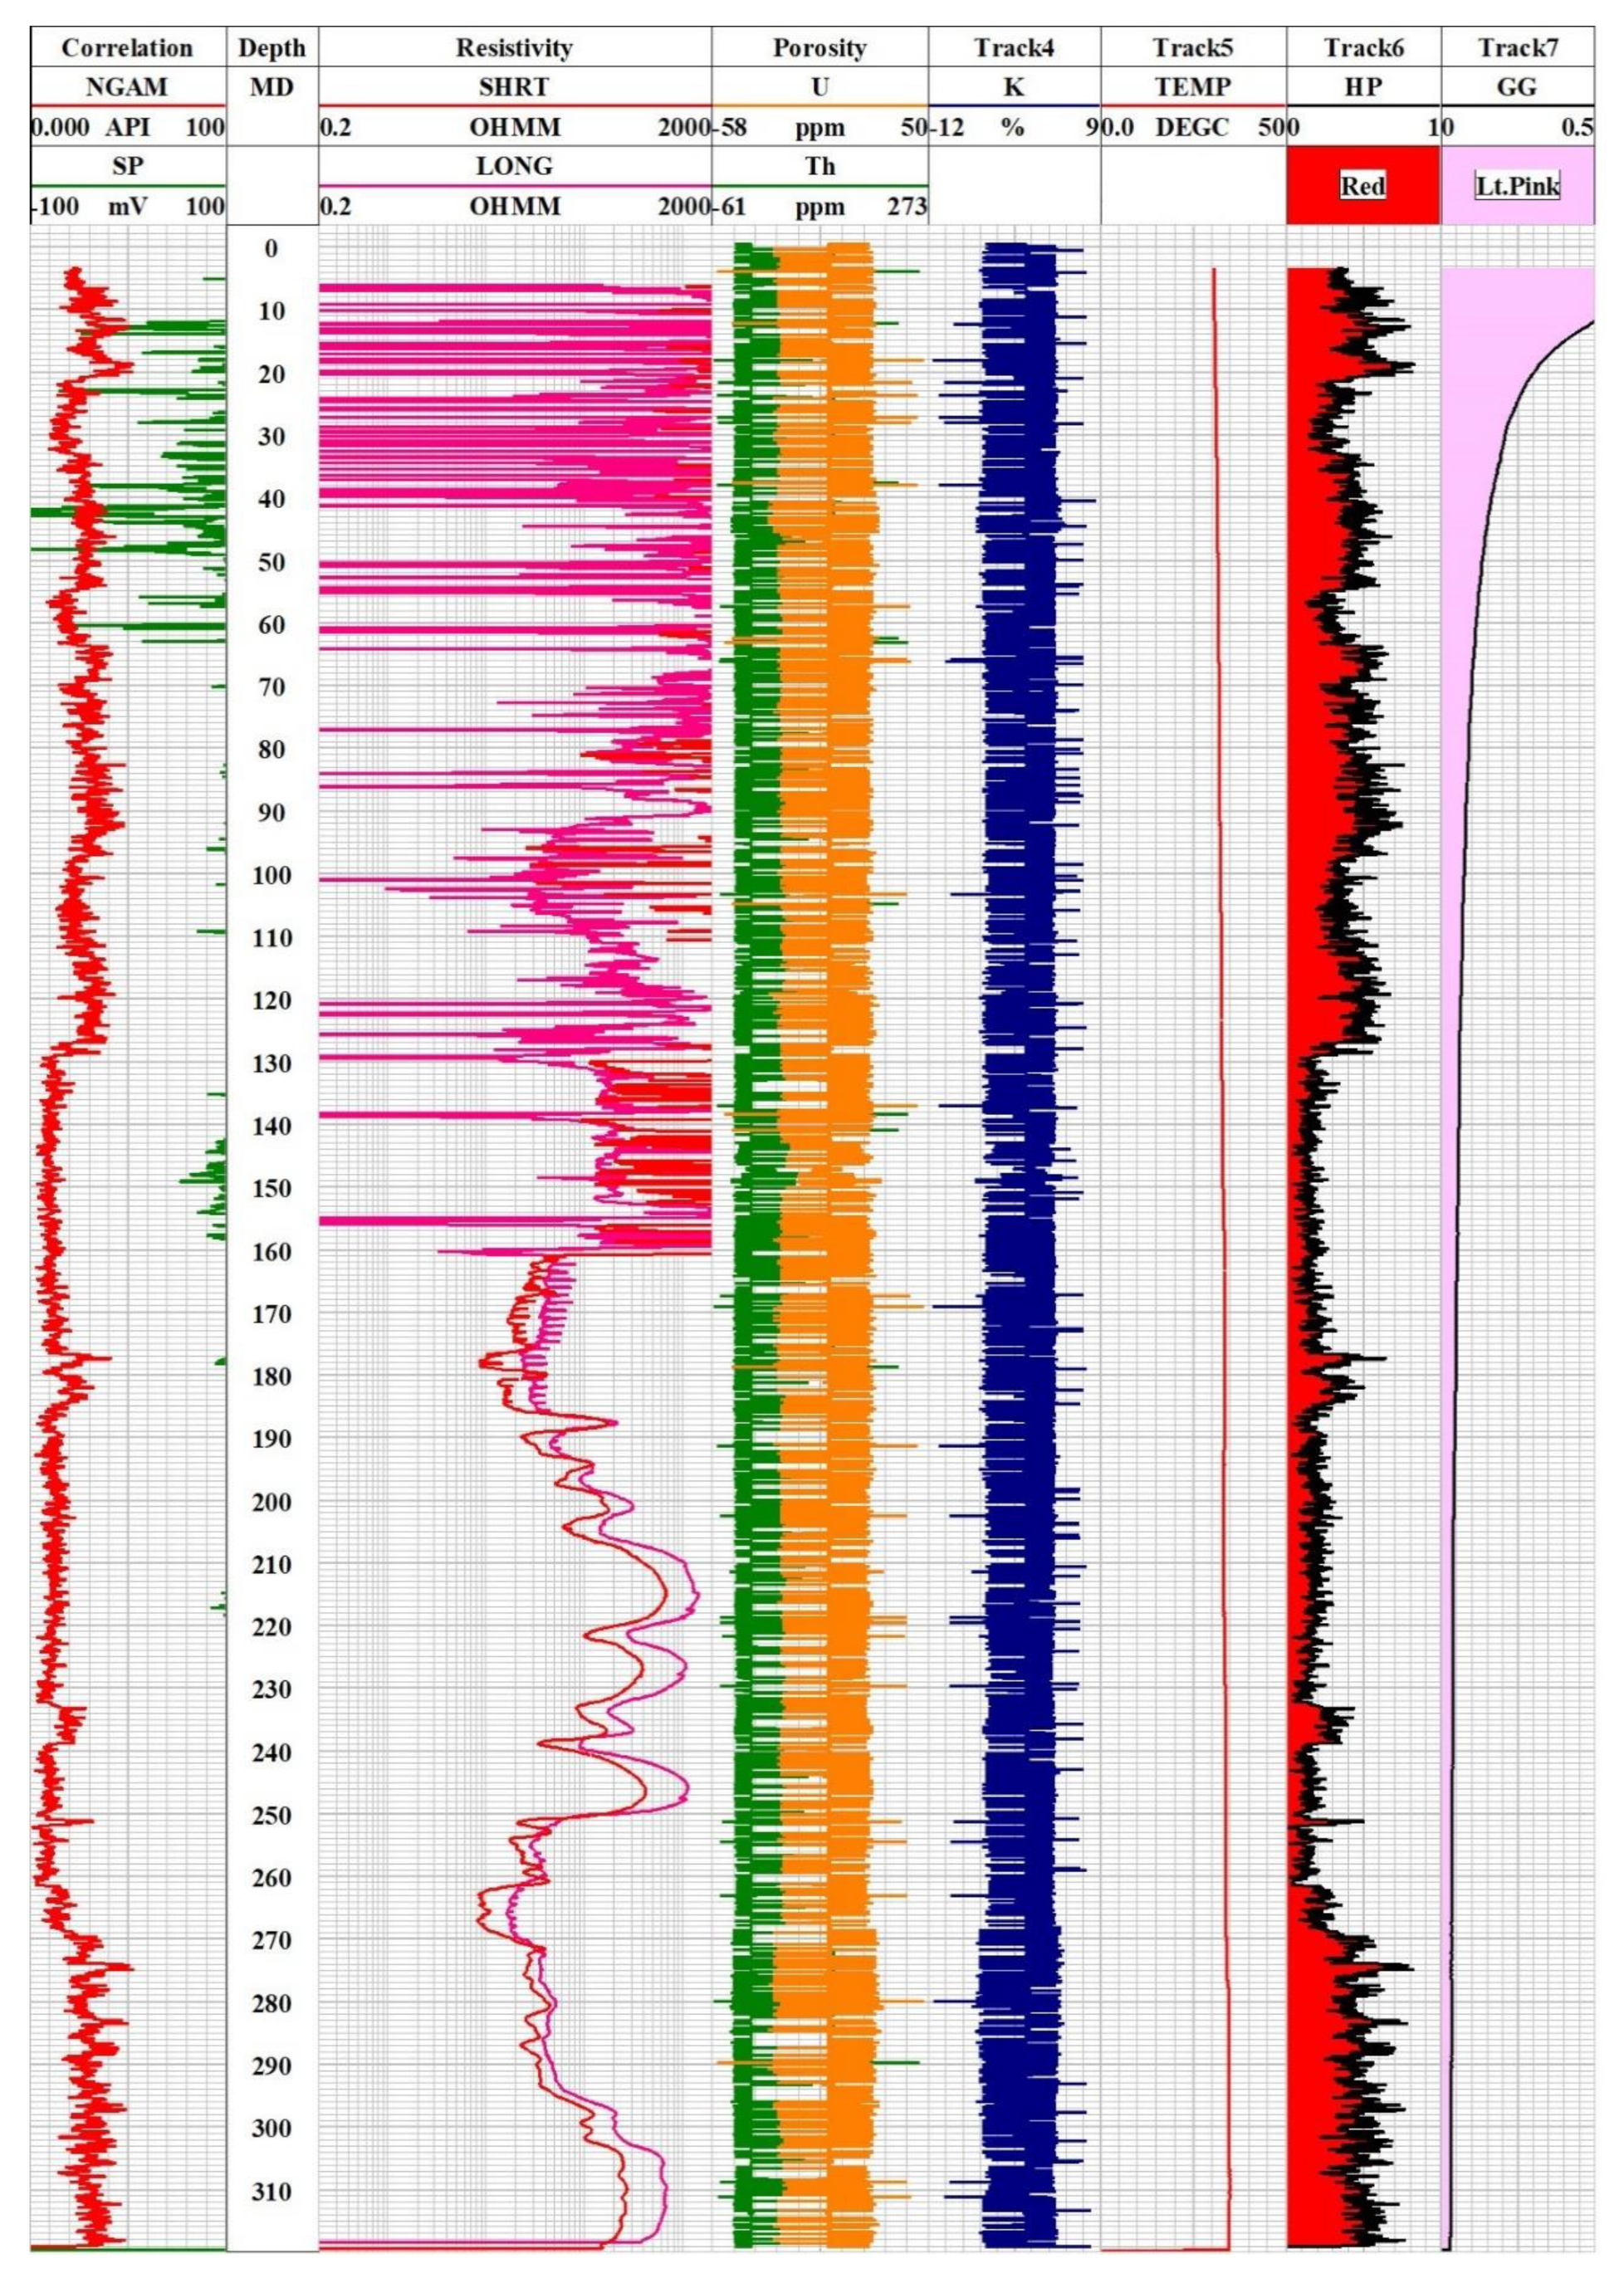
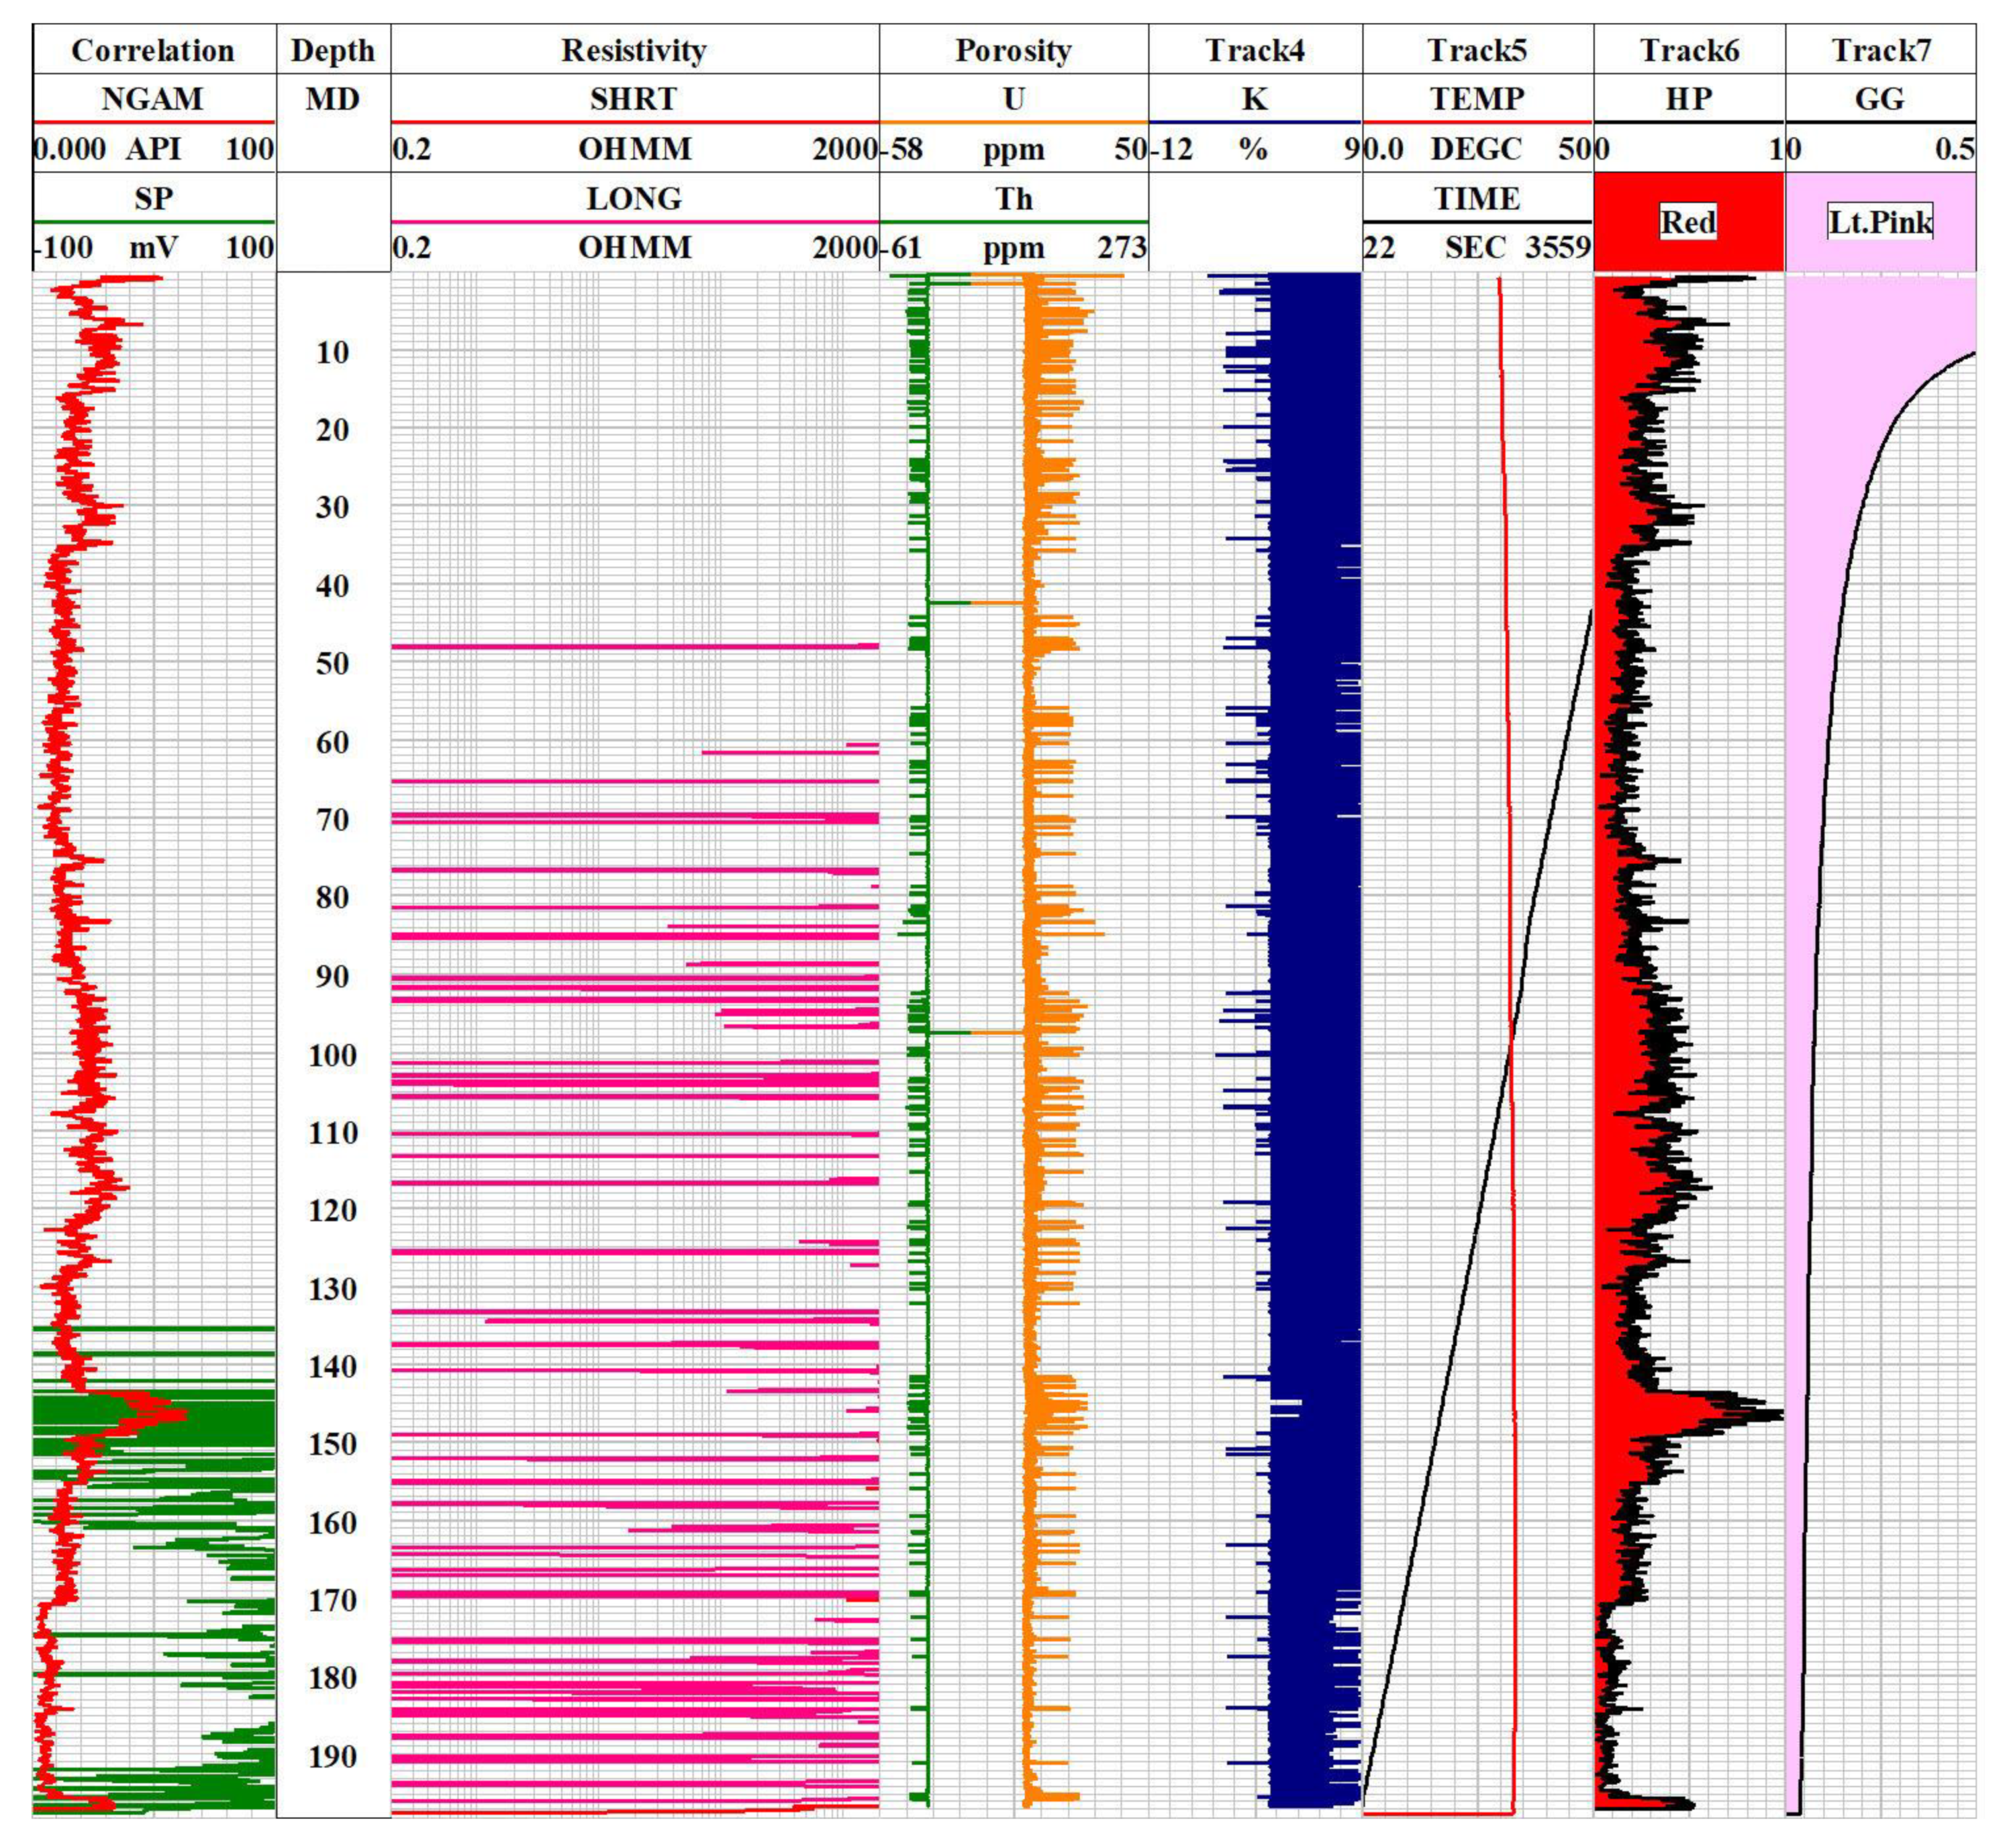
3.1. Well Logs Analysis
3.1.1. Subsurface Temperature Mapping
3.1.2. Heat Production (HP)
3.1.3. Geothermal Gradient
3.1.4. Temperature Prediction Using Machine Learning
3.2. Magnetic Data
3.3. LST and NDVI and CO2 Emissions
4. Results and Discussions
4.1. Well Logs Interpretation
4.1.1. Subsurface Temperature Mapping
4.1.2. Heat Production and Geothermal Gradient
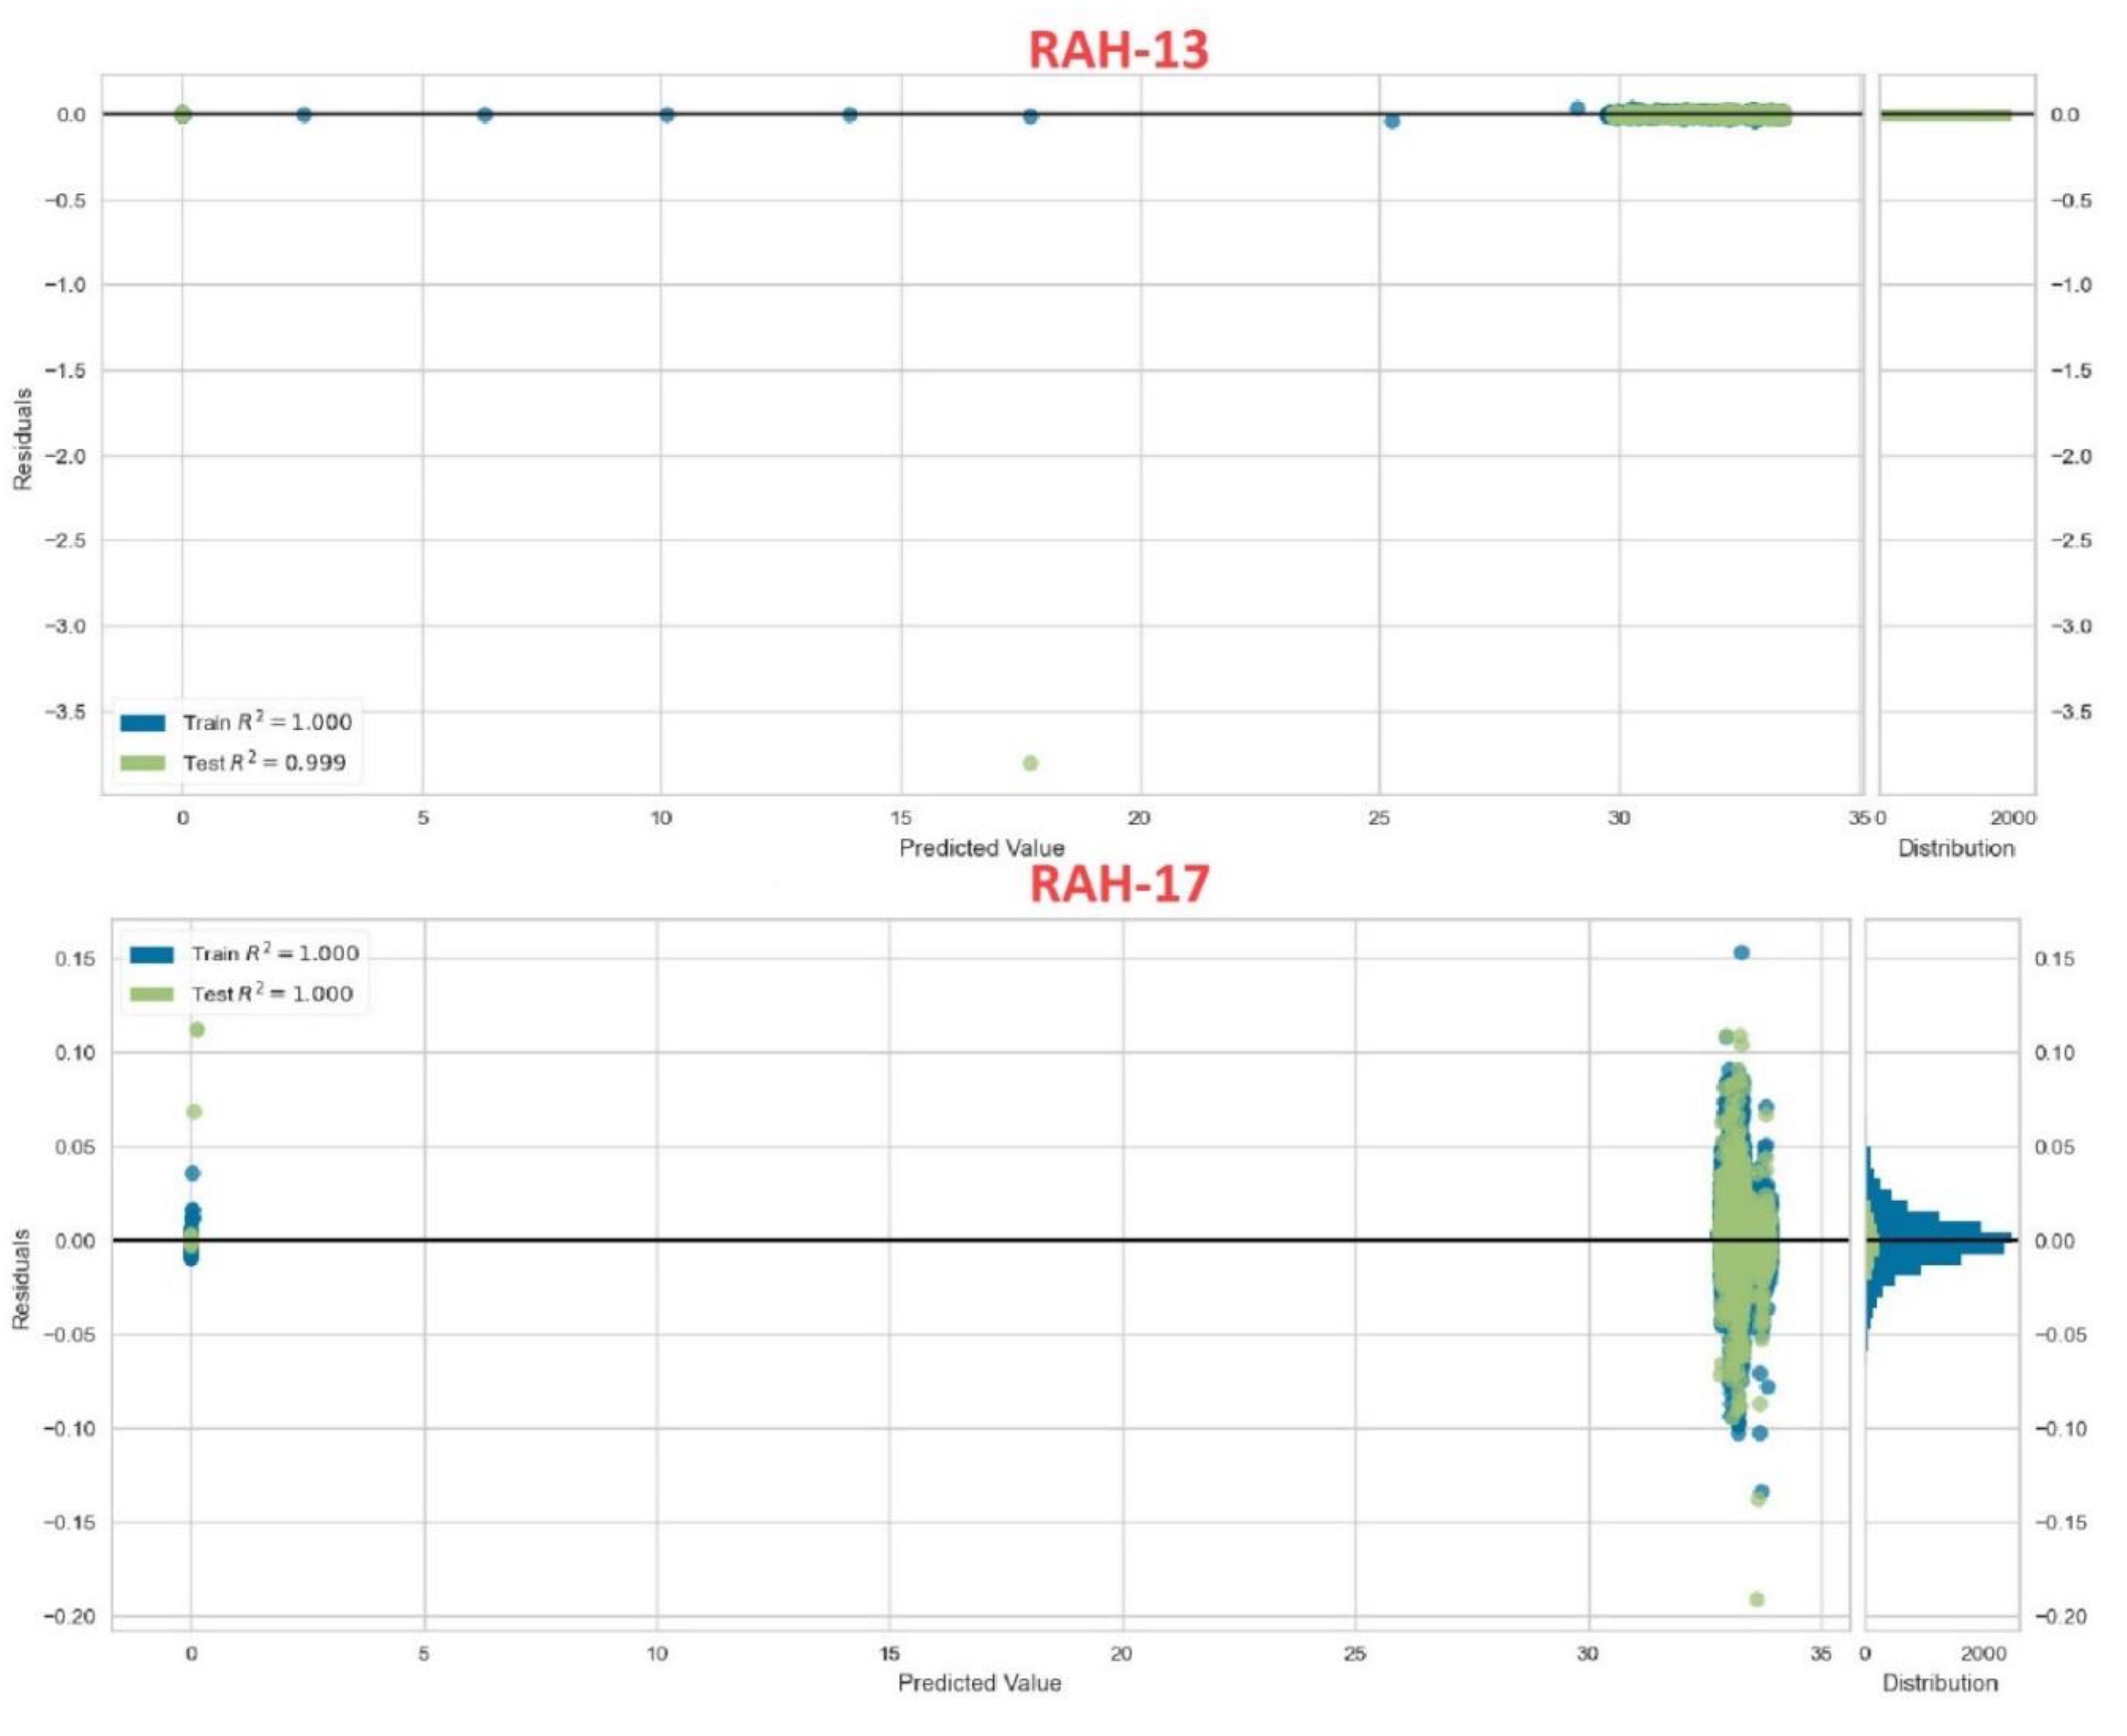
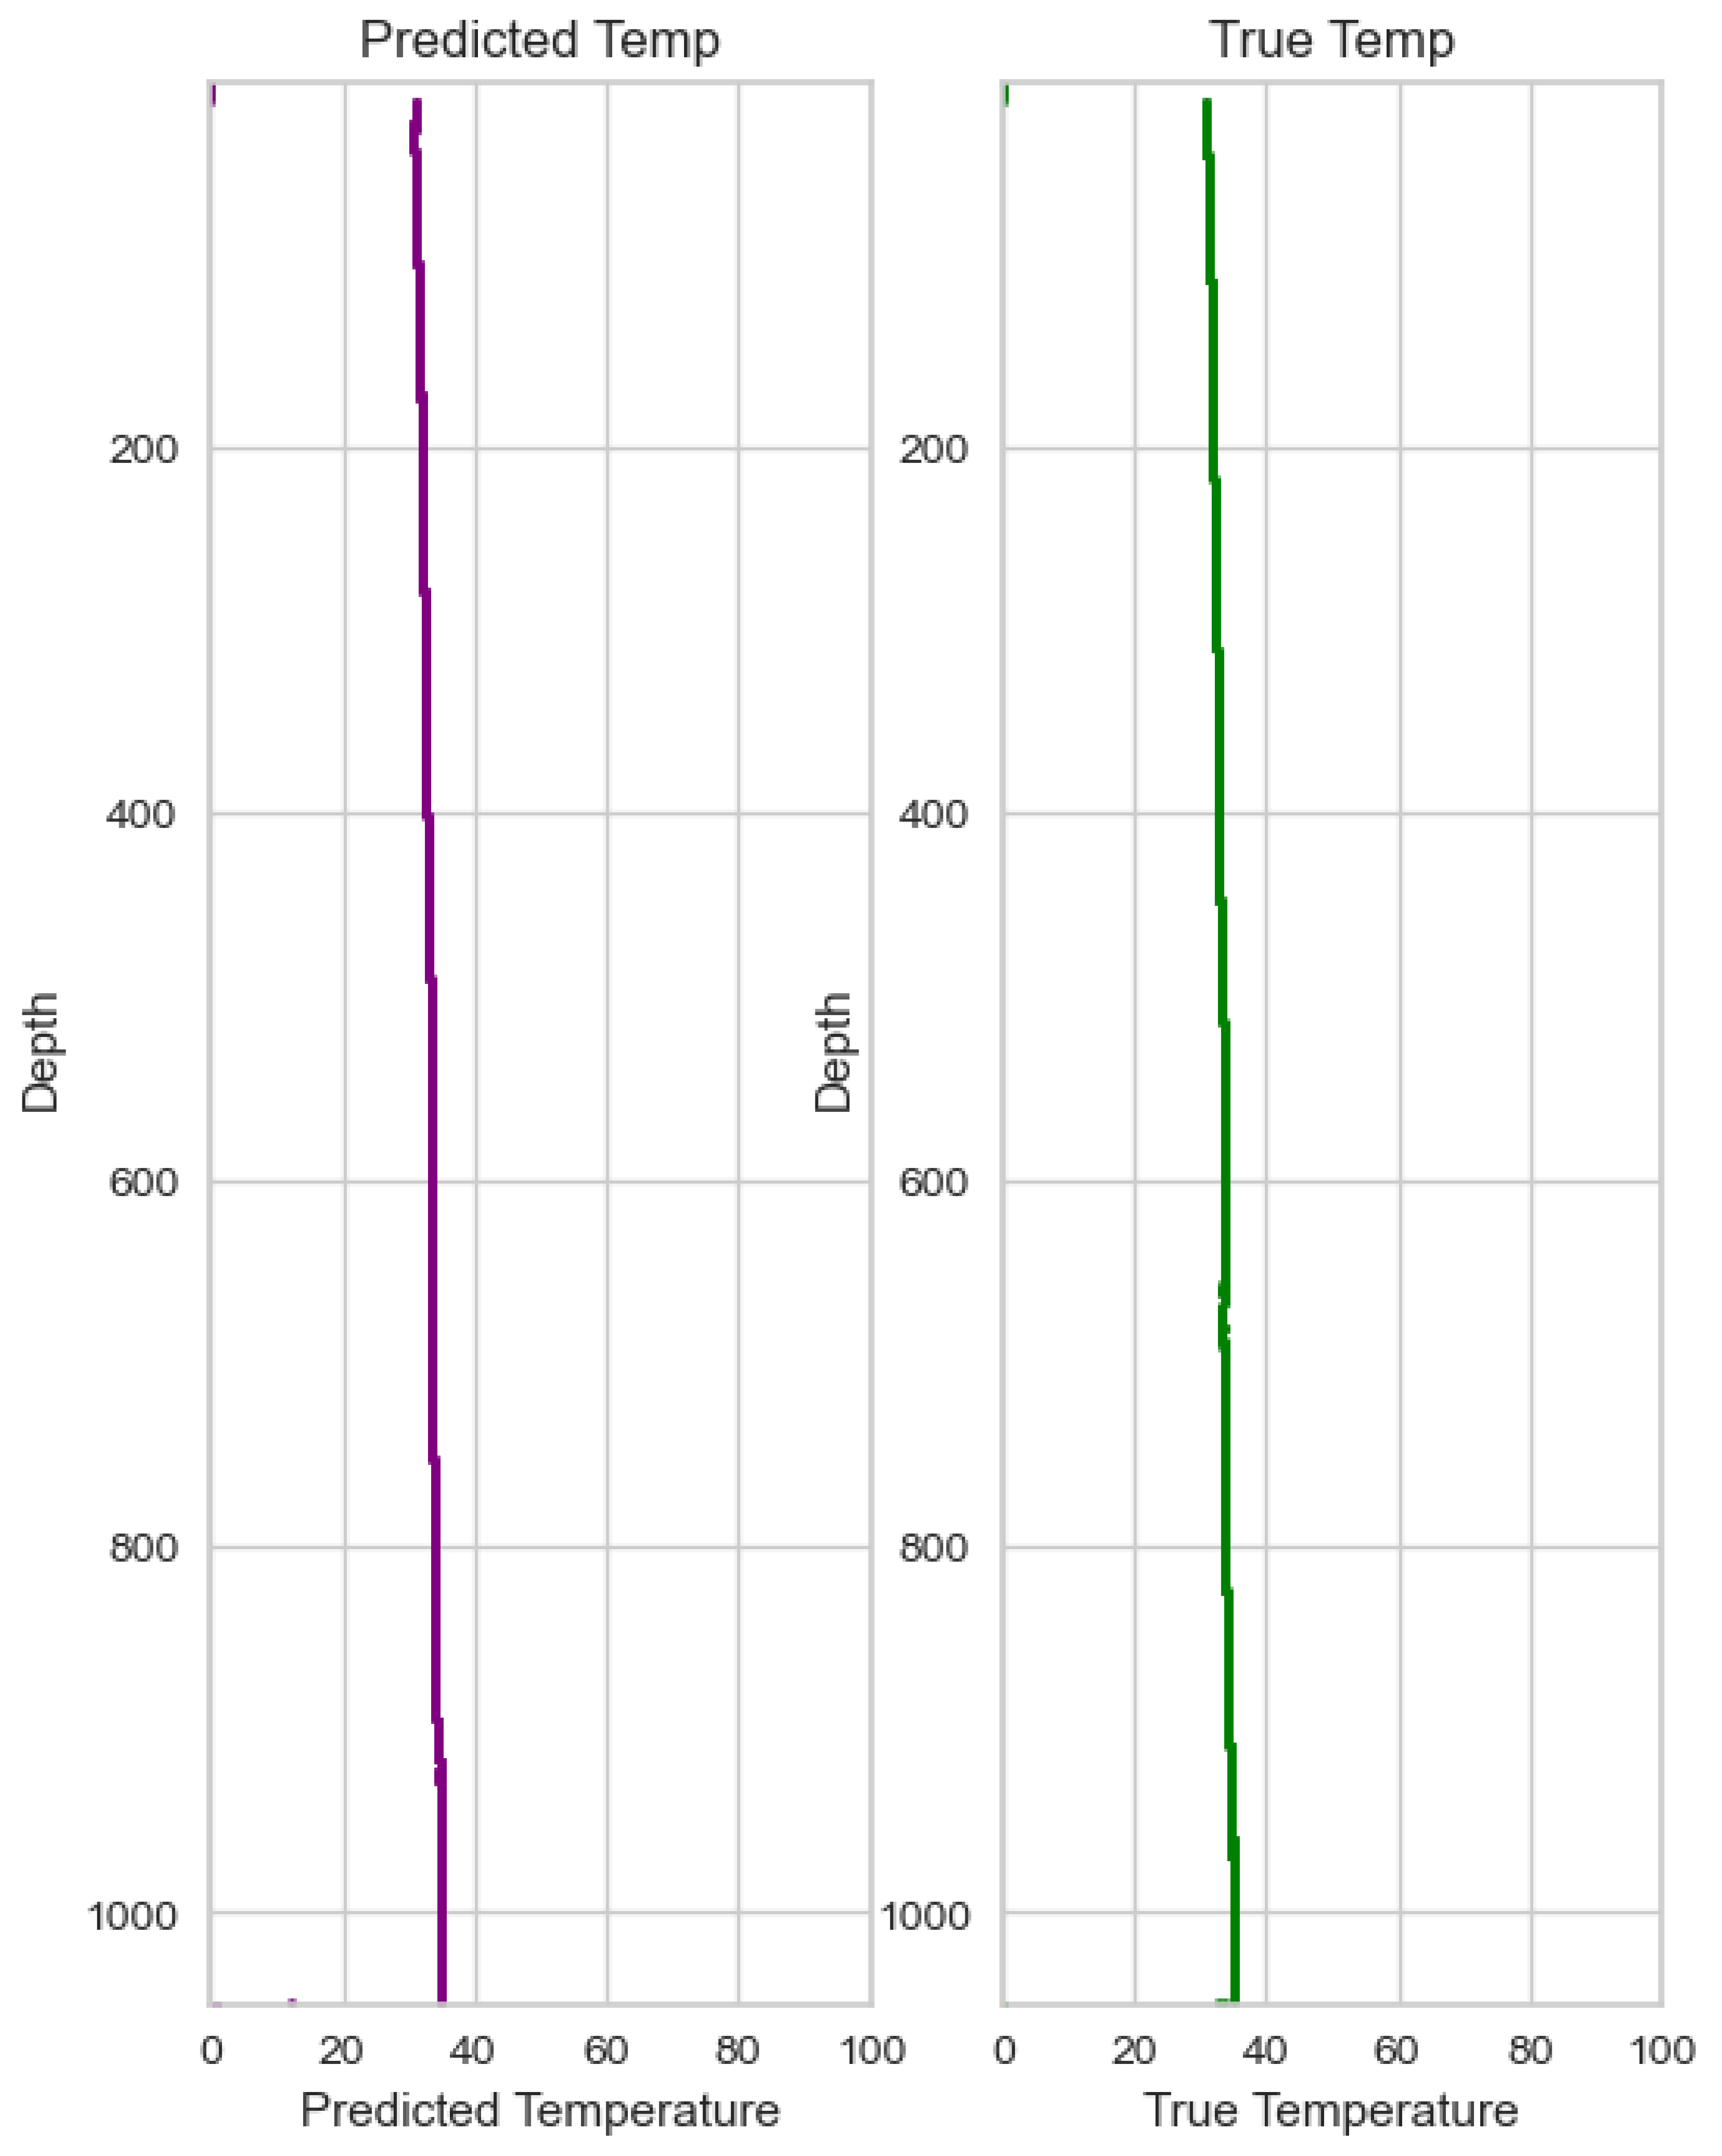
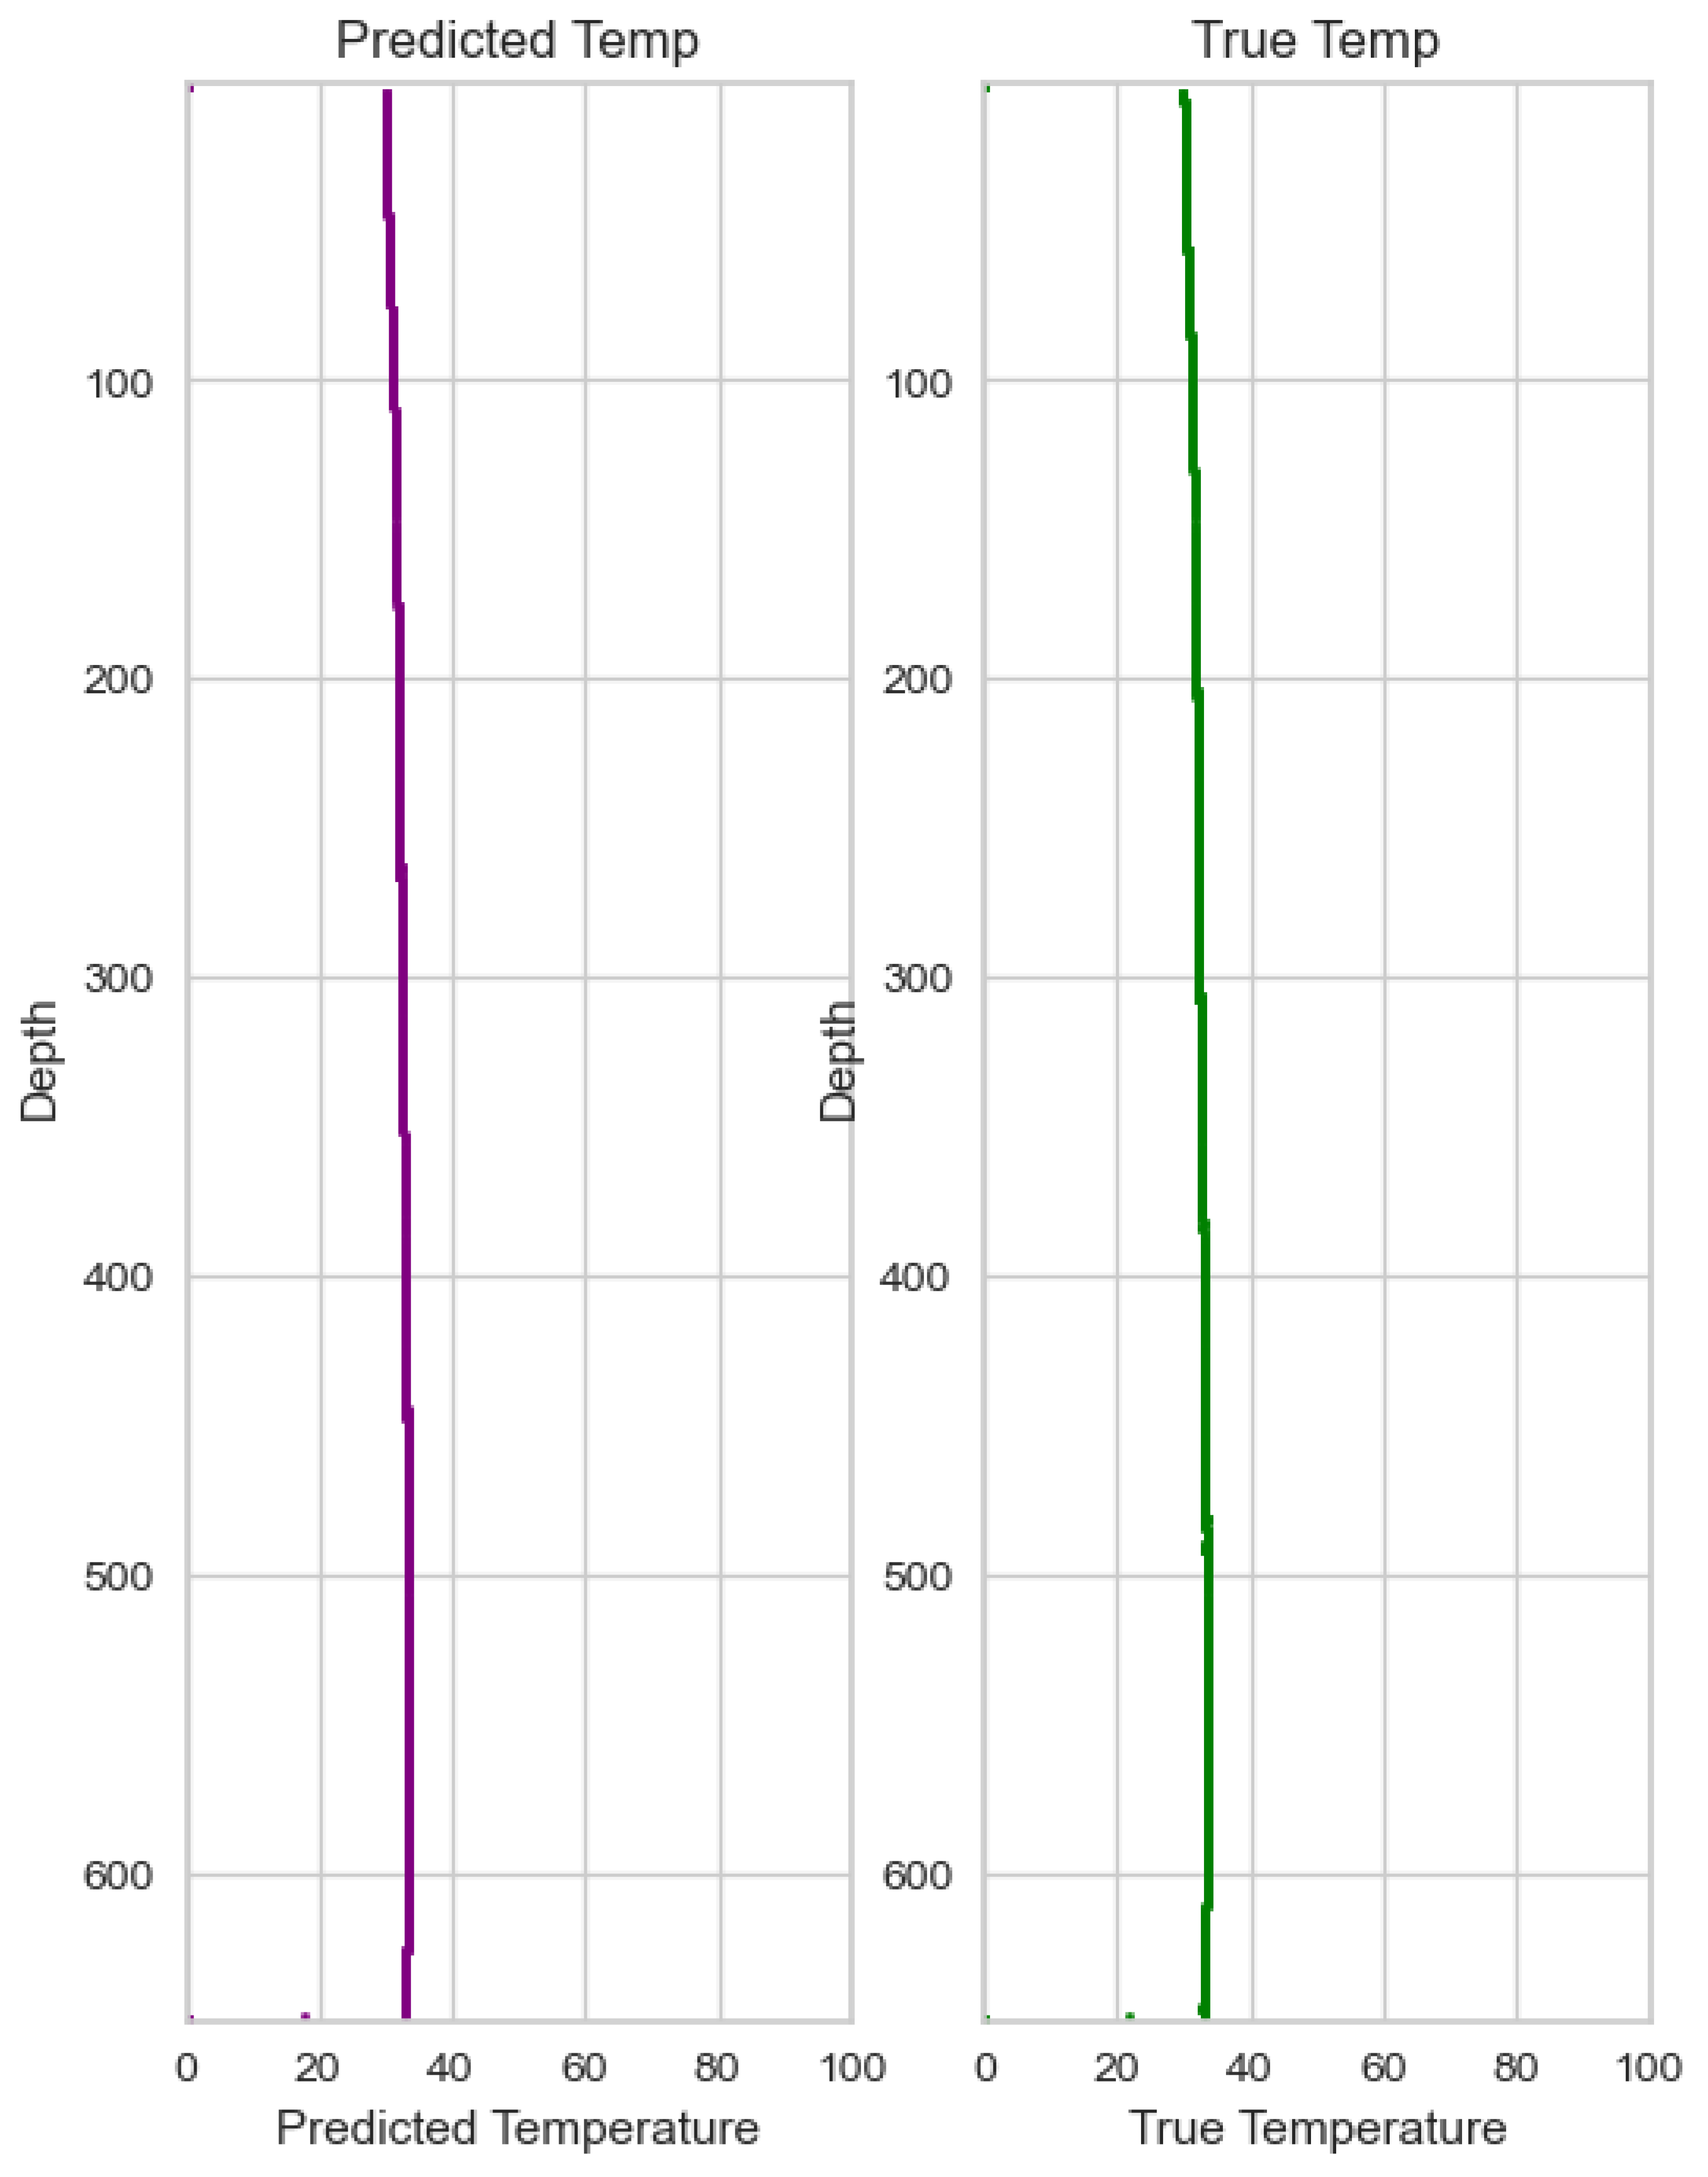
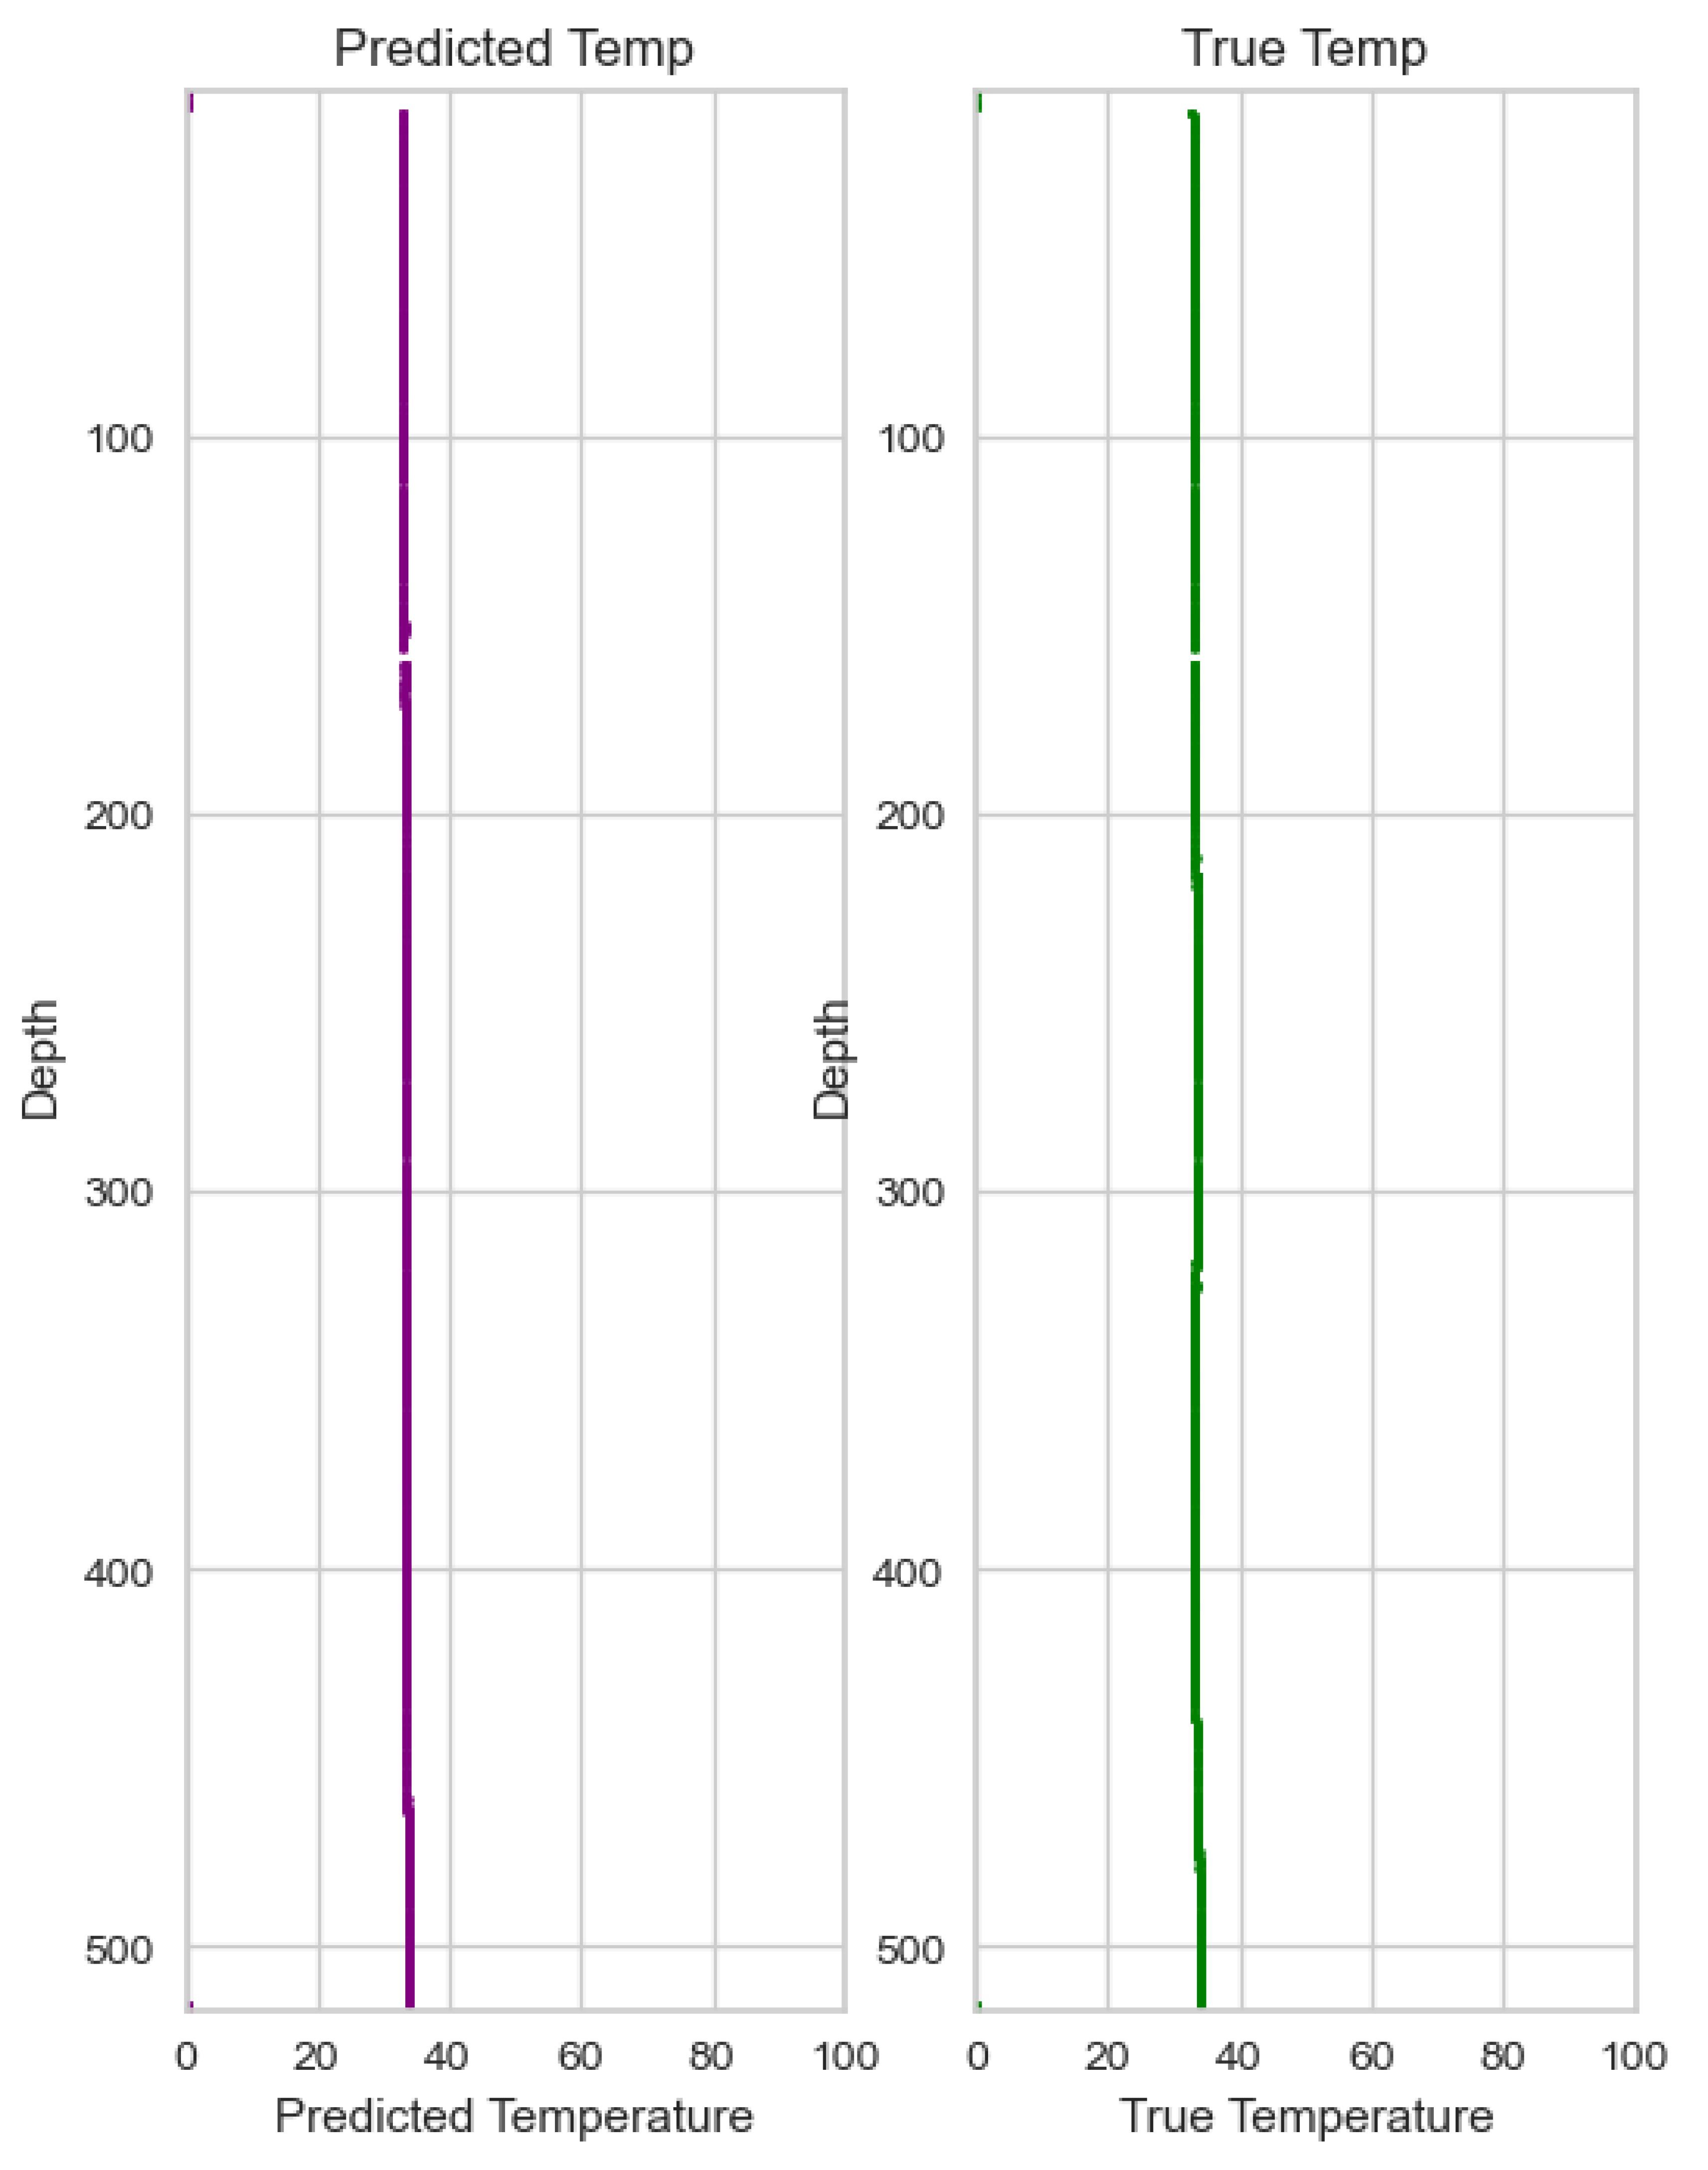
4.1.3. Temperature Prediction
4.1.4. Predicted Temperature
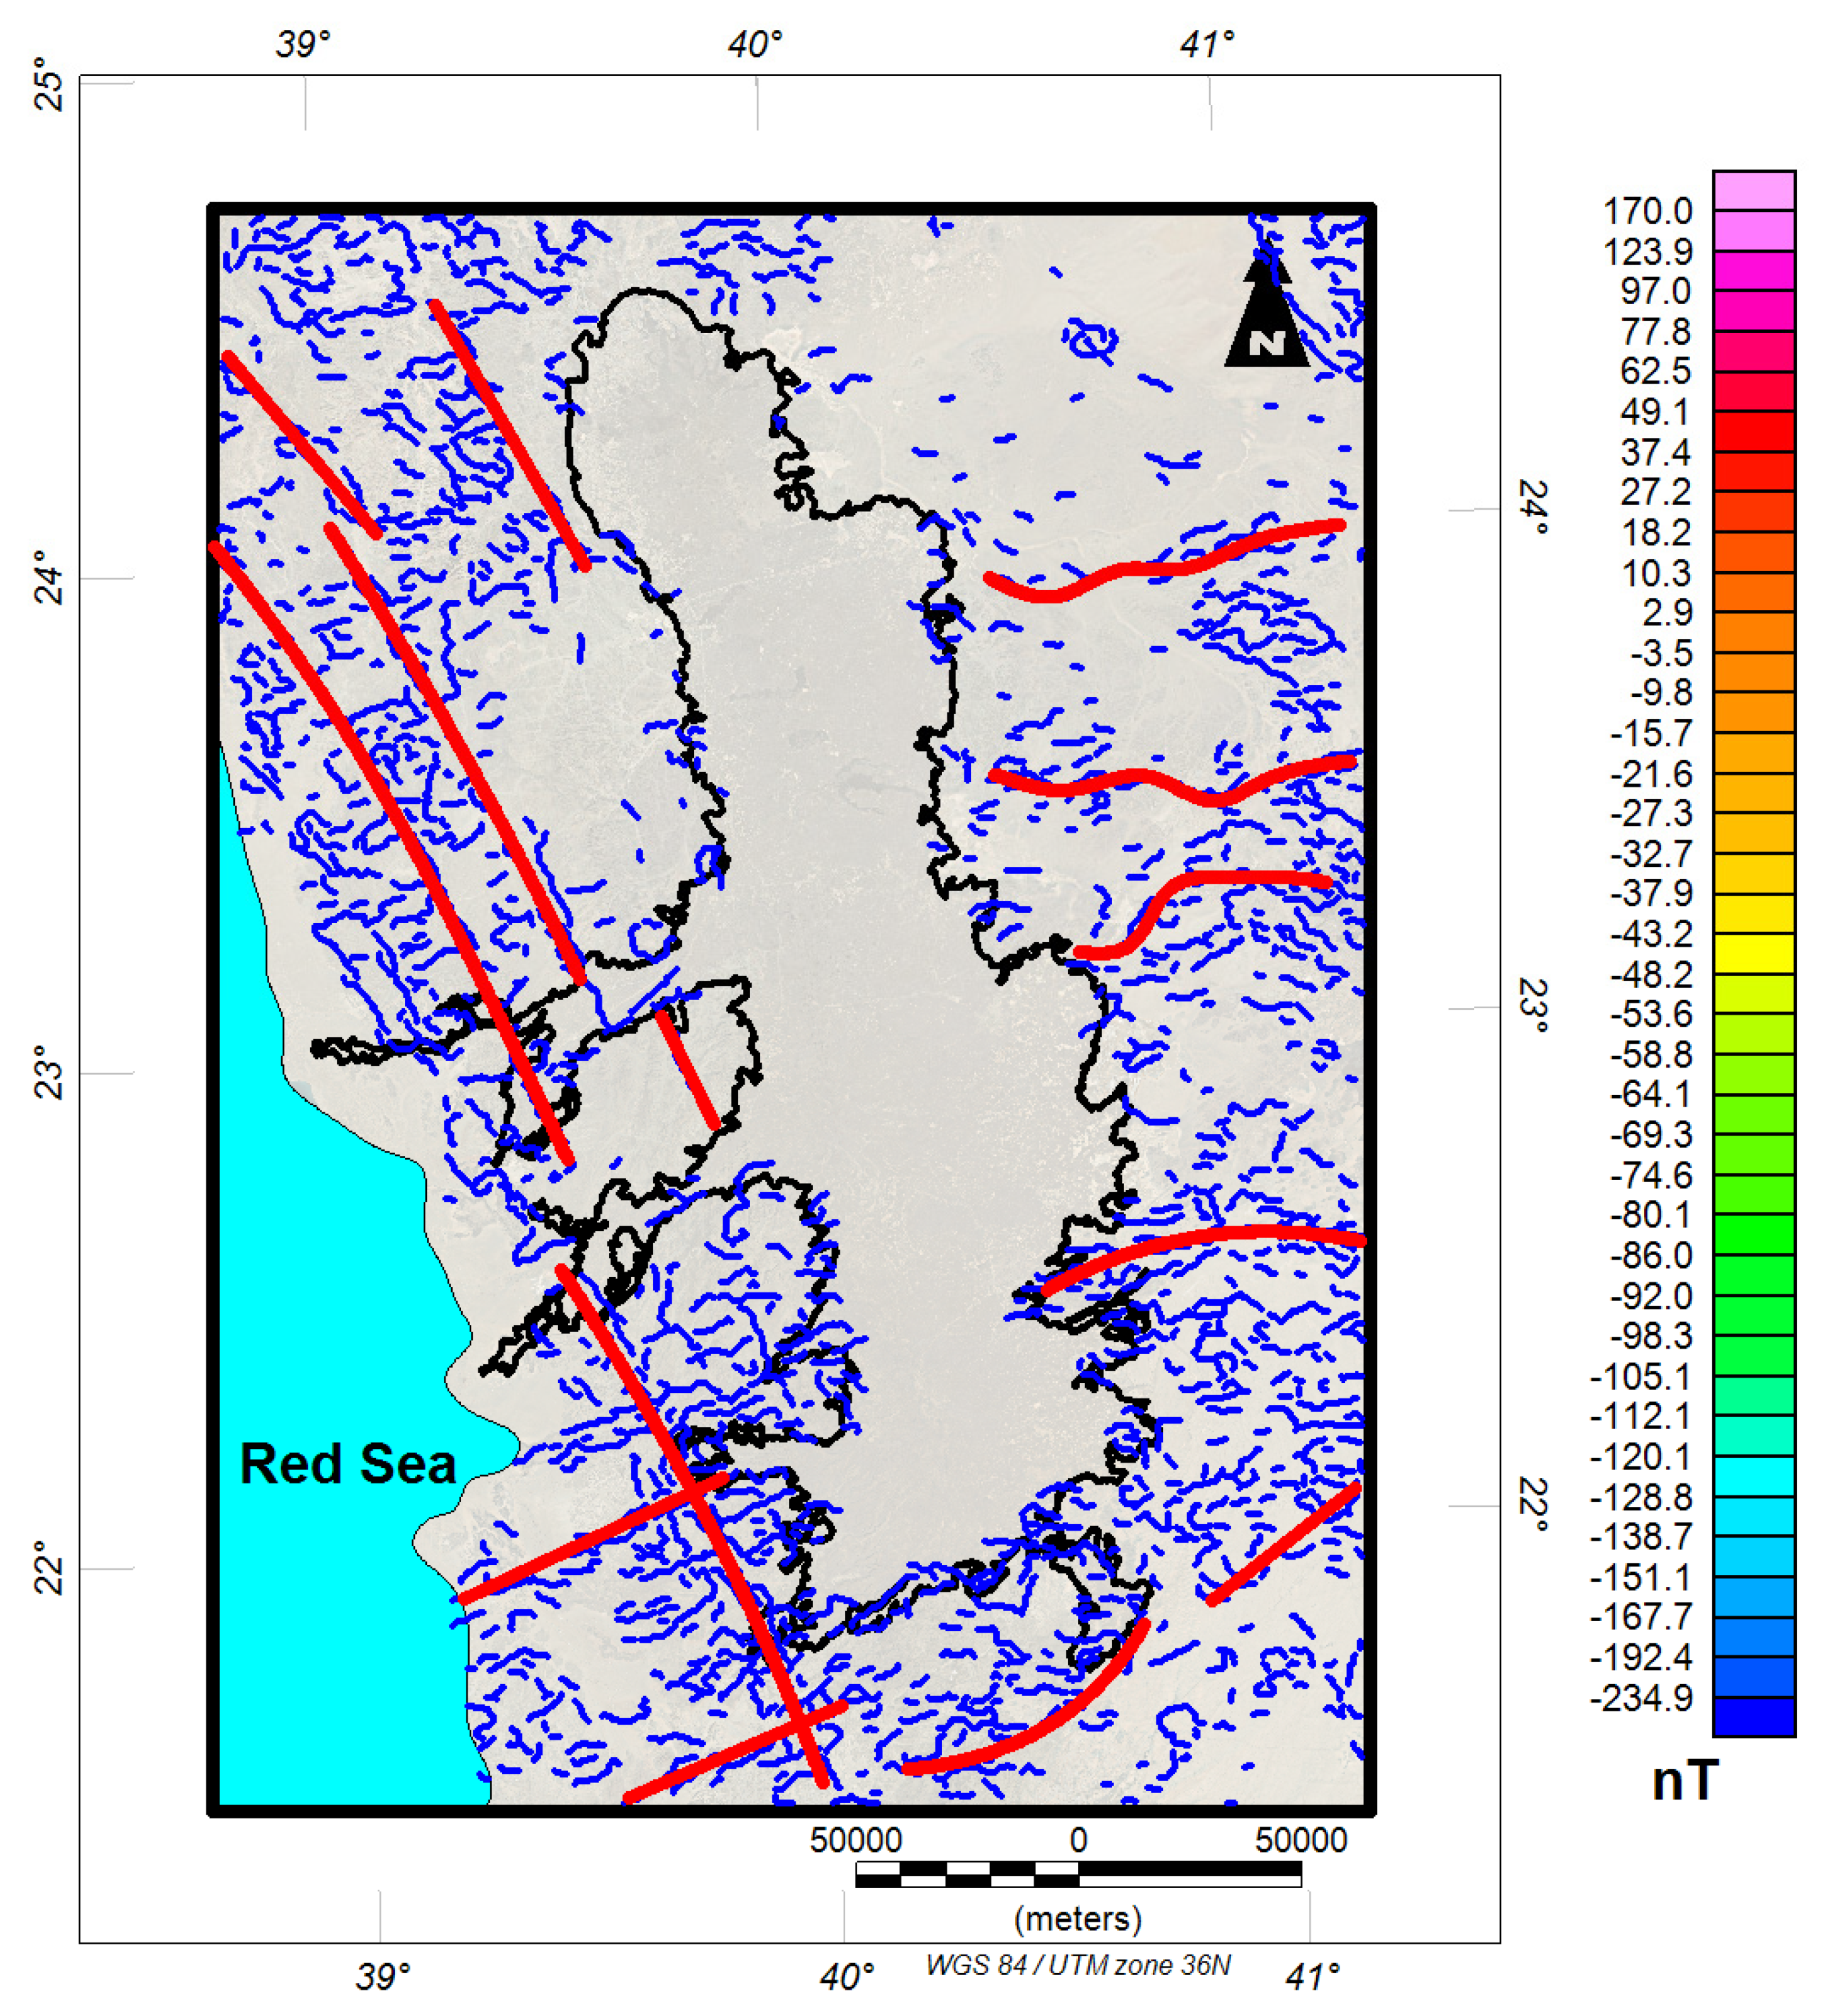
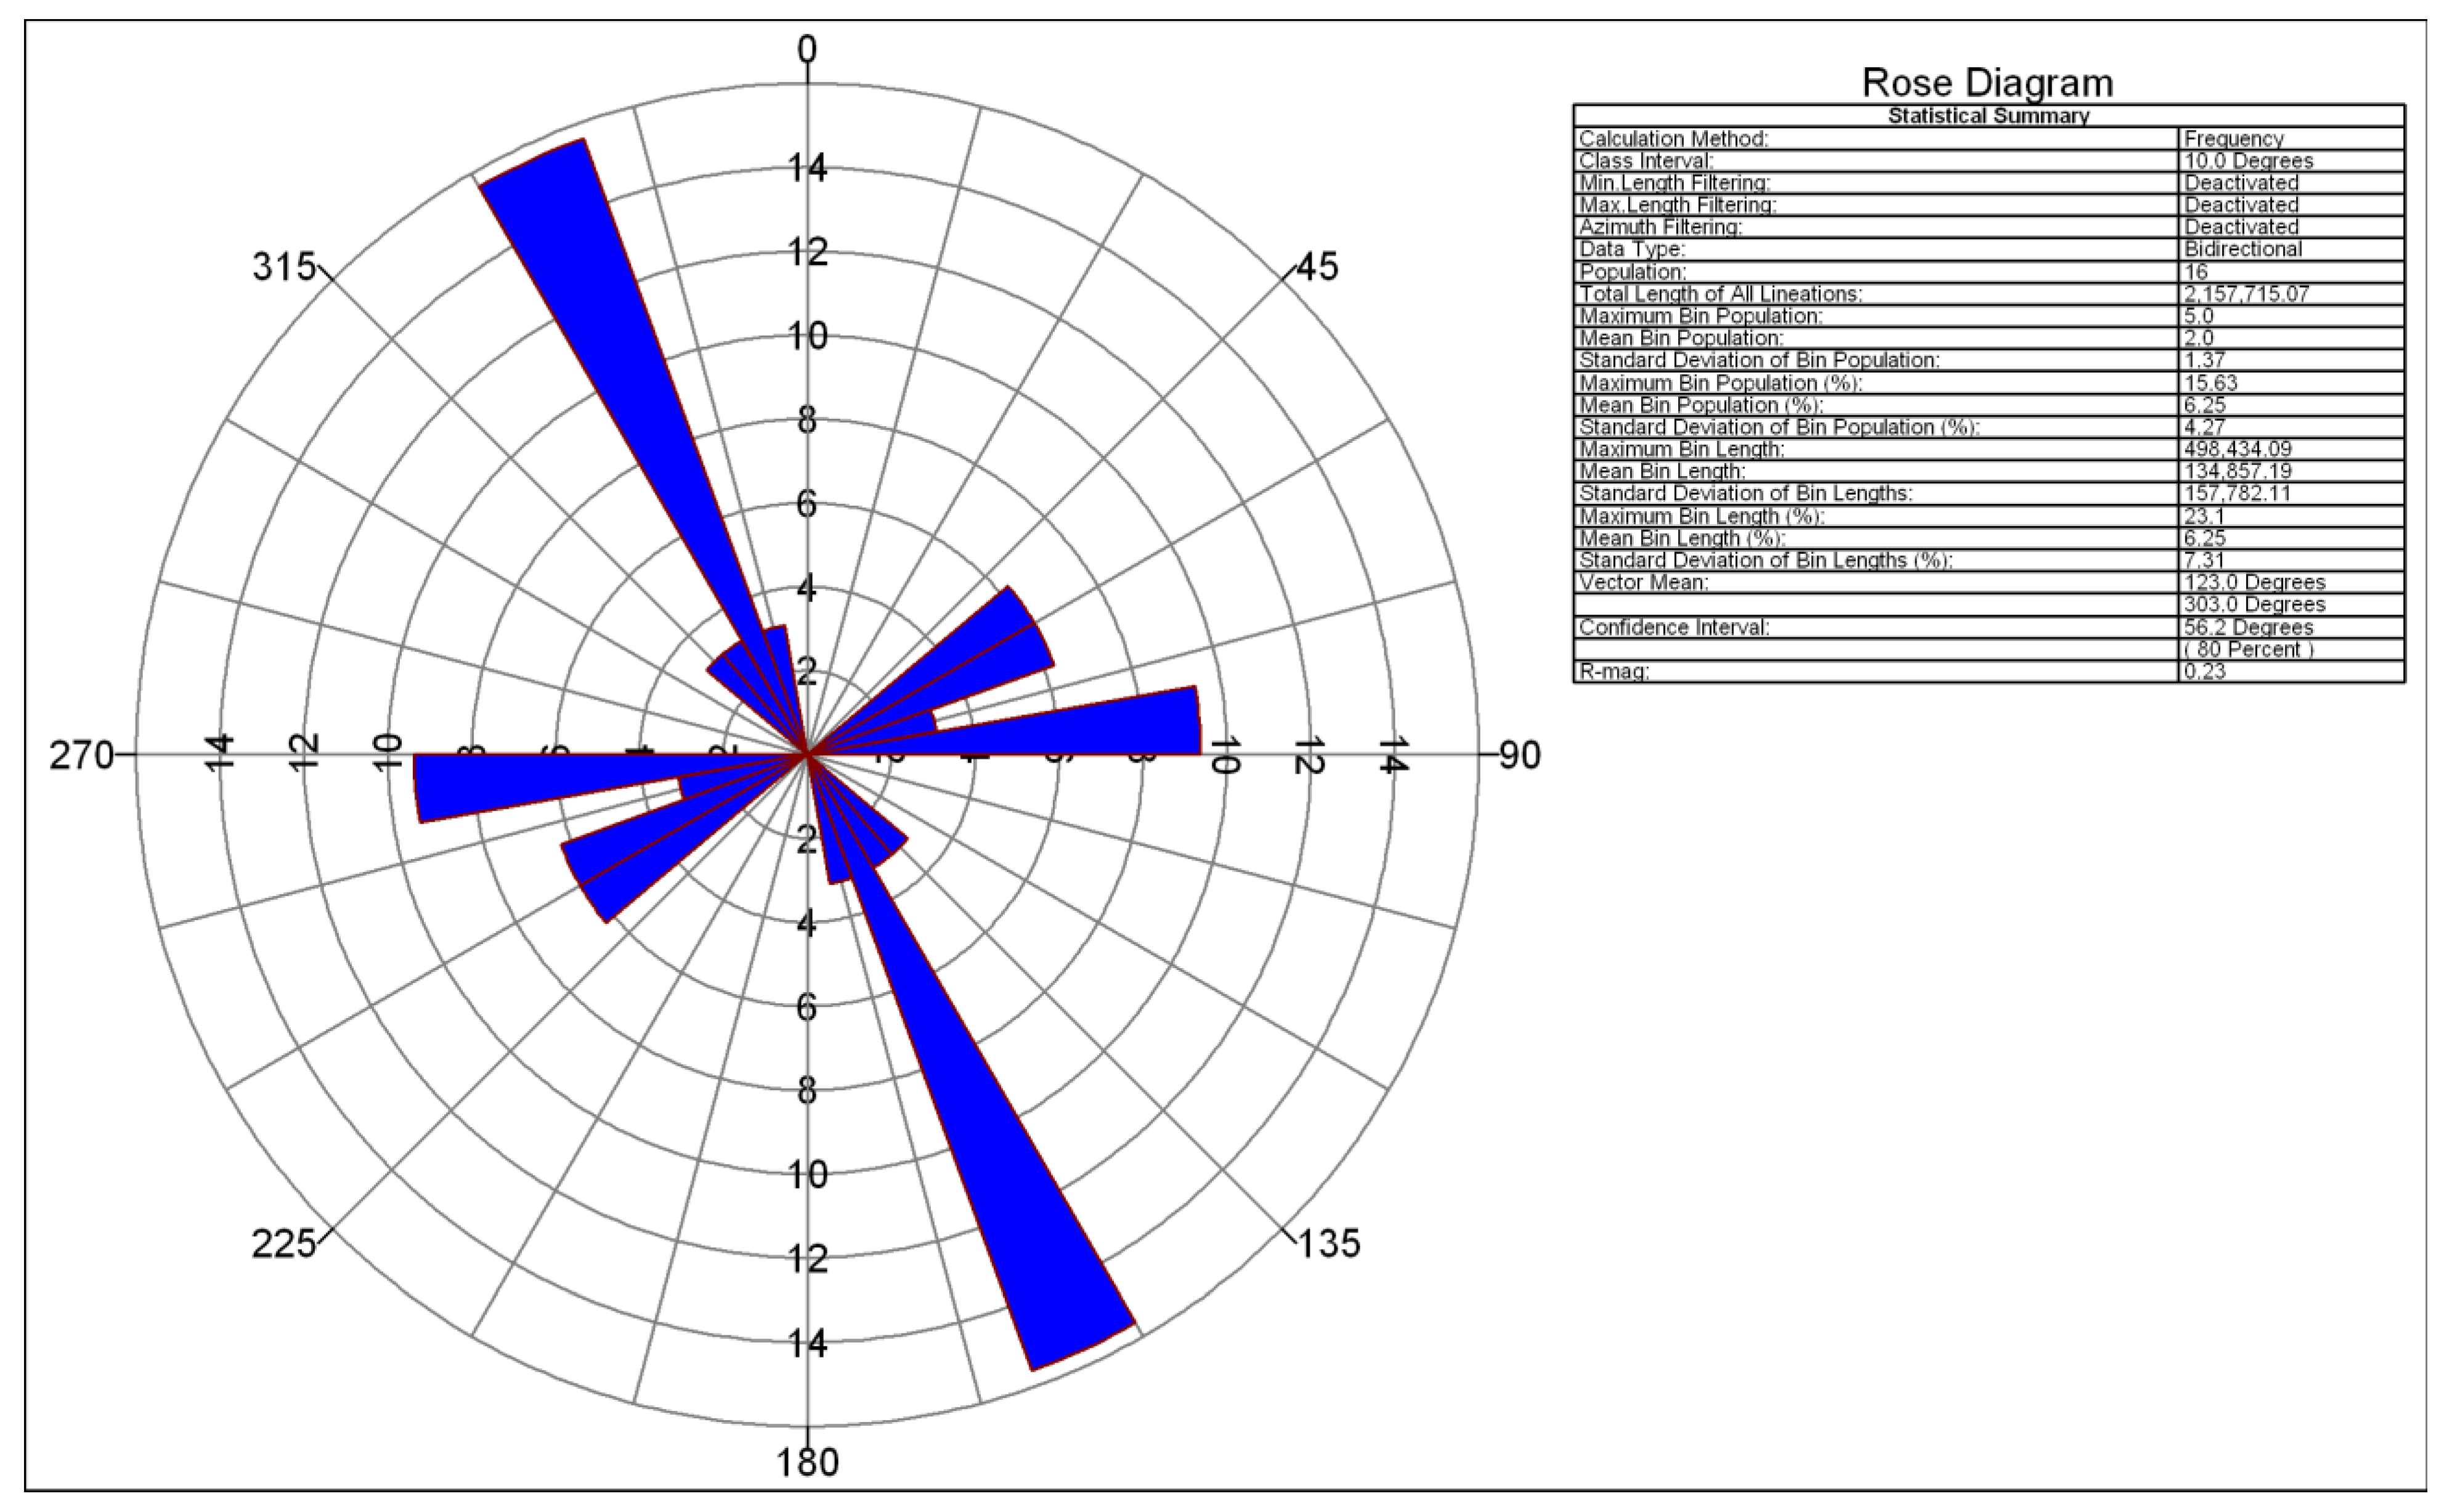
4.2. Magnetic Data Interpretation
CET Grid Analysis
4.3. LST and NDVI and CO2 Emissions Interpretation
5. Conclusions
6. Future Research
Supplementary Materials
Author Contributions
Funding
Institutional Review Board Statement
Informed Consent Statement
Data Availability Statement
Acknowledgments
Conflicts of Interest
References
- Lund, J.W.; Toth, A.N. Direct utilization of geothermal energy 2020 worldwide review. Geothermics 2020, 90, 101915. [Google Scholar] [CrossRef]
- Ng’Ethe, J.; Jalilinasrabady, S. GIS-based multi-criteria decision making under Silica Saturation Index (SSI) for selecting the best direct use scenarios for geothermal resources in Central and Southern Rift Valley, Kenya. Geothermics 2023, 109, 102656. [Google Scholar] [CrossRef]
- Murdock, H.E.; Gibb, D.; Andre, T.; Sawin, J.L.; Brown, A.; Ranalder, L.; Andre, T.; Brown, A.; Collier, U.; Dent, C.; et al. Renewables 2021—Global Status Report; REN21 Secretariat: Paris, France, 2021; 603p, ISBN 978-3-948393-03-8. [Google Scholar]
- Ren, P.R.S. Renewables 2022 Global Status Report; REN21 Secretariat: Paris, France, 2022. Available online: https://www.ren21.net/gsr-2022/ (accessed on 3 March 2023).
- Putriyana, L.; Daud, Y.; Saha, B.B.; Nasruddin, N. A comprehensive data and information on low to medium temperature geothermal resources in Indonesia: A review. Geéomeéch. Geophys. Geo-Energy Geo-Resour. 2022, 8, 58. [Google Scholar] [CrossRef]
- Aboud, E.; Alqahtani, F.; Elmasry, N.; Abdulfarraj, M.; Osman, H. Geothermal anomaly detection using potential field geophysical data in Raahat volcanic field, Madinah, Saudi Arabia. J. Geol. Geophys. 2022, 11, 1026. [Google Scholar]
- Aboud, E.; Arafa-Hamed, T.; Alqahtani, F.; Marzouk, H.; Elbarbary, S.; Abdulfaraj, M.; Elmasry, N. The geothermal magmatic system at the northern Rahat volcanic field, Saudi Arabia, revealed from 3D magnetotelluric inversion. J. Volcanol. Geotherm. Res. 2023, 437, 107794. [Google Scholar] [CrossRef]
- Alqahtani, F.; Aboud, E.; Ehsan, M.; Naseer, Z.; Abdulfarraj, M.; Abdelwahed, M.F.; El-Masry, N. Geothermal Exploration Using Remote Sensing, Surface Temperature, and Geophysical Data in Lunayyir Volcanic Field, Saudi Arabia. Sustainability 2023, 15, 7645. [Google Scholar] [CrossRef]
- Lashin, A.; Bassam, A.; Arifi, A.; Rehman, N.; Faifi, A. In A Review of the Geothermal Resources of Saudi Arabia: 2015–2020. In Proceedings of the World Geothermal Congress 2020, Reykjavik, Iceland, 24–27 October 2020; pp. 1–12. [Google Scholar]
- Al-Amri, A.M.; Abdelrahman, K.; Mellors, R.; Harris, D. Geothermal potential of Harrat Rahat, Northern Arabian Shield: Geological constraints. Arab. J. Geosci. 2020, 13, 268. [Google Scholar] [CrossRef]
- Abdel-Fattah, M.I.; Shendi, E.H.; Kaiser, M.F.; Abuzied, S.M. Unveiling geothermal potential sites along Gulf of Suez (Egypt) using an integrated geoscience approach. Terra Nova 2020, 33, 306–319. [Google Scholar] [CrossRef]
- Calderón-Chaparro, R.A.; Vargas-Cuervo, G. Determination of Hydrothermal Prospects in the Geothermal Region of Paipa (Boyacá, Colombia), Using Remote Sensing and Field Data. Earth Sci. Res. J. 2019, 23, 265–282. [Google Scholar] [CrossRef]
- Abuzied, S.M.; Kaiser, M.F.; Shendi, E.-A.H.; Abdel-Fattah, M.I. Multi-criteria decision support for geothermal resources exploration based on remote sensing, GIS and geophysical techniques along the Gulf of Suez coastal area, Egypt. Geothermics 2020, 88, 101893. [Google Scholar] [CrossRef]
- Mahwa, J.; Li, D.-J.; Ping, J.-H.; Leng, W.; Tang, J.-B.; Shao, D.-Y. Mapping the spatial distribution of fossil geothermal manifestations and assessment of geothermal potential of the Tangyin rift, Southeast of Taihang Mountain in China. J. Mt. Sci. 2022, 19, 2241–2259. [Google Scholar] [CrossRef]
- Zaini, N.; Yanis, M.; Abdullah, F.; Van Der Meer, F.; Aufaristama, M. Exploring the geothermal potential of Peut Sagoe volcano using Landsat 8 OLI/TIRS images. Geothermics 2022, 105, 102499. [Google Scholar] [CrossRef]
- Marwan; Yanis, M.; Muzakir; Nugraha, G.S. Application of QR codes as a new communication technology and interactive tourist guide in Jaboi, Sabang. IOP Conf. Ser. Mater. Sci. Eng. 2020, 796, 012025. [Google Scholar] [CrossRef]
- Liu, S.; Ye, C.; Sun, Q.; Xu, M.; Duan, Z.; Sheng, H.; Wan, J. Detection of Geothermal Anomaly Areas with Spatio-Temporal Analysis Using Multitemporal Remote Sensing Data. IEEE J. Sel. Top. Appl. Earth Obs. Remote Sens. 2021, 14, 4866–4878. [Google Scholar] [CrossRef]
- Chao, J.; Zhao, Z.; Lai, Z.; Xu, S.; Liu, J.; Li, Z.; Zhang, X.; Chen, Q.; Yang, H.; Zhao, X. Detecting geothermal anomalies using Landsat 8 thermal infrared remote sensing data in the Ruili Basin, Southwest China. Environ. Sci. Pollut. Res. 2022, 30, 32065–32082. [Google Scholar] [CrossRef]
- Perozzi, L.; Guglielmetti, L.; Moscariello, A. Minimizing geothermal exploration costs using machine learning as a tool to drive deep geothermal exploration. In Proceedings of the 3rd Hydrocarbon Geothermal Cross Over Technology Workshop, Geneva, Switzerland, 9–10 April 2019. [Google Scholar]
- Shahdi, A.; Lee, S.; Karpatne, A.; Nojabaei, B. Exploratory analysis of machine learning methods in predicting subsurface temperature and geothermal gradient of Northeastern United States. Geotherm. Energy 2021, 9, 18. [Google Scholar] [CrossRef]
- Stelten, M.E.; Downs, D.T.; Champion, D.E.; Dietterich, H.R.; Calvert, A.T.; Sisson, T.W.; Mahood, G.A.; Zahran, H. The timing and compositional evolution of volcanism within northern Harrat Rahat, Kingdom of Saudi Arabia. GSA Bull. 2019, 132, 1381–1403. [Google Scholar] [CrossRef]
- Camp, V.E.; Roobol, M.J. The Arabian continental alkali basalt province: Part I. evolution of Harrat Rahat, Kingdom of Saudi Arabia. Geol. Soc. Am. Bull. 1989, 101, 71–95. [Google Scholar] [CrossRef]
- Moufti, M.R.; Németh, K. The Intra-Continental Al Madinah Volcanic Field, Western Saudi Arabia: A Proposal to Establish Harrat Al Madinah as the First Volcanic Geopark in the Kingdom of Saudi Arabia. Geoheritage 2013, 5, 185–206. [Google Scholar] [CrossRef]
- Downs, D.T.; Robinson, J.E.; Stelten, M.E.; Champion, D.E.; Dietterich, H.R.; Sisson, T.W.; Zahran, H.; Hassan, K.; Shawali, J. Geologic Map of the Northern Harrat Rahat Volcanic Field, Kingdom of Saudi Arabia; US Geological Survey: Reston, VA, USA, 2019. [Google Scholar] [CrossRef]
- Runge, M.G.; Bebbington, M.S.; Cronin, S.J.; Lindsay, J.M.; Kenedi, C.L.; Moufti, M.R.H. Vents to events: Determining an eruption event record from volcanic vent structures for the Harrat Rahat, Saudi Arabia. Bull. Volcanol. 2014, 76, 804. [Google Scholar] [CrossRef]
- Abdelwahed, M.F.; El-Masry, N.; Moufti, M.R.; Kenedi, C.L.; Zhao, D.; Zahran, H.; Shawali, J. Imaging of magma intrusions beneath Harrat Al-Madinah in Saudi Arabia. J. Asian Earth Sci. 2016, 120, 17–28. [Google Scholar] [CrossRef]
- Saibi, H.; Mogren, S.; Mukhopadhyay, M.; Ibrahim, E. Subsurface imaging of the Harrat Lunayyir 2007–2009 earthquake swarm zone, western Saudi Arabia, using potential field methods. J. Asian Earth Sci. 2019, 169, 79–92. [Google Scholar] [CrossRef]
- Yao, Z.; Mooney, W.D.; Zahran, H.M.; Youssef, S.E.-H. Upper mantle velocity structure beneath the Arabian shield from Rayleigh surface wave tomography and its implications. J. Geophys. Res. Solid Earth 2017, 122, 6552–6568. [Google Scholar] [CrossRef]
- Mellors, R.J.; Camp, V.E.; Vernon, F.L.; Al-Amri, A.M.S.; Ghalib, A. Regional waveform propagation in the Arabian Peninsula. J. Geophys. Res. Solid Earth 1999, 104, 20221–20235. [Google Scholar] [CrossRef]
- Chang, S.-J.; Merino, M.; Van der Lee, S.; Stein, S.; Stein, C.A. Mantle flow beneath Arabia offset from the opening Red Sea. Geophys. Res. Lett. 2011, 38. [Google Scholar] [CrossRef]
- Park, Y.; Nyblade, A.A.; Rodgers, A.J.; Al-Amri, A. Upper mantle structure beneath the Arabian Peninsula and northern Red Sea from teleseismic body wave tomography: Implications for the origin of Cenozoic uplift and volcanism in the Arabian Shield. Geochem. Geophys. Geosyst. 2007, 8. [Google Scholar] [CrossRef]
- Siler, D.L.; Faulds, J.E.; Hinz, N.H.; Dering, G.M.; Edwards, J.H.; Mayhew, B. Three-dimensional geologic mapping to assess geothermal potential: Examples from Nevada and Oregon. Geotherm. Energy 2019, 7, 2. [Google Scholar] [CrossRef]
- Fernàndez, M.; Berástegui, X.; Puig, C.; García-Castellanos, D.; Jurado, M.J.; Torné, M.; Banks, C. Geophysical and geological constraints on the evolution of the Guadalquivir foreland basin, Spain. Geol. Soc. Lond. Speéc. Publ. 1998, 134, 29–48. [Google Scholar] [CrossRef]
- Salem, A.; Ravat, D.; Smith, R.; Ushijima, K. Interpretation of magnetic data using an enhanced local wavenumber (ELW) method. Geophysics 2005, 70, L7–L12. [Google Scholar] [CrossRef]
- Youssef, M.A. Estimating and interpretation of radioactive heat production using airborne gamma-ray survey data of Gabal Arrubushi area, Central Eastern Desert, Egypt. J. Afr. Earth Sci. 2016, 114, 67–73. [Google Scholar] [CrossRef]
- Bücker, C.; Rybach, L. A simple method to determine heat production from gamma-ray logs. Mar. Pet. Geol. 1996, 13, 373–375. [Google Scholar] [CrossRef]
- Asfahani, J. Phosphate Prospecting Using Natural Gamma Ray Well Logging in the Khneifiss Mine, Syria. Explor. Min. Geol. 2002, 11, 61–68. [Google Scholar] [CrossRef]
- Liu, Q.; Zhang, L.; Zhang, C.; He, L. Lithospheric thermal structure of the North China Craton and its geodynamic implications. J. Geodyn. 2016, 102, 139–150. [Google Scholar] [CrossRef]
- Cooper, G.; Cowan, D. Enhancing potential field data using filters based on the local phase. Comput. Geosci. 2006, 32, 1585–1591. [Google Scholar] [CrossRef]
- Litjens, G.; Kooi, T.; Bejnordi, B.E.; Setio, A.A.A.; Ciompi, F.; Ghafoorian, M.; van Der Laak, J.A.; Van Ginneken, B.; Sánchez, C.I. A survey on deep learning in medical image analysis. Med. Image Anal. 2017, 42, 60–88. [Google Scholar] [CrossRef]
- Cox, V. Translating Statistics to Make Decisions; Apress: New York, NY, USA, 2017. [Google Scholar] [CrossRef]
- Williamson, D.F.; Parker, R.A.; Kendrick, J.S. The Box Plot: A Simple Visual Method to Interpret Data. Ann. Intern. Med. 1989, 110, 916–921. [Google Scholar] [CrossRef]
- Choubey, S.; Karmakar, G.P. Artificial intelligence techniques and their application in oil and gas industry. Artif. Intell. Rev. 2020, 54, 3665–3683. [Google Scholar] [CrossRef]
- Ullah, J.; Li, H.; Ashraf, U.; Heping, P.; Ali, M.; Ehsan, M.; Asad, M.; Anees, A.; Ren, T. Knowledge-based machine learning for mineral classification in a complex tectonic regime of Yingxiu-Beichuan fault zone, Sichuan basin. Geoenergy Sci. Eng. 2023, 229, 212077. [Google Scholar] [CrossRef]
- Bukar, I.; Adamu, M.B.; Hassan, U. A Machine Learning Approach to Shear Sonic Log Prediction. In Proceedings of the SPE Nigeria Annual International Conference and Exhibition, Lagos, Nigeria, 5–7 August 2019. [Google Scholar] [CrossRef]
- Zahran, H.M.; Stewart, I.C.F.; Johnson, P.R.; Basahel, M.H. Aeromagnetic-Anomaly Maps of Central and Western Saudi Arabia; Saudi Geological Survey Open-File Report SGS-OF-2002-8; Saudi Geological Survey: Riyadh, Saudi Arabia, 2003; p. 6. [Google Scholar]
- Hase, D.H. Qualitative Analysis of Airborne Magnetometer Data: The Arabian Shield, Kingdom of Saudi Arabia; US Geological Survey: Reston, VA, USA, 1970. [Google Scholar] [CrossRef]
- Johnson, P.R.; Vranas, G.J. Qualitative Interpretation of Aeromagnetic Data for the Arabian Shield; Ministry of Petroleum and Mineral Resources, Directorate General of Mineral: Riyadh, Saudi Arabia, 1992. [Google Scholar]
- Corporation, P. The Interpretation of an Aeromagnetic Survey of the Cover Rocks Region, Kingdom of Saudi Arabia; Saudi Arabian Deputy Ministry for Mineral Resources DMMR: Riyadh, Saudi Arabia, 1985. [Google Scholar]
- Georgel, J.-M.; Bobillier, J.; Delom, J.; Bourlier, M.; Gelot, J.-L. Total-Intensity Aeromagnetic Maps of the Precambrian Shield Reduced to the Pole and Upwards Continued to 800 m above Ground Level; Saudi Arabian Directorate General of Mineral Resources DGMR Open-File Report BRGM-OF-09-15; Saudi Arabian Directorate General of Mineral Resources DGMR: Riyadh, Saudi Arabia, 1990. [Google Scholar]
- Griscom, A. An Aeromagnetic Interpretation of Eleven Map Sheets, Scale 1:250,000, in the Southern Tuwayq Quadrangles; Saudi Arabian Deputy Ministry for Mineral Resources DMMR Open-File Report USGS-OF-02-70; Saudi Arabian Deputy Ministry for Mineral Resources DMMR: Riyadh, Saudi Arabia, 1982. [Google Scholar]
- Hall, S.A. A Total Intensity Magnetic Anomaly Map of the Red Sea and Its Interpretation; US Geological Survey: Reston, VA, USA, 1979; pp. 1–260. [Google Scholar]
- Kovesi, P. Symmetry and asymmetry from local phase. Citeseer 1997, 190, 2–4. [Google Scholar]
- Kovesi, P. Image features from phase congruency. Videre J. Comput. Vis. Res. 1999, 1, 1–26. [Google Scholar]
- Holden, E.-J.; Dentith, M.; Kovesi, P. Towards the automated analysis of regional aeromagnetic data to identify regions prospective for gold deposits. Comput. Geosci. 2008, 34, 1505–1513. [Google Scholar] [CrossRef]
- Holden, E.-J.; Kovesi, P.; Dentith, M.C.; Wedge, D.; Wong, J.C.; Fu, S.C. Detection of Regions of Structural Complexity within Aeromagnetic Data Using Image Analysis. In Proceedings of the 25th International Conference of Image and Vision Computing New Zealand, Queenatown, New Zealand, 8–9 November 2010; pp. 1–8. [Google Scholar] [CrossRef]
- Lam, L.; Lee, S.-W.; Suen, C.Y. Thinning methodologies-a comprehensive survey. IEEE Trans. Pattern Anal. Mach. Intell. 1992, 14, 869–885. [Google Scholar] [CrossRef]
- Syawalina, R.K.; Ratihmanjari, F.; Saputra, R.A. Identification of the Relationship between LST and NDVI on Geothermal Manifestations in a Preliminary Study of Geothermal Exploration Using Landsat 8 OLI/TIRS Imagery Data Capabilities: Case Study of Toro, Central Sulawesi; Standford University: Stanford, CA, USA, 2022; pp. 1–8. [Google Scholar]
- Eric, K.C. Using Landsat-8 Data in Preliminary Exploration for Geothermal Resources. Int. J. Sci. Res. Sci. Eng. Technol. 2019, 6, 223–240. [Google Scholar] [CrossRef]
- Elbarbary, S.; Zaher, M.A.; Saibi, H.; Fowler, A.-R.; Saibi, K. Geothermal renewable energy prospects of the African continent using GIS. Geotherm. Energy 2022, 10, 8. [Google Scholar] [CrossRef]
- Zhao, F.; Peng, Z.; Qian, J.; Chu, C.; Zhao, Z.; Chao, J.; Xu, S. Detection of geothermal potential based on land surface temperature derived from remotely sensed and in-situ data. Geo-Spat. Inf. Sci. 2023, 2178335. [Google Scholar] [CrossRef]
- Wang, K.; Jiang, Q.-G.; Yu, D.-H.; Yang, Q.-L.; Wang, L.; Han, T.-C.; Xu, X.-Y. Detecting daytime and nighttime land surface temperature anomalies using thermal infrared remote sensing in Dandong geothermal prospect. Int. J. Appl. Earth Obs. Geoinformation 2019, 80, 196–205. [Google Scholar] [CrossRef]
- Crippa, M.; Guizzardi, D.; Banja, M.; Solazzo, E.; Muntean, M.; Schaaf, E.; Pagani, F.; Monforti-Ferrario, F.; Olivier, J.G.J.; Quadrelli, R. CO2 Emissions of All World Countries; Publications Office of the European Union: Luxembourg, 2022. [Google Scholar]
- Burton, M.R.; Sawyer, G.M.; Granieri, D. Deep carbon emissions from volcanoes. Rev. Mineral. Geochem. 2013, 75, 323–354. [Google Scholar] [CrossRef]
- Gerlach, T. Volcanic versus anthropogenic carbon dioxide. Eos 2011, 92, 201–202. [Google Scholar] [CrossRef]
- Rabuffi, F.; Silvestri, M.; Musacchio, M.; Romaniello, V.; Buongiorno, M.F. A Statistical Approach to Satellite Time Series Analysis to Detect Changes in Thermal Activities: The Vulcano Island 2021 Crisis. Remote Sens. 2022, 14, 3933. [Google Scholar] [CrossRef]
- Rehman, S.; Shash, A. Geothermal Resources of Saudi Arabia–Country Update Report. In Proceedings of the World Geothermal Congress 2005, Antalya, Turkey, 24–29 April 2005; pp. 24–29. [Google Scholar]
- Husain, T.; Khalil, A.A. Environment and Sustainable Development in the Kingdom of Saudi Arabia: Current Status and Future Strategy. J. Sustain. Dev. 2013, 6, p14. [Google Scholar] [CrossRef]
- Asseng, S.; Ewert, F.; Martre, P.; Rotter, R.P.; Lobell, D.B.; Cammarano, D.; Kimball, B.A.; Ottman, M.J.; Wall, G.W.; White, J.W.; et al. Rising temperatures reduce global wheat production. Nat. Clim. Chang. 2015, 5, 143–147. [Google Scholar] [CrossRef]
- Garcia-Gutierrez, A.; Espinosa-Paredes, G.; Hernandez-Ramirez, I. Study on the flow production characteristics of deep geothermal wells. Geothermics 2002, 31, 141–167. [Google Scholar] [CrossRef]
- Jordan, T.E.; Richards, M.C.; Horowitz, F.G.; Camp, E.; Smith, J.D.; Whealton, C.A.; Stedinger, J.R.; Hornbach, M.J.; Frone, Z.S.; Tester, J.W.; et al. Low Temperature Geothermal Play Fairway Analysis for the Appalachian Basin: Phase 1 Revised Report November 18, 2016; Cornell University: Ithaca, NY, USA, 2016. [Google Scholar] [CrossRef]
- Moraga, J.; Duzgun, H.; Cavur, M.; Soydan, H. The Geothermal Artificial Intelligence for geothermal exploration. Renew. Energy 2022, 192, 134–149. [Google Scholar] [CrossRef]
- Witter, J.B.; Trainor-Guitton, W.J.; Siler, D.L. Uncertainty and risk evaluation during the exploration stage of geothermal development: A review. Geothermics 2018, 78, 233–242. [Google Scholar] [CrossRef]
- Corradino, C.; Amato, E.; Torrisi, F.; Del Negro, C. Data-Driven Random Forest Models for Detecting Volcanic Hot Spots in Sentinel-2 MSI Images. Remote Sens. 2022, 14, 4370. [Google Scholar] [CrossRef]
- Werner, C.; Fischer, T.P.; Aiuppa, A.; Edmonds, M.; Cardellini, C.; Carn, S.; Chiodini, G.; Cottrell, E.; Burton, M.; Shinohara, H.; et al. Carbon Dioxide Emissions from Subaerial Volcanic Regions; Cambridge University Press: Cambridge, UK, 2019; pp. 188–236. [Google Scholar] [CrossRef]
- Tiwari, S.K.; Gupta, A.K.; Asthana, A.K.L. Evaluating CO2 flux and recharge source in geothermal springs, Garhwal Himalaya, India: Stable isotope systematics and geochemical proxies. Environ. Sci. Pollut. Res. 2020, 27, 14818–14835. [Google Scholar] [CrossRef] [PubMed]
- Fischer, T.P.; Aiuppa, A. AGU Centennial Grand Challenge: Volcanoes and Deep Carbon Global CO 2 Emissions from Subaerial Volcanism—Recent Progress and Future Challenges. Geochem. Geophys. Geosyst. 2020, 21, e2019GC008690. [Google Scholar] [CrossRef]
- Sun, Y.; Guo, Z.; Liu, J.; Du, J. CO2 diffuse emission from maar lake: An example in Changbai volcanic field, NE China. J. Volcanol. Geotherm. Res. 2018, 349, 146–162. [Google Scholar] [CrossRef]
- Walia, V.; Lin, S.J.; Fu, C.C.; Yang, T.F.; Hong, W.-L.; Wen, K.-L.; Chen, C.-H. Soil–gas monitoring: A tool for fault delineation studies along Hsinhua Fault (Tainan), Southern Taiwan. Appl. Geochem. 2010, 25, 602–607. [Google Scholar] [CrossRef]
- Girault, F.; Viveiros, F.; Silva, C.; Thapa, S.; Pacheco, J.E.; Adhikari, L.B.; Bhattarai, M.; Koirala, B.P.; Agrinier, P.; France-Lanord, C.; et al. Radon signature of CO2 flux constrains the depth of degassing: Furnas volcano (Azores, Portugal) versus Syabru-Bensi (Nepal Himalayas). Sci. Rep. 2022, 12, 10837. [Google Scholar] [CrossRef]


| Well Name | CALP | NGAM | HRD | SHORT | LONG | SP | TEMP | TIME | Th | U | K | DENS | Porosity |
|---|---|---|---|---|---|---|---|---|---|---|---|---|---|
| RAH-01 | ✓ | ✓ | ✓ | ✓ | ✓ | ✓ | ✓ | × | ✓ | ✓ | ✓ | × | × |
| RAH-02 | ✓ | ✓ | ✓ | ✓ | ✓ | ✓ | ✓ | ✓ | ✓ | ✓ | ✓ | ✓ | ✓ |
| RAH-03 | ✓ | ✓ | ✓ | ✓ | ✓ | ✓ | ✓ | ✓ | ✓ | ✓ | ✓ | ✓ | ✓ |
| RAH-05 | ✓ | ✓ | ✓ | ✓ | ✓ | ✓ | ✓ | × | ✓ | ✓ | ✓ | ✓ | ✓ |
| RAH-06 | ✓ | ✓ | ✓ | ✓ | ✓ | ✓ | ✓ | ✓ | ✓ | ✓ | ✓ | ✓ | ✓ |
| RAH-07 | ✓ | ✓ | ✓ | ✓ | ✓ | ✓ | ✓ | ✓ | ✓ | ✓ | ✓ | × | × |
| RAH-08 | ✓ | ✓ | ✓ | ✓ | ✓ | ✓ | ✓ | × | × | × | × | × | × |
| RAH-10 | ✓ | ✓ | ✓ | ✓ | ✓ | ✓ | ✓ | × | × | × | × | × | × |
| RAH-11 | ✓ | ✓ | ✓ | ✓ | ✓ | ✓ | ✓ | × | × | × | × | × | × |
| RAH-12 | ✓ | ✓ | ✓ | ✓ | ✓ | ✓ | ✓ | × | ✓ | ✓ | ✓ | × | × |
| RAH-13 | ✓ | ✓ | ✓ | ✓ | ✓ | ✓ | ✓ | ✓ | ✓ | ✓ | ✓ | × | × |
| RAH-15 | ✓ | ✓ | ✓ | ✓ | ✓ | ✓ | ✓ | × | ✓ | ✓ | ✓ | × | × |
| RAH-16 | ✓ | ✓ | ✓ | ✓ | ✓ | ✓ | ✓ | × | ✓ | ✓ | ✓ | × | × |
| RAH-17 | ✓ | ✓ | ✓ | ✓ | ✓ | ✓ | ✓ | × | ✓ | ✓ | ✓ | × | × |
| RAH-19 | ✓ | ✓ | ✓ | ✓ | ✓ | ✓ | ✓ | ✓ | ✓ | ✓ | ✓ | × | × |
| RAH-20 | ✓ | ✓ | ✓ | ✓ | ✓ | ✓ | ✓ | ✓ | ✓ | ✓ | ✓ | × | × |
| RAH-21 | ✓ | ✓ | ✓ | ✓ | ✓ | ✓ | ✓ | ✓ | ✓ | ✓ | ✓ | ✓ | × |
| RAH-22 | ✓ | ✓ | ✓ | ✓ | ✓ | ✓ | ✓ | × | ✓ | ✓ | ✓ | × | × |
| RAH-23 | ✓ | × | × | × | × | × | × | × | × | × | × | × | × |
| RAH-25 | ✓ | ✓ | ✓ | ✓ | ✓ | ✓ | ✓ | ✓ | ✓ | ✓ | ✓ | × | × |
| RAH-27 | ✓ | ✓ | ✓ | ✓ | ✓ | ✓ | × | × | ✓ | ✓ | ✓ | × | × |
| Well Name | Machine Algorithms | Training R2 Score | Testing R2 Score | Adjusted R2 | Mean Absolute Error |
|---|---|---|---|---|---|
| RAH-02 | Linear Regression | 0.749 | 0.663 | 0.661 | 0.995 |
| Random Forest | 0.999 | 0.999 | 0.118 | 0.010 | |
| XG Boost | 0.999 | 0.997 | 0.997 | 0.014 | |
| RAH-07 | Linear Regression | 0.259 | 0.231 | 0.229 | 1.185 |
| Random Forest | 0.999 | 0.993 | 0.261 | 0.015 | |
| XG Boost | 0.999 | 0.990 | 0.997 | 0.012 | |
| RAH-13 | Linear Regression | 0.540 | 0.561 | 0.559 | 0.628 |
| Random Forest | 0.998 | 0.998 | 0.291 | 0.008 | |
| XG Boost | 0.999 | 0.999 | 0.999 | 0.007 | |
| RAH-17 | Linear Regression | 0.445 | 0.409 | 0.405 | 1.110 |
| Random Forest | 0.999 | 0.996 | 0.091 | 0.031 | |
| XG Boost | 0.999 | 0.999 | 0.999 | 0.015 |
| Index | Temperature Range (°C) | Qualitative Classification |
|---|---|---|
| 1 | <39 | Very Low |
| 2 | 39–41 | Low |
| 3 | 41–43 | Medium |
| 4 | 43–50 | High |
| 5 | >50 | Very High |
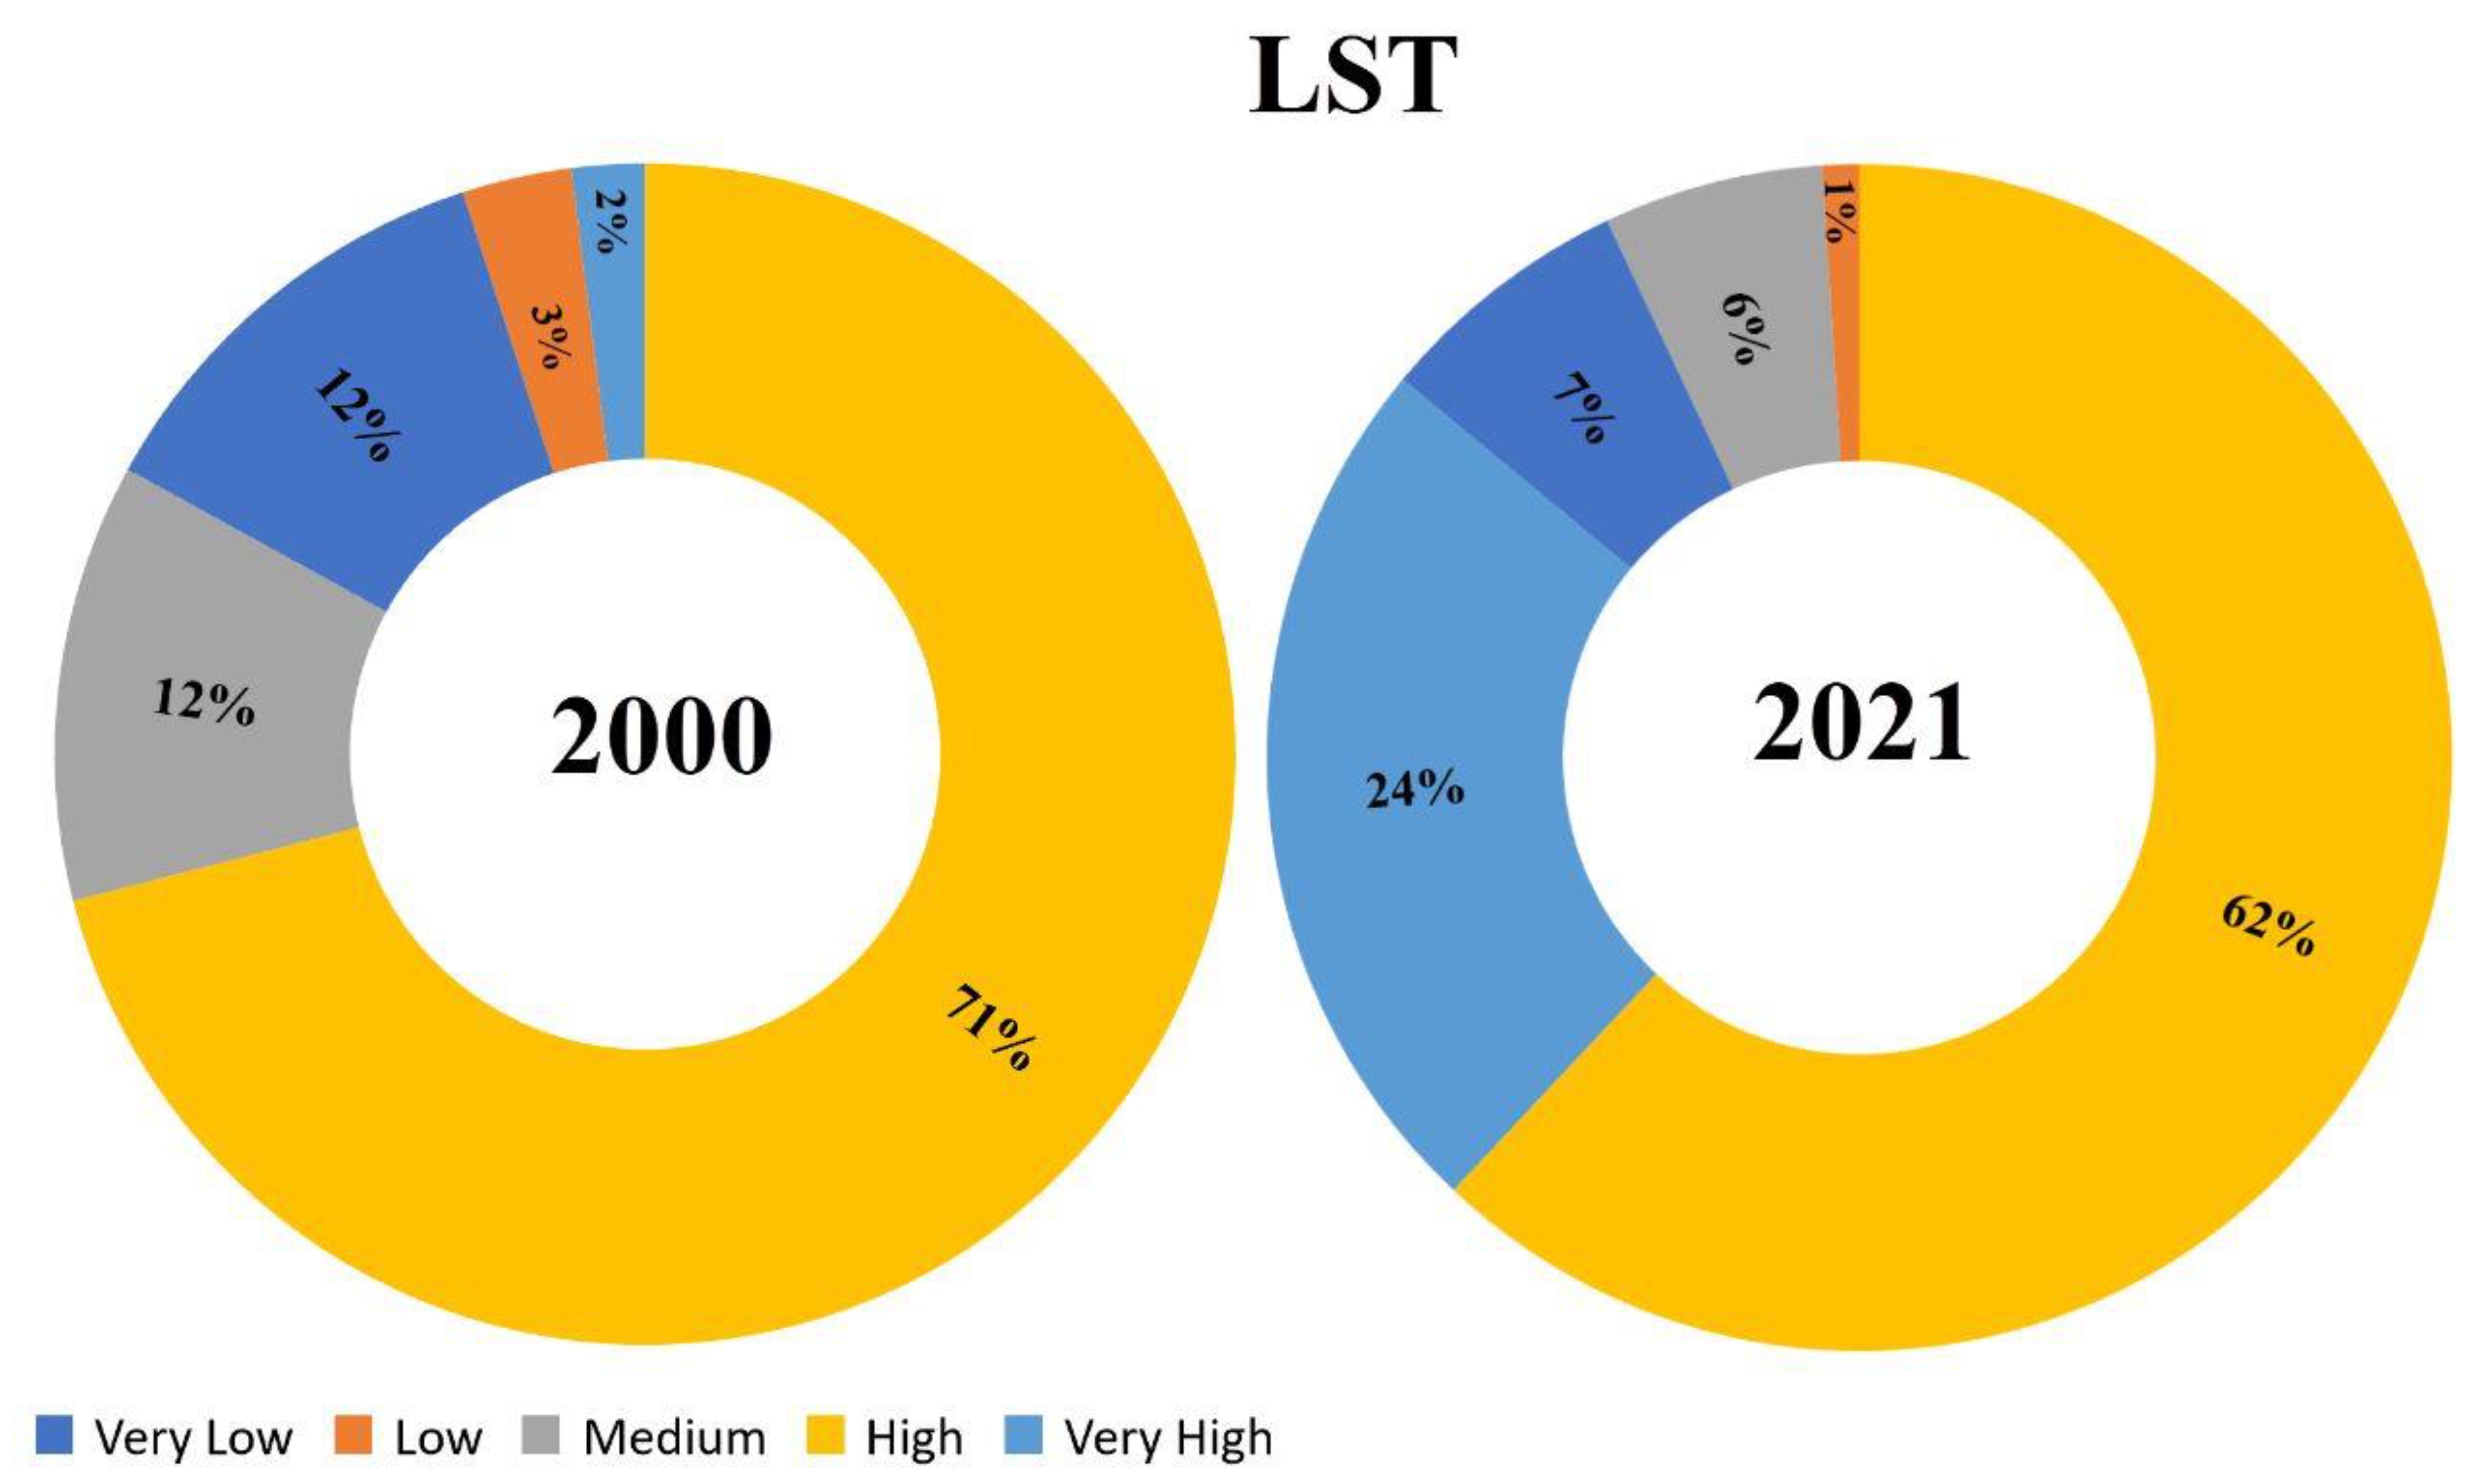
| Year | Qualitative Classifications of LST | ||||
|---|---|---|---|---|---|
| Very High | High | Medium | Low | Very Low | |
| 2000 | 2% | 71% | 12% | 3% | 12% |
| 2021 | 24% | 62% | 6% | 1% | 7% |
| Year | LST | NDVI | Correlation Coefficient for LST-NDVI | ||||||
|---|---|---|---|---|---|---|---|---|---|
| Min | Max | Mean | Std | Min | Max | Mean | Std | ||
| 2000 | 24.18 | 50.48 | 43.74 | 5.50 | 0.01 | 0.10 | 0.06 | 0.02 | 0.031 |
| 2021 | 28.42 | 53.81 | 46.36 | 5.24 | 0.01 | 0.13 | 0.07 | 0.02 | 0.095 |
Disclaimer/Publisher’s Note: The statements, opinions and data contained in all publications are solely those of the individual author(s) and contributor(s) and not of MDPI and/or the editor(s). MDPI and/or the editor(s) disclaim responsibility for any injury to people or property resulting from any ideas, methods, instructions or products referred to in the content. |
© 2023 by the authors. Licensee MDPI, Basel, Switzerland. This article is an open access article distributed under the terms and conditions of the Creative Commons Attribution (CC BY) license (https://creativecommons.org/licenses/by/4.0/).
Share and Cite
Alqahtani, F.; Ehsan, M.; Abdulfarraj, M.; Aboud, E.; Naseer, Z.; El-Masry, N.N.; Abdelwahed, M.F. Machine Learning Techniques in Predicting Bottom Hole Temperature and Remote Sensing for Assessment of Geothermal Potential in the Kingdom of Saudi Arabia. Sustainability 2023, 15, 12718. https://doi.org/10.3390/su151712718
Alqahtani F, Ehsan M, Abdulfarraj M, Aboud E, Naseer Z, El-Masry NN, Abdelwahed MF. Machine Learning Techniques in Predicting Bottom Hole Temperature and Remote Sensing for Assessment of Geothermal Potential in the Kingdom of Saudi Arabia. Sustainability. 2023; 15(17):12718. https://doi.org/10.3390/su151712718
Chicago/Turabian StyleAlqahtani, Faisal, Muhsan Ehsan, Murad Abdulfarraj, Essam Aboud, Zohaib Naseer, Nabil N. El-Masry, and Mohamed F. Abdelwahed. 2023. "Machine Learning Techniques in Predicting Bottom Hole Temperature and Remote Sensing for Assessment of Geothermal Potential in the Kingdom of Saudi Arabia" Sustainability 15, no. 17: 12718. https://doi.org/10.3390/su151712718