
Impact of Climate Change on Inflation in 26 Selected Countries

1
School of Economics and Finance, Xi’an International Studies University, Xi’an 710128, China
2
Management School, Xi’an University of Architecture and Technology, Xi’an 710055, China
*
Author to whom correspondence should be addressed.
Sustainability 2023, 15(17), 13108; https://doi.org/10.3390/su151713108
Submission received: 30 July 2023
/
Revised: 25 August 2023
/
Accepted: 28 August 2023
/
Published: 31 August 2023
(This article belongs to the Special Issue Resource Price Fluctuations and Sustainable Growth)
Abstract
:In the era of persistent globalization, climate governance has emerged as a prominent concern within both the theoretical community and government departments of diverse nations. Of particular interest in academic research is the adverse effect of climate shocks on the global economy. This paper employs average temperature as a surrogate indicator for climate shocks and examines the influence of temperature fluctuations on inflation levels using a balanced panel dataset from 1995 to 2021. The findings indicate a positive association between temperature change and inflation within the country, which remains consistent even after subjecting the analysis to multiple robustness tests. Furthermore, accounting for heterogeneity reveals variations in the magnitude of response of inflation levels to temperature fluctuations. Regarding the analysis of underlying mechanisms, this study underscores the significance of energy demand as a pivotal pathway influencing inflationary pressures at the national level. Lastly, by incorporating GDP per capita as a threshold, this research reveals a nonlinear relationship between temperature change and inflation levels.
1. Introduction
The increasingly frequent occurrence of extreme natural disasters and global temperature anomalies have elevated climate shocks to a significant impediment to both human survival and development [1,2,3,4,5,6]. The effects of climate change have been intensifying over the past few decades and have received a great deal of attention around the world [7]. In January 2023, the Global Risks Report 2023 by the World Economic Forum (WEF) provided rankings of global risks in terms of severity, encompassing both the short-term (next two years) and long-term (next ten years) outlook. Furthermore, in March 2023, the Intergovernmental Panel on Climate Change (IPCC) of the United Nations released its sixth assessment report (AR6), highlighting the role of anthropogenic greenhouse gas emissions in driving global warming. The report underscores the extensive ramifications on food and water security, and human health, as well as the far-reaching economic, social, and environmental development as the three pillars of sustainability. In April 2023, the Emergency Disaster Database (EM-DAT) reported that the cumulative economic losses attributed to climate change reached a staggering USD 223.8 billion. The year 2022 witnessed the occurrence of 387 natural disasters worldwide, leading to a tragic loss of 30,704 lives and affecting approximately 185 million individuals. Notably, hot weather conditions alone accounted for 16,305 fatalities, constituting over half of the total deaths recorded in 2022. Climate change is a pressing global issue that poses significant challenges to the development of nations worldwide. Temperature change has consistently garnered substantial attention from countries across the globe. An example of this attention is the 26th Conference of the Parties (COP26) of the United Nations Framework Convention on Climate Change (UNFCCC) in November 2021. At this conference, 200 countries and major economies signed the Glasgow Climate Convention. They committed to limiting global warming to 1.5 degrees Celsius (currently approaching 1.2 degrees Celsius) to mitigate the escalation of extreme catastrophic climate events on a global scale. Global warming serves as a critical manifestation of climate change, with temperature change serving as a crucial indicator thereof. Against this backdrop, scholars and experts have delved into the multifaceted impact of temperature change on crucial aspects such as human life security, economic development, financial stability, agricultural production, energy consumption, and ecosystems.
Inflation, a key macroeconomic factor, holds a pivotal role in the monetary policy objectives of central banks and serves as a measure of a country’s economic health and smooth progress. Not only is it a matter of utmost concern for government departments worldwide, but it also assumes great importance for citizens, directly influencing their living standards and well-being. The awareness has increased steadily among scholars regarding the impact of temperature changes, within the framework of climate shocks, on the level of inflation [8,9,10,11,12,13]. Prior research has demonstrated the significant impact of temperature changes on the level of inflation within a country, with the magnitude of this effect varying across nations with different levels of economic development. Notably, Faccia et al. [10] discovered that abnormal summer temperatures exert distinct influences on inflation levels in developed and developing countries. Specifically, high summer temperatures were found to decrease inflation in the medium to long term in developed countries. Conversely, Mukherjee et al. [13] revealed that temperature shocks induce inflationary pressures in both developed and developing countries, with the effects persisting for a longer duration in developing nations.
Hence, this paper adopts the relationship between climate change and inflation as a focal point, conducting empirical analyses to investigate the impact of temperature changes resulting from climate shocks on inflation. This investigation utilizes balanced panel data encompassing 26 selected countries from 1995 to 2021 to formulate policy recommendations aimed at addressing the identified issues.
2. Literature Review and Hypotheses Creation
2.1. The Concept and Measurement of Climate Change
According to the World Meteorological Organization (WMO), climate change refers to the alteration in average weather patterns over an extended duration. The IPCC of the United Nations defines climate change as the application of statistical analyses to detect alterations in the mean or rate of change in pertinent data, thereby identifying shifts in the climate state that persist for decades or longer. Additionally, the UNFCCC defines climate change as modifications in the global climate system over an extended timeframe, attributed directly or indirectly to human activities.
In empirical analyses aimed at measuring climate change, certain scholars utilize temperature change as a key metric. Dell et al. [5] used average temperature as a proxy for climate change. Lanzafame [14] measured climate change by temperature and precipitation. Colacito et al. [15] measured climate change by temperature. Acevedo et al. (2020) [16] used average temperature as a measure of climate change. Chandio et al. [17] used temperature and precipitation as proxies to measure climate change. Bandt et al. [18] measured climate change through temperature change. Mukherjee [13] used temperature change from the UN Food and Agriculture Organization’s climate database to measure climate change and referred to Atalla in the robustness test. Faccia [10] used FAOSTAT seasonal temperature data to measure climate change and replaced the original data with temperature change indicators published in the World Bank’s Climate Change Knowledge Portal for a robustness test. Odongo et al. [19] measured climate change using temperature change indicators published in the World Bank’s Climate Change Knowledge Portal. Liu, M. H. [6] constructed a total temperature change indicator by heating degree days (HDD) and cooling degree days (CDD) to measure climate change using temperature change. Liu B ([4] used standardized annual mean temperature to measure climate change, Ciccarelli M [20] used mean temperature and temperature change as proxies for climate change, and Kotz M et al. [21] used mean temperature to measure climate change.
Other researchers have measured climate change using the frequency of extreme natural disasters and the economic losses caused by disasters in the Emergency Disaster Database (EM-DAT). Benson et al. [22] used the frequency of natural disasters as a measure of climate change. Lesk et al. [23] used economic losses due to droughts, floods, and temperature extremes as a measure of climate change. The study found that the impact of extreme natural disasters on grain production in various countries around the world significantly reduced grain yields by 9% to 10%. In order to reflect the severity of climatic natural disasters, Parker [24] constructed an impact variable including disasters related to earthquakes, storms, floods, droughts, etc., to measure climate change. To capture the potential damage from cyclones, Heinen et al. [11] constructed a potential cyclone damage index and a potential flood damage index to measure climate change, following the approach of Strobl [25]. Debelle [26] states that natural disasters caused by climate change may adversely affect the macroeconomy through interest rate risk. Kunawotor et al. [27] measured the severity of disasters by the number of deaths and economic losses caused by the disaster, classified them into three categories, and introduced floods and droughts to measure climate change. Following Fratzscher et al. [28], Beirne [29] measures climate change by dividing the monetary losses due to disasters in the EM-DAT database by the GDP of the affected country at current prices before the disaster.
2.2. Macroeconomic Implications of Climate Change
In recent years, the issue of climate change has received extensive attention from scholars at home and abroad, and the frequency of extreme natural disasters and the economic losses caused by abnormal temperatures to countries around the world have increased. More and more scholars are engaged in exploring the relationship between climate change and economic development, financial stability, human life safety, agricultural production, energy consumption, and other aspects.
Related studies have shown that temperature changes as well as extreme natural disasters have adverse macroeconomic effects. Bansal and Ochoa [3], using global capital market data, find that the covariance between country stock returns and temperature contains information about cross-country risk premia, that temperature has an impact on the overall economy, and that temperature risk premia are higher the closer the country is to being late to the party. Dell et al. [5] use average temperature as a proxy for climate change and find that higher temperatures have a significant impact on economic growth in poorer countries, with a 1 °C increase in average temperature reducing growth by 1.3%. Lanzafame [14] examines this empirically and finds that temperature affects income in both the short and long run. Hsiang and Jina [30] examined the impact of natural disasters on national economic growth. After a natural disaster, national income declines and does not recover within 20 years. Nordhaus [31] used the updated DICE model to predict the uncertainty of future climate change and emphasized that the impact of climate change on future economic variables is highly uncertain. Debelle [26] found that natural disasters caused by climate change can damage infrastructure, increase agricultural losses, and increase product prices, among other things. Acevedo et al. [16] use annual data for 180 countries from 1950–2015 to test that temperature change negatively affects economic output by reducing labor productivity, with larger increases in average temperature having a larger negative impact on output. Chandio et al. [17] use temperature and precipitation as proxies for climate change and find that temperature change has a positive effect on agricultural production in the short run and a negative effect in the long run. Bandt et al. [18] use data from 1960–2017 to examine the effect of temperature change on the annual growth rate of GDP per capita in 126 countries. The results of the study show that for every 1 °C increase in temperature, the annual growth rate of GDP per capita decreases by 0.74% to 1.25%. Feitelson and Tubi [32] showed that climate change is an intermediate variable that leads to the emergence of violent conflicts in the Middle East. Pugatch, T. [33] found that extreme weather events (storms) lead to an increase in the mortality rate of the Mexican population, and the magnitude of the increase in the number of deaths depends on the intensity of the storms compared to the frequency of the storms. Climate change has become the greatest threat to the agricultural sector worldwide, causing natural disasters that are most damaging to agricultural production. Studies have shown that both temperature anomalies and precipitation can have an impact on reducing agricultural yields. Mukherjee and Ouatarra [13] show that temperature change affects agricultural production and energy demand, which affects the global price level when demand exceeds supply. Liu, M. H. [6] empirically examines the effect of temperature change on household energy consumption using panel data from the perspective of demand heterogeneity.
2.3. Effects of Climate Change on Inflation
To date, researchers have conducted comprehensive investigations into the influence of climate change on macroeconomic factors from multiple perspectives. However, there has been relatively less emphasis on exploring the specific effects of temperature changes and extreme natural disasters on inflation. Moreover, scholarly consensus has not been reached regarding the relationship between climate change and inflation, with diverging viewpoints among scholars. Some argue that climate change has an insignificant impact on inflation levels. For example, Cavallo et al. [34] show that this relationship is insignificant in Chile in 2010. Abe [35] observed that Japan experienced a minimal increase in inflation following the disaster.
However, certain scholars argue that climate does indeed affect inflation. On the one hand, related scholars believe that climate change reduces inflation. Doyle and Noy [9] empirically examined the impact of natural disasters on the short-term economy of New Zealand by using a VAR model and found that after natural disasters, the country’s aggregate demand is reduced, which in turn reduces the level of inflation. Faccia et al. [10] analyze the impact of abnormal summer temperatures on inflation in developed and developing countries and show that high summer temperatures reduce inflation in the medium to long run. Cevik, S. [36] empirically examines the impact of temperature shocks on consumer price inflation using data from 173 countries over the period 1970–2020 and finds that temperature shocks reduce the level of inflation. Ciccarelli, M. [20] empirically examines the impact of temperature shocks on consumer price inflation using average temperature and temperature change as proxies for climate change and finds that higher average monthly temperatures generally increase inflation in the summer months while decreasing inflation in other seasons.
On the other hand, scholars have argued that climate change contributes to the growth of inflation. Cashin et al. [37] found that the El Niño phenomenon led to an increase in the prices of energy and non-fuel commodities, which ultimately led to an increase in inflation in the short run. Heinen et al. [11] found that climate change-induced floods and hurricanes increased inflation in 15 countries in the Caribbean. Batten et al. [8] find that changes in temperature increase the volatility of agricultural and energy prices, which in turn increases the volatility of inflation. Klomp and Sseruyange [12] find that natural disasters significantly increase a country’s price level regardless of the independence of the central bank; analyzed from a demand perspective, rebuilding destroyed infrastructure may lead to an increase in the prices of related products. Mukherjee and Ouatarra [13] examined the impact of temperature shocks on inflation using a PVAR model and showed that temperature shocks can generate inflationary pressures in both developed and developing countries, and that this effect lasts longer in developing countries. Kim et al. [38] incorporate extreme weather into the macroeconomic analysis of the United States by constructing a climate index that includes temperature, precipitation, drought, and wind speed, and find that an increase in extreme weather results in a persistent decrease in US industrial productivity and an increase in inflation. Yusifzada, T. [39] empirically examined the impact of temperature change on inflation in Azerbaijan using a BVAR model and found that the level of inflation increases significantly when climatic conditions change. A recent study by Islam et al. [40] found that climate change exacerbates inflation in Bangladesh. Odongo et al. [19], based on data from eight countries in Southeast Africa from 2001–2020, found that climate change, as measured by changes in temperature, pushes up headline inflation, the level of food inflation, and core inflation. Kabundi, A. [41] pointed out the heterogeneity of temperature shocks on inflation in developed, emerging economies in the short run. For developed economies, temperature shocks have little effect on inflation in the short run, while for emerging economies, temperature shocks significantly affect the level of inflation. Natoli [42] found that temperature shocks significantly affect the level of output and prices in the U.S.A. Kotz M et al. [21] found that the average monthly temperature leads to an increase in the level of inflation in high-income countries and low-income countries. Therefore, this study offered the following research hypothesis:
H1.
The change in temperature affects the level of inflation.
H2.
There is heterogeneity in the effect of temperature change on inflation across countries.
2.4. Channels through Which Climate Change Affects Inflation
The Sixth Assessment Report (AR6) released by the United Nations Intergovernmental Panel on Climate Change (IPCC) suggests that energy supply, energy demand, and energy transportation are all affected by climate change. The impact of temperature on energy is more prominent than wind speed and humidity [43,44]. Climate change may affect prices through supply-side and demand-side shocks, and studies have found that changes in temperature increase energy price volatility, which in turn increases inflation volatility [8,20,45].
From a supply perspective, climate change increases the vulnerability of food production systems and the natural resource base, and climate change also affects energy supply by reducing the productivity of energy-producing infrastructure, leading to a decrease in energy supply [13,46]. From a demand perspective, as the climate becomes more extreme (hotter or colder), the adaptive behavior of the climate leads to a possible increase in energy demand [6]. The mitigating behavior of climate change may lead to changes in the energy mix, which may exacerbate the volatility of the overall inflation rate [47]. The Sixth Assessment Report (AR6) released by the United Nations Intergovernmental Panel on Climate Change (IPCC) suggests that energy supply, energy demand, and energy transportation will be affected by climate change. Temperature changes and extreme disasters due to climate change may affect energy preferences and increase energy demand [8,13]. Climate change affects energy demand mainly by influencing heating and cooling demand [48]. Liu, M. H. [6] empirically examined the impact of temperature change on household energy consumption using panel data from 2005–2017. The study found that temperature change significantly affects household electricity demand, and when the number of heating degree-days and cooling degree-days each increase by 1 °C, household electricity demand increases by 8.5% and 20%, respectively. Therefore, this study offered the following research hypothesis:
H3.
Changes in temperature lead to changes in the level of inflation through effects on energy demand.
This literature review shows the considerable attention of researchers to the issue of climate change around the world, which has the following characteristics. Firstly, these studies mostly focus on the impact of climate change on economic development, financial stability, and human life security, while fewer studies target the analysis of the impact of climate change on inflation. Secondly, the existing studies have empirically examined the role of income level in the effect of climate change on inflation, which makes it difficult to identify the possible non-linear effects. To resolve these limitations, this paper focuses on the nexus of climate change and inflation and tries to expand the existing studies in the following aspects: 1—investigating the impact of climate change on inflation in a targeted manner; 2—using a panel threshold model to analyze the nonlinear role played by the high- and low-income levels among countries in the effect of temperature change on inflation; and 3—using a panel mediation model to start from the demand side and explore the channels of the role of energy demand in the effect of temperature change on inflation.
3. Materials and Methods
3.1. Measurement Model Setting
3.1.1. Baseline Regression Model Setting
To investigate the impact of climate change on inflation across various countries, this study utilizes balanced panel data encompassing 26 countries worldwide from 1995 to 2021. A panel two-way fixed effects model addresses the potential estimation bias caused by omitted variables. Equation (1) minimizes and eliminates such bias.
where i and t denote country and year, respectively. and are the explanatory and core explanatory variables, denoting the level of inflation and average temperature, respectively. The control variables mainly include urbanization rate (Urban), precipitation (PRE), GDP per capita (), unemployment rate (Unemp), and money supply (M2). and denote country and time-fixed effects, respectively, and is random error terms. is the constant term; is the coefficient of temperature variation, representing the effect of climate factors on inflation.
3.1.2. Panel Threshold Model Setting
An econometric linear model may not effectively capture the complexities of the potential nonlinear effects of temperature changes on the relationship between inflation and GDP per capita. To address this issue, an econometrics threshold model accounts for changes in the direction or magnitude of economic parameter estimates when the parameter surpasses a specific threshold [49]. By employing threshold regression, researchers can mitigate the issues arising from subjective judgment, thereby reducing statistical errors and estimation bias [50]. Based on the panel threshold model proposed by Hansen [51], this research estimates Equation (2) which is a single threshold model.
where GDPpercapita is the threshold variable and I (-) is an indicator function that is equal to 0 when the expression in parentheses is false; otherwise, it is 1. The model is equivalent to a segmentation function that is equal to 1 when when the estimated coefficient of ; when when the estimated coefficients of and is not equal to are not equal, implying that there is a threshold effect of GDPpercapita on inflation and that there is a difference in the effect of differences in GDPpercapita on inflation [8].
After verifying the single threshold, the existence of multiple dual thresholds or multiple thresholds is further tested, and the dual threshold model is as follows:
where and are the first and second threshold values, respectively.
3.1.3. Intermediate Effect Model
In order to delve deeper into the mechanism through which temperature change affects inflation and to investigate the potential transmission pathway of “temperature change-energy consumption-inflation”, this study establishes a mediating effect model. This model is built upon the baseline regression model and adopts the methodology introduced by Zhonglin Wen et al. [52]. Equations (4)–(6) show the mediating effect model.
where is the mediating variable, measured by primary energy consumption. , , , and are the core coefficients to focus on the mechanism analysis, when are significant. is insignificant, when energy consumption plays a partially mediating role in the effect of temperature on inflation. If the coefficients of are significant, energy consumption plays a fully mediating role. and are total and direct effects of temperature change on inflation, respectively. represents the mediating effect.
3.2. Variable Description
3.2.1. Explanatory Variables
The inflation rate is the level of inflation within a country, a crucial indicator representing the monetary policy objectives of central banks. This study adopts the approach of Ruching Wei [53] by employing two explanatory variables, namely the inflation rate (Inflation) and the annual growth rate of the GDP deflator (GDP deflator). The consumer price index (CPI) is utilized to measure inflation, representing the annual percentage change in the cost of a basket of goods and services typically purchased by the average consumer. In addition, the annual growth rate of the GDP deflator is employed as an alternative measure of inflation, providing a more comprehensive reflection of the overall price changes within the economy.
3.2.2. Core Explanatory Variables
Scholars commonly adopt average temperature and temperature change as indicators of climate change [3,4,5,6]. In this study, the average temperature (Tempworld) is the proxy for climate change. According to the literature review, climatic factors such as relative humidity and sunshine duration have a limited impact on inflation and are not incorporated into the current model due to data unavailability. Furthermore, for robustness testing, this paper includes temperature change (TEMPFAO) as an additional variable. To ensure the robustness of the analysis, the standardized annual average temperature (STEMP) serves as a proxy for average temperature, following the approach employed by Liu Bo [4].
3.2.3. Intermediate Variables
Mukherjee and Ouatarra [13] have highlighted that global temperature change leads to an increase in energy demand. When this demand surpasses the available energy supply, it impacts the level of inflation and results in fluctuations in global price levels. Based on this analysis, this study considers energy consumption as the mediating variable to investigate the mechanism through which temperature change affects inflation. The utilization of global energy consumption data allows for an examination of energy consumption patterns across various countries worldwide.
3.2.4. Control Variables
Inflation, as a significant indicator in macroeconomic analysis, is subject to the influence of various factors. This paper suggests incorporating control variables including the urbanization rate (Urban), GDP per capita (GDP-percapita), unemployment rate (Unemp), and money supply (M2). Specifically, the urbanization rate (Urban) has a direct effect on the consumption levels and preferences of residents, thereby exerting an impact on inflation. In this research, urbanization is the level of urbanization population divided by the total population.
Money supply (M2) as the quantity of money in circulation is another factor that influences inflation. GDP per capita (GDP-percapita) as the level of economic development is a significant determinant of inflation. GDP per capita in constant 2015 U.S. dollars is the proxy for economic development. The unemployment rate (Unemp) shows the level of unemployment. The unemployment rate is measured by the proportion of the unemployed population in the total labor force, paving the way for illustrating the Phillips curve which interconnects unemployment and inflation. Additionally, annual rainfall (PRE) is a control variable to consider the impact of annual rainfall on climate change alongside average temperature. Table 1 shows the definition about the variables.
3.3. Data and Descriptive Statistics
Based on the global GDP rankings for 2021, this paper considers the top 33 countries or regions that collectively account for 90% of the total global GDP. Among them, this selects 26 countries, representing various regions: America (4 countries), Asia (8 countries), Oceania (1 country), and Europe (13 countries). They comprise 19 high-income countries and 7 low- and middle-income countries, ensuring a diverse sample. The econometric model uses balanced panel data spanning from 1995 to 2021 in logarithmic form to mitigate the impact of data heteroskedasticity and to minimize estimation errors. The dataset sources are the CEIC, EPS, World Bank World Development Indicators, IFS, BP World Energy, and FAO Climate Database. In cases where certain data points were missing, interpolation techniques fill in the gaps. All data processing and calculations were conducted using Stata 17 statistical software. Table 2 presents the descriptive statistics of each variable used in the analysis:
The mean value of inflation (Inflation) is 4.75, where the minimum value is −4.48 and the maximum value is 197.41, with a standard deviation of 12.03, indicating high overall volatility. The standard deviation of the mean temperature (TEMPworld) is 8.40, with large volatility. Meanwhile, the standard deviation of precipitation (lnPRE) is 0.65, which indicates that the overall volatility of precipitation is low.
4. Results
4.1. Baseline Regression Results
Table 3 presents the results of the benchmark regression analysis investigating the impact of temperature change on inflation in a country (region). The empirical analysis was conducted using Stata 17 software, and the results are reported in columns (1) and (3) of the table. These columns reflect the findings when controlling solely for two-way fixed effects in both the country (region) and time dimensions, excluding additional control variables. The estimated coefficient of the main explanatory variable TEMPworld is positive, but statistically insignificant. This result suggests that temperature change has a relatively low direct effect on a country (region), ignoring the other influential factors. To mitigate potential estimation bias stemming from omitted variables, control variables (i.e., money supply, GDP per capita, unemployment rate, precipitation, and urbanization rate) were included in columns (2) and (4) of the regression analysis. The results demonstrate that after accounting for these additional factors, the estimated coefficient of the core explanatory variable TEMPworld is positive and statistically significant at the 5% level. This suggests that temperature change has a significant and positive effect on the inflation level.
Furthermore, examining the effect of temperature change requires considering the impact of other control variables. The estimated coefficients of the explanatory variable TEMPworld for both representations of the inflation level are 1.894 and 1.791. These coefficients indicate that a 1% change in temperature within a country (region) will lead to a corresponding increase in the inflation level by 0.0189% and 0.0179%, respectively. These findings highlight the positive relationship between temperature change and inflation in the country. Here we test H1.
4.2. Threshold Effect (Double Threshold)—GDP per Capita
To further examine the potential nonlinear impact of temperature fluctuations on the inflation level in relation to GDP per capita, this study employs GDP per capita as the threshold variable and utilizes Hansen’s [51] bootstrap self-help method to assess the presence of a threshold effect. The single, double, and triple threshold tests were performed sequentially using Stata 17 statistical software, with 500 repetitions of the sampling process. Table 4 presents the results of the threshold effect tests. The analysis reveals that GDP per capita rejects the null hypotheses of no threshold and only one threshold at the 5% and 1% significance levels, respectively. However, it accepts the original hypothesis of the presence of two thresholds. This finding suggests the existence of a double threshold effect of GDP per capita in the relationship between temperature change and inflation.
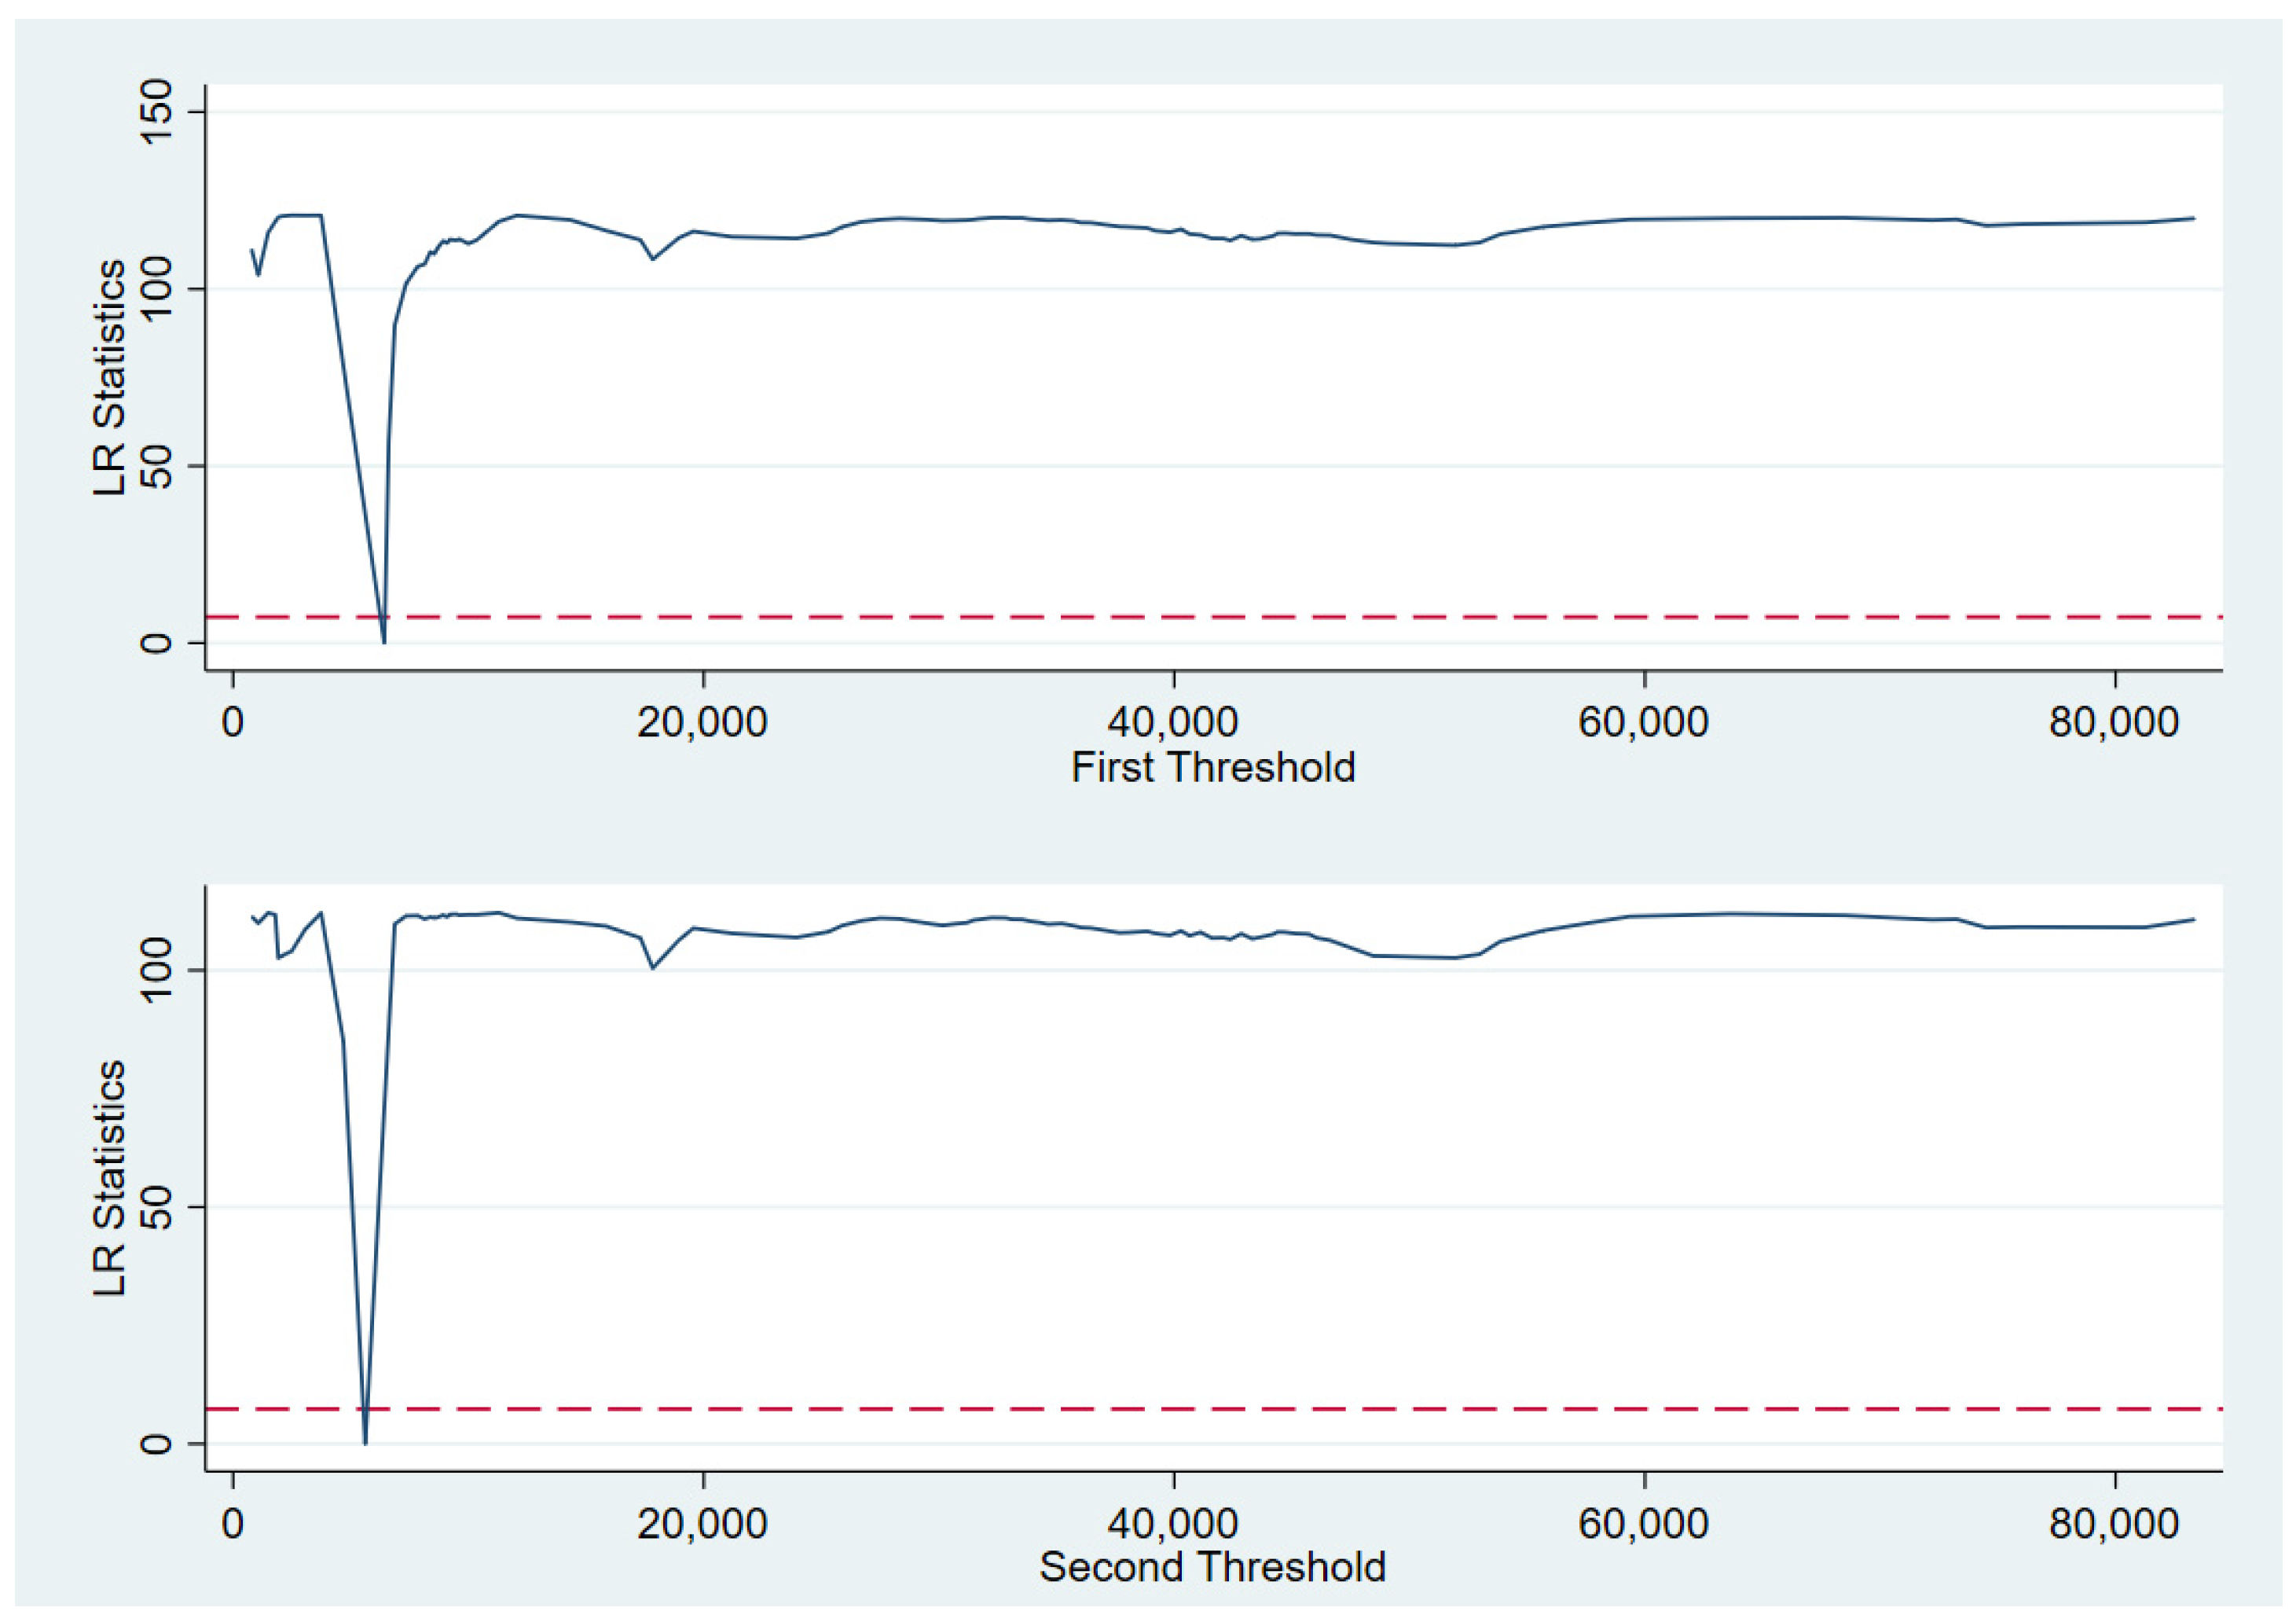
Table 5 presents the results of the threshold model analysis. The findings indicate that the first threshold value of GDP per capita is estimated to be 5618.95, while the second threshold value is estimated to be 6524.5. Within the range of these threshold values, GDP per capita exhibits a significant and positive effect on the inflation level.
As per the principle of the threshold model, the threshold estimate corresponds to the value at which the likelihood ratio (LR) statistic is closest to 0, representing the lowest point on the LR plot. The validity of the threshold estimate is confirmed when the LR associated with the estimated threshold is smaller than the critical value. In this case, all the lowest points on the graph are smaller than the critical value, confirming the validity of the threshold estimates. Table 6 shows the panel threshold estimation results.
4.3. Mechanism Test
Table 7 represents the regressions results to examine the existence of this transmission pathway. Column (1) of Table 7 displays the results of the total effect regression, indicating a direct and positive relationship between temperature change and the inflation level, which is statistically significant at 5% level. Column (2) shows whether temperature change impacts energy demand. The coefficient of average temperature is estimated to be −0.0295, which is statistically significant at 1% level. This suggests that a one-unit increase in average temperature leads to a 0.0295 percentage point decrease in energy demand. This paper argues that this decrease in energy consumption is attributed to the reduced utilization of non-clean energy sources during the country’s development. Climate change has significant implications for global supply and demand dynamics. On the demand side, climate change contributes to a decline in consumer demand, investment, and trade activities. On the supply side, climate change results in reduced labor productivity and ultimately leads to a decrease in overall production capacity. The impact of temperature changes is twofold. Firstly, it reduces the demand for non-clean energy sources as individuals and industries shift towards cleaner alternatives. Secondly, it negatively affects labor productivity and increases transaction costs, thereby limiting the energy supply. The final price level relies on the relative changes in supply and demand resulting from these factors. The reduction in energy supply outweighs the reduction in energy demand, resulting in an overall increase in the price level. Column (3) shows whether energy consumption acts as a mediator between temperature change and inflation. The coefficient of energy consumption is 11.7676, which is statistically significant at 1% level. This finding suggests the presence of a mediating effect, with the regression coefficient of temperature change being significantly positive. This indicates that energy consumption partially mediates the relationship between temperature change and inflation, thereby confirming the existence of the “temperature change-energy consumption-inflation” pathway. Here we test H3.
To ensure the robustness of the results, this study employs the bootstrap test to examine the mediation effect of energy consumption on the original sample of 1000 observations. The bootstrap test results in Table 8 reveal that the confidence interval of the indirect effect excludes 0. This finding suggests the presence of an indirect effect of temperature change on inflation, with energy consumption serving as a mediating variable. Furthermore, the confidence interval of the direct effect also excludes 0, indicating the existence of a direct effect of temperature change on inflation. In this context, energy consumption demonstrates a partial mediating role.
4.4. Robustness Test
4.4.1. Substitution of Explanatory Variables
Robustness tests use three distinct methodologies to check the robustness of the benchmark regression results. Table 9 represents the robustness tests results.
In the subsequent analysis, the key explanatory variables are substituted. Specifically, this study re-conducts the regression using temperature change data sourced from the UN FAO climate database (TEMPFAO) and follows the approach employed by Liu Bo [4] using standardized annual average temperature (STEMP) as a proxy for average temperature. Table 9 presents the regression results. Following the replacement of the core explanatory variables, the positive effect of temperature change on inflation persists due to its statistically significant effect. Notably, the findings regarding the core explanatory variables align with the results obtained from the benchmark regression on the full sample. This consistency indicates the robustness of the test outcomes, even after replacing the core explanatory variables.
4.4.2. Adjust the Research Year Interval
To consider the impact of special events on the research timeframe, the research adjusts the year interval, specifically regarding the Asian financial crisis in 1997 and the global financial crisis in 2008. These crises may have influenced the data on inflation and the unemployment rate during the respective periods. To address this issue, this study adopts a similar approach as Yuan Yiren [54], which excludes data from the original sample for the year in which the special event occurred, as well as the current and subsequent years. Then, this adjusted dataset revalidates the findings. Columns (1) and (2) present the regression results obtained after excluding only the year in which the special event occurred. In addition, columns (3) and (4) display the regression results obtained after excluding both the current and subsequent years. This approach considers the possibility that the special event may have a sustained impact on the economy beyond the year of its occurrence. Table 10 represents the results of these regressions. Even after excluding the special year, the analysis reveals a consistent positive effect of temperature change on inflation. These findings align with the test results obtained from the benchmark regression on the full sample. Moreover, all of the reported coefficients are statistically significant at 10% level, indicating the robustness of the findings.
4.4.3. Excluded Hyperinflationary Countries
Furthermore, this study checks outliers and excludes countries with the experience of hyperinflation from the sample to ensure the robustness of the analysis [13]. Among the 26 countries considered in this study, four countries have experienced hyperinflation. Table 11 represents the outcomes of the re-test conducted after the exclusion. The analysis reveals that temperature change continues to exhibit a positive correlation, which is statistically significant at 10% and 5%, respectively. These results indicate the robustness of the results.
4.4.4. Endogeneity Issues
This paper uses a panel fixed effects model, which may be subject to endogeneity problems. If there is a correlation between the explanatory variables and the error term, it may bias the regression results and lead to inaccurate estimates. Therefore, this paper chooses carbon dioxide emissions as an instrumental variable and uses two-stage least squares to test it. The results in Table 12 show that the effect of temperature change on inflation still exists and is significant at 10% significance level, and the p-value of Kleibergen-Paap rk LM statistic is 0.000, which rejects the original hypothesis of “insufficient identification of instrumental variables”; the value of Kleibergen-Paap Wald rk F statistic is greater than the critical value of Stock-Yogo weak identification test at 10% level, which indicates the appropriateness of CO2 emissions as an instrumental variable.
4.5. Heterogeneity Test
4.5.1. Income Grouping—High-Income and Lower-Middle-Income Country Groupings
Research has demonstrated that the impact of climate shocks differs among countries at different stages of economic development. Developing countries, in particular, exhibit higher vulnerability to climate shocks, characterized by both greater intensity and longer durations of adverse effects, in contrast to developed countries [10,13]. Hence, in order to further examine the potential variations in the effects of temperature changes on inflation across countries with distinct income levels, this study conducts a classification test on the sample. Following the World Bank’s classification criteria, countries can be categorized based on their income levels. Specifically, countries with a Gross National Income (GNI) per capita exceeding $13,205 in 2021 are classified as high-income countries, while those below this threshold are considered low- and middle-income countries. Based on the World Bank’s income classification criteria, there are 19 high-income countries and 7 low- and middle-income countries.
Table 13 provides the regression results. Columns (1) and (2) show that average temperature change has a statistically insignificant effect on inflation in high-income countries. However, columns (3) and (4) show that the coefficients of average temperature change are 8.903 and 7.047, which are statistically significant at 1% and 5% levels, respectively. This result indicates heterogeneity in the effect of average temperature change on inflation across countries with different income levels. Specifically, low- and middle-income countries demonstrate higher vulnerability when confronted with climate shocks compared to high-income countries. Price stability is a vital prerequisite for boosting economic growth. However, in the face of external shocks, the timely identification and appropriate adjustment by central banks become crucial for ensuring the seamless operation of the economy. When central banks prioritize the assessment of climate change’s impact on monetary policy, they enhance their ability to promptly discern the origins of inflationary pressures and implement effective measures to mitigate the adverse consequences of external shocks on the economy. By proactively addressing the influence of climate change on monetary policy, a country’s central bank can swiftly identify the sources of inflationary pressures and implement appropriate measures to mitigate the negative impacts of external shocks on its economy.
For instance, according to Taylor’s Law, central banks can respond to fluctuations in inflation or output by modifying short-term interest rates. Compared to high-income countries, low- and middle-income countries may have a relatively lower focus on climate-related issues and may exhibit reduced sensitivity in identifying inflationary pressures. Consequently, inflation levels in these countries may experience more pronounced fluctuations. Here we test H2.
4.5.2. Temperature Grouping (High-Temperature Group and Low-Temperature Group)
Using the median annual mean temperature as the cut-off point, the research is re-run for the high-temperature group and the low-temperature group, including countries with annual mean temperatures above the median mean temperature and vice versa. Table 14 shows the results. Columns (1) and (2) show that the change in average temperature has an insignificant effect on inflation in countries with high-temperature. The estimated coefficients are 3.175 and 2.125, statistically significant at 1% and 5% levels, respectively. Columns (3) and (4) show that this effect is positive and significant in countries with low-temperature groups.
This paper postulates that the observed variations can be attributed to the adaptive behavior of the climate. In contrast to the high-temperature group, countries in the low-temperature group may exhibit lower adaptability to temperature rises resulting from climate change, leading to reduced heat resistance among their residents. As the average temperature increases, there is a corresponding rise in the demand for cooling equipment to achieve physical comfort. However, if the rate of supply growth fails to match the rate of demand increase, it has implications for market prices. Consequently, this price dynamic can drive up prices and subsequently impact the inflation level. Therefore, the low-temperature group is more susceptible to the impacts of temperature changes compared to the high-temperature group. Here we test H2.
5. Discussion
This study examines the relationship between climate change and inflation using balanced panel data from 26 countries between 1995 and 2021. The primary objective is to empirically check the influence of temperature change on inflation within a country. To achieve this aim, this study employs panel fixed effects models, mediated effects models, and panel threshold models. The main findings of this investigation are summarized as follows: firstly, the analysis reveals a significant and positive relationship between temperature increase resulting from climate change and the inflation level in a country or region. Importantly, these empirical findings remain robust even after controlling for the replacement of core explanatory variables, adjustments in the research year interval, and the exclusion of hyperinflationary countries. Secondly, this study reveals a non-linear relationship between temperature change and inflation, depending on the income levels of countries. Specifically, the findings identify two threshold values, namely 5618.95 and 6524.5, for GDP per capita. Within these threshold ranges, temperature change demonstrates a positive effect on the inflation level, which is statistically significant. Thirdly, this study shows that temperature change, through its impact on energy demand, ultimately contributes to an increase in the inflation level. Fourthly, this research highlights the differential vulnerability to temperature change between low- and middle-income countries and the low-temperature group. Specifically, the inflation level in low- and middle-income countries is more sensitive to temperature change compared to the low-temperature group.
In light of the aforementioned findings, this paper puts forth the following recommendations: firstly, it is crucial to integrate climate change considerations into the framework of monetary policy. The significant impact of temperature changes resulting from climate change on a country’s inflation level underscores the necessity for central banks to incorporate climate-related factors into their monetary policy frameworks. This integration is essential as it forms the foundation for central banks to effectively pursue their monetary policy objectives. Climate change, as an exogenous shock, presents challenges for central banks in utilizing their current macroeconomic forecasting models to identify the origins of inflationary pressures and formulate effective responses to address them. Therefore, central banks should consider climate change in their monetary policies. In this way, they can enhance their risk identification and assessment processes regarding climate change-related risks, and make timely adjustments based on the scale and duration of climate change impacts. In addition, countries worldwide should strengthen national cooperation to effectively address the challenges posed by climate change. The impact of climate change on inflation exhibits a non-linear pattern, demonstrating variations across countries with diverse income levels. As a result, governments should actively engage in international exchange, cooperation, and the establishment of climate governance standards. By actively participating in these global initiatives and contributing to standard-setting processes, countries can accumulate invaluable international experience in climate governance. This experience serves to enhance their resilience in effectively managing and mitigating the consequences of climate shocks. Thirdly, researchers should study the intersection of climate change and economic development. The response to climate change should strive to achieve a harmonious synergy between reducing greenhouse gas emissions and fostering economic development. Achieving the climate governance objectives requires macroeconomic development-related indicators to ensure a balanced and sustainable approach to development that encompasses both environmental and economic dimensions.
This paper conducts a review-type study, and the useful extensions of research on this issue are in the following three areas. First, as global temperatures rise, the demand for refrigeration and air conditioning may increase, as will consumer demand for energy. At the same time, higher temperatures will affect supply, ultimately pushing up energy prices and leading to inflation. Second, as the global climate problem is gradually highlighted, governments may develop more stringent policies and systems, which will undoubtedly increase the production costs of producers, which in turn will affect the price level changes and increase the level of inflation. Therefore, the follow-up can be constructed through the double difference model to study a country before and after the implementation of the relevant climate policy, whether the country’s inflation level has changed. Third, climate change may lead to more frequent and severe natural disasters, including floods, droughts, earthquakes, hurricanes, and so on. These natural disasters will damage production facilities and seriously affect crop yields, leading to a lower supply of agricultural products and other food, and ultimately triggering an increase in price levels and leading to inflation. This is a good direction for research.
6. Conclusions
Changes in average temperatures as a result of climatic shocks have an impact on fluctuations in the level of inflation, with energy demand playing a crucial intermediary role: changes in temperature lead consumers to adjust their energy consumption, which in turn has a significant impact on energy prices. Energy prices are a vital component of the inflation calculation process in each country, leading to fluctuations in the overall level of inflation. This study’s results reveal that temperature fluctuations positively influence inflation and impact it through energy demand. Furthermore, there is a non-linear effect on inflation related to differing incomes across countries and their ability to cope with changing climates. The income and regional heterogeneity findings suggest that climate change disproportionately affects low- and middle-income countries compared to those in the low-temperature group. This relates to the climate-adaptive behavior of individual countries and the ability of central banks to identify and respond to risks posed by external shocks.
Author Contributions
Conceptualization, C.L.; methodology, C.L.; software, X.Z.; validation, C.L., X.Z. and J.H.; formal analysis, X.Z.; investigation, X.Z.; resources, X.Z.; data curation, C.L.; writing—original draft preparation, X.Z.; writing—review and editing, C.L.; visualization, J.H.; supervision, J.H.; project administration, J.H. All authors have read and agreed to the published version of the manuscript.
Funding
General Project of Shaanxi Provincial Department of Science and Technology (Grant No. 2022JM-432); Key Project of Scientific Research Programme of Shaanxi Provincial Department of Education (Grant No. 21JZ037); General Project of Shaanxi Provincial Department of Science and Technology (Grant No. S2023-ZC-RKXMS-0068).
Informed Consent Statement
Not applicable.
Conflicts of Interest
The authors declare no conflict of interest.
References
- Enete, A.A.; Amusa, T.A. Challenges of agricultural adaptation to climate change in Nigeria: A synthesis from the literature. Field Actions Sci. Rep. J. Field Actions 2010, 4. Available online: http://journals.openedition.org/factsreports/678 (accessed on 29 July 2023).
- Rudebusch, G.D. Climate change and the Federal Reserve. FRBSF Econ. Lett. 2019, 9, 33–52. [Google Scholar]
- Bansal, R.; Ochoa, J. Temperature, Aggregate Risk, and Expected Returns; National Bureau of Economic Research, Inc.: Cambridge, MA, USA, 2011. [Google Scholar]
- Bo, L.; Yunqi, L.; Yinjuan, J. Climate Changes and the Total Factor Productivity of Manufacturing Enterprises: Mechanism Analysis and EmpiricalTests. J. Hunan Univ. (Soc. Sci.) 2023, 37, 78–87. [Google Scholar] [CrossRef]
- Dell, M.; Jones, B.F.; Olken, B.A. Temperature shocks and economic growth: Evidence from the last half century. Am. Econ. J. Macroecon. 2012, 4, 66–95. [Google Scholar] [CrossRef]
- Minghui, L.; Jianglong, L.; Guanfei, M.; Xiuwang, Y. How Does Temperature Shocks Affect Household Energy Consumption? In sights from Demand Heterogeneity. J. Xi’an Jiaotong Univ. (Soc. Sci.) 2022, 42, 74–85. [Google Scholar]
- Kotseva-Tikova, M.; Dvorak, J. Climate Policy and Plans for Recovery in Bulgaria and Lithuania. Rom. J. Eur. Aff. 2022, 22, 79–99. [Google Scholar] [CrossRef]
- Batten, S.; Sowerbutts, R.; Tanaka, M. Climate change: Macroeconomic impact and implications for monetary policy. In Ecological, Societal, and Technological Risks and the Financial Sector; Palgrave Macmillan: Cham, Switzerland, 2020; pp. 13–38. [Google Scholar] [CrossRef]
- Doyle, L.; Noy, I. The short-run nationwide macroeconomic effects of the Canterbury earthquakes. N. Z. Econ. Pap. 2015, 49, 134–156. [Google Scholar] [CrossRef]
- Faccia, D.; Parker, M.; Stracca, L. Too Hot for Stable Prices? International Evidence on Climate Change and Inflation; European Central Bank: Frankfurt, Germany, 2020. [Google Scholar]
- Heinen, A.; Khadan, J.; Strobl, E. The price impact of extreme weather in developing countries. Econ. J. 2019, 129, 1327–1342. [Google Scholar] [CrossRef]
- Klomp, J.; Sseruyange, J. Earthquakes and economic outcomes: Does central bank independence matter? Open Econ. Rev. 2021, 32, 335–359. [Google Scholar] [CrossRef]
- Mukherjee, K.; Ouattara, B. Climate and monetary policy: Do temperature shocks lead to inflationary pressures? Clim. Chang. 2021, 167, 32. [Google Scholar] [CrossRef]
- Lanzafame, M. Temperature, rainfall and economic growth in Africa. Empir. Econ. 2014, 46, 1–18. [Google Scholar] [CrossRef]
- Colacito, R.; Hoffmann, B.; Phan, T. Temperature and growth: A panel analysis of the United States. J. Money Credit Bank 2019, 51, 313–368. [Google Scholar] [CrossRef]
- Acevedo, S.; Mrkaic, M.; Novta, N.; Pugacheva, E.; Topalova, P. The effects of weather shocks on economic activity: What are the channels of impact? J. Macroecon. 2020, 65, 103207. [Google Scholar] [CrossRef]
- Chandio, A.A.; Jiang, Y.; Rehman, A.; Rauf, A. Short and long-run impacts of climate change on agriculture: An empirical evidence from China. Int. J. Clim. Chang. Strateg. Manag. 2020, 12, 201–221. [Google Scholar] [CrossRef]
- De Bandt, O.; Jacolin, L.; Thibault, L. Climate Change in Developing Countries: Global Warming Effects, Transmission Channels and Adaptation Policies: Banque de France Working Paper 822. 2021. Available online: https://EconPapers.repec.org/RePEc:hal:cesptp:hal-03948704 (accessed on 29 July 2023).
- Odongo, M.T.; Misati, R.N.; Kamau, A.W.; Kisingu, K.N. Climate change and inflation in Eastern and Southern Africa. Sustainability 2022, 14, 14764. [Google Scholar] [CrossRef]
- Ciccarelli, M.; Kuik, F.; Hernández, C.M. The Asymmetric Effects of Weather Shocks on Euro Area Inflation; European Central Bank: Frankfurt, Germany, 2023. [Google Scholar]
- Kotz, M.; Kuik, F.; Lis, E.; Nickel, C. The Impact of Global Warming on Inflation: Averages, Seasonality and Extremes. 2023. Available online: https://EconPapers.repec.org/RePEc:ecb:ecbwps:20232821 (accessed on 29 July 2023).
- Benson, C.; Clay, E.J. The Impact of Drought on Sub-Saharan African Economies: A Preliminary Examination; World Bank Publications: Washington, DC, USA, 1998; Volume 401. [Google Scholar]
- Lesk, C.; Rowhani, P.; Ramankutty, N. Influence of extreme weather disasters on global crop production. Nature 2016, 529, 84–87. [Google Scholar] [CrossRef] [PubMed]
- Parker, M. The impact of disasters on inflation. Econ. Disasters Clim. Chang. 2018, 2, 21–48. [Google Scholar] [CrossRef]
- Strobl, E. The economic growth impact of natural disasters in developing countries: Evidence from hurricane strikes in the Central American and Caribbean regions. J. Dev. Econ. 2012, 97, 130–141. [Google Scholar] [CrossRef]
- Debelle, G. Climate Change and the Economy; Speech at Public Forum Hosted by Centre for Policy Development: Sydney, Australia, 2019; Volume 2019. [Google Scholar]
- Kunawotor, M.E.; Bokpin, G.A.; Asuming, P.O.; Amoateng, K.A. The impacts of extreme weather events on inflation and the implications for monetary policy in Africa. Prog. Dev. Stud. 2022, 22, 130–148. [Google Scholar] [CrossRef]
- Fratzscher, M.; Grosse-Steffen, C.; Rieth, M. Inflation targeting as a shock absorber. J. Int. Econ. 2020, 123, 103308. [Google Scholar] [CrossRef]
- Beirne, J.; Dafermos, Y.; Kriwoluzky, A.; Renzhi, N.; Volz, U.; Wittich, J. Natural Disasters and Inflation in the Euro Area; Verein für Socialpolitik/German Economic Association: Berlin, Germany, 2022. [Google Scholar]
- Hsiang, S.M.; Jina, A.S. The Causal Effect of Environmental Catastrophe on Long-Run Economic Growth: Evidence from 6700 Cyclones; National Bureau of Economic Research: Cambridge, MA, USA, 2014. [Google Scholar]
- Nordhaus, W. Projections and uncertainties about climate change in an era of minimal climate policies. Am. Econ. J. Econ. Policy 2018, 10, 333–360. [Google Scholar] [CrossRef]
- Feitelson, E.; Tubi, A. A main driver or an intermediate variable? Climate change, water and security in the Middle East. Glob. Environ. Chang. 2017, 44, 39–48. [Google Scholar] [CrossRef]
- Pugatch, T. Tropical storms and mortality under climate change. World Dev. 2019, 117, 172–182. [Google Scholar] [CrossRef]
- Cavallo, E.; Galiani, S.; Noy, I.; Pantano, J. Catastrophic natural disasters and economic growth. Rev. Econ. Stat. 2013, 95, 1549–1561. [Google Scholar] [CrossRef]
- Abe, N.; Moriguchi, C.; Inakura, N. The Effects of Natural Disasters on Prices and Purchasing Behaviors: The Case of the Great East Japan Earthquake; Research Center for Economic and Social Risks, Institute of Economic Research, Hitotsubashi University: Tokyo, Japan, 2014. [Google Scholar]
- Cevik, S.; Jalles, J. Eye of the Storm: The Impact of Climate Shocks on Inflation and Growth; International Monetary Fund. 2023. Available online: https://0-doi-org.library.svsu.edu/10.5089/9798400241307.00 (accessed on 29 July 2023).
- Cashin, P.; Mohaddes, K.; Raissi, M. Fair weather or foul? The macroeconomic effects of El Niño. J. Int. Econ. 2017, 106, 37–54. [Google Scholar] [CrossRef]
- Kim, H.S.; Matthes, C.; Phan, T. Extreme Weather and the Macroeconomy. 2021. Available online: https://papers.ssrn.com/sol3/papers.cfm?abstract_id=3918533 (accessed on 29 July 2023).
- Yusifzada, T. Response of Inflation to the Climate Stress: Evidence from Azerbaijan. 2022. Available online: https://www.researchsquare.com/article/rs-1513451/v1 (accessed on 29 July 2023).
- Islam, M.S.; Okubo, K.; Islam, A.H.M.S.; Sato, M. Investigating the effect of climate change on food loss and food security in Bangladesh. SN Bus. Econ. 2022, 2, 1–24. [Google Scholar] [CrossRef]
- Kabundi, A.; Mlachila, M.; Yao, J. How Persistent Are Climate-Related Price Shocks? Implications for Monetary Policy. 2022. Available online: https://papers.ssrn.com/sol3/papers.cfm?abstract_id=4272242 (accessed on 29 July 2023).
- Natoli, F. Temperature Surprise Shocks. 2022. Available online: https://mpra.ub.uni-muenchen.de/112568/ (accessed on 29 July 2023).
- Deschênes, O.; Greenstone, M. Climate change, mortality, and adaptation: Evidence from annual fluctuations in weather in the US. Am. Econ. J. Appl. Econ. 2011, 3, 152–185. [Google Scholar] [CrossRef]
- Fikru, M.G.; Gautier, L. The impact of weather variation on energy consumption in residential houses. Appl. Energy 2015, 144, 19–30. [Google Scholar] [CrossRef]
- de Galhau, V. Climate Change: Central Banks Are Taking Action. In Financial Stability Review; Banque de France: Paris, France, 2019; p. 7. [Google Scholar]
- Atalla, T.; Gualdi, S.; Lanza, A. A global degree days database for energy-related applications. Energy 2018, 143, 1048–1055. [Google Scholar] [CrossRef]
- Yuping, Z.; Yang, L. A Literature Reviewof the Impact of Climate Changeon Financial Stability and Monetary Policy. J. Contemp. Financ. Res. 2021, Z2, 79–89. [Google Scholar]
- Yalew, S.G.; van Vliet, M.T.; Gernaat, D.E.; Ludwig, F.; Miara, A.; Park, C.; Byers, E.; De Cian, E.; Piontek, F.; Iyer, G. Impacts of climate change on energy systems in global and regional scenarios. Nat. Energy 2020, 5, 794–802. [Google Scholar] [CrossRef]
- Congmou, Z.; Wuyan, L.; Yingying, D.; Hongwei, X.; Ke, W. Spatial-temporal change, trade-off and synergy relationships of cropland multifunctional value in Zhejiang Province. Trans. Chin. Soc. Agric. Eng. 2020, 36, 263–272. [Google Scholar]
- Mengyang, H.; Shunbo, Y. Spatial spillover effects and threshold characteristics of rural labor transfer on agricultural eco-efficiency in China. Resour. Sci. 2018, 40, 2475–2486. [Google Scholar]
- Hansen, B.E. Threshold effects in non-dynamic panels: Estimation, testing, and inference. J. Econom. 1999, 93, 345–368. [Google Scholar] [CrossRef]
- Wen, Z.; Ye, B. Analyses of Mediating Effects: The Development of Methods and Models. Adv. Psychol. Sci. 2014, 22, 731. [Google Scholar] [CrossRef]
- Ruqing, W.; Lekai, Z. The Impact of Global Value Chain Division on Inflation and Its Mechanism Analysis. Inq. Econ. Issues 2022, 43, 134–148. [Google Scholar]
- Yuan, Y.; Cheng, J.; Xu, D.; Cui, X. New Test of the Impact of Exports on the Green Production Efficiency of Enterprises. J. China Univ. Geosci. Soc. Sci. Ed. 2020, 20, 68–82. [Google Scholar]
Figure 1.
LR chart of GDP per capita threshold estimates.

Table 1.
Definition of variables.
| Symbol | Variable | Meaning |
|---|---|---|
| Inflation | Inflation | Inflation, as measured by the Consumer Price Index, reflecting the annual percentage change in the cost of a basket of goods and services purchased by the average consumer |
| GDP deflator | GDP deflator annual growth rate | Inflation rate indicating the rate of price change in the economy as a whole |
| TEMPworld | Average temperature | Average annual temperature |
| STEMP | Average temperature | Standardized mean temperature |
| TEMPFAO | Temperature change | Mean surface change temperature over land |
| lnUrban | Urbanization rate | Logarithmic value of the share of urban population in the total population |
| lnPRE | Precipitation | Average annual precipitation |
| lnGDPpercapita | GDP per capita | Logarithm of GDP per capita in constant 2015 dollars |
| lnEMP | Unemployment rate | Logarithm of the unemployed population as a percentage of the labor force |
| lnM2 | Broad money supply | Logarithmic value of broad money supply |
| lnEC | Energy consumption | Total primary energy consumption, primary energy includes raw coal, crude oil, natural gas, hydropower, and nuclear power |
| Carbon dioxide emissions | Carbon dioxide emissions are those stemming from the burning of fossil fuels and the manufacture of cement |
Table 2.
Results of descriptive statistics of variables.
| Variable | Sample Size | Average | Standard Deviation | Maximum | Minimum |
|---|---|---|---|---|---|
| Inflation | 702 | 4.75 | 12.03 | 197.41 | −4.48 |
| GDPdeflator | 702 | 5.09 | 12.08 | 144.01 | −16.91 |
| TEMPworld | 702 | 11.85 | 8.40 | 26.95 | −5.27 |
| STEMP | 702 | 0.00 | 1.00 | 1.80 | −2.04 |
| TEMPFAO | 702 | 1.10 | 0.60 | 3.69 | −0.79 |
| lnUrban | 702 | 4.27 | 0.26 | 4.59 | 3.28 |
| lnPRE | 702 | 6.67 | 0.65 | 8.10 | 4.43 |
| lnGDPpercapita | 702 | 9.95 | 1.08 | 11.40 | 6.43 |
| lnEMP | 702 | 1.84 | 0.46 | 3.26 | 0.53 |
| lnM2 | 702 | 13.20 | 1.43 | 17.44 | 9.93 |
| lnEC | 702 | 1.83 | 1.22 | 5.06 | −0.74 |
| 702 | 7.86 | 4.43 | 0.73 | 20.29 |
Table 3.
Baseline regression results.
| Variable | (1) | (2) | (3) | (4) |
|---|---|---|---|---|
| Inflation | Inflation | GDP Deflator | GDP Deflator | |
| TEMPworld | 0.948 | 1.894 ** | 1.031 | 1.791 ** |
| (0.912) | (0.842) | (0.907) | (0.842) | |
| lnUrban | 24.95 ** | 12.99 | ||
| (9.683) | (9.686) | |||
| lnPRE | −1.922 | −0.976 | ||
| (3.232) | (3.233) | |||
| lnGDPpercapita | 5.375 | 9.056 ** | ||
| (3.951) | (3.952) | |||
| lnEMP | −5.951 *** | −6.330 *** | ||
| (1.563) | (1.563) | |||
| lnM2 | −16.60 *** | −16.45 *** | ||
| (1.578) | (1.578) | |||
| Constant | 8.761 | 68.01 * | 6.744 | 75.59 ** |
| (10.62) | (38.03) | (10.56) | (38.04) | |
| National fixed | Yes | Yes | Yes | Yes |
| Year fixed | Yes | Yes | Yes | Yes |
| Observations | 702 | 702 | 702 | 702 |
| 0.136 | 0.293 | 0.132 | 0.282 | |
| Number of ID | 26 | 26 | 26 | 26 |
Note: The values in the parentheses are t- or Z-statistics. ***, **, * denote the statistical significance at 1%, 5%, and 10% levels, respectively.
Table 4.
Results of the threshold effect test with GDP per capita as the threshold variable.
| Threshold Test | Original Hypothesis | F-Value | p-Value | Threshold | ||
|---|---|---|---|---|---|---|
| 10% | 5% | 1% | ||||
| Single Threshold | : No threshold value | 44.490 | 0.026 | 28.973 | 36.088 | 55.259 |
| Double Threshold | : A threshold value exists | 113.67 | 0.000 | 12.315 | 15.373 | 21.032 |
| Three Thresholds | : Two thresholds exist | 11.240 | 0.680 | 138.243 | 153.626 | 197.605 |
Table 5.
Threshold estimation results.
| Threshold Variable | Number of Thresholds | Threshold | 95% Confidence Interval |
|---|---|---|---|
| GDP per capita | Single Threshold | 5618.951 | (4686.859, 6868.704) |
| Double Threshold | 6427.308 | (6022.847, 6613.991) |
Table 6.
Panel threshold estimation results.
| Variable | Estimated Value |
|---|---|
| GDP per capita (GDP per capita ≤ 5618.951) | −0.548 (0.665) |
| GDP per capita (5618.951 < GDP per capita ≤ 6427.308) | 5.049 (0.001) |
| GDP per capita (GDP per capita > 6427.308) | 1.882 (0.225) |
| Control variables | Yes |
| National fixed | Yes |
| Time fixed | Yes |
| 0.3345 | |
| N | 702 |
Table 7.
Results of intermediate effect test.
| Variable | (1) Inflation | (2) lnEC | (3) Inflation |
|---|---|---|---|
| TEMPworld | 1.8941 ** | −0.0295 *** | 2.2413 *** |
| (2.2492) | (−2.9630) | (2.6675) | |
| lnEC | 11.7676 *** | ||
| (3.5636) | |||
| lnM2 | −16.6006 *** | 0.1647 *** | −18.5385 *** |
| (−10.5199) | (8.8244) | (−11.1965) | |
| lnPRE | −1.9215 | −0.0583 | −1.2351 |
| (−0.5946) | (−1.5262) | (−0.3849) | |
| lnUrban | 24.9546 ** | 0.9791 *** | 13.4335 |
| (2.5771) | (8.5496) | (1.3266) | |
| lnGDPpercapita | 5.3751 | 0.3496 *** | 1.2608 |
| (1.3606) | (7.4835) | (0.3089) | |
| lnEMP | −5.9506 *** | 0.0725 *** | −6.8036 *** |
| (−3.8084) | (3.9226) | (−4.3421) | |
| National fixed | Yes | Yes | Yes |
| Year Fixed fixed | Yes | Yes | Yes |
| _cons | 68.0125 * | −7.3106 *** | 154.0407 *** |
| (1.7886) | (−16.2569) | (3.4419) | |
| N | 702 | 702 | 702 |
| 0.2928 | 0.7036 | 0.3065 |
Note: The values in the parentheses are t- or Z-statistics. ***, **, * denote the statistical significance at 1%, 5%, and 10% levels, respectively.
Table 8.
Estimated mediating effects of energy consumption (bootstrap method).
| Type of Effect | Coefficient | Standard Error | 95% Confidence Interval | |
|---|---|---|---|---|
| Lower Limit | Upper Limit | |||
| Indirect_bs_1 | −0.091 *** | 0.035 | −0.159 | −0.022 |
| Direct_bs_2 | −0.243 *** | 0.088 | −0.417 | −0.070 |
Note: The values in the parentheses are t- or Z-statistics. *** denote the statistical significance at 1% level.
Table 9.
Robustness test results for replacing explanatory variables.
| Variable | (1) Inflation | (2) GDP Deflator | (3) Inflation | (4) GDP Deflator |
|---|---|---|---|---|
| TEMPFAO | 1.407 * | 1.771 ** | ||
| (0.855) | (0.854) | |||
| STEMP | 15.90 ** | 15.03 ** | ||
| (7.068) | (7.070) | |||
| lnUrban | 22.26 ** | 10.36 | 24.95 ** | 12.99 |
| (9.640) | (9.627) | (9.683) | (9.686) | |
| lnPRE | −2.119 | −1.140 | −1.922 | −0.976 |
| (3.236) | (3.231) | (3.232) | (3.233) | |
| lnGDPpercapita | 6.323 | 10.21 ** | 5.375 | 9.056 ** |
| (3.988) | (3.983) | (3.951) | (3.952) | |
| lnEMP | −5.920 *** | −6.248 *** | −5.951 *** | −6.330 *** |
| (1.567) | (1.565) | (1.563) | (1.563) | |
| lnM2 | −16.79 *** | −16.79 *** | −16.60 *** | −16.45 *** |
| (1.604) | (1.602) | (1.578) | (1.578) | |
| Constant | 94.31 *** | 99.61 *** | 90.46 ** | 96.81 *** |
| (35.88) | (35.83) | (35.89) | (35.90) | |
| _cons | 702 | 702 | 702 | 702 |
| National fixed | Yes | Yes | Yes | Yes |
| Year Fixedfixed | Yes | Yes | Yes | Yes |
| 0.290 | 0.281 | 0.293 | 0.282 | |
| N | 26 | 26 | 26 | 26 |
Note: The values in the parentheses are t- or Z-statistics. ***, **, * denote the statistical significance at 1%, 5%, and 10% levels, respectively.
Table 10.
Robustness test results for adjusting the year interval.
| Variables | (1) | (2) | (4) | (3) |
|---|---|---|---|---|
| Inflation | GDP Deflator | Inflation | GDP Deflator | |
| TEMPworld | 2.360 *** | 2.164 ** | 2.200 ** | 1.891 ** |
| (0.874) | (0.880) | (0.896) | (0.772) | |
| lnUrban | 27.32 *** | 14.26 | 34.30 *** | 23.06 ** |
| (10.31) | (10.37) | (10.60) | (9.126) | |
| lnPRE | −2.431 | −1.414 | −2.910 | −2.652 |
| (3.392) | (3.414) | (3.468) | (2.987) | |
| lnGDPpercapita | 3.750 | 7.696 * | 2.971 | 6.330 * |
| (4.170) | (4.197) | (4.295) | (3.699) | |
| lnEMP | −5.463 *** | −5.953 *** | −4.617 *** | −4.489 *** |
| (1.620) | (1.631) | (1.645) | (1.417) | |
| lnM2 | −16.06 *** | −15.92 *** | −16.39 *** | −15.53 *** |
| (1.645) | (1.656) | (1.721) | (1.483) | |
| Constant | 64.24 | 74.76 * | 49.78 | 54.72 |
| (40.20) | (40.46) | (40.88) | (35.21) | |
| National fixed | Yes | Yes | Yes | Yes |
| Year fixed | Yes | Yes | Yes | Yes |
| Observations | 650 | 650 | 598 | 598 |
| 0.294 | 0.279 | 0.302 | 0.332 | |
| Number of ID | 26 | 26 | 26 | 26 |
Note: The values in the parentheses are t- or Z-statistics. ***, **, * denote the statistical significance at 1%, 5%, and 10% levels, respectively.
Table 11.
Robustness test results after excluding countries with experience of hyperinflation.
| Variable | (1) | (2) |
|---|---|---|
| Inflation | GDP Deflator | |
| TEMPworld | 0.600 * | 0.933 ** |
| (0.339) | (0.465) | |
| lnUrban | −8.972 ** | −11.27 ** |
| (3.897) | (5.338) | |
| lnPRE | −0.981 | −0.479 |
| (1.217) | (1.667) | |
| lnGDPpercapita | 2.338 | 4.491 ** |
| (1.593) | (2.183) | |
| lnEMP | −0.972 | −1.113 |
| (0.644) | (0.883) | |
| lnM2 | −1.024 | −2.737 *** |
| (0.757) | (1.038) | |
| Constant | 34.79 ** | 37.69 * |
| (14.27) | (19.54) | |
| National fixed | Yes | Yes |
| Year fixed | Yes | Yes |
| Observations | 594 | 594 |
| 0.159 | 0.133 | |
| Number of ID | 22 | 22 |
Note: The values in the parentheses are t- or Z-statistics. ***, **, * denote the statistical significance at 1%, 5%, and 10% levels, respectively.
Table 12.
Results of the Endogeneity Test.
| Variable | (1) Inflation | (2) GDP Deflator |
|---|---|---|
| TEMPworld | 2.078 ** | 2.007 ** |
| (0.854) | (0.859) | |
| lnUrban | 19.13 ** | 16.27 ** |
| (2.78) | (3.13) | |
| lnPRE | 0.256 | 0.432 |
| (0.80) | (0.66) | |
| lnGDPpercapita | −8.524 ** | −6.822 *** |
| (−3.10) | (−3.62) | |
| lnEMP | −1.014 | −1.294 * |
| (−1.61) | (−2.15) | |
| lnM2 | −2.002 *** | −2.155 *** |
| (−4.41) | (−4.77) | |
| Constant | 54.19 *** | 45.66 *** |
| (6.38) | (5.36) | |
| Kleibergen−Paap rk LM statistic | 17.536 (0.00) | 17.536 (0.00) |
| Kleibergen−Paap rk Wald F statistic | 53.778 (0.00) | 53.778 (0.00) |
| National fixed | Yes | Yes |
| Year fixed | Yes | Yes |
| Observations | 702 | 702 |
| 0.2265 | 0.2818 | |
| Number of ID | 26 | 26 |
Note: The values in the parentheses are t- or Z-statistics. ***, **, * denote the statistical significance at 1%, 5%, and 10% levels, respectively.
Table 13.
Results of heterogeneity test in high-income countries versus lower- and middle-income countries.
Table 13.
Results of heterogeneity test in high-income countries versus lower- and middle-income countries.
| Variable | High-Income Countries | Low- and Middle-Income Countries | ||
|---|---|---|---|---|
| (1) Inflation | (2) GDP Eflator | (3) Inflation | (4) GDP Deflator | |
| TEMPworld | −0.213 | 0.0699 | 8.903 *** | 7.047 ** |
| (0.188) | (0.343) | (3.066) | (3.043) | |
| lnUrban | 6.526 * | −2.351 | 100.2 *** | 56.86 * |
| (3.669) | (6.684) | (29.84) | (29.62) | |
| lnPRE | −0.660 | −0.364 | −4.314 | −0.0287 |
| (0.678) | (1.236) | (14.93) | (14.82) | |
| lnGDPpercapita | −6.281 *** | −5.548 *** | 15.69 | 31.69 ** |
| (1.044) | (1.903) | (13.35) | (13.24) | |
| lnEMP | −1.617 *** | −2.067 *** | −19.47 *** | −20.76 *** |
| (0.354) | (0.646) | (5.526) | (5.484) | |
| lnM2 | −1.752 *** | −3.858 *** | −27.30 *** | −27.66 *** |
| (0.459) | (0.837) | (4.301) | (4.268) | |
| Constant | 72.30 *** | 125.6 *** | −217.1 | −174.1 |
| (22.13) | (40.31) | (132.8) | (131.8) | |
| National fixed | Yes | Yes | Yes | Yes |
| Year fixed | Yes | Yes | Yes | Yes |
| Observations | 513 | 513 | 189 | 189 |
| 0.342 | 0.189 | 0.613 | 0.592 | |
| Number of ID | 19 | 19 | 7 | 7 |
Note: The values in the parentheses are t- or Z-statistics. ***, **, * denote the statistical significance at 1%, 5%, and 10% levels, respectively.
Table 14.
Results of heterogeneity test in high-temperature group versus low-temperature group.
| Variable | High-Temperature Group | Low-Temperature Group | ||
|---|---|---|---|---|
| (1) Inflation | (2) GDP Deflator | (3) Inflation | (4) GDP Deflator | |
| TEMPworld | −0.267 | 0.951 | 3.175 *** | 2.125 ** |
| (1.368) | (1.754) | (1.224) | (0.925) | |
| lnUrban | −49.88 *** | −61.86 *** | 64.39 *** | 50.48 *** |
| (13.58) | (17.42) | (14.94) | (11.30) | |
| lnPRE | 0.404 | 2.980 | −3.017 | −1.711 |
| (3.566) | (4.574) | (6.873) | (5.196) | |
| lnGDPpercapita | 8.711 * | 13.07 ** | 1.998 | 1.249 |
| (4.726) | (6.062) | (6.872) | (5.195) | |
| lnEMP | −9.452 *** | −11.38 *** | −4.818 * | −3.567 * |
| (1.861) | (2.387) | (2.603) | (1.968) | |
| lnM2 | −17.79 *** | −20.34 *** | −18.76 *** | −14.71 *** |
| (1.905) | (2.444) | (2.679) | (2.025) | |
| Constant | 382.3 *** | 389.9 *** | −26.75 | −20.58 |
| (63.14) | (80.98) | (59.49) | (44.98) | |
| Observations | 351 | 351 | 351 | 351 |
| 0.443 | 0.388 | 0.304 | 0.326 | |
| Number of ID | 13 | 13 | 13 | 13 |
Note: The values in the parentheses are t- or Z-statistics. ***, **, * denote the statistical significance at 1%, 5%, and 10% levels, respectively.
Disclaimer/Publisher’s Note: The statements, opinions and data contained in all publications are solely those of the individual author(s) and contributor(s) and not of MDPI and/or the editor(s). MDPI and/or the editor(s) disclaim responsibility for any injury to people or property resulting from any ideas, methods, instructions or products referred to in the content. |
© 2023 by the authors. Licensee MDPI, Basel, Switzerland. This article is an open access article distributed under the terms and conditions of the Creative Commons Attribution (CC BY) license (https://creativecommons.org/licenses/by/4.0/).
Share and Cite
MDPI and ACS Style
Li, C.; Zhang, X.; He, J. Impact of Climate Change on Inflation in 26 Selected Countries. Sustainability 2023, 15, 13108. https://doi.org/10.3390/su151713108
AMA Style
Li C, Zhang X, He J. Impact of Climate Change on Inflation in 26 Selected Countries. Sustainability. 2023; 15(17):13108. https://doi.org/10.3390/su151713108
Chicago/Turabian StyleLi, Cunpu, Xuetong Zhang, and Jing He. 2023. "Impact of Climate Change on Inflation in 26 Selected Countries" Sustainability 15, no. 17: 13108. https://doi.org/10.3390/su151713108
Note that from the first issue of 2016, this journal uses article numbers instead of page numbers. See further details here.