
Unraveling the U-Shaped Linkage: Population Aging and Carbon Efficiency in the Construction Industry


1
Anhui Institute of Real Estate and Housing Provident/ Anhui Research Center of Construction Economy and Real Estate Management, School of Economics and Management, Anhui Jianzhu University, Hefei 230022, China
2
Business School, Hohai University, Nanjing 211100, China
3
School of Civil Engineering, Central South University, Changsha 410083, China
*
Author to whom correspondence should be addressed.
Sustainability 2023, 15(17), 13212; https://doi.org/10.3390/su151713212
Submission received: 25 July 2023
/
Revised: 30 August 2023
/
Accepted: 31 August 2023
/
Published: 3 September 2023
(This article belongs to the Topic Pathways to Sustainable Construction: Innovations in New Materials, Construction Techniques, and Management Practices)
Abstract
:In pursuing low-carbon solutions in the construction sector, it is critically essential to unravel the intricate nexus between population aging and carbon emission efficiency (CEE). This research investigates this complex association utilizing provincial panel data from 2004 to 2020. Through the application of the super-efficient Slack-Based Measure and Malmquist–Luenberger (SBM-ML) model, the study quantifies the construction industry’s CEE, followed by using a fixed-effect model to assess population aging’s impact on CEE in the construction industry. Our study reveals a distinct “U”-shaped pattern, illustrating that population aging initially depresses but eventually amplifies CEE in the construction industry. We also observe marked regional disparities. For instance, the construction sectors in the eastern and northern regions show a rising trend, counteracting the initial decline in CEE due to aging. However, the central western and southern regions need more pronounced aging progression to experience comparable CEE improvement. These findings underscore the critical role of regional contexts and demographic transitions in shaping the CEE in the construction industry, providing valuable insights for crafting sustainable policies aiming at balanced population mobility and carbon neutrality.
1. Introduction
Amid the escalating global climate crisis, driven by rising greenhouse gas emissions, the urgency for proactive climate action is indisputable [1]. Rapid economic growth, alongside burgeoning energy consumption and carbon emissions, pose profound ecological threats [2]. Consequently, the global objective of achieving “peak carbon” necessitates nations to improve their carbon emission efficiency (CEE) [3,4], a focus emphasized in the Paris Agreement to facilitate the transition to a sustainable, green economy [5].
To truly understand CEE, an industry-specific analysis is requisite due to inherent differences in energy usage, carbon emissions, and emission reduction capacities among sectors [6]. A key example is the construction industry, which accounts for nearly 39% of global annual carbon emissions [7]. This exceeds the combined emissions of the agriculture and transportation sectors [8]. Despite the industry’s output—buildings, operational processes involve dynamic production lines, creating substantial regional variations in carbon efficiency [9]. Transitioning from reliance on conventional production techniques and fossil fuels to achieve significant emission reductions presents a daunting challenge. Nevertheless, the sector’s vast potential for carbon efficiency improvement underscores its crucial role in climate change mitigation.
The existing academic literature on the construction industry’s carbon efficiency is somewhat limited, primarily using direct carbon emissions as an indicator of emission reduction potential [10]. Early research primarily investigated CEE and its determinants from non-human resource perspectives, considering industrial structure [11], policy support [12,13], and technological innovation [9]. However, the impact of demographic shifts, particularly population aging, on CEE, has been understudied.
The United Nations “World Social Report 2023” emphasizes the substantial impact of population aging on carbon emissions, predicting a significant global surge in the population aged 65 and above. Given that age structure profoundly shapes socio-economic activities, it arises as a crucial determinant of carbon emissions [14]. Consequently, the influence of population aging on carbon emissions necessitates thorough examination [15]. While prior research has primarily centered on the effects of population aging on economic factors [16] and labor markets, the exploration of its association with CEE from a non-linear viewpoint has been limited, leading to ambiguous outcomes.
In response to the global climate urgency, this research performs a comprehensive investigation into the effects of demographic transitions, specifically population aging, on CEE, focusing on the carbon-intensive, labor-dependent construction industry. Our study introduces a novel analytical framework that integrates population aging and CEE within the context of the construction industry. The study evaluates CEE across 30 Chinese provinces from 2004 to 2020, using the super-efficient Slack-Based Measure and Malmquist–Luenberger (SBM-ML) model, followed by econometric models to explore the non-linear relationship between population aging and the construction sector’s CEE. The primary objective is to offer universally relevant insights to guide sustainable, carbon-efficient policies in the construction industry amid demographic aging.
Our research broadens the extant scholarly discourse via two primary contributions. Initially, we propose a novel analytical framework that coalesces population aging and CEE within the realm of the construction industry, illuminating efficacious strategies for sectors grappling with population aging. Subsequently, through the deployment of an econometric model, we delve into the non-linear nexus between population aging and CEE in the construction industry, thereby substantiating regional heterogeneity in CEE. These outcomes yield robust data that equip policymakers in the formulation of resilient strategies promoting prudent population distribution and fostering a low-carbon trajectory within the construction sector.
2. Literature Review
2.1. Population Aging and CEE
Achieving a sustainable economy, hallmarked by reduced energy consumption, limited pollution, and environmental equilibrium, highlights the vital aspect of carbon emissions. A midst various determinants, the increasingly prominent role of population aging, due to its significant impact on carbon emissions and efficiency, demands heightened scrutiny.
The precise correlation between population aging and carbon emissions remains contentious, necessitating further exploration. While certain research advocates for a linear relationship [17], others emphasize considerable regional disparities [18]. Alternatively, household-level analysis suggests that population aging could potentially curtail carbon emissions [19], with national conditions influencing possible non-linear patterns [20].
In this scholarly discourse, CEE—a synthesis of economic advantages and pollution indices—provides a refined understanding. Although prior studies predominantly explore non-labor resource factors [21,22], scholarly exploration of the effect of population aging on CEE remains scant. The existing literature indicates an inhibitory link between income disparity, population aging, and CEE [16], with variable impacts of population aging on CEE across different income levels [5].
The current body of literature predominantly examines the influence of population aging on carbon emissions or non-labor resource elements on CEE, yet it tends to neglect the specific effect on the CEE within the industry. Furthermore, the majority of studies emphasize the impacts at a national level, downplaying the effects of aging on sector-specific facets. Addressing these lacunae, our research delves into the interaction between population aging and the construction industry, incorporating both demographic and industrial determinants (refer to Section 2.2). Section 4 empirically scrutinizes the non-linear relationship between aging and CEE within the construction sector. This paper seeks to provide policy directives for bolstering CEE in the construction sector, taking population dynamics into account, an aspect crucial for shaping feasible carbon reduction strategies.
2.2. Population Aging and CEE in the Construction Industry
The complex interplay between an aging populace and the construction industry, alongside the global shift towards sustainability, is driving eco-friendly and energy-efficient transformations within this sector. Integral to this transition are intelligent and automated systems, serving to curtail carbon emissions while concurrently meeting the aging population’s demands for comfort, safety, and sustainability [23].
Population aging presents both opportunities and challenges for the construction industry. Elevated demand for facilities such as housing and healthcare might amplify energy consumption and carbon emissions. This demographic transition could necessitate the adoption of energy-intensive technologies and design modifications, subsequently augmenting emissions [24]. Furthermore, aging-induced pressures on human resources might disrupt the CEE of this labor-intensive industry [25].
The interrelation between population aging and CEE within the construction sector is non-linear, shaped by diverse factors, including policy, economic conditions, and technological advancements [26]. While initial aging phases may exert minor impacts on CEE, subsequent demographic shifts could evoke significant effects, such as increases in energy consumption and carbon emissions [27]. However, strategic policy initiatives and sustainable design can counter these impacts, fostering enhancements in carbon efficiency [28].
3. Methodology and Variable Selection
3.1. Measurement of CEE in the Construction Industry
3.1.1. The Undesirable Super-Efficiency SBM Model
Initiated by Tone [29], the super-efficiency SBM model proffers a dual-dimensional perspective on energy efficiency assessment, accounting for both input and output considerations. This contrasts with traditional radial data envelopment analysis models, which typically omit slack variables. In contrast, the super-efficiency SBM model integrates these variables, thereby resolving the constraints associated with radial measurements and distinguishing between multiple efficient decision-making units (DMUs). Recognizing that undesirable outputs invariably arise during energy consumption, Tone [30] introduced a revision: the undesirable super-efficiency SBM model. As a pioneering adaptation in SBM literature, this model factors in undesirable outputs, thereby enhancing the precision of efficiency evaluations. The model functions as follows: given DMUs, each featuring m inputs, and signify desirable and undesirable outputs, respectively. , , . The formulation of the undesirable super-efficiency SBM model is subsequently outlined.
In the presented model: , and serve as slack variables for input, desirable output, and undesirable output, respectively; symbolizes the weight vector, while indicates the model’s optimal solution. When ≥ 1, the DMU is deemed efficient.
3.1.2. ML Index
While the data envelopment analysis model can determine technical efficiency within a specific temporal frame, it lacks the capacity to examine dynamic variations in energy efficiency. To address this, the Malmquist index is employed, which facilitates the analysis of temporal productivity changes. Chung et al. [31] proposed adjustments to the Malmquist index, incorporating the directional distance function that accommodates undesirable output, thereby formulating the ML index.
The ML index from to period is expressed as follows:
In this model, , and denote input, desired output, and undesired output, respectively. and represent the distance functions for periods and , respectively. symbolizes the distance function for period under the technical parameters of period , while denotes the distance function for period under the technical parameters of period . ML values greater than, equal to, and less than imply an increase, constancy, and decrease in CEE with the construction industry, respectively.
3.2. Econometric Model
Adhering to the methodology employed by Wang and Li [1], this study utilizes panel data alongside a fixed effects model to investigate the impact of demographic aging on the CEE of the construction sector. We designate the following form as our baseline model:
In this model, the province is denoted by , while signifies the year. The term represents the CEE within the building industry, whereas corresponds to population aging. stands for the control variables. The sum of individual fixed effects and the time-fixed effect in the model are denoted by and , respectively, whereas constitutes the random disturbance term.
3.3. Indicators Selection
3.3.1. CEE in the Construction Industry
Drawing upon the variable selection tradition established by previous studies [32,33,34], this research considers labor, capital, and energy as input variables, the comprehensive output value of the construction sector as a positive output, and carbon emissions within the construction sector as a negative output variable for the assessment of carbon emission performance. Table 1 delineates the distinct indicators and units employed for this evaluation.
Carbon emissions associated with the construction sector comprise both direct and indirect emissions. The former ensues from construction activities on-site, predominantly through fuel and electricity consumption by equipment. The latter are generated by upstream production activities inextricably linked with the construction industry, such as the manufacture of construction materials [32]. Hence, this study accounts for emissions from fossil fuels, electricity, and construction materials in determining the construction sector’s carbon emissions [35], calculated as follows:
In this equation, , and represent carbon emissions from fossil fuels, electricity, and construction materials employed within the construction industry, respectively. The variables and m represent different types of fossil fuels and construction materials, respectively. The terms , and denote the quantities of fossil fuels, electricity, and construction materials, while , , and correspond to the net calorific value, carbon content, and oxidation efficiency, respectively. The ratio of depicts the molecular weight relationship between carbon dioxide and carbon. The variables and represent carbon emission coefficients, whereas represents the recycling coefficient for construction material .
3.3.2. Population Aging
In accordance with United Nations standards, a country or region is classified as an aging society when the proportion of the elderly population aged 60 years or over exceeds 10% of the total population or when the percentage of those aged 65 years or over surpasses 7% of the total population [36,37]. Given the increasing life expectancy in contemporary society, this research elects to gauge population aging by the number of individuals aged 65.
3.3.3. Instrumental Variable
This research designates social security fiscal expenditure as the instrumental variable [38]. The choice of social security fiscal expenditure as the instrumental variable for population aging is premised on the notion that this expenditure depends exclusively on the fiscal policy of each region. It should be noted that there is no intermediary impact between social security fiscal expenditure and the CEE of the construction industry, beyond its role in addressing the needs of population aging in each province. Thus, this instrumental variable fulfills the criteria of relevance and exogeneity, adhering to the requirements of our hypothesis.
3.3.4. Control Variables
To mitigate the potential bias from overlooked variables that may influence the regression analysis, this research incorporates several control variables. (1) Industrial Structure (Ind): Changes in the industrial structure are associated with variations in the construction industry’s carbon emissions [39]. Here, the industrial structure is indicated by the ratio of the tertiary industry’s added value to that of the secondary industry. (2) Degree of Openness (Open): This parameter primarily pertains to the level of economic openness, traditionally measured by the foreign trade ratio. In this study, it is quantified as the annual foreign direct investment in each province, expressed as a percentage of the region’s gross domestic product (GDP) for the respective year [40]. Foreign direct investments are converted into Renminbi (RMB) based on the annual average exchange rate. (3) Level of Transportation Infrastructure (Tran): This variable is evaluated using freight volume. (4) Technological Innovation (Tech): This variable underscores the crucial role of R&D in enhancing CEE. It is determined by the ratio of internal R&D expenditure to the regional GDP [41]. (5) Tax Burden Level (Tax): The research defines the tax burden level by dividing tax revenue by the regional GDP [42]. (6) Labor Force Level (Lab): Given the labor-intensive nature of the construction industry, the count of employed individuals in each province is used to encapsulate labor’s impact in this study [43].
3.4. Sample and Data Source
In consideration of data availability, this study elected to focus on a sample comprising 30 Chinese provinces from the period 2004 to 2020. To fill any temporal data gaps, missing entries for specific years were replaced via linear interpolation. Additionally, all financial variables were normalized to constant price levels corresponding to the year 2000. Unless explicitly stated otherwise, the data for this study were extracted from the China Population and Employment Statistics Yearbook, the China Statistical Yearbook, along with the statistical yearbooks and bulletins of each respective province. Descriptive statistics of the key variables are provided in Table 2.
Our analysis set out to elucidate the spatial characteristics and dispersion patterns of population aging and carbon efficiency within the construction sector. For this purpose, we employed ArcGIS to trace longitudinal variations across the years 2004, 2010, and 2020. As highlighted in Figure 1, China exhibits a consistent trend towards aging, signified by a rising percentage of individuals aged 65 and above from 2004 to 2020, paired with substantial spatial discrepancies. Viewed regionally, the aging progression appears to traverse a gradient from north to south while simultaneously extending eastward. Figure 2 illustrates the spatial distribution of CEE within the construction sector over the period from 2004 to 2020. During this time, the sector witnessed significant fluctuations in carbon efficiency, albeit with a gradual decline in the level of heterogeneity. On a geographical basis, carbon efficiency within the construction sector manifested a shift toward the west, simultaneously indicating a decline in the east, which eventually plateaued.
4. Results and Discussion
4.1. Non-Linear Regression Results
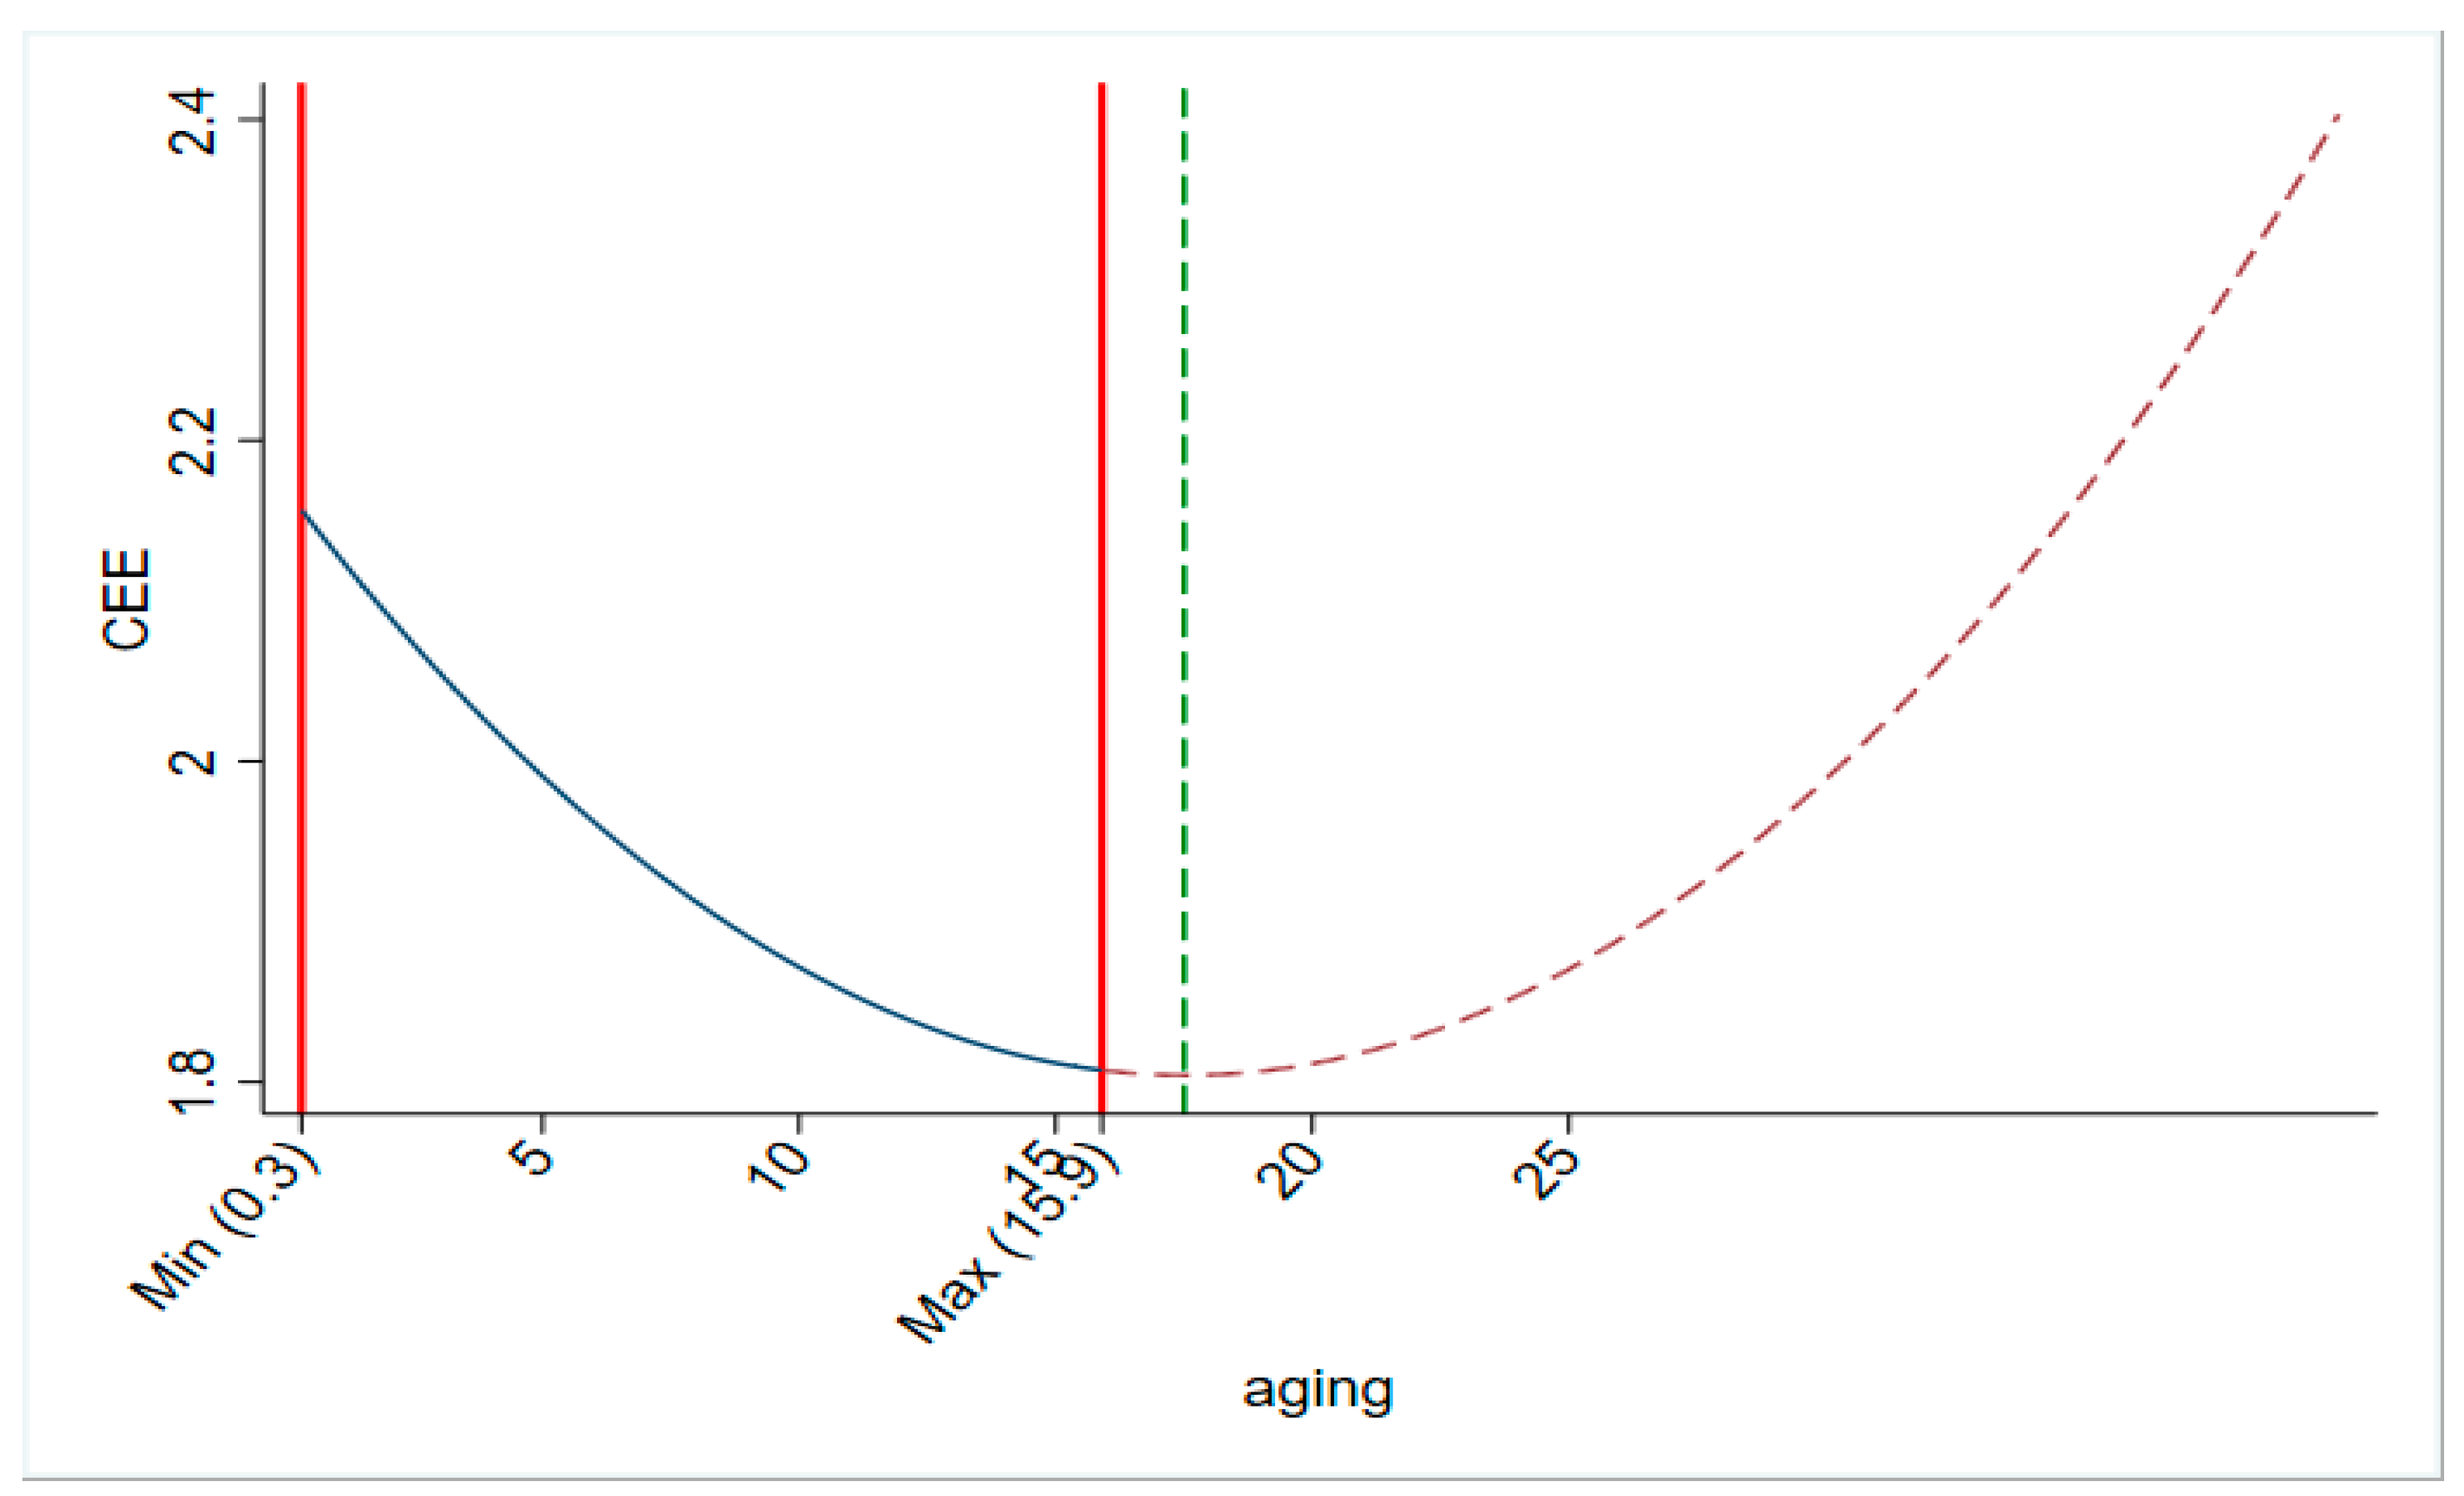
The pooled ordinary least squares (POLS) model interprets cross-sectional data, whereas the two-way fixed effects (FE) model harnesses the nuanced strengths of panel data. Panel data, with its multidimensional approach encompassing time, cross-section, and variables, amplifies observational sample size and enhances sample degrees of free-dom. Such models are adept at examining both cross-sectional and time-series data, yielding precise insights by mitigating multicollinearity and reducing estimation errors [44]. Consequently, this study utilizes POLS and FE to delve into the relationship between population aging and the CEE in the construction industry. To determine if this relationship is non-linear, we incorporated a quadratic term for population aging, denoted as aging2, into our primary model. The regression findings are displayed in Table 3: columns (1)–(2) present results from the POLS model, while columns (3)–(4) show outcomes from the FE model. Across both methodologies, a significant negative coefficient emerges between the primary CEE term and population aging, regardless of the inclusion of control variables, the quadratic term for population aging has a positive coefficient, indicating a U-shaped relationship between population aging and CEE in the construction industry. Figure 3 provides a graphical illustration of the U-shaped relationship between population aging and CEE in the construction sector, pinpointing an estimated inflection point at 17.54. This critical juncture denotes the transition where the effect of population aging on the sector’s CEE swings from restraint to facilitation. Under 17.54, population aging significantly hampers the sector’s carbon efficiency, while above 17.54, it markedly encourages it. The current relationship in the Chinese construction industry, where population aging has yet to surpass this inflection point, demonstrates a suppressive effect, as outlined by the solid blue line. This pattern, consistent with the work of Wang, Zhang and Li [5], explores how population aging impacts CEE in the construction industry. Initially, the mature working-age population forms a significant portion of the labor force, enhancing productivity and diminishing carbon emissions owing to their technical acumen. As population aging intensifies, the labor-intensive construction sector confronts issues like rising labor costs and reduced productivity due to a diminishing supply of skilled labor and physical constraints associated with an older workforce. These factors undermine CEE, with higher labor costs, inefficient resource utilization, and extended project timelines augmenting carbon emissions. The industry’s traditional reliance on manual labor accentuates the impact of an aging population on its carbon footprint. However, these challenges can instigate change. In response to these pressures, construction firms may increasingly adopt innovative technologies and sustainable practices, such as automation, green materials, and process redesign focused on efficiency. Such advancements could counteract the effects of population aging, augmenting productivity and CEE in the construction sector’s later stages.
Control variables, depicted in column (4), reveal that the industry structure significantly inhibits the construction industry’s CEE. Despite the downscaling of secondary industries and the expansion of tertiary ones due to industry restructuring, the construction industry’s gross output value continues to climb. The secondary industry, infamous for its high input and emissions, remains the primary carbon contributor in construction, exacerbating carbon efficiency issues due to labor shortages and surging energy demand. In contrast, technological innovation exerts a positive influence on the construction industry’s CEE at a 1% significance level. This emphasizes that investments in green innovation and sustainable transitions can enhance construction’s CEE. The imposition of carbon taxes significantly boosts the CEE of the construction industry by motivating high-emission and high-consumption firms to undertake green transformations, thereby reducing energy consumption and carbon emissions. The levels of the labor force and fundamental transportation infrastructure impact the construction industry’s CEE negatively at a 5% significance level, likely due to low-skilled labor and insufficient transportation facilities, culminating in energy wastage and lowered productivity. The observation that increased external openness enhances the construction industry’s CEE suggests that employing fixed-asset investments to drive economic growth can stimulate independent innovation and industry transformation, positively impacting the industry’s CEE.
Population aging, an important aspect of societal evolution, exhibits exogenous properties. However, directly correlating this with CEE in the construction industry might introduce an endogeneity bias. This bias can arise from a two-way causality: enhanced CEE can stimulate economic growth, subsequently fostering superior regional medical and elderly care infrastructures. As a result, these regions may attract a larger elderly population, leading to a heightened aging level in areas with superior CEE in the construction sector. Additionally, there’s potential for the omission of certain variables. To address the endogeneity of population aging, we employ an instrumental variables methodology, using the first lag of population aging and social security expenditures as our instruments. These instrumental variables meet both correlation and exogeneity conditions. The regression outcomes are displayed in columns (5)–(6) of Table 3, where the Lagrange multiplier (LM) test p-value refutes the “under-identification of instrumental variables” null hypothesis at a significance level of 1%. Moreover, the F-statistic surpasses the critical value in the Stock-Yogo weak identification test at a 10% significance level, refuting the hypothesis of weak instrumental variables. The Hansen value exceeds 0.1, signifying that the model passes the over-identification test, thereby affirming the suitability of the instrumental variable construction and the credibility of the estimated results. When control variables are held constant, the U-shaped relationship between population aging and the CEE in the construction industry remains significant, indicating the robustness of our primary findings and affirming the reliability of the study’s conclusions.
4.2. Regional Heterogeneity Results
When considering external influence, the enhancement of CEE within the construction industry is intertwined with local economic prosperity, resource endowment, and varied application of aging population policies. To elucidate the heterogeneous impacts of these variables, we divide the national sample into five geographical zones—east, central, west, south, and north—each distinguished by their economic status and resource allocation. This stratification allows for a more in-depth heterogeneity analysis, thereby strengthening empirical insights. Regression results of Table 4 reveal a significant U-shaped relationship between population aging and CEE within the construction industry in the eastern and northern zones. Inflection points for the north and east are estimated at 15.349 and 18.2, respectively. This suggests that the northern region first transitions beyond the inhibitory effect of population aging on CEE in the construction sector, followed by the east. Conversely, the central, western, and southern regions necessitate a higher degree of aging to achieve similar outcomes.
This study’s findings align with those of Zhou and Liu [45], despite some differences that can be attributed to factors such as climatic conditions, regional economic development levels, and the extent of technological advancement. Regions with severe climates, like the north, require enhanced insulation, thereby increasing energy usage, especially as sensitivity to temperature rises with age. On the other hand, regions such as the south, typified by milder winters, demonstrate reduced energy consumption in aging societies. Economically advanced regions like the south may channel increased resources towards environmental protection and energy-efficient technologies as the population ages, thus mitigating the impacts on CEE. Moreover, the east, characterized by robust economic development, a large population, and technological advancement, may swiftly adopt low-carbon construction technologies, thereby improving CEE. In contrast, the central and western regions, which trail in technological progress, could enhance carbon efficiency by adopting advanced low-carbon construction technologies as they become accessible. With their economic prosperity, these regions could utilize policy resources to support and incentivize green building and low-carbon technologies, thereby restraining carbon emissions in construction. Therefore, governments need to recognize regional disparities in construction industry performance concerning population aging and formulate strategic policies that capitalize on demographic changes to accelerate the construction industry’s green transition.
4.3. Robust Test Results
4.3.1. Exclusion of Exceptional Province Sample
In pursuit of robustness verification, this study proceeds to remove four municipalities—Beijing, Tianjin, Shanghai, and Chongqing—deemed as provincial-level administrative units in line with Qiu et al. [46]. By discarding these unique entities and employing the regression model (3), the outcomes substantiate our prior findings. As articulated in column (1) of Table 5, the coefficient of the primary term for population aging persists in its negative significance at the 1% level, whilst the coefficient of the secondary term is significant and positive at the same level. This robustly attests to a U-shaped relationship between population aging and CEE in the construction industry, corroborating our initial hypothesis. This endeavor fortifies the robustness of our benchmark results.
4.3.2. Elimination of Variable Outliers
Outliers and extreme values can markedly distort statistical analyses, often inducing skewed regression results. To mitigate this, we resort to a bilateral trimming technique, excising the 1% quantile of the control variables within our sample. The regression outcomes, detailed in column (2) of Table 5, affirm that the U-shaped interrelation between population aging and CEE within the construction industry withstands the potential influence of outliers and extreme values, thus preserving its statistical significance. This further vouches for the robustness of our conclusions.
4.3.3. Replacement of Explained Variable
To substantiate the robustness and resilience of our analytical findings, we undertook a methodological refinement by substituting the explained variable (CEE in the construction industry) with the SBM-GML model [47]. As evidenced in the column (3) of Table 5, the primary term of population aging continues to exhibit a significant negative association, while the secondary term retains its significant positive correlation. This consistency in results, even after altering the explanatory variables, confirms that our study’s conclusions withstand rigorous robustness testing.
5. Conclusions and Recommendations
Population aging embodies manifold implications for global economies and sectors, notably so in the labor-intensive domain of construction. Enhancing CEE within this field is critical to curbing pollution and aligning with the path toward carbon neutrality. This study seeks to elucidate the non-linear bearing of population aging on CEE within the construction industry, embedding these elements within a comprehensive analytical framework. Accordingly, this research embarks on an empirical investigation of the influence population aging exerts on CEE within the construction industry across 30 Chinese provinces spanning from 2004 to 2020. Our probe reveals a U-shaped relationship between population aging and CEE, denoting an initial inhibitory effect that progressively morphs into a promotive influence as the aging process intensifies. Moreover, via our regional heterogeneity analysis, we discern that the eastern and northern regions display a hastened alleviation from the adverse impacts of population aging, subsequently transitioning into a phase hallmarked by augmented CEE within the construction sector. Conversely, the central, western, and southern regions necessitate a deeper demographic shift towards an older population to invigorate the CEE within their respective construction industries.
In light of these empirical findings, this paper proffers the ensuing policy recommendations.
- (1)
- Enhancing population quality and human capital investment in the construction industry. The manifest U-shaped correlation between population aging and CEE within this sector underscores the exigency of accentuating human capital excellence. It is incumbent upon global governments and industry connoisseurs to champion the cause of perpetual learning, astutely calibrated for the veteran contingents of the construction domain. This prioritization not only cultivates malleable vocational avenues for the aging populace but also harnesses the profound reservoir of their experiential acumen. As the construction paradigm progressively inclines towards ecological sustainability, a resolute emphasis on labor productivity, human capital augmentation, and technological symbiosis is indispensable. Transitioning from the conventional metric of “population volume” to a sophisticated understanding of “population caliber” holds the potential to inaugurate a novel demographic dividend, thereby tempering the anticipated waning of labor efficiency concomitant with aging.
- (2)
- Reinforcing policy system’s top-level design and crafting strategies for coordinated regional development in the construction industry. Understanding the varied impacts of population aging on CEE in the construction sector across different global regions necessitates a detailed and integrated policy approach. Given the global implications, it’s essential to weave together the threads of economic growth, regional disparities, and population aging into a coherent policy tapestry. As an immediate course of action, constructing region-specific, medium-to-long-term development strategies should be prioritized, especially in the construction sector. These strategies should be adaptive, reflecting the ever-changing socio-economic landscapes and specific challenges faced by the construction industry in various regions. Moreover, targeted investments in underdeveloped regions, coupled with tax incentives for construction enterprises advancing sustainable practices, can catalyze transformative shifts. On a global scale, the construction industry should pivot towards embracing innovative technology. Prioritizing tech-savvy SMEs, championing digital construction methodologies, and investing in cutting-edge construction technologies can directly counterbalance the environmental challenges while ensuring the industry remains robust against the backdrop of an aging population.
This research underscores the previously underexplored nonlinear relationship between population aging and CEE within the construction domain. While our empirical analyses provide insight into this relationship, the foundational mechanisms remain to be elucidated. Future studies would benefit from the integration of theoretical models to offer a more profound understanding of our empirical findings. Additionally, our current scope, which emphasizes the regional specificities within individual nations, might not encompass the intricacies of global dynamics fully. Moving forward, a more granular exploration at the country-specific level is warranted, with an aim to formulate a holistic metric for population aging.
Author Contributions
Conceptual development was executed by S.Y., J.S. and H.L.; data management was undertaken by B.Z. and J.M.; investigative tasks were handled by B.C. and S.Y.; J.S. formulated the methodology; S.Y., J.S. and B.Z. prepared the initial manuscript draft; manuscript revisions and editing were conducted by H.L., B.C. and J.M.; S.Y. and B.C. supervised the study; funding was secured by S.Y. and B.C. All authors have read and agreed to the published version of the manuscript.
Funding
This research was supported by the Anhui Institute of Real Estate and Housing Provident Fund (Grant No. 2023FDC01), Anhui Research Center of Construction Economy and Real Estate Management (Grant No. 2023JZJJ01), and the Open Project of Provincial and Ministerial Scientific Research Platform, Fuyang Normal University (Grant No. FSKFKT028D).
Institutional Review Board Statement
Not applicable.
Informed Consent Statement
Not applicable.
Data Availability Statement
Data presented in this study are available from the corresponding author upon request.
Conflicts of Interest
The authors declare no conflict of interest.
References
- Wang, Q.; Li, L. The effects of population aging, life expectancy, unemployment rate, population density, per capita GDP, urbanization on per capita carbon emissions. Sustain. Prod. Consum. 2021, 28, 760–774. [Google Scholar] [CrossRef]
- Ahmad, M.; Ahmed, Z.; Majeed, A.; Huang, B. An environmental impact assessment of economic complexity and energy consumption: Does institutional quality make a difference? Environ. Impact Assess. Rev. 2021, 89, 106603. [Google Scholar] [CrossRef]
- Liu, C.; Sun, W.; Li, P.; Zhang, L.; Li, M. Differential characteristics of carbon emission efficiency and coordinated emission reduction pathways under different stages of economic development: Evidence from the Yangtze River Delta, China. J. Environ. Manag. 2023, 330, 117018. [Google Scholar] [CrossRef]
- Zhang, P.; Hu, J.; Zhao, K.; Chen, H.; Zhao, S.; Li, W. Dynamics and Decoupling Analysis of Carbon Emissions from Construction Industry in China. Buildings 2022, 12, 257. [Google Scholar] [CrossRef]
- Wang, Q.; Zhang, C.; Li, R. Towards carbon neutrality by improving carbon efficiency—A system-GMM dynamic panel analysis for 131 countries’ carbon efficiency. Energy 2022, 258, 124880. [Google Scholar] [CrossRef]
- Gao, P.; Yue, S.; Chen, H. Carbon emission efficiency of China’s industry sectors: From the perspective of embodied carbon emissions. J. Clean. Prod. 2021, 283, 124655. [Google Scholar] [CrossRef]
- Min, J.; Yan, G.; Abed, A.M.; Elattar, S.; Amine Khadimallah, M.; Jan, A.; Elhosiny Ali, H. The effect of carbon dioxide emissions on the building energy efficiency. Fuel 2022, 326, 124842. [Google Scholar] [CrossRef]
- Wang, X.; Yan, L. Driving factors and decoupling analysis of fossil fuel related-carbon dioxide emissions in China. Fuel 2022, 314, 122869. [Google Scholar] [CrossRef]
- Zhang, M.; Li, L.; Cheng, Z. Research on carbon emission efficiency in the Chinese construction industry based on a three-stage DEA-Tobit model. Environ. Sci. Pollut. Res. Int. 2021, 28, 51120–51136. [Google Scholar] [CrossRef] [PubMed]
- Guo, X.; Fang, C. Spatio-temporal interaction heterogeneity and driving factors of carbon emissions from the construction industry in China. Environ. Sci. Pollut. Res. Int. 2022, 30, 81966–81983. [Google Scholar] [CrossRef]
- Liao, B.; Li, L. How can green building development promote carbon emission reduction efficiency of the construction industry?--Based on the dual perspective of industry and space. Environ. Sci. Pollut. Res. Int. 2022, 29, 9852–9866. [Google Scholar] [CrossRef] [PubMed]
- Lu, Y.; Cui, P.; Li, D. Carbon emissions and policies in China’s building and construction industry: Evidence from 1994 to 2012. Build. Environ. 2016, 95, 94–103. [Google Scholar] [CrossRef]
- Zhou, Y.; Lv, S.; Wang, J.; Tong, J.; Fang, Z. The Impact of Green Taxes on the Carbon Emission Efficiency of China’s Construction Industry. Sustainability 2022, 14, 5402. [Google Scholar] [CrossRef]
- Wang, Q.; Wang, L. The nonlinear effects of population aging, industrial structure, and urbanization on carbon emissions: A panel threshold regression analysis of 137 countries. J. Clean. Prod. 2021, 287, 125381. [Google Scholar] [CrossRef]
- Zheng, H.; Long, Y.; Wood, R.; Moran, D.; Zhang, Z.; Meng, J.; Feng, K.; Hertwich, E.; Guan, D. Ageing society in developed countries challenges carbon mitigation. Nat. Clim. Change 2022, 12, 241–248. [Google Scholar] [CrossRef]
- Wang, Q.; Li, L.; Li, R. Uncovering the impact of income inequality and population aging on carbon emission efficiency: An empirical analysis of 139 countries. Sci. Total Environ. 2023, 857 Pt 2, 159508. [Google Scholar] [CrossRef] [PubMed]
- Zhang, C.; Tan, Z. The relationships between population factors and China’s carbon emissions: Does population aging matter? Renew. Sustain. Energy Rev. 2016, 65, 1018–1025. [Google Scholar] [CrossRef]
- Guo, H.; Jiang, J.; Li, Y.; Long, X.; Han, J. An aging giant at the center of global warming: Population dynamics and its effect on CO(2) emissions in China. J. Environ. Manag. 2023, 327, 116906. [Google Scholar] [CrossRef]
- Zhang, J.; Zhu, L.; Liu, J.; Yu, B.; Yu, S. How ageing shapes the relationship between working time and carbon dioxide emissions: Evidence from Chinese households. Environ. Impact Assess. Rev. 2023, 98, 106974. [Google Scholar] [CrossRef]
- Wang, Q.; Yang, T.; Li, R.; Wang, L. Population aging redefines the economic growth-carbon emissions nexus, energy consumption-carbon emissions nexus—Evidence from 36 OECD countries. Energy Environ. 2022, 34, 946–970. [Google Scholar] [CrossRef]
- He, A.; Xue, Q.; Zhao, R.; Wang, D. Renewable energy technological innovation, market forces, and carbon emission efficiency. Sci. Total Environ. 2021, 796, 148908. [Google Scholar] [CrossRef] [PubMed]
- Dong, F.; Zhu, J.; Li, Y.; Chen, Y.; Gao, Y.; Hu, M.; Qin, C.; Sun, J. How green technology innovation affects carbon emission efficiency: Evidence from developed countries proposing carbon neutrality targets. Environ. Sci. Pollut. Res. Int. 2022, 29, 35780–35799. [Google Scholar] [CrossRef]
- Kan, H.Y.; Forsyth, A.; Molinsky, J. Measuring the built environment for aging in place: A review of neighborhood audit tools. J. Plan. Lit. 2020, 35, 180–194. [Google Scholar] [CrossRef]
- Rishworth, A.; Elliott, S.J. Global environmental change in an aging world: The role of space, place and scale. Soc. Sci. Med. 2019, 227, 128–136. [Google Scholar] [CrossRef] [PubMed]
- García de Soto, B.; Agustí-Juan, I.; Joss, S.; Hunhevicz, J. Implications of Construction 4.0 to the workforce and organizational structures. Int. J. Constr. Manag. 2022, 22, 205–217. [Google Scholar] [CrossRef]
- Jones, K. The problem of an Aging Global Population, shown by Country. Geogr. Bull. 2020, 52, 21–23. [Google Scholar]
- Moshood, T.D.; Adeleke, A.Q.; Nawanir, G.; Ajibike, W.A.; Shittu, R.A. Emerging Challenges and Sustainability of Industry 4.0 Era in the Malaysian Construction Industry. Int. J. Recent Technol. Eng. 2020, 9, 1627–1634. [Google Scholar] [CrossRef]
- Ahmad, M.; Zhao, Z.-Y.; Li, H. Revealing stylized empirical interactions among construction sector, urbanization, energy consumption, economic growth and CO2 emissions in China. Sci. Total Environ. 2019, 657, 1085–1098. [Google Scholar] [CrossRef]
- Tone, K. A slacks-based measure of super-efficiency in data envelopment analysis. Eur. J. Oper. Res. 2001, 143, 32–41. [Google Scholar] [CrossRef]
- Tone, K. Dealing with undesirable outputs in DEA: A slacks-based measure (SBM) approach. In Proceedings of the NAPW III, Miami, FL, USA, 12–15 June 2023; pp. 44–45. [Google Scholar]
- Chung, Y.H.; Färe, R.; Grosskopf, S. Productivity and Undesirable Outputs: A Directional Distance Function Approach. J. Environ. Manag. 1997, 51, 229–240. [Google Scholar] [CrossRef]
- Cheng, M.; Lu, Y.; Zhu, H.; Xiao, J. Measuring CO2 emissions performance of China’s construction industry: A global Malmquist index analysis. Environ. Impact Assess. Rev. 2022, 92, 106673. [Google Scholar] [CrossRef]
- Chen, J.; Xu, C.; Managi, S.; Song, M. Energy-carbon performance and its changing trend: An example from China’s construction industry. Resour. Conserv. Recycl. 2019, 145, 379–388. [Google Scholar] [CrossRef]
- Zhang, R.; Tai, H.; Cheng, K.; Zhu, Y.; Hou, J. Carbon emission efficiency network formation mechanism and spatial correlation complexity analysis: Taking the Yangtze River Economic Belt as an example. Sci. Total Environ. 2022, 841, 156719. [Google Scholar] [CrossRef] [PubMed]
- Wen, Q.; Chen, Y.; Hong, J.; Chen, Y.; Ni, D.; Shen, Q. Spillover effect of technological innovation on CO2 emissions in China’s construction industry. Build. Environ. 2020, 171, 106653. [Google Scholar] [CrossRef]
- Wang, Q.; Wang, X.; Li, R. Does population aging reduce environmental pressures from urbanization in 156 countries? Sci. Total Environ. 2022, 848, 157330. [Google Scholar] [CrossRef] [PubMed]
- Feng, Y.; Wu, H.; Jin, Y.; Wang, L.; Zeng, B. How does population aging affect carbon emissions?-analysis based on the multiple mediation effect model. Environ. Sci. Pollut. Res. Int. 2023, 30, 41419–41434. [Google Scholar] [CrossRef] [PubMed]
- Jin, S.; Wang, P. Population Aging, Farmland Transfer and Agricultural Green Total Factor Productivity. Macroeconomics 2023, 1, 101117. [Google Scholar]
- He, Y.; Song, W. Analysis of the Impact of Carbon Trading Policies on Carbon Emission and Carbon Emission Efficiency. Sustainability 2022, 14, 10216. [Google Scholar] [CrossRef]
- Song, W.; Han, X. The bilateral effects of foreign direct investment on green innovation efficiency: Evidence from 30 Chinese provinces. Energy 2022, 261, 125332. [Google Scholar] [CrossRef]
- Liu, X.; Zhang, W.; Cheng, J.; Zhao, S.; Zhang, X. Green credit, environmentally induced R&D and low carbon transition: Evidence from China. Environ. Sci. Pollut. Res. Int. 2022, 29, 89132–89155. [Google Scholar] [PubMed]
- Dang, D.; Fang, H.; He, M. Economic policy uncertainty, tax quotas and corporate tax burden: Evidence from China. China Econ. Rev. 2019, 56, 101303. [Google Scholar] [CrossRef]
- Li, K.; Fang, L.; He, L. How population and energy price affect China’s environmental pollution? Energy Policy 2019, 129, 386–396. [Google Scholar] [CrossRef]
- Li, E.; Lu, M.; Chen, Y. Analysis of China’s Importance in “Belt and Road Initiative” Trade Based on a Gravity Model. Sustainability 2020, 12, 6808. [Google Scholar] [CrossRef]
- Zhou, Y.; Liu, Y. Does population have a larger impact on carbon dioxide emissions than income? Evidence from a cross-regional panel analysis in China. Appl. Energy 2016, 180, 800–809. [Google Scholar] [CrossRef]
- Qiu, Y.; Wang, H.; Wu, J. Impact of industrial structure upgrading on green innovation: Evidence from Chinese cities. Environ. Sci. Pollut. Res. Int. 2022, 30, 3887–3900. [Google Scholar] [CrossRef] [PubMed]
- Lee, C.-C.; He, Z.-W.; Yuan, Z. A pathway to sustainable development: Digitization and green productivity. Energy Econ. 2023, 124, 106772. [Google Scholar] [CrossRef]
Figure 1.
Spatial changes in population aging from 2004 to 2020.
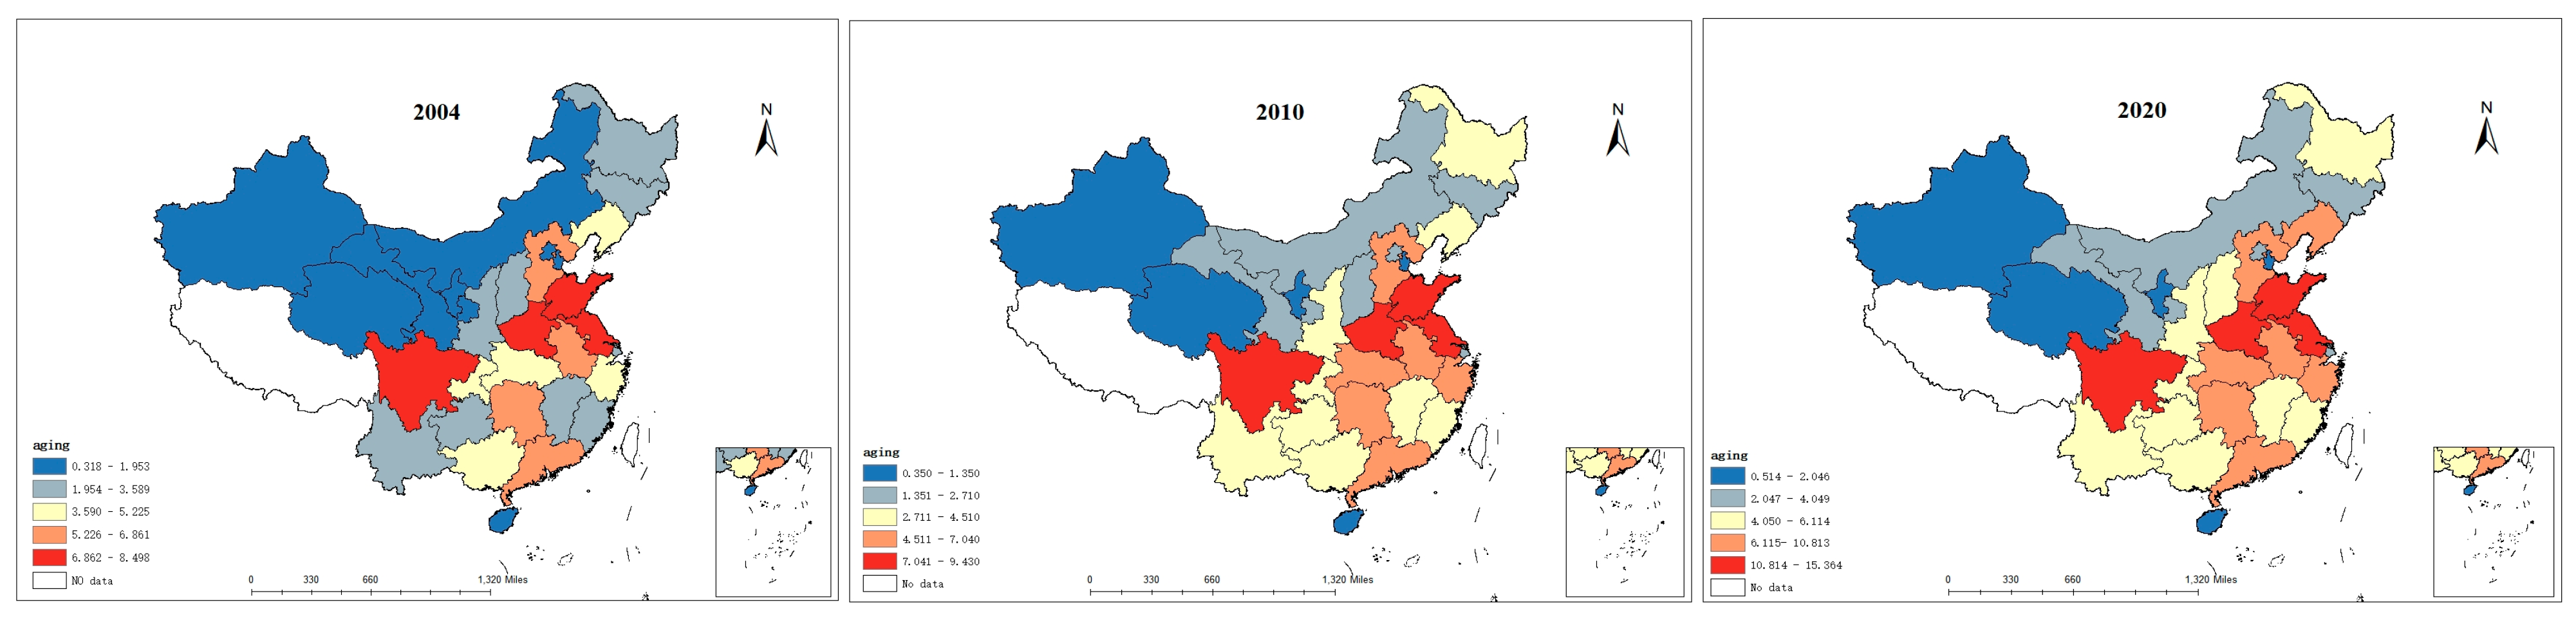
Figure 2.
Spatial changes in construction industry’s CEE from 2004 to 2020.
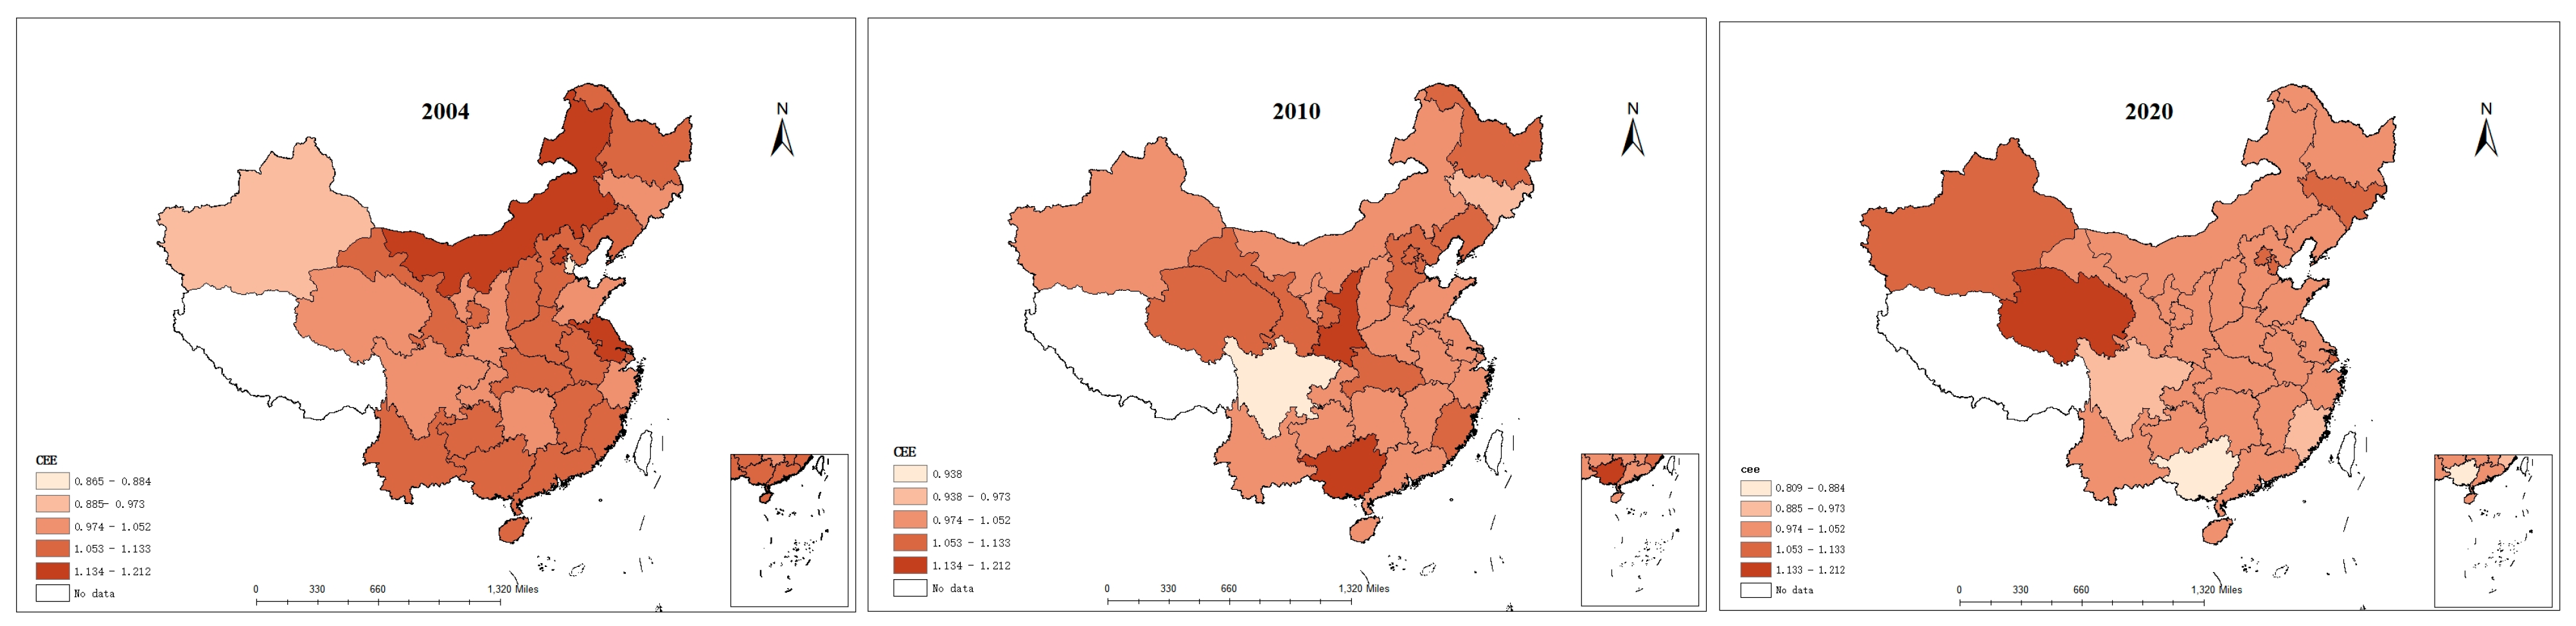
Figure 3.
The relationship between population aging and carbon emission efficiency in the construction industry. (The location of the green dashed line is the turning point, the location of the red solid line is the maximum and minimum values of population aging, and the blue solid line indicates the sample interval).

Table 1.
Index system for measuring CEE of construction industry.
| Criteria Level | Indicator Level | Indicator Description | Unit |
|---|---|---|---|
| Inputs | Capital | Total assets of the construction industry | CNY |
| Labor | The total number of employees in the construction industry | ||
| Energy | The total energy consumption of the construction industry | tons of standard coal | |
| Desirable output | Output value | The total output value of the construction industry | CNY |
| Undesirable output | Cabin dioxide emission | Total carbon emission of the construction industry | tons |
Table 2.
Descriptive statistics for variables.
| Variables | Definition | N | Mean | Std. Dev. | Min | Max |
|---|---|---|---|---|---|---|
| CEE | Carbon emission efficiency in construction industry | 510 | 1.028 | 0.0687 | 0.809 | 1.212 |
| Aging | Population aging | 510 | 4.606 | 3.093 | 0.318 | 15.90 |
| Ind | Industrial structure | 510 | 1.075 | 0.616 | 0.494 | 5.297 |
| Open | The degree of openness | 510 | 0.0226 | 0.0182 | 0.0001 | 0.0819 |
| Tran | Transportation infrastructure level | 510 | 11.35 | 0.875 | 8.734 | 12.98 |
| Tech | Technology innovation | 510 | 0.0148 | 0.0109 | 0.00178 | 0.0644 |
| Tax | Tax burden level | 510 | 0.0784 | 0.0282 | 0.0412 | 0.200 |
| Lab | Labor force level | 510 | 7.575 | 0.790 | 5.631 | 8.859 |
Table 3.
The results of non-linear regression results.
| Variables | POLS | FE | 2SLS | |||
|---|---|---|---|---|---|---|
| CEE | CEE | CEE | CEE | Aging | CEE | |
| (1) | (2) | (3) | (4) | (5) | (6) | |
| Aging | −0.081 *** | −0.084 ** | −0.064 ** | −0.106 *** | −0.139 ** | |
| (0.017) | (0.028) | (0.031) | (0.038) | (0.062) | ||
| Aging2 | 0.016 ** | 0.012 | 0.011 ** | 0.013** | 0.104 *** | 0.018 * |
| (0.005) | (0.006) | (0.005) | (0.006) | (0.0125) | (0.010) | |
| L.aging | 0.288 *** | |||||
| (0.108) | ||||||
| Soc | 0.0002 *** | |||||
| (.00007) | ||||||
| Ind | −0.003 | −0.016 ** | −0.021 | −0.003 | ||
| (0.009) | (0.008) | (0.019) | (0.010) | |||
| Tech | 0.057 ** | 0.057 *** | 0.057 * | 0.076 *** | ||
| (0.017) | (0.013) | (0.031) | (0.018) | |||
| Tax | −0.011 | 0.020 *** | 0.0002 | 0.023 *** | ||
| (0.009) | (0.006) | (0.015) | (0.007) | |||
| Lab | −0.085 * | −0.089 *** | −0.034 | −0.143 *** | ||
| (0.034) | (0.026) | (0.054) | (0.034) | |||
| Open | 0.004 | 0.006 * | 0.018 | 0.005 | ||
| (0.006) | (0.003) | (0.0116) | (0.004) | |||
| Tran | −0.024 * | −0.025 * | −0.048 ** | −0.019 | ||
| (0.009) | (0.013) | (0.022) | (0.017) | |||
| _cons | 0.994 *** | 0.712 *** | 1.035 *** | 1.011 *** | - | - |
| (0.025) | (0.105) | (0.018) | (0.028) | - | - | |
| Year FE | YES | YES | YES | YES | ||
| Province FE | YES | YES | YES | YES | ||
| Underidentification test | 10.339 | |||||
| (0.0057) | ||||||
| Cragg–Donald Wald F statistic | 105.753 | |||||
| (19.93) | ||||||
| Hansen | 0.9912 | |||||
| N | 510 | 510 | 510 | 510 | 480 | 480 |
| R2 | 0.091 | 0.136 | 0.267 | 0.301 | - | 0.078 |
Notes: Standard errors in parentheses, * p < 0.1, ** p < 0.05, *** p < 0.01.
Table 4.
The results of heterogeneity regression.
| Variables | East | Middle | West | North | South |
|---|---|---|---|---|---|
| (1) | (2) | (3) | (4) | (5) | |
| Aging | −0.114 ** | −0.020 | −0.113 | −0.089 ** | −0.068 |
| (0.038) | (0.103) | (0.100) | (0.037) | (0.050) | |
| Aging2 | 0.013 * | −0.005 | 0.018 | 0.013** | 0.007 |
| (0.007) | (0.021) | (0.016) | (0.006) | (0.009) | |
| Ind | −0.005 | −0.033* | −0.036 * | −0.017 * | 0.000 |
| (0.012) | (0.016) | (0.018) | (0.009) | (0.008) | |
| Tech | 0.078 *** | 0.095 *** | 0.024 | 0.027 | 0.056 ** |
| (0.018) | (0.026) | (0.035) | (0.015) | (0.026) | |
| Tax | 0.021 ** | 0.037 | 0.017 | 0.019 * | 0.006 |
| (0.008) | (0.024) | (0.012) | (0.009) | (0.009) | |
| Lab | −0.160 *** | −0.083 | −0.061 ** | −0.068 ** | −0.071 * |
| (0.044) | (0.064) | (0.027) | (0.023) | (0.038) | |
| Open | 0.013 *** | −0.032 * | 0.000 | 0.004 | 0.009* |
| (0.004) | (0.015) | (0.016) | (0.005) | (0.005) | |
| Tran | −0.013 | −0.038 | −0.030 | −0.029 | −0.022 |
| (0.027) | (0.023) | (0.021) | (0.018) | (0.019) | |
| _cons | 0.994 *** | 1.150 *** | 0.893 *** | 0.932 *** | 1.097 *** |
| (0.035) | (0.035) | (0.076) | (0.048) | (0.027) | |
| Year FE | YES | YES | YES | YES | YES |
| Province FE | YES | YES | YES | YES | YES |
| N | 187 | 136 | 187 | 255 | 255 |
| R2 | 0.348 | 0.464 | 0.304 | 0.424 | 0.308 |
Notes: Standard errors in parentheses, * p < 0.1, ** p < 0.05, *** p < 0.01.
Table 5.
The results of robust tests.
| Variables | Excluding the Special Sample Cities | Eliminate Variable Outliers | Replacement of Explained Variable |
|---|---|---|---|
| (1) | (2) | (3) | |
| Aging | −0.114 *** | −0.093 *** | −0.151 *** |
| (0.035) | (0.034) | (0.052) | |
| Aging2 | 0.015 *** | 0.011 * | 0.020 ** |
| (0.005) | (0.005) | (0.010) | |
| Ind | −0.019 | −0.021 | −0.013 |
| (0.012) | (0.010) | (0.020) | |
| Tech | 0.055 *** | 0.052 *** | 0.084 *** |
| (0.016) | (0.012) | (0.021) | |
| Tax | 0.025 *** | 0.023 *** | 0.045 *** |
| (0.008) | (0.007) | (0.012) | |
| Lab | −0.077 *** | −0.079 *** | −0.133 ** |
| (0.024) | (0.024) | (0.051) | |
| Open | 0.004 | 0.006 * | 0.004 |
| (0.004) | (0.004) | (0.009) | |
| Tran | −0.030 ** | −0.027 ** | −0.011 |
| (0.014) | (0.013) | (0.035) | |
| _cons | 1.042 *** | 1.011 *** | 1.016 *** |
| (0.026) | (0.026) | (0.038) | |
| Year FE | YES | YES | YES |
| Province FE | YES | YES | YES |
| N | 442 | 510 | 510 |
| R2 | 0.323 | 0.320 | 0.304 |
Notes: Standard errors in parentheses, * p < 0.1, ** p < 0.05, *** p < 0.01.
Disclaimer/Publisher’s Note: The statements, opinions and data contained in all publications are solely those of the individual author(s) and contributor(s) and not of MDPI and/or the editor(s). MDPI and/or the editor(s) disclaim responsibility for any injury to people or property resulting from any ideas, methods, instructions or products referred to in the content. |
© 2023 by the authors. Licensee MDPI, Basel, Switzerland. This article is an open access article distributed under the terms and conditions of the Creative Commons Attribution (CC BY) license (https://creativecommons.org/licenses/by/4.0/).
Share and Cite
MDPI and ACS Style
Yang, S.; Shen, J.; Li, H.; Zhang, B.; Ma, J.; Cheng, B. Unraveling the U-Shaped Linkage: Population Aging and Carbon Efficiency in the Construction Industry. Sustainability 2023, 15, 13212. https://doi.org/10.3390/su151713212
AMA Style
Yang S, Shen J, Li H, Zhang B, Ma J, Cheng B. Unraveling the U-Shaped Linkage: Population Aging and Carbon Efficiency in the Construction Industry. Sustainability. 2023; 15(17):13212. https://doi.org/10.3390/su151713212
Chicago/Turabian StyleYang, Su, Jie Shen, Hongyang Li, Beibei Zhang, Jinchao Ma, and Baoquan Cheng. 2023. "Unraveling the U-Shaped Linkage: Population Aging and Carbon Efficiency in the Construction Industry" Sustainability 15, no. 17: 13212. https://doi.org/10.3390/su151713212
Note that from the first issue of 2016, this journal uses article numbers instead of page numbers. See further details here.