Article

Effect of Regulated Deficit Irrigation (RDI) on the Growth and Development of Pear Fruit (Pyrus communis L.), var. Triunfo de Viena

by
Javier Vélez-Sánchez
1,*,
Fánor Casierra-Posada
2 and
Gerhard Fischer
3,*
1
Department of Civil and Agricultural Engineering, Universidad Nacional de Colombia, Bogota 111321, Colombia
2
Program of Agricultural Engineering, Faculty of Agricultural Sciences, Universidad Pedagógica y Tecnológica de Colombia, Tunja 150003, Colombia
3
Department of Agronomy, Faculty of Agricultural Sciences, Universidad Nacional de Colombia, Bogota 111321, Colombia
*
Authors to whom correspondence should be addressed.
Sustainability 2023, 15(18), 13392; https://doi.org/10.3390/su151813392
Submission received: 19 July 2023 / Revised: 4 September 2023 / Accepted: 5 September 2023 / Published: 7 September 2023
(This article belongs to the Special Issue Challenges in Sustainable Plant Cultivation and Produce Supply)

Abstract

:
The irrigation of crops represents 70% of the world’s water use. For crops grown in high-altitude tropical climates, due to the decrease in rainfall with increasing altitude, along with the effects of global warming, it is necessary to propose alternatives for sustainable fruit production with reduced water consumption. This study was carried out in Sesquilé, Colombia (South America), at an altitude of 2595 m a.s.l. for two successive years with pear trees, var. Triunfo de Viena. The objective of this work was to determine the effect of regulated deficit irrigation (RDI) on the absolute and relative growth rates of the equatorial diameter of the fruits, the fresh and dry weights, the number of fruits, the yield per tree and the water potential of the fruits. In 2014, during the rapid growth phase of the fruit, one group of plants was irrigated at 100% of the crop evapotranspiration (ETc) (control), another at 74% and a third group at 60%. In 2015, the three groups were irrigated at 100%, 48% and 27% of the ETc. The use of RDI did not significantly affect the growth of the fruits. This study showed that the ‘Triunfo de Viena’ pear tree not only has sufficient adaptive reserves, but also has good ecological plasticity under water stress conditions in high-altitude tropical climates. In cases where water is a limiting factor for pear tree production, RDI can obtain production rates similar to those of a regularly irrigated crop, as long as this technique is used and implemented in phenological states of low sensitivity to water stress without exceeding the tolerance limits of the plants to the stressor.

1. Introduction

Agriculture faces many challenges and must become more sustainable to meet the needs of new generations [1]. Water is the crucial resource for sustainable agricultural development [2], with agriculture using more than 2/3 of the planet’s fresh water [3].
When water supplies are not guaranteed, irrigation is not sustainable; therefore, in water-scarce areas, the main irrigation challenge is to minimize the consumption of water [2]. The decreased precipitation at high altitudes in the Andes of Colombia [4] makes irrigation necessary for the establishment of fruit crops.
Regulated deficit irrigation (RDI) has been widely applied to fruit trees, such as grape, citrus, pear, apple, peach, cherry, blueberry and mango, as well as to melon [5]. In the RDI methodology, water stress is induced in the tree by irrigating less than the crop evapotranspiration (ETc) under standard conditions in certain phases of fruit development [6]. In agriculture, sustainable water management is carried out with the purpose of matching the availability of water with the demand for this resource for crops in terms of quantity, quality, space and time, with an acceptable environmental impact and a reasonable cost [2].
Lack of water has become a limiting factor both in fruit production and growth [7]. In addition, water stress alters the hormonal balance of many plant species, leading to significant changes in the physiological processes of growth and development [8].
Growth is one of the processes most affected by water deficit, and it also affects the anatomy, physiology, morphology and biochemistry of the plant [9,10]. The division and differentiation of the vegetative and reproductive structures are very sensitive to lack of water, as is cell elongation, but the various physiological processes are not necessarily affected with the same intensity under these conditions [11].
In Navelina orange trees, irrigation can be reduced during the growth stage of the fruit without causing a decrease in its production or quality [12]. This is possible due to the recovery capacity in the growth of the fruits when resuming irrigation after a moderate water deficit [13]. Monitoring the daily growth of the fruit allows the intensity of the deficit to be controlled, thereby avoiding reductions in production and quality. The effect generated by the water deficit will depend on its intensity and duration as well as the stage of the crop cycle in which it occurs, since it is known that water stress affects the stages of growth, inflorescence and fertilization in different ways and intensities, even producing floral abortion and fruit abscission [11].
The diameter of the fruit is an indicator of when irrigation should be applied [14]. When the crop has been subjected to water stress, the growth of the fruit will decrease or stop, but when water supply is resumed during the rapid growth stage, the fruits will recover and the level of production will be similar to that of trees irrigated regularly throughout their growth [15]. In this regard, the main obstacle to using fruit growth as an indicator in irrigation programming is the high variability between fruits. This is because their growth is not uniform throughout the season, depending on many factors such as temperature, relative humidity and radiation, and normal growth curves can also deviate significantly from one year to another [16]. Additionally, when there is an absence of fruit, it is impossible to use fruit growth as an indicator for irrigation programming.
The pear fruit is of great importance in human nutrition due to its antioxidant capacity and high amounts of phenolic compounds and flavonoids that help increase the defenses of the immune system and protect against numerous chronic diseases [17]. In Colombia, ‘Triunfo de Viena’ is the most important pear variety in the Cundinamarca and Boyacá regions, where it is grown at altitudes between 2400 and 3000 m a.s.l., where the plants can accumulate 500–600 chilling hours to break their rest [18]. Under these conditions, the trees show a defined and uniform phenology, with a natural defoliation season [19], and they are characterized by their prolific and parthenocarpic production, with fruits having an average weight of 350 g [18].
According to the latest data from Agronet [20], the total production of pears in Colombia in 2020 was 27,997.75 ton, on a cultivated area of 1615 ha, with a yield of 17.4 ton ha−1.
For good yields and the economic sustainability of pear growing in the tropical highlands, it is important to use methods that save water during periods of scarcity, and to understand the physiological mechanisms of the plant in response to water stress. This makes it possible to improve the adaptation of fruit trees to semi-arid environments [21], guaranteeing their sustainability. Excessive irrigation can cause deficiencies in water for neighboring farmers, waterlogging in the crop, favorable conditions for diseases, contamination of the aquifers with pesticides and fertilizers and reductions in the quality and yield of the crop, all of which increase production costs [2].
Therefore, the objective of this research was to evaluate the effect of regulated deficit irrigation on the growth of the pear fruit, var. Triunfo de Viena, during the rapid growth stage of the fruit in 2014 and 2015, taking into account the water status of the soil and the plant.

2. Materials and Methods

2.1. Location

The experiment was carried out between 2014 and 2015 in the municipality of Sesquilé, Cundinamarca, Colombia (5.02′53.65″ N and 73.48′12.78″ W), at an altitude of 2595 m a.s.l., in a 0.32 ha plot, with 172 pear trees, var. Triunfo de Viena, planted in 1998 at 4 × 4 m. The soil had a clay-loam texture [22]. The weather information was obtained from a WS-GP1 portable weather station (Delta-T Devices, Cambridge, UK) located on the plot. The average temperatures in 2014 and 2015 were 12.8 and 12.9 °C, respectively, with average maximum temperatures of 20.6 and 16.1 °C and average minimum temperatures of 7.48 and 9.95 °C. The mean effective precipitation in 2014 and in 2015 was 66.41 and 29.18 mm/month, respectively. The total precipitation (Tp) in the period from November 2013 to April 2014 was 465.4 mm. The Tp from September 2014 to March 2015 was 233.4 mm. The prevailing climate in the region is cold and dry.
The mean potential evapotranspiration (ETo) values were calculated using the Penman–Monteith equation [23,24] and showed values of 2.6 and 1.8 mm day−1 in 2014 and 2015, respectively. The average percentage of the shaded area of the trees was 44.0% in both years, with an average area of 7.04 m2 with respect to the plantation framework (16 m2); the crop coefficient (Kc) was 0.8 and irrigation efficiency (ηr) was 80%. To identify the water balance, the effective precipitation was determined by means of the S.C.S. (USDA Soil Conservation Service). During the restriction period in the control treatment, this resulted in water depths of 67.6 and 48.3 mm (1.144 mm day−1 and 0.779 mm day−1), corresponding to 100% of ETc in 2014 and 2015, respectively. This was determined as ETc = (ETo × Kc*%A)/ηr [25].
A localized drip irrigation system with six emitters with a discharge of 8 L h−1 per tree was used. The experimental design implemented was randomized complete blocks, according to the slope of the land and the distribution of the trees in the plot, with three treatments and four repetitions to form twelve experimental units (EUs). Each EU was made up of four or five contiguous rows of three, four or five trees per row.
The irrigation depth was determined by taking into account the crop evapotranspiration under standard conditions (ETc). During the crop cycle, all EUs were irrigated at 100% ETc. In the rapid growth phase of the fruit, irrigation treatments were applied as follows: 100% ETc in both years of evaluation for the control; 74% and 48% of the ETc in 2014; and 60% and 27% of the ETc in 2015. The irrigation volume of the treatments was decreased in 2015, to evaluate what effect this decrease had. The level of water applied in each treatment was controlled by irrigation time, with irrigation every two days. Water was measured using 13 mm Zenner® volumetric meters installed in each plot.
In 2014, the treatments were implemented from 1 January until 28 February, with 67.6, 49.8 and 40.9 mm applied. In 2015, the treatments were applied from 23 December 2014 until 22 February 2015, with 48.3, 23.3 and 13.1 mm applied. These treatments corresponded to 100% ETc for the control, 74 or 48% ETc in 2014, and 60 or 27% ETc in 2015. The amount of water supplied during the treatments was higher in 2014 due to the weather conditions at the time of the water restrictions.

2.2. Response Variables

Fruit water potential (Ψf) was determined using a Scholander Model 600 pressure chamber (PMS Instrument Company, Albany, OR, USA), following the methodology described for leaf water potential [26]. The water potentials of the fruit at dawn (Ψfd) and at solar noon (Ψfn) were measured in two fruits located in the lower third of the north face of three or four trees per treatment in 2014, at the beginning of the deficit treatments and subsequently every 15 and 30 days for (Ψfn) and (Ψfd), respectively [27].
The growth of the fruits was recorded in 2014 and 2015. For this, 12 fruits per tree were selected and marked, in the north and south orientations of two trees (96 fruits per treatment). Their equatorial diameter was measured every 8 days from the moment the fruit set until harvest, which took place on 9 May 2014 and on 10 April 2015. This procedure was performed using a Mitutoyo Digimattic CD 6 CSX digital caliper with a precision of 0.01 mm (Mitutoyo Corporation, Tokyo, Japan). An adjustment in the equatorial diameter data was made with a sigmoid logistic model according to Equation (1), which has the highest correlation coefficient.
y = a 1 + e x c b
Here, y is the equatorial diameter of the fruit; a is the maximum value that the equatorial diameter can reach; x is the time, measured in days after flowering (DAF); b is the maximum growth rate of the equatorial diameter of the fruit; and c is the time in which the maximum growth rate is achieved.
In the same way, the absolute growth rate (AGR) of the equatorial diameter of the fruit was calculated using the derivative of Equation (1), which results in Equation (2).
d y d x = a e x c b b 1 + e x c b 2
In addition, the relative growth rate (RGR) of the equatorial diameter of the fruit was determined using Equation (3).
T R C = 1 Y d y d x
Also, the fresh weight of the fruits was determined using a 0.1 g precision PB3001 electronic balance (Mettler Toledo, Columbus, OH, USA) by weighing 320 fruits individually in 2014 and 480 in 2015. The volume was calculated by immersing the fruits in distilled water and measuring the displaced liquid in a 600 mL graduated cylinder (Schott AG, Mainz, Germany). The fruit’s dry weight was obtained by placing the tissues in a calibrated muffle at 70 °C, until there was no further decrease in weight.
For the two years of measurement, the production was quantified according to the size of the fruit diameter for the trees subjected to the different treatments. Thus, the sizes were classified as follows: I, fruits with a diameter greater than 68 mm; II, fruits with a diameter between 62 and 68 mm; and III, fruits with a diameter less than 61 mm, measured using a Mitutoyo digital caliper.
Soil moisture content (θg) was measured every three days on two trees per replicate and eight per treatment, using an HH2 moisture meter and a PR2/6 profiler probe (Delta-T Devices Ltd., Cambridge, UK) at six fixed depths (0.1, 0.2, 0.3, 0.4, 0.6 and 1.0 m). The matrix potential of water in the soil Ψθ was continuously measured every three days with eight granular matrix sensors (Watermark Mod. 200ss Irrometer Company, Riverside, CA, USA) per treatment, installed at 20 and 30 cm depth, separated by about 25 cm from the emitter and the drip line. Data collection from the sensors was carried out using a Watermark acquisition device.

2.3. Analysis of Data

The statistical analysis of the data obtained was performed with the SAS v9.2e program (SAS Institute Inc., Cary, NC, USA), using an analysis of variance and Tukey’s honest significant difference (HSD) test (p < 0.05) and the least significant difference test (LSD).

3. Results and Discussion

The reduction in water used during the application of treatments with RDI represented savings of 26% and 40% (179 and 268 m3 ha−1) in 2014 and 52% and 73% (249 and 351 m3 ha−1) in 2015, respectively.
During the periods of water restriction in 2014 and 2015, the mean volumetric moisture (θv) in the control treatment was 22.32 and 24.9%, respectively, close to field capacity (CC = 27%). In the treatments with 74% and 48% ETc, it was 24.93% and 23.9%, respectively, and in the treatments with 60% and 27% ETc it was 21.03% and 22.9%, respectively, according to the precipitation conditions of each year. The 100% ETc, with a higher percentage of applied water than the 74% ETc in 2014, had a lower mean (θv) in the period of maximum evaporative demand. In 2015, the (θv) of the 100% ETc was higher than those for 48 and 27% ETc. During the entire experiment, none of the treatments presented statistically significant differences according to the Tukey test (p < 0.05), due to precipitation and the high frequency of irrigation. These values were only approximate, given the high variability observed in our soil moisture measurements (CV = 33% in 2014 and 42.7% in 2015), and therefore they had relatively low precision.

3.1. Production Parameters

There were no statistically significant differences between treatments. However, in 2014 and 2015, slightly smaller fruits were recorded in the water deficit treatments, while the control presented the largest fruits. This confirmed that the effect of water stress on fruit growth is less than that observed in other vegetative organs [13]. In addition, this result clearly confirmed that deficit irrigation under these study conditions does not significantly decrease the size of the fruits, making it a sustainable procedure in the conditions of the dry tropical highlands [4].
It was observed that, at the beginning of the water restriction, the fruit growth decreased slightly; however, when irrigation was restored to normal levels, or when rain fell, the growth recovered and the fruits reached the development of those of the control treatment, having accumulated dry weight in a similar way during the periods of water stress. This dry weight gain seems to be available to facilitate the compensatory growth of the fruit after the resumption of irrigation [28,29,30,31,32]. Table 1 shows that, in 2014, the application of 60% of ETc induced the highest percentage of dry weight in fruits, although without statistically significant differences. However, in 2015, the application of 27% of ETc presented a lower percentage of dry weight, without significant differences with the plants in which 100% and 48% of the ETc were applied. The lower fresh fruit weight obtained in 2015 (163.74 g) may have occurred because rainfall was 2.8 times lower in that year than in 2014, and even the treatment in which 60% ETC was applied in 2014 had a higher fresh weight (267.04 g) than that registered in plants irrigated with 100% ETc in 2015 (167.99 g), with a significant difference between the two years.
There were no significant differences between the irrigation treatments for the variables of production, number of fruits per tree, average weight of the fruit and distribution of fruits by size, presumably because the levels of water stress reached were not severe enough. This contradicts the common perception of most producers, who consider that deliberately imposing stress with RDI represents a risk that would affect the yield in fruit species such as citrus, pistachio, almond, peach and grape [33].
In this way, and based on the weight of the fruits, the present work confirmed the sustainability of deficit irrigation for the cultivation of pear trees in tropical highland conditions. This is corroborated by Goldhamer [33], who mentions that producers are motivated by two aspects: economic benefit and regulation in the use of water. Therefore, if growers of fruit species believe that the adoption of RDI will increase their profits, the acceptance of this methodology will be much easier. Additionally, most fruit growers consider RDI a procedure that would affect the yield of the trees, so the remuneration for the yield must balance this risk. In this sense, fruit growers will consider adopting this irrigation technique if it increases profit by allowing their plants to consume less water (between 200 and 300 mm less using RDI) without negatively affecting the production; the saved water can then be used for other purposes [33].
Additionally, this work found that, in 2014, the number of fruits and the production per tree tended to be slightly higher in the treatment without water deficit, albeit with no statistical differences, due to the greater amount of water applied. However, the greater weight of the fruit presented with the application of 60% ETc allowed us to verify the hypothesis of compensatory growth (Table 2). The average weight of the fruit in 2014 did present significant differences compared to the 2015 treatments with the application of 100, 48 and 27% of the ETc (176.54, 163.73 and 162.83 g, respectively). However, these differences did not influence the value of the total production, due to the low percentages they represented of the total (Table 2).
Results for the variable production per tree showed a very small and non-significant reduction in yield, compared to the benefits obtained by saving water that could be used for other crops that are more in need of this resource (2), and there was only a significant difference between years in the control (100%) and in the lowest ETc treatment. In addition, production depends on the season, climatic conditions, and the intensity and duration of water stress applied, as has been reported for the ‘Triunfo de Viena’ pear tree [17,32], as well as for ‘Jujube’ [34], ‘Conference’ pear [28] and Clingstone peach [6], where the reductions in water supply to the crop did not cause a decrease in production.
The results for the two years indicated a competition effect between the weight of the fruit and the number of fruits per tree, since this last variable was lower in the treatments in which RDI was applied, an effect that has also been observed in citrus, independent of water stress [35]. Although there were no significant differences in production, the treatments with the lowest yield were those in which deficit irrigation was applied; however, this can also be attributed to external factors, such as pruning, for example.
For the treatments with RDI, production and distribution measured by calibers for the two years of evaluation were similar to those found for the treatments with the application of 100% of the ETc. This confirmed the results obtained in citrus [12,13] and pear [17,31,36], where the period in which the deficit was imposed was not very sensitive to water stress. However, there were significant differences in the number of fruits between years, which occurred in category I with 48% ETc and in category III with all treatments. In addition, by continuously measuring the water potential of the stem (Ψs), it was possible to prevent serious water deficit being experienced by the plant. The registered minimum Ψs values corresponded to −0.78 and −0.80 MPa in 2014, with the application of 74 and 60% ETc, and −0.96 and −0.99 MPa in 2015, with the application of 60 and 27% of the ETc. These values of Ψs found at noon are considered typical for fruit trees with these characteristics, and they were similar to what was obtained in pear [31] during the phase of rapid growth of the fruit (which was also the case in this study). This also confirmed, for the ‘Triunfo de Viena’ pear, the existence of a separation between vegetative and fruit growth, which occurs after the end of shoot growth, similar to what was found by Chalmers et al. [37] in peach and pear.
Similar to the diameter growth in fruits of the ‘Red Sensation’ pear tree [38] and in fruits of Asian pear trees [39], the equatorial diameter growth of the fruit in the present study during the two years showed a behavior adjusted to a sigmoid logistic model, defined in three phases. In the first phase, cell division occurred from flowering up to 49 and 50 days after flowering (DAF) in 2014 and 2015, respectively, with rapid growth. The second phase was cell elongation, which occurred from 50 to 112 DAF and from 51 to 113 DAF for 2014 and 2015, respectively. The third phase, in which maturation was reached, was characterized by a continuous increase in diameter from 113 and 114 DAF until harvest (169 and 161 DAF) for 2014 and 2015, respectively (Figure 1A,B), which concurred with reports for pear [37] and apricot [40] plantations. Similarly, Garriz et al. [38] found that the maximum value for the AGR of the fruit was 0.61 mm day−1. In addition, those authors determined three phases of growth in the diameter of the fruits, whose growth curve had a sigmoid shape. During the initial phase, most of the cell division occurs in the fruits, which is followed by a rapid increase in volume as a consequence of cell elongation. Finally, the growth rate of the fruit is reduced until reaching maturity, and the final size of the fruit tends to be asymptotic. In the present work, the parameters of the sigmoid logistic model for the equatorial diameter of the fruit in 2014 and 2015 are shown in Table 3, together with the values of the coefficient of determination, which was greater than 0.99 for all settings.
In 2014, the maximum values recorded for the equatorial diameter at 154 DAF, when 100, 74 and 60% of ETc were applied to the trees, were 7.75, 7.59 and 7.70 cm, respectively. Meanwhile, in 2015, at 161 DAF, values of 6.78, 6.55 and 6.63 cm were recorded when the plants were subjected to irrigation of 100, 48 and 27% of ETc, respectively, without presenting significant statistical differences. This could be due to the fact that the water deficit was not severe, and the fruits grew due to the reserve carbohydrates stored in the stems and roots and were able to accumulate dry matter during periods of stress, as reported for pear [34] and for clementine by de Nules [35]. According to the theory of root–shoot balance, fruit trees under water stress transfer more nutrients to reproductive growth processes, and thus RDI can have a low negative effect on crop growth, especially on fruits, by saving water [5]. Taking into account these theories, we suggest that the ‘Triunfo de Viena’ pear not only possesses sufficient adaptive reserves but also a good ecological plasticity against hydric stress conditions in tropical highlands.
At the beginning of the treatments, the equatorial diameter of the fruits of plants with the application of 100% of the ETc was greater than that of the fruits of trees treated with water restriction in 2014, while in 2015 there were no significant differences in the values found for the equatorial diameter. As the treatments progressed, the equatorial diameter in the control treatment was greater than in the treatments with RDI for the two years; however, after the resumption of irrigation, the fruits from plants with an application of 60% of the ETc had a compensatory growth and reached the equatorial diameter of the fruits of the control treatment, similar to what was found by Vélez et al. [35]. The equatorial diameters measured in 2014 at 154 DAF (7.69, 8.32 and 7.69 cm) were greater than those found in two other studies on pears, with 7.07, 6.93 and 6.83 cm [29] and 6.65, 6.16 and 6.17 cm [31]. Meanwhile, the values found in the present work in 2015 at 186 DAF (7.53, 7.34 and 7.50 cm) were lower when the plants were irrigated with 100, 48 and 27% of the ETc, respectively, which can be attributed to the higher median maximum temperatures in 2014 (21 °C) compared to those of 2015 (16 °C), and to the higher rainfall (233.44 mm in 2015, 465.4 mm in 2014). It should be noted that, during the cell elongation phase, temperature is the main regulatory factor for the development and growth of fruits when the soil has a sufficient amount of water available to the plant, which favorably affects photosynthetic processes and stomatal behavior [17].

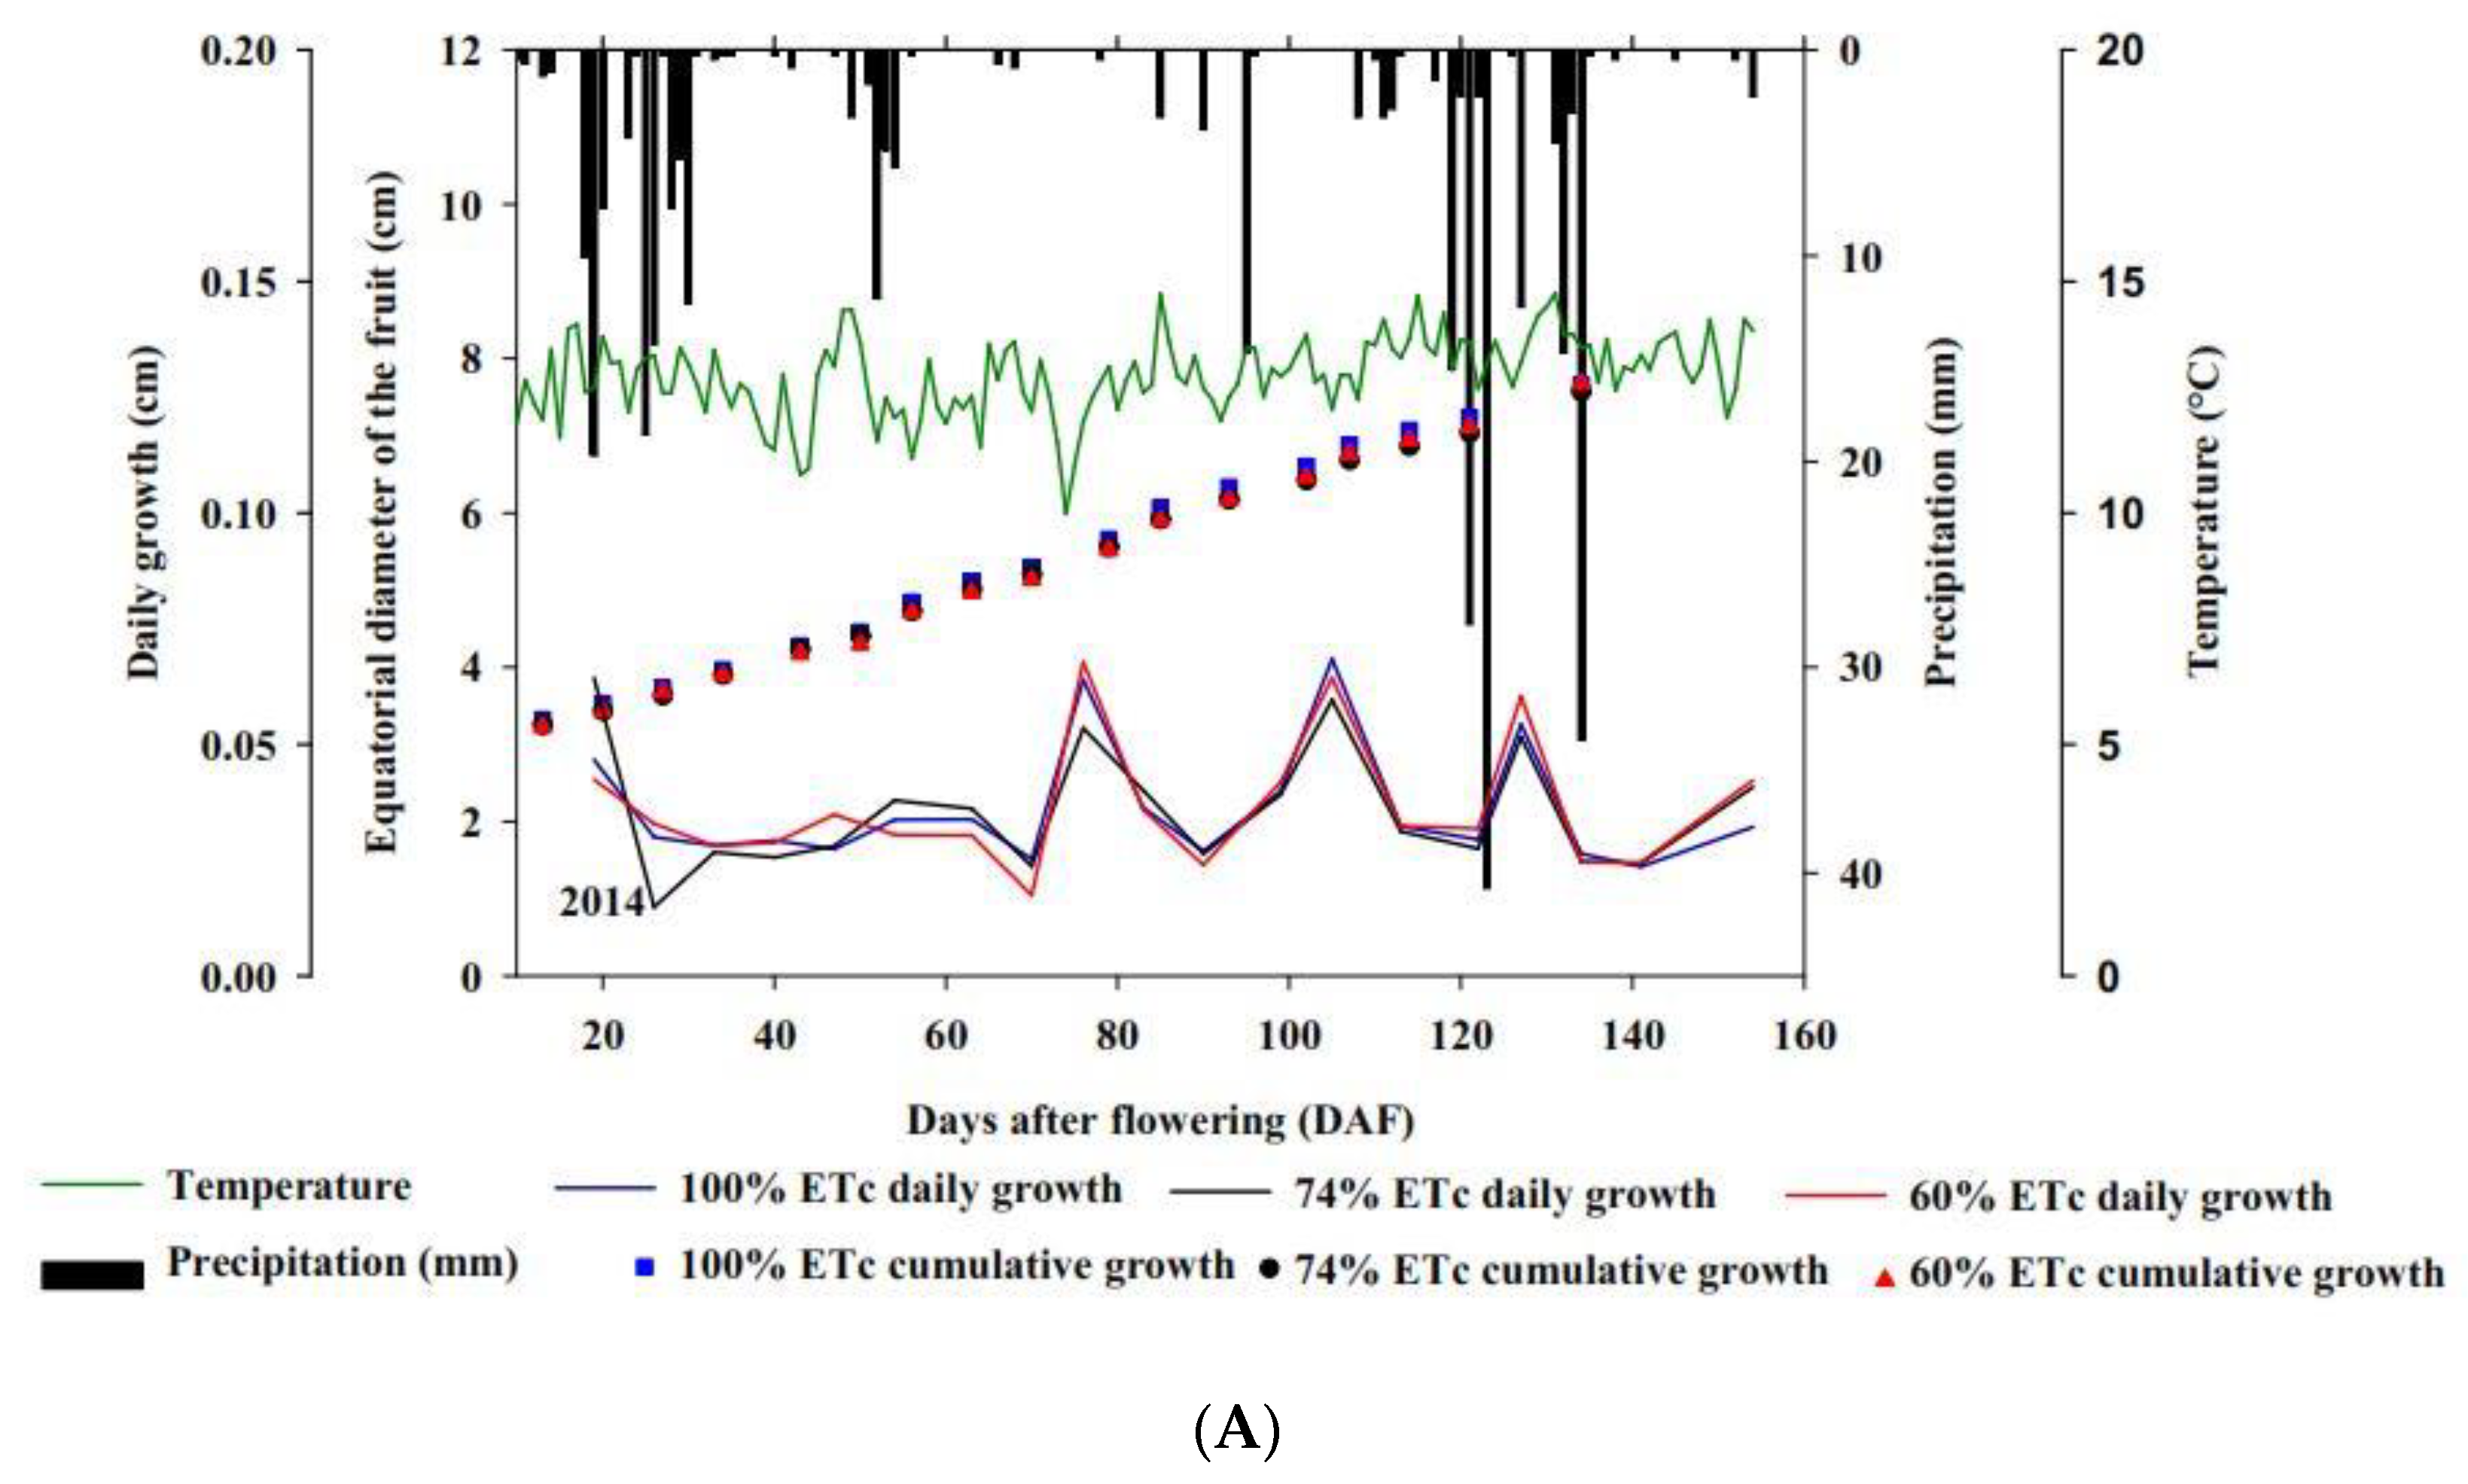
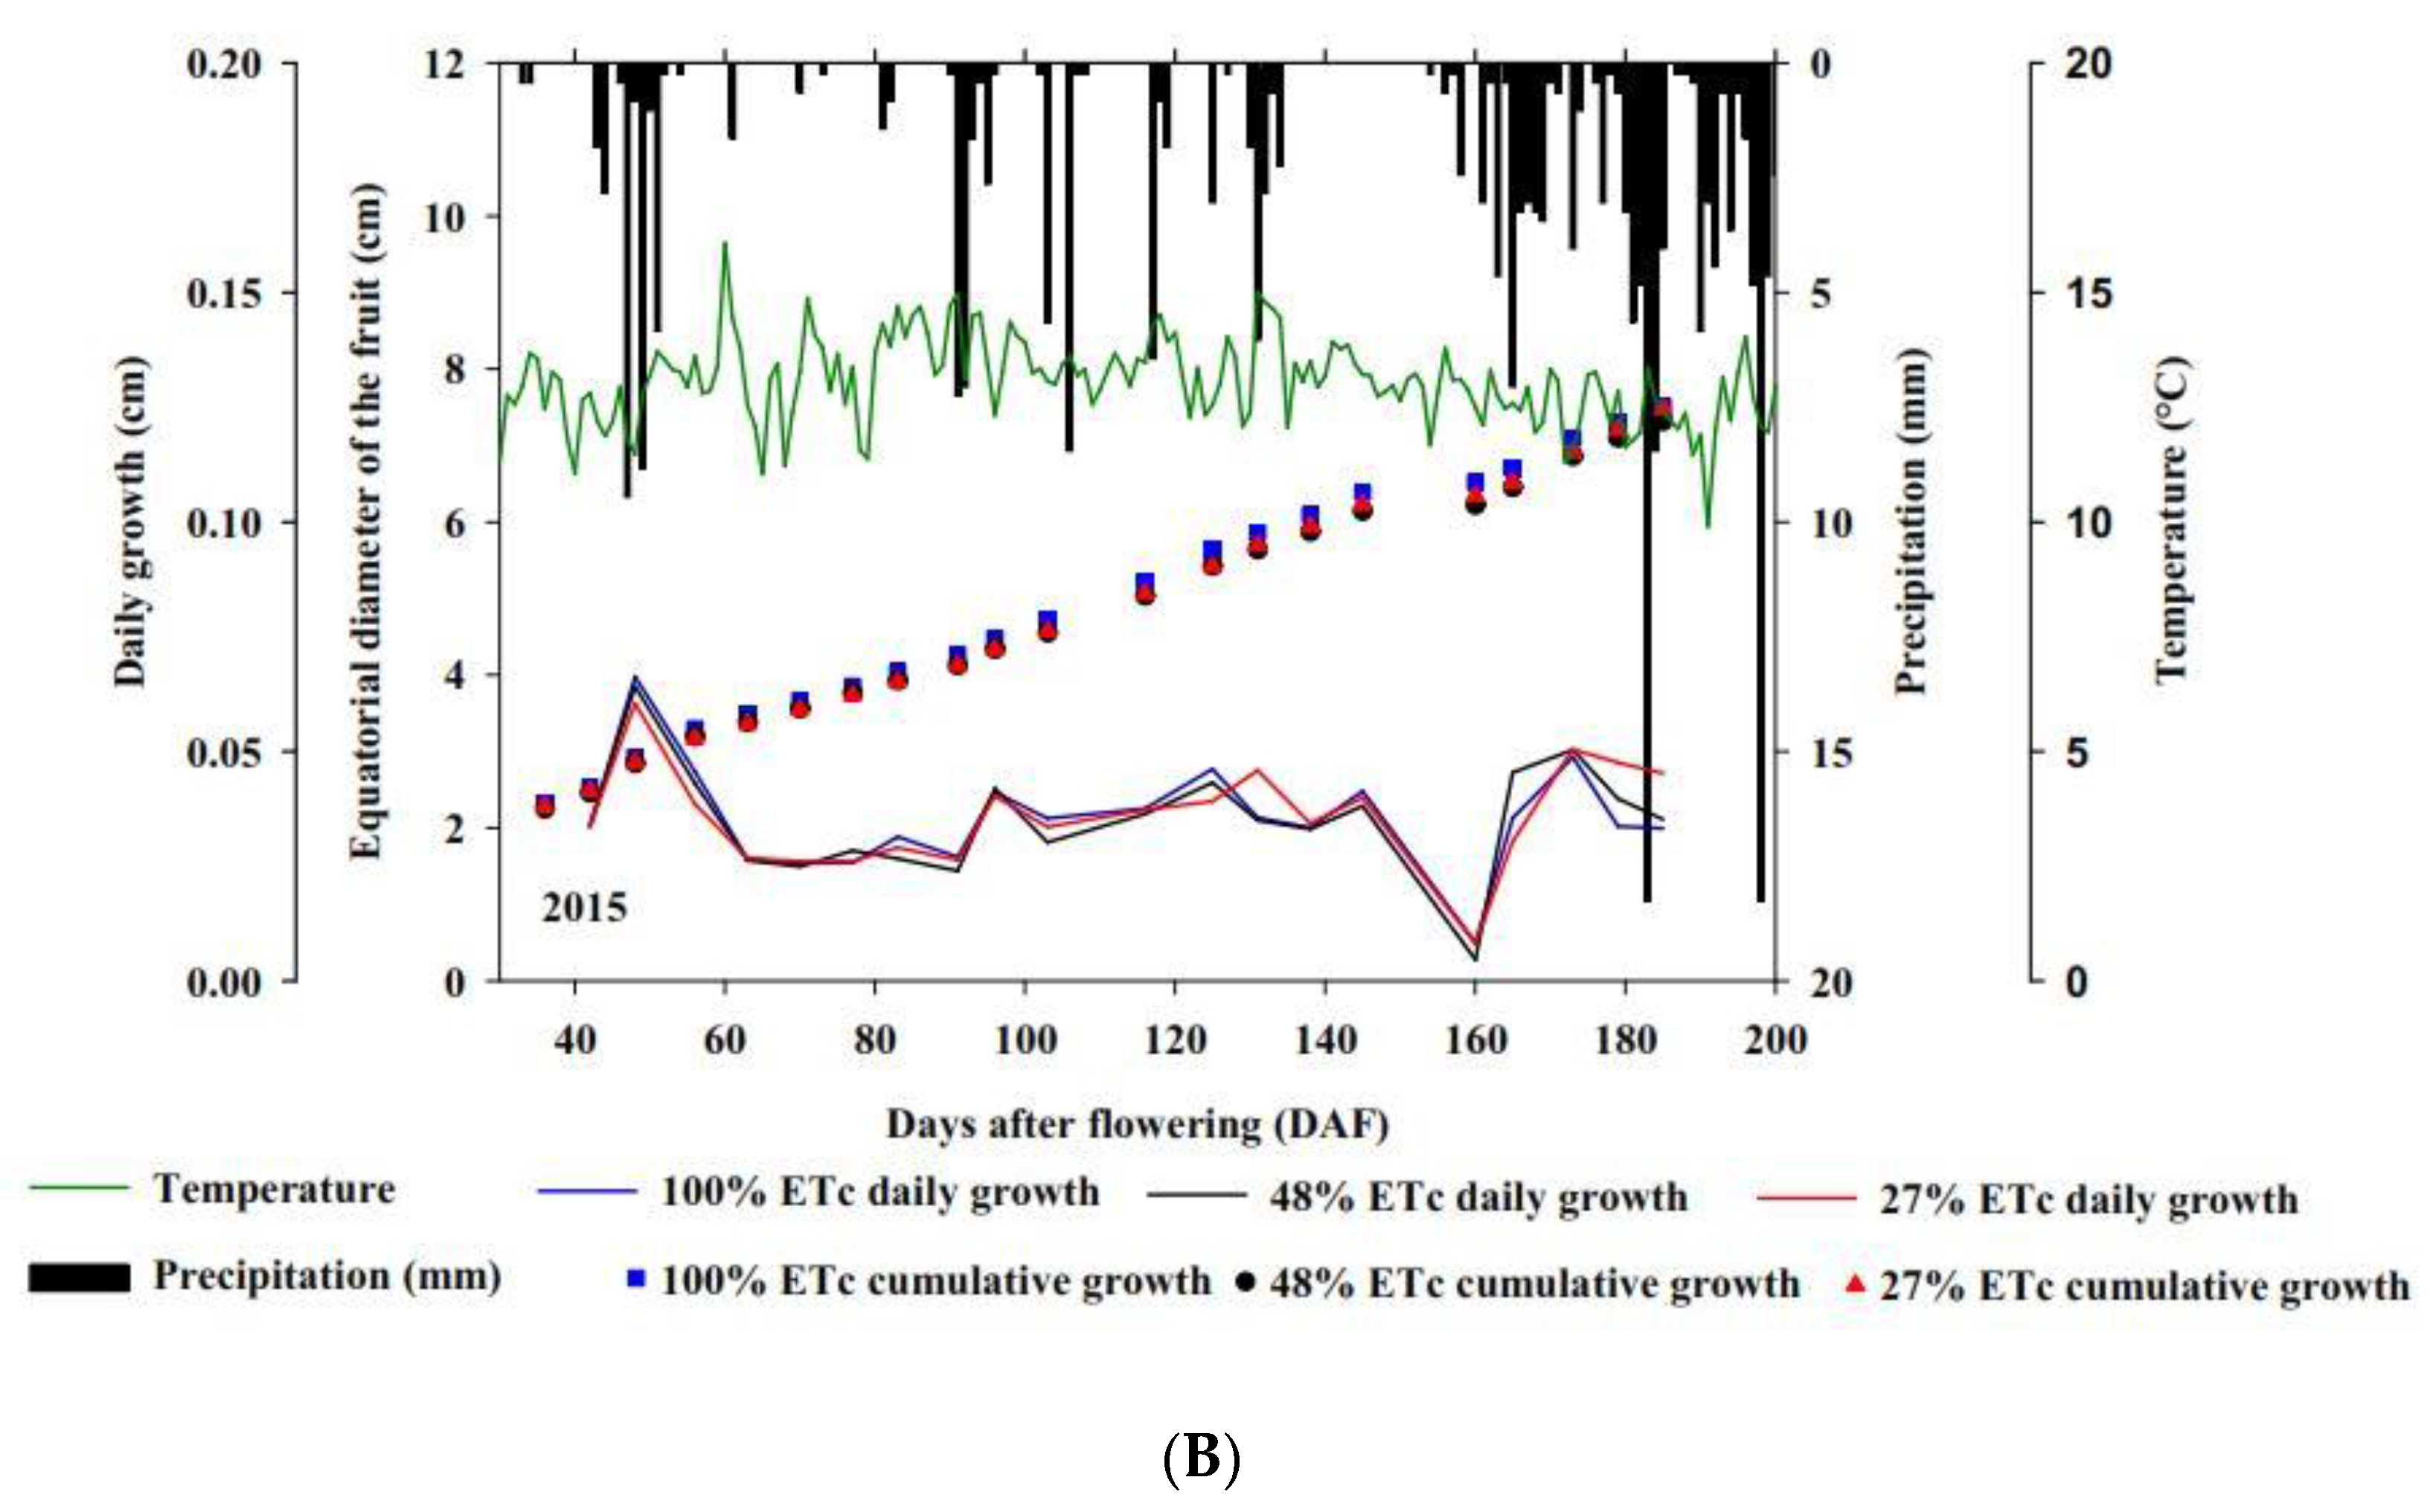
3.2. Fruit Growth Rates

The growth rate of the equatorial diameter of the fruit showed no significant differences between treatments for any of the years evaluated, except for the control (0.05 cm day−1), which was different from the treatment irrigated with 60% of the ETc (0.04 cm day−1) on day 116 DAF in 2015 (Figure 2A,B).

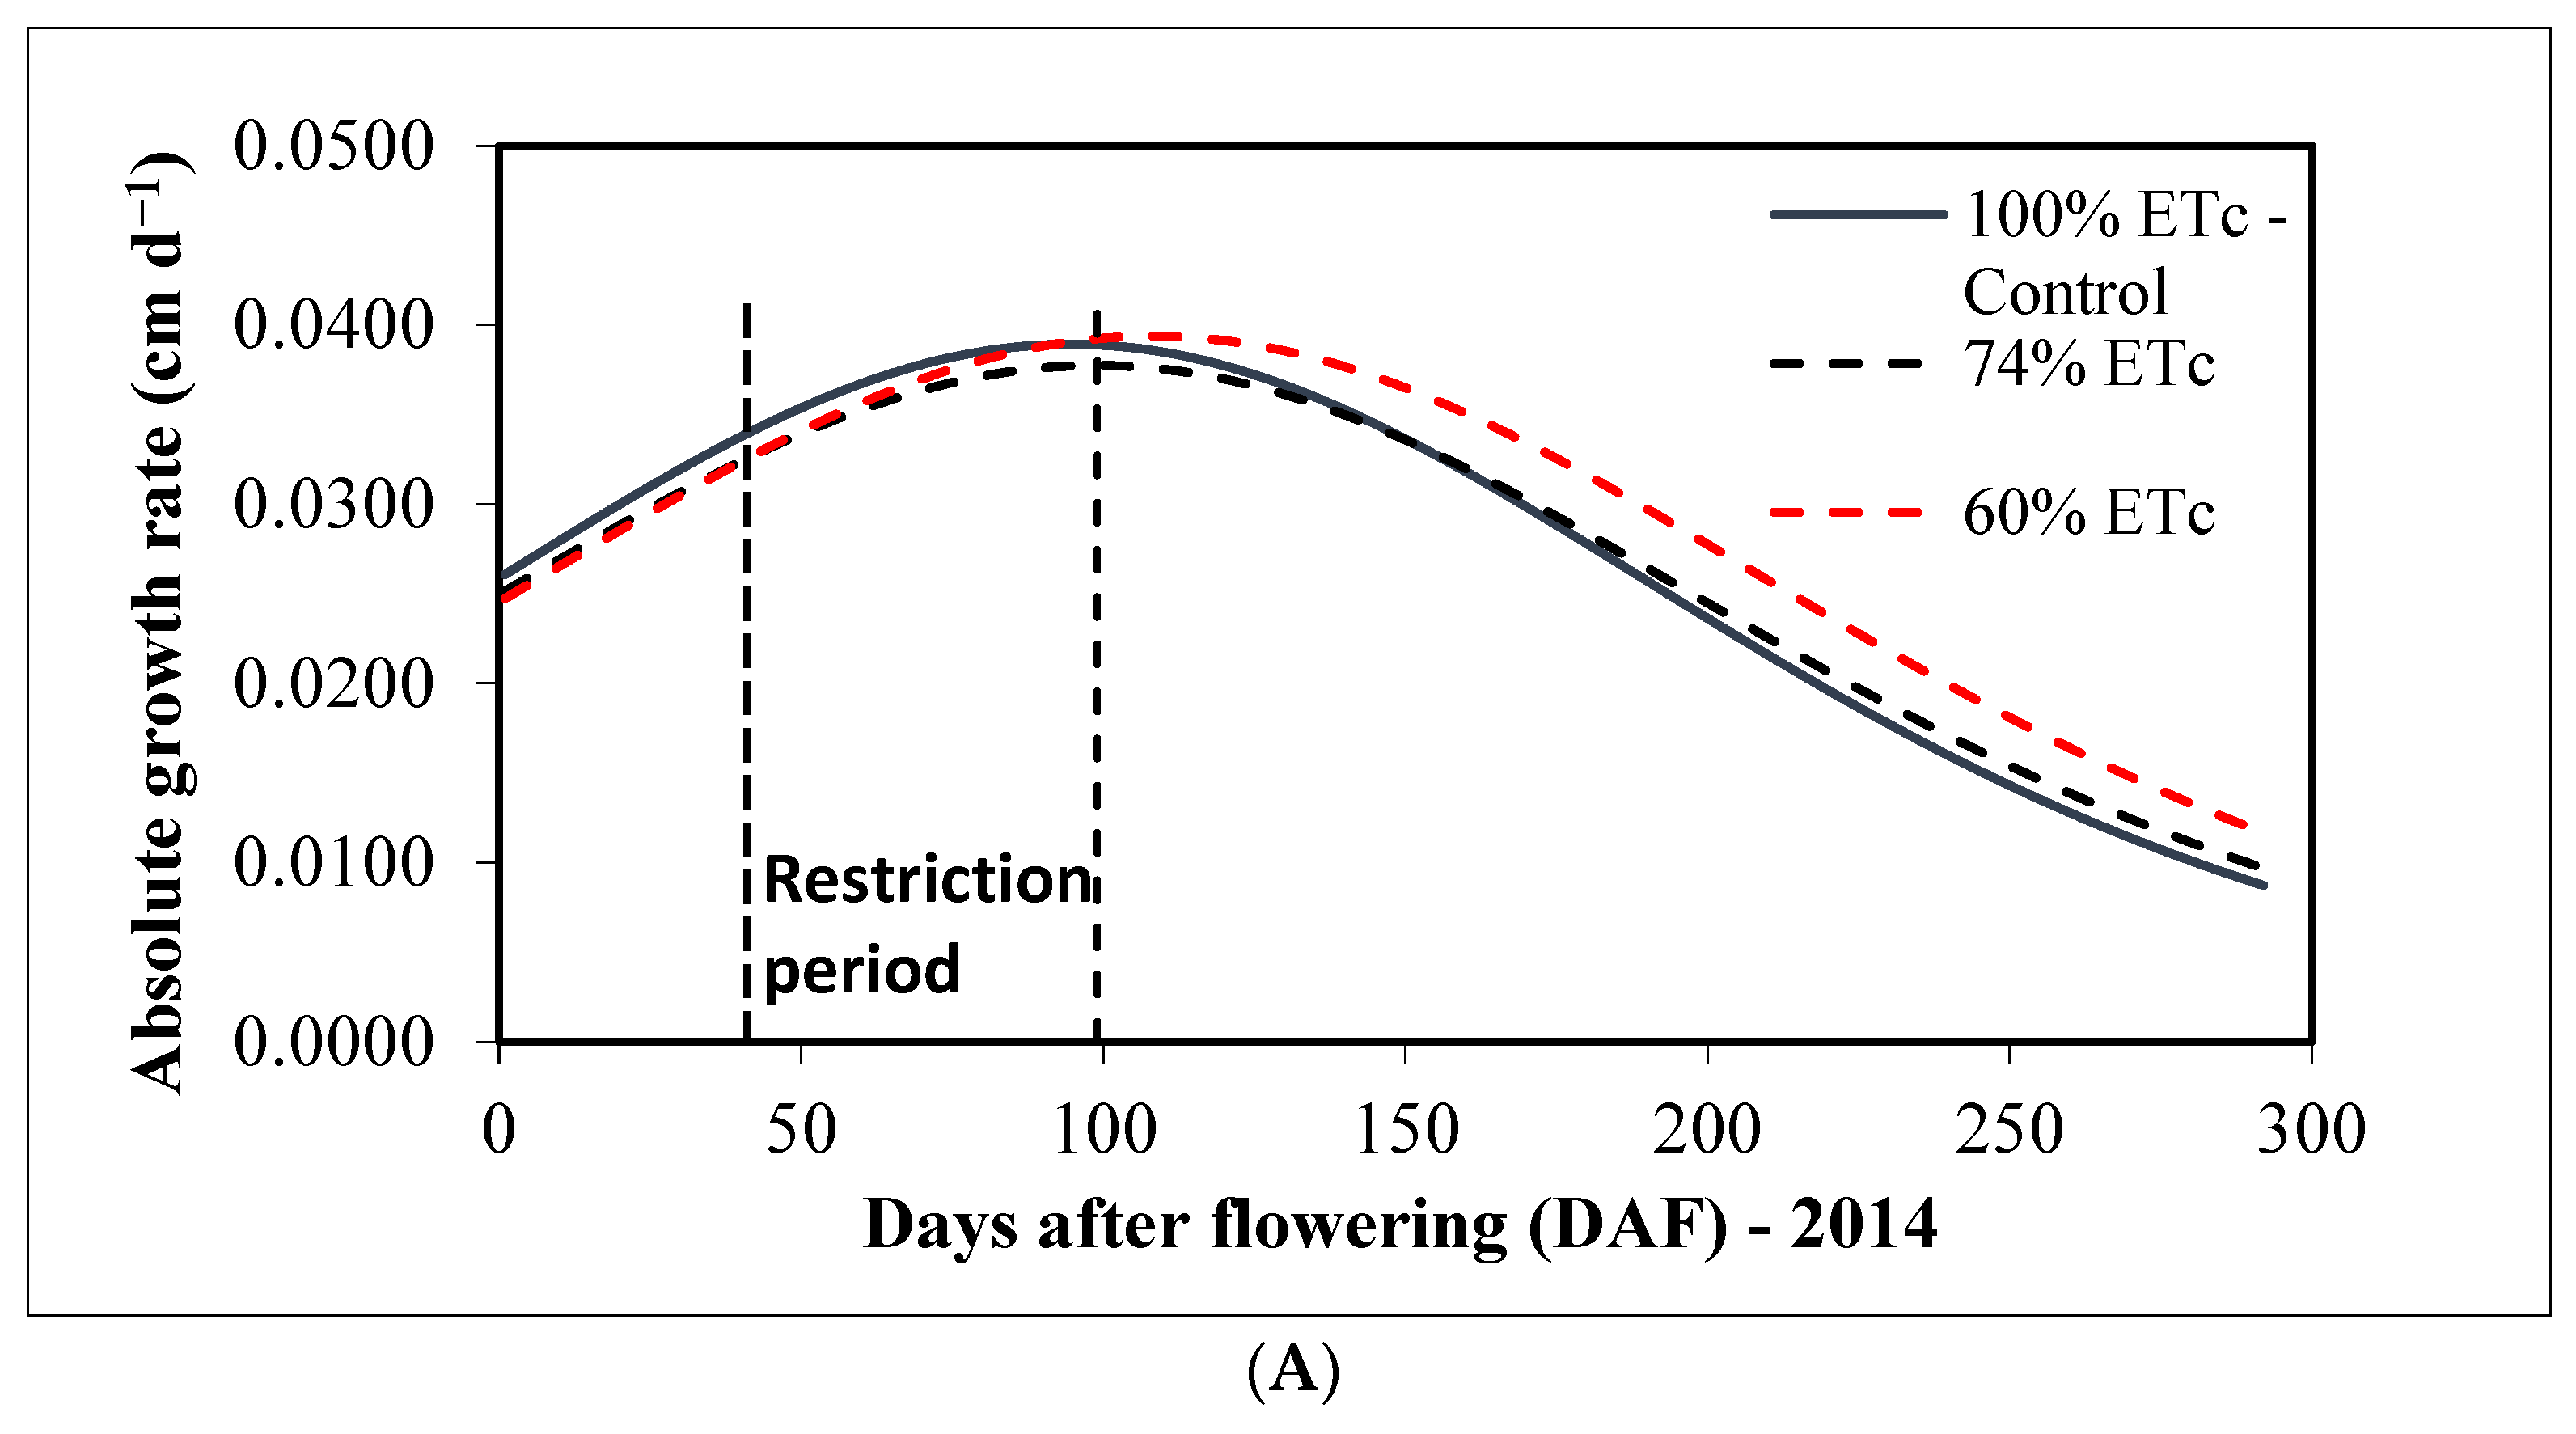
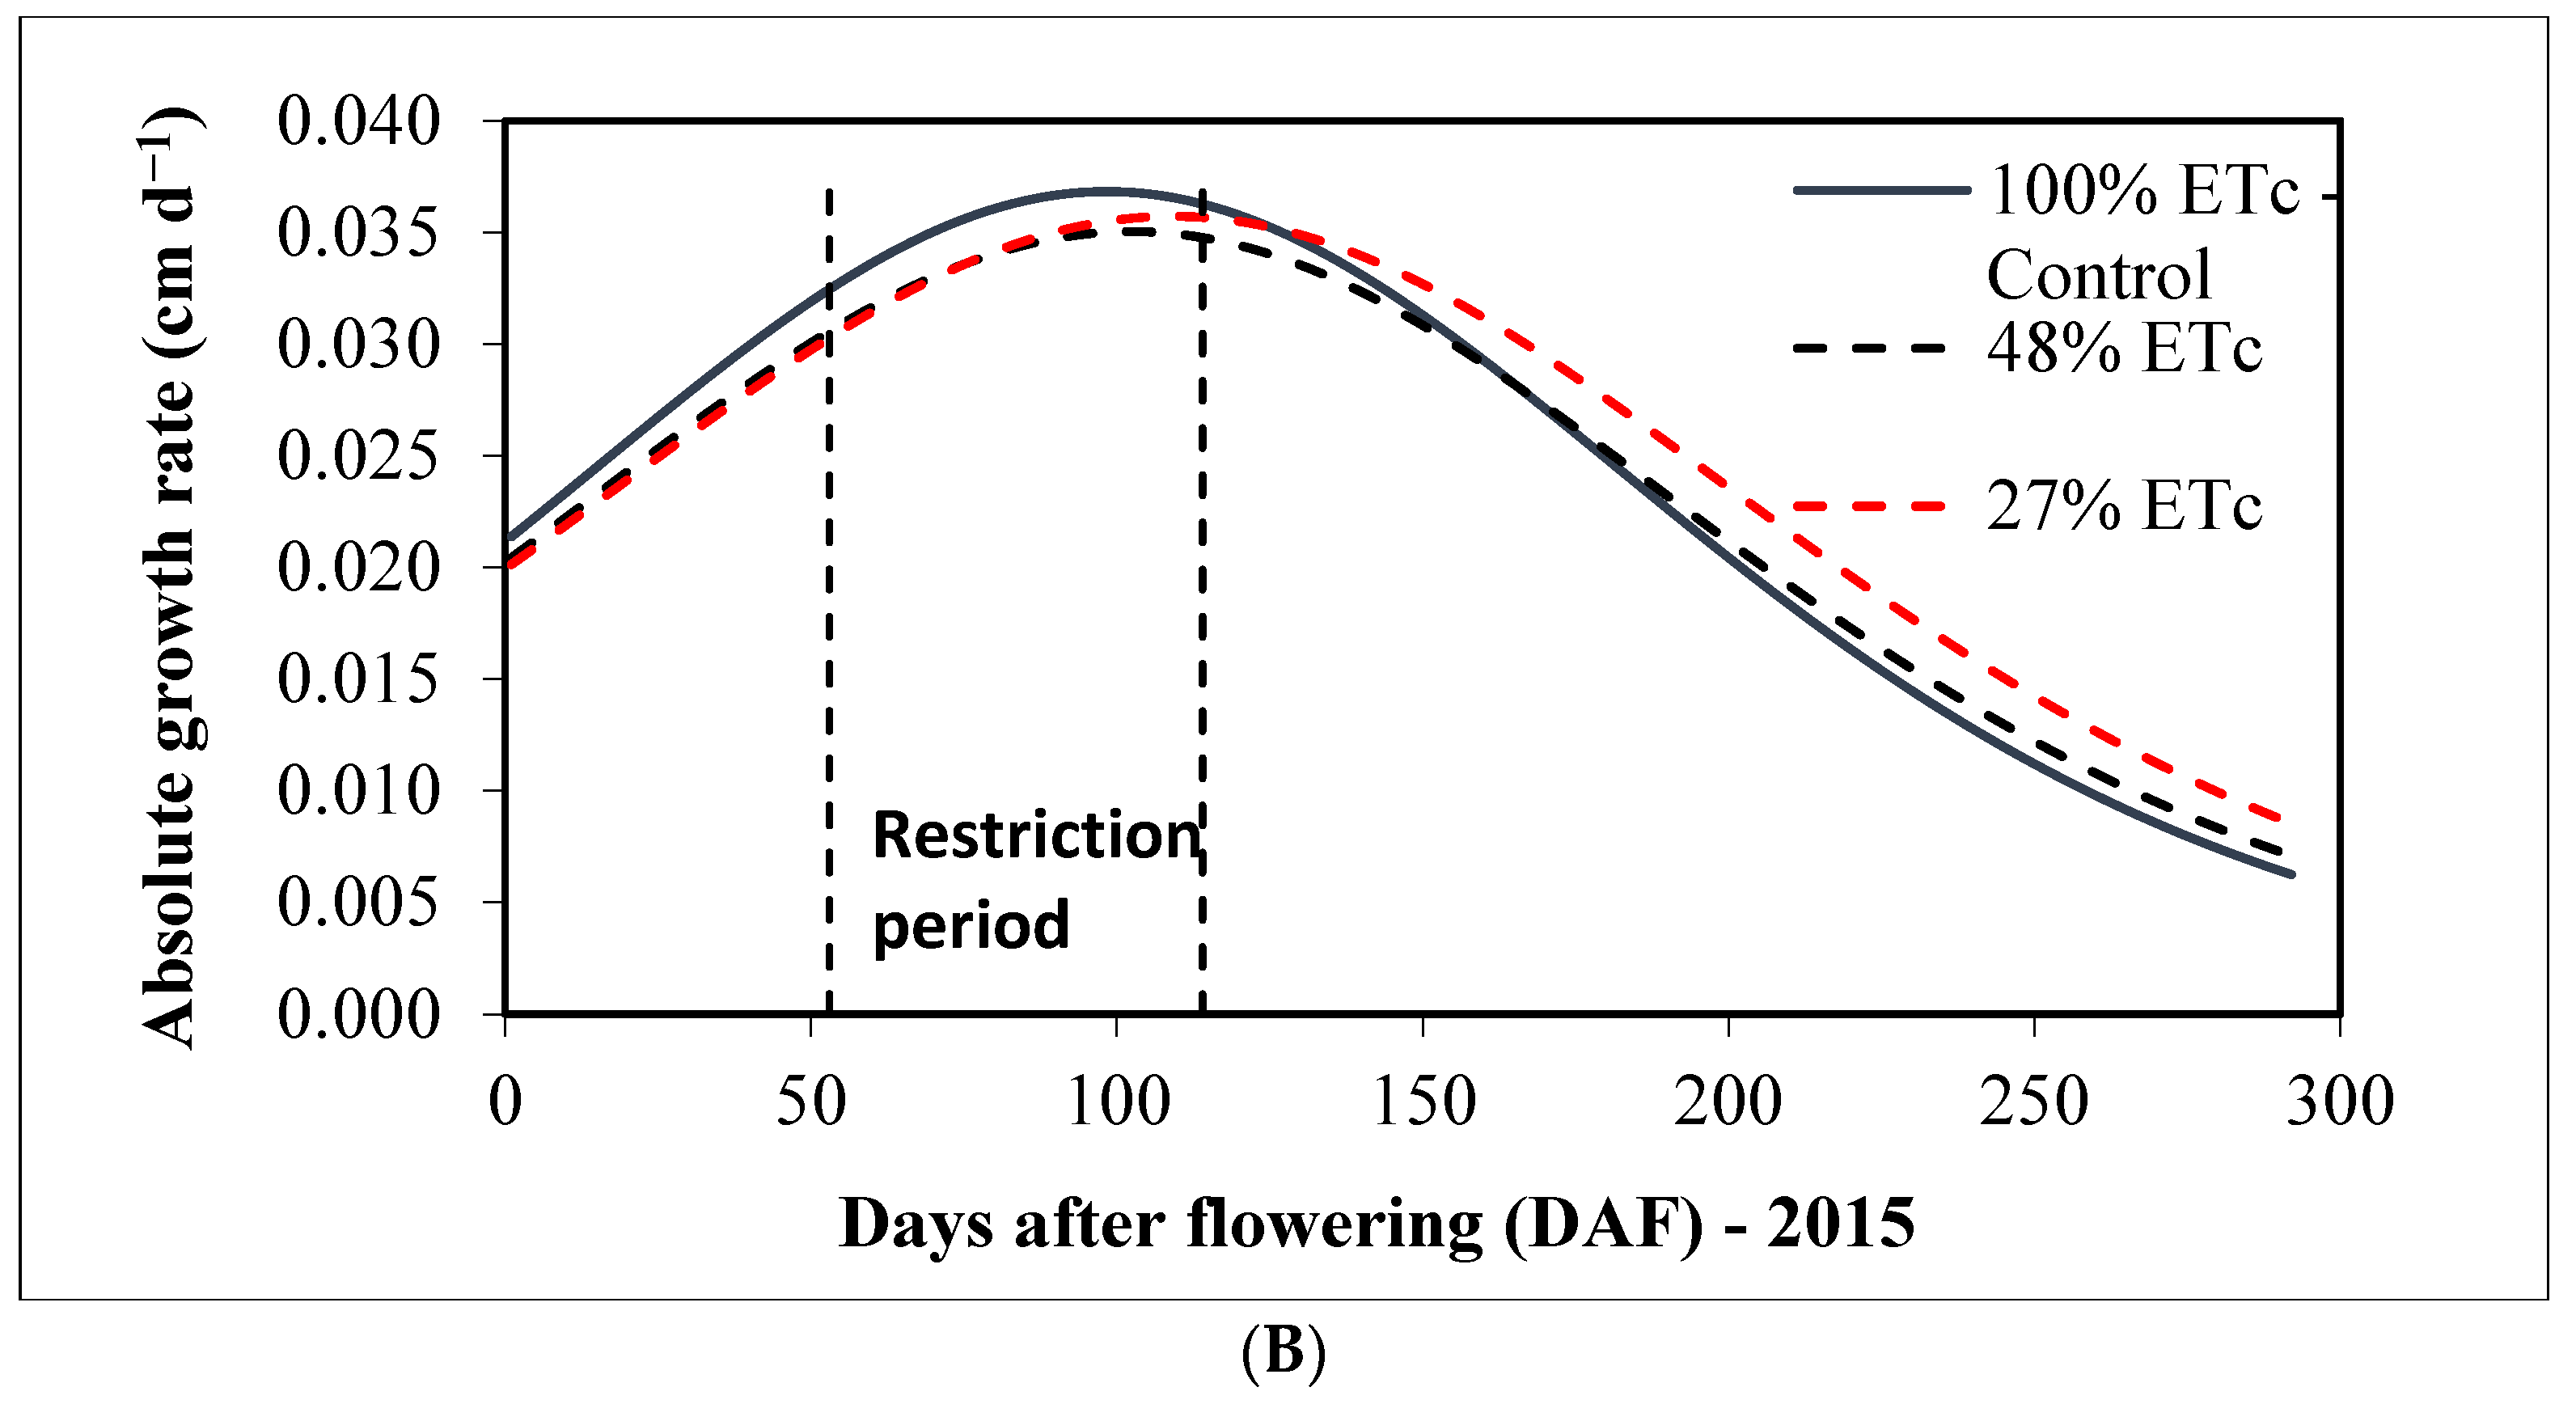
3.2.1. Absolute Growth Rate (AGR) of the Equatorial Fruit Diameter

The maximum values of the AGR for the equatorial diameter of the fruit in 2014 were 0.0389 at 96 DAF, 0.0377 at 101 DAF and 0.0394 cm day−1 at 109 DAF, found in irrigated plants with 100, 74 or 60% of ETc, respectively (Figure 3A). Meanwhile, in 2015, values of 0.0368 at 99 DAF, 0.0350 at 102 DAF and 0.0357 cm day−1 at 110 DAF were recorded (Figure 3B). However, there were no significant differences between treatments, which means that, during the two years, the treatment with water application of 60% of ETc accumulated enough dry mass to achieve the respective compensatory growth once irrigation was resumed. In 2014 and 2015, there were no significant differences in the fresh and dry mass content or in the percentage of dry weight of the fruits between treatments, while there were significant differences between the two years when the plants were irrigated with 100, 48 and 27% of the ETc (Table 1).
Despite this finding, Oliveira et al. [41] mention that apple plants that grow in semi-arid areas commonly have a high rate of transpiration, which can significantly affect their growth until the reproductive stage of the plants. This is due to alterations in the absorption and transport of water, which leads to changes in the water potential of pear plants. As a result, these plants can develop problems such as reductions in the photosynthetic rate and biochemical activity, related to the production of sugars, amino acids and proteins, among other factors.
In pear plants, the monitoring of these adjustments with the availability of water is of the utmost importance since amino acids and proteins are fundamental for the processes of functional and structural formation in plants [10]. Their biosynthesis processes originate from carbon compounds produced by photosynthetic activity. Thus, based on the results obtained in this study, the fact that no statistical difference was found in terms of AGR values is considered important. Therefore, these results corroborate the need to apply an RDI in pear trees under the conditions of the high tropics in order to improve the sustainability of this crop and reduce water consumption.
The figures registered for the AGR of the equatorial diameter of the fruit did not present significant differences between treatments. The AGR values in 2014 were 6% higher in all treatments than the values presented in 2015 at the beginning of the water restriction, 8% higher at the end of water restriction and 28% higher before harvest, due to the lower levels of water applied in 2015. Despite the absence of significant differences in fruit diameter or AGR values in relation to the different irrigation levels, Gomes et al. [10] found that irrigation at 91.8% of ETc promotes the highest yield in pear plants (18.49 kg per plant); in addition, those authors mentioned that both a deficit and an excess of water applied to the plants negatively affected gas exchange, biosynthesis and the accumulation of carbohydrates, amino acids and proteins in the leaves, severely affecting the normal development of the crop cycle in the pear plants.
In the two study years, at the beginning of the treatments, the AGR values of the fruits from the plants that received 100% of the ETc were higher than those that received 74% and 48% of the ETc (Figure 3A,B). At the end of the treatments, the AGR with the application of 60% of the ETc equaled that of the fruits from plants with applications of 100% of the ETc and exceeded that of the plants with applications of 74% ETc. After the resumption of irrigation, and until the end of the crop cycle, the AGR values for the treatments with the application of 100% of the ETc were higher than those with the applications of 74% and 60% of the ETc, which coincided with the effect of higher environmental temperatures, the transfer of reserves and the compensatory growth, as well as the load, which determines the degree of competitiveness between fruits and the final size of the fruit. This can be affirmed because there were no differences between treatments in terms of the number, average weight and production of fruits in the two years evaluated, which is also what was found in other studies on the same variety [17,31] and on clementines by de Nules [35].

3.2.2. Relative Growth Rate (RGR) of the Equatorial Fruit Diameter

Scharwies et al. [42] found that the relative growth rate (RGR) values (calculated by dividing the growth rates by the absolute surface area present at that moment in pear fruits) in the Conference and Condo cultivars g−rown in Germany were highest during early development and then decreased continuously. On the other hand, in the present work, the equatorial diameter of the fruit showed a rapid decrease at the beginning and then gradually decreased throughout the development period; in addition, there were no significant differences between treatments for the two years evaluated (Table 3). The differences between the shape of the dynamics of the RGR curves observed by Scharwies et al. [42] and the one found in the current work were due to the fact that the shape of the fruit and the relative growth rates in the ‘Conference’ and ‘Condo’ fruits are very similar to each other, while the shape of the ‘Triunfo de Viena’ fruit is different, so the dynamics of the RGR curve are different from those of the Conference and Condo cultivars.
From the beginning to the end of the treatments, the RGR of the fruit was higher in the treatments with the application of 100% of the ETc than in the treatments that received less water. For the two years of the evaluation, once 100% irrigation was resumed, and until the end of the harvest cycle, fruits treated with the application of 60% or 27% of the ETc, in 2014 and 2015, respectively, presented higher RGR values than those treated with 74% or 48% ETc and the fruits with the control treatment, which is consistent with what has been reported previously for the same variety [31,36] (Figure 4).

3.2.3. Fruit and Stem Water Potential

In 2014, the water potential of the fruit at dawn (Ψfd) began to decrease as the treatments were applied, and it then increased after the supply of water from the rain; however, there were no significant differences between treatments. The value of Ψfd remained constant, with figures of −0.52, −0.51 and −0.51 MPa, for applications of 100, 74 and 60% ETc, respectively, at the moment of maximum stress.
Despite the fact that the water potential of the fruit at solar noon (Ψfn) did not show significant differences between treatments, it decreased as the treatments were applied, and then increased and remained constant once precipitation occurred. At the moment of maximum stress, the Ψfn had values of −1.33, −1.37 and −1.49 MPa at applications of 100, 74 and 60% ETc, respectively. This indicated greater variation and allowed us to affirm that this factor was more negative in the treatments with higher water deficit. These values were 2.32, 2.42 and 2.33 times higher than the water potential of the leaf at dawn (Ψld) and 2.31, 2.15 and 2.23 times higher than the water potential of the leaf at solar noon (Ψln), respectively, as was also found by [43]. This allowed us to infer that Ψfd may be less sensitive to environmental conditions than Ψs, possibly because fruits are organs composed of different types of tissues and the movement of water through them takes place mainly via non-vascular pathways [42], while (Ψs) is more sensitive to changes in water availability in the soil, which makes it a good parameter for irrigation scheduling [44].
The Ψfd and Ψfn presented values that reflected the water levels in the soil, both at the beginning of the application of the treatments and when precipitation and irrigation events occurred. In the same way, it was proven that the values of Ψfd and Ψfn were lower than those of Ψfd because the fruits presented, at all times, a higher proportion of water than the leaves and the stem. Table 4 shows the average fluctuations in water potentials for the year 2014.

4. Conclusions

Through the results obtained, it was possible to observe that the RDI, applied during the rapid growth phase of the fruit, had only a slight impact on the growth and production of the pear trees; although the fruits of plants subjected to RDI presented slightly smaller fruits in relation to those of the control plants, no statistically significant differences were found between the treatments. Additionally, when 60% of the ETc was applied, the fruits showed a higher percentage of dry weight, while with 27% of the ETc a lower percentage of dry weight was found, although without significant statistical differences in any of the cases from the plants to which 100 and 48% of the ETc were applied.
In 2014, the highest values recorded for the equatorial diameter variable occurred at 154 DAF when the trees received 100, 74 and 60% of the ETc, while in 2015 this maximum value occurred at 161 DAF with rates of irrigation of 100, 48 and 27% of the ETc, without significant statistical differences. In 2014, the maximum values recorded for the equatorial diameter at 154 DAF, when 100, 74 and 60% of the ETc were applied to the trees, were 7.75, 7.59 and 7.70 cm, respectively, while in 2015, at 161 DAF, values of 6.78, 6.55 and 6.63 cm were achieved when the plants were subjected to irrigation of 100, 48 and 27% of the ETc, respectively, without presenting significant statistical differences. In the same way, although without statistical differences between the treatments, the values registered for the AGR of the equatorial diameter of the fruit in 2014 were 0.0389 at 96 DAF, 0.0377 at 101 DAF and 0.0394 cm day−1 at 109 DAF. These values were obtained for trees in which 100, 74 or 60% of ETc was applied, respectively, while in 2015 the values for this variable were 0.0368 at 99 DAF, 0.0350 at 102 DAF and 0.0357 cm day−1 at 110 DAF. These findings indicate that, during the two years that the evaluation lasted, the treatment with water application at 60% of ETc accumulated enough dry mass to achieve sufficient compensatory growth once irrigation was resumed.
With regard to the water potential values, it was found that, in 2014, the value of this variable recorded in the fruit at dawn (Ψfd) gradually decreased as the irrigation treatments were applied and then increased after the onset of rain, although without significant statistical differences between the plants treated with the different irrigation rates. In this sense, the value of Ψfd remained constant and figures of −0.52, −0.51 and −0.51 MPa were found for applications of 100, 74 or 60% ETc, respectively, at the moment of maximum stress.
Based on these results, it was possible to verify that the implementation of this methodology allowed a decrease in the use of water for irrigation to be achieved in ranges of 26% to 40% and 52% to 73% in the two periods that the evaluation lasted. These results are a significant contribution to the sustainable production of pear trees in the conditions of the high-altitude tropics, and more generally, since agriculture everywhere must face the challenges posed by scarce availability of water and the high costs of the services provided in the irrigation districts. These force farmers to modify their production systems by implementing new methodologies for economically profitable fruit production that use reduced amounts of water for their crops while having minimal impact on the growth of the fruits and on the yield of the plants.

Author Contributions

Conceptualization, J.V.-S., G.F. and F.C.-P.; methodology, J.V.-S.; formal analysis, J.V.-S. and F.C.-P.; investigation, J.V.-S.; resources, J.V.-S.; data curation, J.V.-S., F.C.-P. and G.F.; writing—original draft preparation, J.V.-S. and G.F.; writing—review and editing, J.V.-S., F.C.-P. and G.F.; visualization, F.C.-P.; supervision, J.V.-S., F.C.-P. and G.F. All authors have read and agreed to the published version of the manuscript.

Funding

This research was co-sponsored by the Universidad Nacional de Colombia, Bogotá, and the Universidad Pedagógica y Tecnológica de Colombia, Tunja, Colombia.

Institutional Review Board Statement

Not applicable.

Informed Consent Statement

Not applicable.

Data Availability Statement

The data presented in this study are available on request.

Conflicts of Interest

The authors declare no conflict of interest.

References

  1. Konefal, J.; de Olde, E.M.; Hatanaka, M.; Oosterveer, P.J.M. Signs of agricultural sustainability: A global assessment of sustainability governance initiatives and their indicators in crop farming. Agric. Syst. 2023, 208, 103658. [Google Scholar] [CrossRef]
  2. Chartzoulakis, K.; Bertaki, M. Sustainable water management in agriculture under climate change. Agric. Agric. Sci. Procedia 2015, 4, 88–98. [Google Scholar] [CrossRef]
  3. Chai, Q.; Gan, Y.; Zhao, C.; Xu, H.-L.; Waskom, R.M.; Niu, Y.; Siddique, K.H.M. Regulated deficit irrigation for crop production under drought stress. A review. Agron. Sustain. Dev. 2016, 36, 3. [Google Scholar] [CrossRef]
  4. Benavides, H.O.; Simbaqueva, O.; Zapata, H.J. Atlas de Radiación Solar, Ultravioleta y Ozono de Colombia; Instituto de Hidrología, Meteorología y Estudios Ambientales (IDEAM): Bogota, Colombia, 2017; Available online: https://www.andi.com.co//Uploads/RADIACION.compressed.pdf (accessed on 17 June 2023).
  5. Yang, B.; Fu, P.; Lu, J.; Ma, F.; Sun, X.; Fang, Y. Regulated deficit irrigation: An effective way to solve the shortage of agricultural water for horticulture. Stress Biol. 2022, 2, 28. [Google Scholar] [CrossRef]
  6. Sotiropoulos, T.; Kalfountzos, D.; Aleksiou, I.; Kotsopoulos, S.; Koutinas, N. Response of a clingstone peach cultivar to regulated deficit irrigation. Sci. Agric. 2010, 67, 164–169. [Google Scholar] [CrossRef]
  7. Molina-Ochoa, M.J.; Vélez-Sánchez, J.E.; Rodríguez, P. Effect of regulated deficit irrigation on tree growth of pear cv. Triunfo de Viena. Agron. Colomb. 2015, 33, 330–338. [Google Scholar] [CrossRef]
  8. Salazar, C.; Hernández, C.; Pino, M.T. Plant water stress: Associations between ethylene and abscisic acid response. Chil. J. Agric. Res. 2015, 75 (Suppl. S1), 71–79. [Google Scholar] [CrossRef]
  9. Morandi, B.; Losciale, P.; Manfrini, L.; Zibordi, M.; Anconelli, S.; Galli, F.; Pierpaoli, E.; Corelli, L. Increasing water stress negatively effects pear fruit growth by reducing first its xylem and then its phloem inflow. J. Plant Physiol. 2014, 171, 1500–1509. [Google Scholar] [CrossRef]
  10. Gomes, V.H.F.; Simões, W.L.; da Silva, J.S.; Garrido, M.d.S.; da Silva, J.A.B.; Lopes, P.R.C.; da Silva, W.O.; dos Santos, L.R. Production, gas and biochemical exchanges in pear cultivated in semi-arid region under different irrigation managements. Braz. J. Agric. Environ. Eng. 2023, 27, 335–342. [Google Scholar] [CrossRef]
  11. Osakabe, Y.; Osakabe, K.; Shinozaki, K.; Tran, L.S.P. Response of plants to water stress. Front. Plant Sci. 2014, 5, 86. [Google Scholar] [CrossRef] [PubMed]
  12. Gasque, M.; Granero, B.; Turegano, J.V.; González-Altozano, P. Regulated deficit irrigation effects on yield, fruit quality and vegetative growth of “Navelina” citrus trees. Span. J. Agric. Res. 2010, 8, 40–51. [Google Scholar] [CrossRef]
  13. Vélez, J.; Intrigliolo, D.S.; Castel, J.R. Programación de riego en cítricos en base a sensores de medida del estado hídrico del suelo y de la planta. Rev. UDCA Act. Div. Cient. 2012, 14, 65–73. [Google Scholar] [CrossRef]
  14. Intrigliolo, D.S.; Castel, J.R. Performance of various water stress indicators for prediction of fruit size response to deficit irrigation in plum. Agric. Water Manag. 2006, 83, 173–180. [Google Scholar] [CrossRef]
  15. Vélez, J.; Álvarez-Herrera, J. Riego en Frutales. In Manual Para el Cultivo de Frutales en el Trópico; Fischer, G., Ed.; Editorial Produmedios: Bogota, Colombia, 2012; pp. 186–214. [Google Scholar]
  16. López, G.; Larrigaudiére, C.; Girona, J.; Behboudian, M.H.; Marsal, J. Fruit thinning in ‘Conference’ pear grown under deficit irrigation: Implications for fruit quality at harvest and after cold storage. Sci. Hortic. 2011, 129, 64–70. [Google Scholar] [CrossRef]
  17. Vélez, J.; Balaguera, H.; Álvarez, J. Effect of regulated deficit irrigation (RDI) on the production and quality of pear Triunfo de Viena variety under tropical conditions. Sci. Hortic. 2021, 278, 109880. [Google Scholar] [CrossRef]
  18. Campos, T.J. Especies y variedades de hoja caduca en Colombia. In Los Frutales Caducifolios en Colombia; Miranda, D., Fischer, G., Carranza, C., Eds.; Sociedad Colombiana de Ciencias Hortícolas: Bogota, Colombia, 2013; pp. 47–65. [Google Scholar]
  19. Casierra-Posada, F. Manzano y peral (Malus domestica Borkh.)–(Pyrus communis L.). In Manual Para el Cultivo de Frutales en el Trópico; Fischer, G., Ed.; Produmedios: Bogota, Colombia, 2012; pp. 657–681. [Google Scholar]
  20. Agronet. Área, Producción y Rendimiento Nacional por Cultivo. Available online: https://agronet.gov.co/estadistica/Paginas/home.aspx?cod=1 (accessed on 17 August 2023).
  21. Fernandes de Oliveira, A.; Mameli, M.G.; De Pau, L.; Satta, D. Almond tree adaptation to water stress: Differences in physiological performance and yield responses among four cultivars grown in Mediterranean environment. Plants 2023, 12, 1131. [Google Scholar] [CrossRef] [PubMed]
  22. Instituto Geográfico Agustín Codazzi (IGAC). Clasificación de Suelos en el Departamento de Cundinamarca; Departamento Nacional de Estadística, subdirección de Agrología and Universidad Tecnológico y Pedagógica de Colombia: Bogota, Colombia, 2010; Volume 169, pp. 325–327. [Google Scholar]
  23. Allen, R.G.; Pereira, L.S.; Raes, D.; Smith, M. Crop Evapotranspiration, Guidelines for Computing Crop Water Requirements-FAO Irrigation and Drainage Paper 56; FAO: Rome, Italy, 1998. [Google Scholar]
  24. Cleves-Leguizamo, J.A.; Toro-Calderón, J.; Martínez-Bernal, L. Los balances hídricos agrícolas en modelos de simulación agroclimáticos. Una revisión analítica. Rev. Colomb. Cienc. Hortic. 2016, 10, 149–163. [Google Scholar] [CrossRef]
  25. Doorenbos, J.; Pruitt, W. Las Necesidades de Agua de los Cultivos; Estudio FAO Riego y Drenaje 24; FAO: Rome, Italy, 1986. [Google Scholar]
  26. Scholander, P.F.; Hammel, H.T.; Bradstreet, E.D.; Hemmingsen, E.A. Sap presure in vascular plants. Science 1965, 184, 339–346. [Google Scholar] [CrossRef] [PubMed]
  27. Hsiao, T.C. Measurements of plant water status. In Irrigation of Agricultural Crops; Steward, B.A., Nielsen, D.R., Eds.; American Society of Agronomy: Madison, WI, USA, 1990; pp. 243–279. [Google Scholar]
  28. Marsal, J.; López, G.; Mata, M.; Girona, J. Postharvest deficit irrigation in “Conference” pear: Effects on subsequent yield and fruit quality. Agric. Water Manag. 2012, 103, 1–7. [Google Scholar] [CrossRef]
  29. Molina-Ochoa, M.J.; Vélez, J.E.; Galindo, A. Resultados preliminares del efecto del riego deficitario durante el periodo de crecimiento rápido del fruto de pera (var. Triunfo de Viena) en la producción y calidad del fruto. Rev. Colomb. Cienc. Hortic. 2015, 9, 38–45. [Google Scholar] [CrossRef]
  30. Zhao, Z.; Wang, W.; Wu, Y.; Xu, M.; Huang, X.; Ma, Y.; Ren, D. Leaf physiological responses of mature pear trees to regulated deficit irrigation in field conditions under desert climate. Sci. Hortic. 2015, 187, 122–130. [Google Scholar] [CrossRef]
  31. Díaz, D.; Vélez, J.; Rodríguez, P. Efecto de la aplicación de riego controlado en la producción y calidad del fruto de Pyrus communis L., cv. Triunfo de Viena. Acta Agron. 2016, 65, 156–163. [Google Scholar] [CrossRef]
  32. Vélez, J.; Polania, W.; Beltrán, N. Effect of irrigation regime on the production of volatiles that affect the aroma of the pear variety Triumph of Vienna (Pyrus communis L.). Rev. Colomb. Cienc. Hortic. 2019, 13, 348–358. [Google Scholar] [CrossRef]
  33. Goldhamer, D.A. Regulated deficit irrigation in trees and vines. In Agricultural Water Management, Proceedings of a Workshop in Tunisia; The National Academies Press: Washington, DC, USA, 2007; pp. 70–80. [Google Scholar] [CrossRef]
  34. Ningbo, C.; Taisheng, D.; Shaozhong, K.; Fusheng, L.; Jianhua, Z.; Mixia, W.; Zhijun, L. Regulated deficit irrigation improved fruit quality and water use efficiency of pear-jujube trees. Agric. Water Manag. 2008, 95, 489–497. [Google Scholar] [CrossRef]
  35. Vélez, J.; Intrigliolo, D.S.; Castel, J.R. Scheduling deficit irrigation of citrus trees with maximum daily trunk shrinkage. Agric. Water Manag. 2007, 90, 197–204. [Google Scholar] [CrossRef]
  36. Molina-Ochoa, M.J.; Vélez, J.E.; Rodríguez, P. Efecto del riego deficitario controlado en las tasas de crecimiento del fruto de pera (Pyrus communis L.) var. Triunfo de Viena. Rev. Colomb. Cienc. Hortic. 2015, 9, 234–246. [Google Scholar] [CrossRef]
  37. Chalmers, D.J.; Burge, G.; Jerie, P.H.; Mitchell, P.D. The mechanism of regulation of ‘Bartlett’ pear fruit and vegetative growth by irrigation withholding and regulated deficit irrigation. J. Am. Soc. Hortic. Sci. 1986, 111, 904–907. [Google Scholar] [CrossRef]
  38. Garriz, P.I.; Colavita, G.M.; Alvarez, H.L.; Spera, N.; Blackhall, V. A model for predicting diameter of ‘Red Sensation’ pears. Acta Hortic. 2015, 1068, 147–152. [Google Scholar] [CrossRef]
  39. Ribeiro, T.D.; Savian, T.V.; Fernandes, T.J.; Muniz, J.A. The use of the nonlinear models in the growth of pears of ‘Shinseiki’ cultivar. Ciência Rural 2018, 48, 1–7. [Google Scholar] [CrossRef]
  40. Pérez-Pastor, A.; Ruiz-Sánchez, M.C.; Domingo, R. Effects of timing and intensity of deficit irrigation on vegetative and fruit growth of apricot trees. Agric. Water Manag. 2014, 134, 110–118. [Google Scholar] [CrossRef]
  41. de Oliveira, C.M.; Simões, W.L.; Lopes, P.R.C.; da Silva, J.B.; Araujo, E.F.; Cavalcante, B.L.S. Flowering, fruiting and physiology of apple tree under different irrigation levels in the Brazilian semiarid region. Comun. Sci. 2017, 8, 99–108. [Google Scholar] [CrossRef]
  42. Scharwies, J.D.; Grimm, E.; Knoche, M. Russeting and relative growth rate are positively related in ‘Conference’ and ‘Condo’ Pear. HortScience 2014, 49, 746–749. [Google Scholar] [CrossRef]
  43. Dell’Amico, J.; Domingo, R.; Pérez, M.; García, M.; Peñalver, M.; Villanueva, F.; Puerto, P. Water relations and ion content of mandarin plants cv ‘Fortune’ within a drought and recovery cycle of the fast fruit growth stage. Cult. Trop. 2011, 32, 30–41. [Google Scholar]
  44. Vélez, J.; Balaguera, H.; Rodríguez, P. The water status of pear (Pyrus communis L.) under application of regulated deficit irrigation in high tropical latitudinal conditions. J. Saudi Soc. Agric. Sci. 2022, 21, 460–468. [Google Scholar] [CrossRef]
Figure 1. Sigmoid logistic model of the growth dynamics of the equatorial diameter of the fruit in 2014 (A) and 2015 (B). n = 96 fruits.
Sustainability 15 13392 g001
Figure 2. Evolution of the equatorial diameter, daily growth of the fruits, temperature and precipitation in 2014 (A) and 2015 (B). The values correspond to the mean of 96 fruits.
Sustainability 15 13392 g002aSustainability 15 13392 g002b
Figure 3. Absolute growth rate (AGR) of the equatorial diameter of the fruit in 2014 (A) and 2015 (B). n = 96 fruits.
Sustainability 15 13392 g003aSustainability 15 13392 g003b
Figure 4. Relative growth rate (RGR) of the fruit in 2014 (A) and 2015 (B). n = 96 fruits.
Sustainability 15 13392 g004
Table 1. Gravimetric values recorded in ‘Triunfo de Viena’ pear fruits subjected to regulated deficit irrigation.
YearTreatmentFresh Weight (g)Dry Weight (g)Dry Weight (%)
2014100% ETc291.93 a (LSD 44.80)37.52 a (LSD 5.31)12.85 a (LSD 1.30)
74% ETc305.36 a38.88 a12.73 a
60% ETc267.04 a34.88 a13.06 a
2015100% ETc167.99 a * (LSD 21.13)26.64 a * (LSD 2.79)15.86 a * (LSD 2.19)
48% ETc173.18 a *25.67 a *14.82 a *
27% ETc163.74 a * (LSD* 19.88)24.02 a * (LSD* 2.40)14.67 a * (LSD* 1.01)
n = 320 fruits in 2014 and 480 in 2015. Values for the same year and in the same column that are followed by the same letter did not present significant differences according to Tukey’s test (p < 0.05); values in the same column followed by * were different between years. LSD* (2014–2015).
Table 2. Production parameters of pear trees subjected to different irrigation treatments.
YearTreatmentProduction
(kg/tree)
Average Fruit Weight 1 (g)Number of Fruits per TreeNumber of
Fruits Category I 2
Number of Fruits Category
II 3
Number of Fruits Category
III 4
2014100% ETc275.05 a
(LSD 181.54)
215.07 a
(LSD 35.22)
1267 a
(LSD 701.87)
444 a
(LSD 262.92)
478 a
(LSD 282.3)
345 a
(LSD 189.18)
74% ETc240.35 a210.32 a1135 a424 a433 a278 a
60% ETc272.76 a244.16 a1094 a401 a384 a309 a
2015100% ETc194.45 a *
(LSD 79.34)
176.54 a *
(LSD 22.90)
1111 a
(LSD 486.36)
545 a
(LSD 298.78)
407 a
(LSD 182.14)
159 a *
(LSD 104.68)
48% ETc192.36 a163.73 a *1179 a600 a *415 a164 a *
27% ETc184.35 a *
(LSD* 71.22)
162.83 a *
(LSD* 17.32)
1133 a
(LSD* 308.06)
489 a
(LSD* 143.29)
443 a
(LSD* 122.56)
201 a *
(LSD* 78.95)
1 Obtained by dividing the total production per tree by the number of fruits/tree. 2 Category I fruits (>68 mm); 3 category II fruits (62–68 mm); 4 category III fruits (<62 mm). Values for the same year and in the same column that are followed by the same letter did not present significant differences between treatments according to Tukey’s test (p < 0.05); values in the same column and followed by * were different between years. LSD* (2014–2015).
Table 3. Parameters of the sigmoid logistic growth model for the equatorial diameter of pear fruits subjected to different irrigation treatments.
YearTreatment abcR2
2014100% ETc11.14171.56094.6300.998
74% ETc11.20274.21098.8200.998
60% ETc11.89675.540108.0300.998
2015100% ETc9.29563.10098.3500.995
48% ETc9.24765.980102.3500.994
27% ETc9.72968.100109.1300.995
a: maximum equatorial diameter reached by the fruit according to the logistic model, b: maximum relative growth rate, and c: time in which the maximum growth rate is reached. R2: correlation coefficient of determination of the sigmoid logistic model.
Table 4. Fluctuations in fruit water potential at dawn (Ψfd) and fruit water potential at solar noon (Ψfn) in pear plants subjected to different regulated deficit irrigation treatments in 2014.
TreatmentΨfd (MPa)Ψfn (MPa)
100% ETc−0.43 to −0.52−1.19 to −1.33
74% ETc−0.36 to −0.51−1.19 to −1.37
60% ETc−0.42 to −0.51−1.12 to −1.49
Disclaimer/Publisher’s Note: The statements, opinions and data contained in all publications are solely those of the individual author(s) and contributor(s) and not of MDPI and/or the editor(s). MDPI and/or the editor(s) disclaim responsibility for any injury to people or property resulting from any ideas, methods, instructions or products referred to in the content.

