
Pollution Characteristics and Risk Evaluation of PAHs in Subsidence Water Bodies in Huainan Coal Mining Area, China

1
Anhui Key Laboratory of Water Pollution Control and Waste Water Recycling, Anhui Jianzhu University, Hefei 230601, China
2
Anhui Key Laboratory of Environmental Pollution Control and Waste Resource Utilization, Anhui Jianzhu University, Hefei 230601, China
3
Anhui Research Academy of Ecological Civilization, Anhui Jianzhu University, Hefei 230601, China
4
College of Materials Science and Optoelectronic Technology, University of Chinese Academy of Sciences, Beijing 100049, China
*
Author to whom correspondence should be addressed.
Sustainability 2023, 15(18), 14003; https://doi.org/10.3390/su151814003
Submission received: 17 June 2023
/
Revised: 9 September 2023
/
Accepted: 13 September 2023
/
Published: 21 September 2023
(This article belongs to the Section Environmental Sustainability and Applications)
Abstract
:As a class of persistent organic pollutants (POPs), polycyclic aromatic hydrocarbons (PAHs) have mutagenic, teratogenic, and carcinogenic effects, so they can pose a greater threat to the natural environment and human health. Most of the PAHs in coal mining areas originate from the mining and utilization process of coal resources, which has a variety of carriers in the environment: atmosphere, water bodies, soil, sediments, etc. To study their pollution status in the subsidence waters of the Huainan coal mining area, sixteen priority control PAHs of sixteen surface water samples from seven subsidence water bodies were tested using gas chromatography–mass spectrometry (GC–MS), and their pollution characteristics were analyzed. Overall, the concentration of PAHs ranged from 212 to 283 , and benzo[b]fluoranthene (BbF) had the highest average concentration. In addition, the concentration of PAHs above four rings was relatively high. After statistical analysis, the Pearson correlation coefficient calculation showed a highly significant positive correlation between PAHs with the same number of rings. Three principal factors were selected using factor analysis, which could explain 88.37% of the total variance, to conduct the source identification. Coal combustion was found to be the main source of PAH pollution in the area. Then, ecological risk using the risk quotient (RQ) method was carried out. The results showed that PAH contamination was medium risk, among which, benzo[a]anthracene (BaA) and BbF had a high ecological risk. In addition, the results of biological toxicity evaluation using the species sensitivity distribution model (SSD) showed that benzo[a]pyrene (BaP) had a high proportion of potential effects on aquatic organisms. By using the response addition model, the evaluation results showed that the ecological risk of the subsidence water bodies in the Panyi mine was the highest. Finally, human health risks were evaluated from two pathways: dermal contact and ingestion. The carcinogenic health risks from the dermal contact exceeded the permissible limits, while the hazard entropy of non-carcinogenic risks from the above two pathways were less than 1.
1. Introduction
China is rich in coal resources, and the proportion of coal consumption in energy consumption accounted for 56.0% of total energy consumption in 2021 [1]. While promoting economic development, this has also caused certain eco-environmental problems in mining areas. In the process of coal mining and utilization, some inorganic or organic substances are released from coal and enter the atmosphere, soil, and water bodies [2], causing serious pollution in these environmental media. Long-term mining activities have resulted in surface subsidence, which have caused irreversible impacts on the geological environment of coal mining areas [3]. Coal mining subsidence is a common environmental geologic hazard in mining areas, usually formed by rock and surface subsidence caused by coal mining [4], and the coal mining subsidence area is prone to the accumulation of water, forming coal mining subsidence waters [5].
Currently, in the study of contaminants in surface waters in mining areas, more attention has been paid to heavy metals [6,7], nutrient elements [8], and organic matter indicators [9]. However, the process of coal exploitation and use has also led to the production and release of polycyclic aromatic hydrocarbons (PAHs). PAHs are highly toxic and have mutagenic, teratogenic, and carcinogenic effects [10]. Therefore, it is important and valuable to study the pollution status of PAHs in subsidence water bodies in coal mining areas.
As a typical persistent organic pollutant, the main sources of PAHs in the environment are anthropogenic activities such as industrial production, agricultural waste, vehicle exhaust, coal combustion, and petrochemical emissions [11].
Hundreds of PAHs and their derivatives have been found, and the U.S. National Environmental Protection Agency (USEPA) stipulated that a total of 16 PAHs should be controlled as a priority [12]. These PAHs are more widely distributed in the environment, and the toxic hazards, as well as the potential carcinogenic risks caused, are greater. Seven PAHs were classified as priority control pollutants in water in China [13], including Naphthalene (Nap), Fluoranthene (Flt), Benzo[b]fluoranthene (BbF), Benzo[k]fluoranthene (BkF), Benzo[a]pyrene (BaP), Indeno[123-cd]pyrene (IcdP), and Benzo[g,h,i]perylene (BghiP). PAHs have chemical properties such as semi-volatility, long-range transport, and bioconcentration in the environment [14], which have caused PAHs to be continuously enriched and amplified through the food chain, thus posing a serious threat to the aquatic environment. Once the water contaminated by PAHs is used for agricultural irrigation, accumulation occurs in crops and enters the human body through the food chain [15]. PAHs in the environment can enter the human body through ingestion, respiration, and dermal exposure [16], and long-term exposure to PAHs can be a serious health hazard [17].
Studies on PAHs in surface waters have been carried out by scholars, and research in this field started in the 1980s [18]. Early investigations were mainly focused on the pollution status of PAHs. After the 1990s, studies on the sources, transport, and pollution of PAHs began to grow, the earliest of which was on PAHs in water bodies [19,20]. The research has mainly focused on rivers, lakes, deltas, and bays [21].
In recent years, some progress has been made in the evaluation of PAHs in the subsidence water bodies of coal mines. Chen compared the PAHs in coal gangue and surface water in the Huainan coal mining area and concluded that PAHs in coal gangue could migrate and cause pollution in nearby water bodies [22]. For the subsidence water bodies near the Yangzhuang village in the Huainan coal mining area, the concentrations of PAHs ranged from 7.23 to 11.15 , and they mainly came from coal combustion in low-temperature combustion [23]. For another subsidence water bodiesof the Xieqiao coal mining area, the content of PAHs was 123.27–194.79 , and the total PAH content in the southern subsidence water body was higher, and there was a decreasing trend from south to north [24].
The above studies investigated the contamination and source distribution of PAHs in subsidence waters in Huainan and achieved some results. In the previous study, there was also the problem that the selection of subsidence water bodies was not comprehensive enough, and only the partial were analyzed. And less work has been done on the ecological risk assessment of PAHs. Therefore, it was important to carry out more comprehensive research on the pollution characteristics, source distribution, and risk effects on the surrounding environment and human health risk.
The research objectives of this article were as follows: (1) to compare the contents of PAHs in different subsidence water bodies and to evaluate their pollution status; (2) to analyze the composition characteristics and source distribution of PAHs using Pearson correlation analysis and factor analysis; (3) to evaluate the ecological risk of PAHs by using the risk quotient (RQ) method and the species sensitivity distribution (SSD) model, and to evaluate the human health risk in order to provide a theoretical basis for the risk management and their scientific utilization.
2. Materials and Methods
2.1. Study Area and Sampling Locations
Huainan is rich in coal mineral resources, which accounts for 74% of the coal reserves in Anhui Province and more than 50% in East China [25]. Its advantageous location and convenient transportation provide good conditions for mining and transportation of coal. Due to coal mining activities, the accumulative subsidence area was about 316.81 km2 by the end of 2019 [26]. With the continuous mining of coal, the subsidence area will increase and the area of subsidence water bodies also will expand. At present, some subsidence water bodies are used to agricultural irrigation and aquaculture. In the future vision, they can also act as a drinking water source. Therefore, the water quality problem of subsidence waters have raised concerns. According to their spatial distribution, seven subsidence water bodies were selected and 16 sampling points were set up, which were as follows: Panyi mine (S1, S2, S3), Houwang village (S4), Xuqiao mine (S5), Yue Zhangji (S6, S7, S8), Xieqiao mine (S9, S10), Guqiao mine (S11, S12, S13, S14) and Xinji’er mine (S15, S16). The specific sampling points were shown in Figure 1.
2.2. Collection of Water Samples and Test
The water samples from the subsidence water bodies were sampled on 18–19 February 2021. Water samples were collected using a Plexiglas water collector, packed in precleaned brown glass vials, quickly transported back to the laboratory, and stored at 4 °C. Firstly, the water sample was pretreated by placing 1000 mL of water sample in a 2000 mL partition funnel, adding sodium chloride (10 g) and dichloromethane (100 mL), shaking for 5 min, and then being left to stratify. The organic phase was collected into a 250 mL round bottom flask, the extraction was repeated twice, the organic phases were combined, and anhydrous sodium sulfate was added until anhydrous sodium sulfate in a flowing state existed; then, 50 μL decafluorobiphenyl was added and concentrated and the organic phase was fixed to 1 mL with a rotary evaporator for measurement.
The content of PAHs in water samples was determined using gas chromatography–mass spectrometry (Agilent SQ 7000 GC-MS, USA). Gas chromatograph–mass spectrometer was equipped with autosampler; column (Agilent 19091S-433UI, USA, 30 m × 250 μm × 0.25 μm), inlet temperature 280 °C, injection volume 1.0 μL, column temperature 80 °C held for 2 min, ramped up to 180 °C at a rate of 20 °C/min, held for 5 min. Then, this was increased to 290 °C at a rate of 10 °C/min for 5 min. Carrier gas: High purity helium, PAH MIX16 (CDAA-M-631004-JB-1 mL) was used as standard sample, and PAH concentration was determined using internal standard method using full sweep Scan mode for qualitative and SIM mode for quantification. A total of 16 priority control PAHs were detected: Naphthalene (Nap), Acenaphthylene (Any), Acenaphthene (Ace), Fluorene (Flu), Anthracene (Ant), Phenanthrene (Phe), Fluoranthene (Flt), Pyrene (Pyr), Benzo[a]anthracene (BaA), Chrysene (Chr), Benzo[b]fluoranthene (BbF), Benzo[k]fluoranthene (BkF), Benzo[a]pyrene (BaP), Dibenzo[a,h]anthracene (DBA), Indeno[123-cd]pyrene(IcdP), and Benzo[g,h,i]perylene (BghiP).
Sample blanks, laboratory blanks, and sample parallels were added for quality control and assurance during the whole process of sample collection and analysis. The standard sample dilution was the limit of detection for various samples with known concentrations on the basis of the established method. The limit of quantitative detection was 0.004–0.016 g/L. The spiked recoveries of PAHs in this experiment were 68.1–109.7%, which met the requirements for trace analysis.
2.3. Risk Quotient Method
Risk quotient (RQ) method is a mature ecological risk evaluation method, which is widely applied in the risk evaluation of water bodies and sediments. RQ is calculated as Expressions (1)–(4) [27,28]. The ecological risk classification determined by the RQ values were shown in Table S1 (Table S1 in the Supplementary Materials).
where is the concentration of PAH monomer in water (ng·L−1), is the minimum risk concentration of PAH monomer (ng·L−1), and is the maximum risk concentration of PAH monomer (ng·L−1) [29]. is the sum of for 16 PAHs monomers, and is the sum of for 16 PAHs monomers. The specific values of NCs and MPCs are shown in Table S7.
2.4. Species Sensitivity Distribution Method
Species sensitivity distribution (SSD) method is a statistical extrapolation technique that works by fitting contaminant toxicity data. It allows the derivation of hazardous concentrations that protect any proportion of species in the aquatic environment from the effects of the pollutant [30]. SSD was constructed and analyzed in the following steps: (1) acquisition of toxicity data; (2) species grouping and data collation; (3) SSD curve fitting; (4) calculation of HC5 values (HC5 indicated the concentration that protects 95% aquatic organisms from harm) and potential affected fraction (PAF) for PAH monomer; (5) calculation of cumulative potential affected fraction (msPAF) for multiple pollutants.
2.4.1. Toxicity Data Acquisition and Processing
Because most PAHs lacked corresponding aquatic toxicity data, especially chronic toxicity data, in this study, acute toxicity data for eight PAHs (Nap, Ace, Flu, Phe, Ant, Flt, Pyr, and Bap) were collected to construct the SSD model, and toxicity data of LC50 or EC50 were selected for exposure times of 24–96 h. The data were mainly obtained from the USEPA ECOTOX Knowledgebase (https://cfpub.epa.gov/ecotox/, accessed on 2 January 2022), and prior selection was given to organisms that were representative of the aquatic ecosystem in the study area. After considering the diversity of species in the Huainan mining area and the amount of toxicological data (the amount of toxicological data should not be less than 5, and the general selection varies from 8 to 10) [31], freshwater species such as amphibians, crustaceans, fish, algae, and invertebrates were selected for the study. Data should be processed with the following requirement: when multiple toxicity values were available for the same species or the same endpoint, the geometric mean value was taken. According to the above selection principles, the statistical values of the toxicity data for the eight PAHs are shown in Table S2.
2.4.2. Species Sensitivity Curve Fitting
In this study, the logistic distribution model was used for curve fitting, and the curve was plotted using Origin 2021. Taking log-transformed toxicity data concentration values as the x-axis and the percentage of species potentially affected(%)corresponding to the concentration values as the y-axis, the SSD curve was obtained.
2.4.3. Ecological Risks
Based on the acute toxicity data, the SSD method was applied to evaluate the ecological risk of individual PAHs. Firstly, the acute toxicity data of the eight monomer PAHs were logarithmically transformed and fitted with a logistic model to obtain the SSD curves of the eight monomer PAHs, and then the concentrations of PAHs in the ambient water were substituted into Formula (5) to calculate the proportion of potential effects (PAF), i.e., the proportion of species whose ambient concentrations of PAHs exceeded the bio-toxicity endpoints. The corresponding logistic model function is calculated as Formula (5):
where x is the value of PAH monomer exposure concentration (ng·L−1) in water after logarithmic transformation, and a and b are the characteristic parameters of the SSD curve.
The SSD method is capable of calculating the cumulative potential impact fraction (msPAF) of multiple pollutants for joint ecological risk assessment of multiple pollutants. The concentration addition (CA) and response addition (RA) models were used to calculate the msPAF due to the similarities and differences in action modes of pollutants on biotoxicity (toxic mode of action, TMoA), respectively.
The CA model was calculated as Formulas (6)–(8):
where is the toxicity unit of each PAH monomer (dimensionless), is the concentration value of the ith PAH monomer (ng·L−1), is the geometric mean of the toxicity data of the ith PAH monomer (ng·L−1), is the sum of the HU values of all PAH monomer, is the cumulative potential affected fraction calculated by the concentration addition model, and σ is the arithmetic mean of the log-transformed standard deviations of the acute toxicity data of eight PAH monomers with similar toxicity effects.
The RA model was calculated as Formula (9):
where was the cumulative potential affected fraction calculated by the response addition model, and was the potential affected fraction of PAH monomer.
2.5. Method of Health RISK Assessment
2.5.1. Toxic Equivalent
Due to the similar mechanism of toxic action of PAHs, the concentration of each carcinogenic PAHs was converted into the equivalent concentration of BaP (that is toxic equivalent quantity, TEQ) when the lifetime carcinogenic risk of the mixed carcinogenic PAHs was calculated. Then, the toxic equivalence of the seven carcinogenic PAHs relative to BaP could be obtained according to the toxicity equivalence factor (TEF), which was calculated as Formula (10):
where is the concentration of the ith PAH monomer (mg·L−1) and is the toxicity equivalent factor of the ith PAH monomer (see Table S3).
2.5.2. Average Daily Exposure Dose of Pollutants
In this study, the carcinogenic risk of PAHs in water bodies to human health was assessed using both ingestion and dermal exposure pathways, and the average daily exposure dose (ADD, mg·kg−1·d−1) was calculated as Formulas (11) and (12) [32]:
where is the concentration of PAH monomer in mg·L−1; IR is the intake of drinking water, taken as 2.2 L·d−1; EF is the exposure frequency, taken as 365 d·a−1; ED is the exposure time, taken as 70 years for calculating carcinogenic risk and 30 years for non-carcinogenic risk; BW is the body weight, taken as 62 kg; AT is the average exposure time (AT = 365 × ED) in d; is the skin penetration coefficient (see Table S3) in cm·h−1; SA is the skin exposure area, taken as 16,000 cm2; ET is the exposure time, taken as 0.25 h·d−1; CF is the unit conversion factor (1 L = 1000 cm3).
2.5.3. Incremental Lifetime Cancer Risk
The incremental lifetime cancer risk (ILCR) model recommended by the USEPA was used for health risk evaluation. The ILCR was developed as Formula (13):
where CSF is the carcinogenic slope factor, and its determination is based on the carcinogenic ability of BaP. and of BaP were taken as 7.3 (kg·d−1·mg−1)−1 and 25 (kg·d−1·mg−1)−1, respectively [33].
When the ILCR is less than 10−6, the risk is negligible; when the ILCR is between 10−6 and 10−4, there is a potential carcinogenic risk to humans; and when the ILCR is greater than 10−4, there is an unacceptable carcinogenic risk. Multiple carcinogens and multiple exposure pathways can also increase the carcinogenic risk if the pollutants have an additive effect [7]. For single-factor carcinogenic risk, the upper limit of the allowable risk value is 1 × 10⁻⁶, while the allowable limit of multi-factor carcinogenic risk is 1 × 10⁻⁴.
2.5.4. Non-Carcinogenic Health Risk
Non-carcinogenic risk is computed according to Formulas (14) and (15):
where RfD is the non-carcinogenic reference dose of PAH monomer by ingestion or dermal exposure pathways (see Table S3) in mg·kg−1·d−1. HQ is the non-carcinogenic risk factor of the PAH monomer (dimensionless), and i is a different PAH monomer; HI is the sum of the non-carcinogenic risk factors for the 16 PAHs (dimensionless).
When HQ or HI is greater than 1, it indicates the presence of a non-carcinogenic health risk, and when it is less than 1, it indicates a low non-carcinogenic health risk and can be ignored. is the summation of the non-cancer risk coefficients of different exposure pathways (dimensionless), which is calculated as Formula (16):
where j was different exposure pathway.
2.6. Statistical Analysis Methods
Statistical Package for the Social Sciences 23.0 (SPSS 23.0) software was used for statistical analysis of the data, including Pearson correlation analysis and factor analysis. Pearson’s correlation coefficient method is a statistical method to accurately measure the correlations between two variables [34], which can reflect the degree of linear correlation between two random variables. Factor analysis (FA) is a common method for dimensionality reduction of variables, which can not only reduce the dimensionality of variables, but can also classify variables, and is widely used in source analysis of pollutants in water bodies [35]. The data were sorted and calculated by Excel, and graphs were plotted using Origin 2021.
3. Results and Discussion
3.1. PAHs Concentration and Comparison with Other Aquatic Systems
The concentrations and chemical structure formulae of 16 PAHs in the subsidence water bodies of the study area are given in Table S4. The concentrations of ranged from 212 to 283 ng·L−1 and the average value was 246 ng·L−1. The concentrations of in the seven subsidence water bodies in descending order were Panyi mine, Yue Zhangji, Xieqiao mine, Guqiao mine, Xinji’er mine, Houwang village, and Xuqiao mine. Figure 2 shows the average concentrations of each PAH monomer in the study area. As seen from Figure 2, all 16 PAHs were detected, and the PAH monomer with the highest average detection value was BbF. BbF was difficult to biodegrade [36,37], had a biological half-life in coal tar of several months or years, and existed in the environment for a long time [38]. The incomplete combustion of coal and other minerals was the main source of BaP in the environment [39], and BaP was also considered as a marker of PAHs’ pollution from industry [40]. BbF and BaP belonged in the scope of the seven carcinogenic PAHs [14] and were priority PAHs for control in China.
The existing standards only stipulate the concentration limits of some PAHs’ monomers and the limits of total PAHs. The concentration of at each sample point was 212 × 10−6–283 × 10−6 mg·L−1, which reached the limit value requirement (2 × 10⁻³ mg·L−1) of the Standard for Drinking Water (GB5749-2006) [41]. BaP was 19.81 × 10⁻⁶–21.79 × 10⁻⁶ mg·L−1, which exceeded the limit value requirement (2.8 × 10⁻⁶ mg·L−1) of the Environmental Quality Standard for Surface Water (GB 3838-2002) [42] and the limit value requirement (10 × 10−6 mg·L−1) of the Standard for Drinking Water (GB5749-2006), and only met the limit value requirement (0.7 × 10⁻³ mg·L−1) of the Drinking Water Quality Standard of WHO (the fourth edition) [43]. According to the recommended Water Quality Criteria issued by the USEPA [44], Nap, Any, Phe, and BghiP had no corresponding reference standard values, so they were not assessed. Among the remaining pollutants, it was found that BaA, Chr, BbF, BkF, BaP, DBA, and IcdP exceeded the standard limit requirements (3.8 × 10⁻⁶ mg·L−1) at each site of this test, while Ace, Flu, Ant, Flt, and Pyr did not exceed the respective limit values. To assess their pollution levels, a comparison of concentration levels in different water bodies was conducted, as shown in Table 1.
3.2. Composition Characteristics and Source Distribution
3.2.1. Composition Characteristics
The low molecular weight PAHs below four rings mainly originated from petroleum pollution and the combustion of wood and coal in the low to medium temperature range, while the high molecular weight PAHs above four rings mainly originated from the high temperature combustion of fossil fuels [54]. In this study area, the concentration of PAHs above four rings was high. The coal consumption in the Huainan coal mining area was high, and the high temperature combustion of coal led to high concentrations of high ring PAHs in the subsidence water bodies. The characteristics of the pollution composition of sixteen PAHs were shown in Table S5, among them, five ring PAHs accounted for the most, followed by three and four ring PAHs, and two rings PAHs accounted for the least.
As can be seen from Figure 3, the highest proportion of BbF was found in the study area, accounting for 9.75–16.32% of the total PAHs in each region. Photolysis of BbF in the water bodies occurred when it was irradiated by UV light from the sunlight of sufficient energy, but photolysis of BbF was weaker because of its higher molecular weight [55]. High molecular weight PAHs had the characteristics of being difficult to volatilize and having a high boiling point, a long half-life, and a long retention time in the environment [56]. In the study area, it was more affected by four–six ring PAHs with high molecular weights (Figure 3), and PAHs with high molecular weights accounted for 69.76%, 72.20%, 72.23%, 72.63%, 72.11%, 72.12%, and 72.01% in the seven water bodies, respectively.
After excluding the data of the four PAHs that did not conform to the normal distribution, SPSS 23.0 software was used to analyze the correlations of the other twelve PAHs (Nap, Ace, Flu, Ant, Flt, Pyr, Chr, BbF, BkF, BaP, IcdP, BghiP). In the study area, PAH monomers with the same number of rings showed highly significant positive correlations (Figure 4), such as highly significant correlations (p < 0.01) between two pairs of the three-ringed Ace, Flu, and Ant, and between two pairs of the four-ringed Flt, Pyr, and Chr (p < 0.01). The five-ringed BbF showed highly significant correlations with BkF (p < 0.01). And the six-ring IcdP and BghiP showed highly significant correlations with each other (p < 0.01). These compounds had similar molecular structures (See Table S4) and small differences in molecular weight, and they had similar environmental behavior and contamination sources in the environment.
3.2.2. Source Distribution
The analysis of the composition of PAHs can facilitate the understanding of the source of PAHs and their transport and transformation in the environment. The ratio of isomers such as Ant/(Ant + Phe) and Flt/(Flt + Pyr) was commonly used as the basis for determining the source of PAHs [57]. Ant/(Ant + Phe) > 0.1 indicates a combustion source, while Ant/(Ant + Phe) < 0.1 indicates a petroleum source. Flt/(Flt + Pyr) > 0.5 indicates combustion from grass, wood, coal, etc.; Flt/(Flt+Pyr) between 0.4 and 0.5 is considered to be mainly from the combustion of petroleum-based substances; Flt/(Flt + Pyr) < 0.4 indicates a petroleum source [58]. As shown in Figure S1, the Ant/(Ant + Phe) of each sampling point was greater than 0.1 and the Flt/(Flt + Pyr) was greater than 0.5. So, this indicated that the PAHs’ pollution was relatively consistent, and it was presumed that the PAHs’ pollution in the study area came from the combustion of grass, wood, and coal. Further, this should be taken as the combustion of coal according to the actual situation in the study area.
The source of PAHs in the environment can only be roughly determined by the isomer ratio of PAHs, and the migration and transformation of PAHs’ components in the environment may change. To improve the accuracy of the analysis results, factor analysis was used to simplify multiple indicators into major factors and to speculate the sources of PAHs’ pollution that were indicated by different factors. After excluding the data of four PAHs that did not conform to a normal distribution, the source analysis was performed for the twelve PAHs. KMO (Kaiser–Meyer–Olkin) test statistic was used to compare the simple correlation coefficients and partial correlation coefficients between variables. The closer the KMO value is to 1, the stronger the correlation. And the KMO value was 0.73 (>0.6), which could be subjected to factor analysis, and the results are shown in Table S6.
Three principal factors were extracted, with a cumulative variance of 88.37%, which can basically explain most of the PAHs’ pollutant source information. The main factor 1 (36.55%) had high loading values mainly in Chr, BaP, IcdP, and BghiP. Chr and BaP are mainly caused by high temperature combustion of coal [59], while IcdP and BghiP are mainly caused by gasoline and diesel engine emissions [60]. The main factor 1 mainly represented the mixed source of the high temperature combustion of coal and traffic fuel emissions. The main factor 2 (31.03%) had high loading values mainly in Ace, Flu, and Ant, etc. Low-ring components such as Ace represented oil sources [61]. Flu and Ant were the main indicator of biomass combustion sources [62], indicating grass, wood, straw, and other pollution sources. The main factor 2 indicated a mixed source of oil pollution and biomass combustion. The main factor 3 (20.79%) included Nap, BbF, and BkF. Nap indicated the oil source [61], and Kavouras et al. considered BbF to represent the coal combustion source [63]. BKF is a marker of fossil fuel combustion. Factor 3 represents fossil fuel sources such as coal [64].
According to the above results, PAH pollution in the study area was related to coal combustion, traffic fuel emissions, and the combustion of straw. Combined with the amount of coal used in Huainan, it could be assumed that coal combustion was the main source of PAH pollution. The calculation of the total factor score indicated that PAH pollution was most serious at S2, S1 (located at Panyi mine), and S10 (located at Xieqiao mine), and should be seriously addressed. A three-dimensional plot of factor loadings is shown in Figure S2, which is helpful to show the relationship between PAH monomers more visually.
3.3. Ecological Risk Assessment
3.3.1. Risk Quotient (RQ)
Cao et al. proposed a new classification criteria of risk level [65] (see Table S1). This method was more precise and scientific in evaluating the ecological risk of by fully considering the influence of the risk level of each monomer. Seen from the results (Table S7), the majority of the risk evaluation results for the 16 PAHs were moderate risk, and only BaA and BbF were evaluated as high risk in the whole study area. BaA can persist in the environment, is toxic to humans, and is a moderately weak carcinogen [66]. Obanya et al. found that the factories near the Ologe lagoon in Nigeria discharged large amounts of PAHs (BbF as the main component) and that the concentrations of BbF in the water bodies had chronic toxic effects on aquatic organisms [67]. In this study, the total risk of within the whole study area was moderate risk. The total risk of in Yue Zhangji was high risk, the other six subsidence water bodies were moderate risk, and the overall PAH pollution was more serious. The high risk of in Yue zhangji subsidence water bodies was mainly due to the more serious contamination of BbF.
3.3.2. Ecological Risk of Single PAH
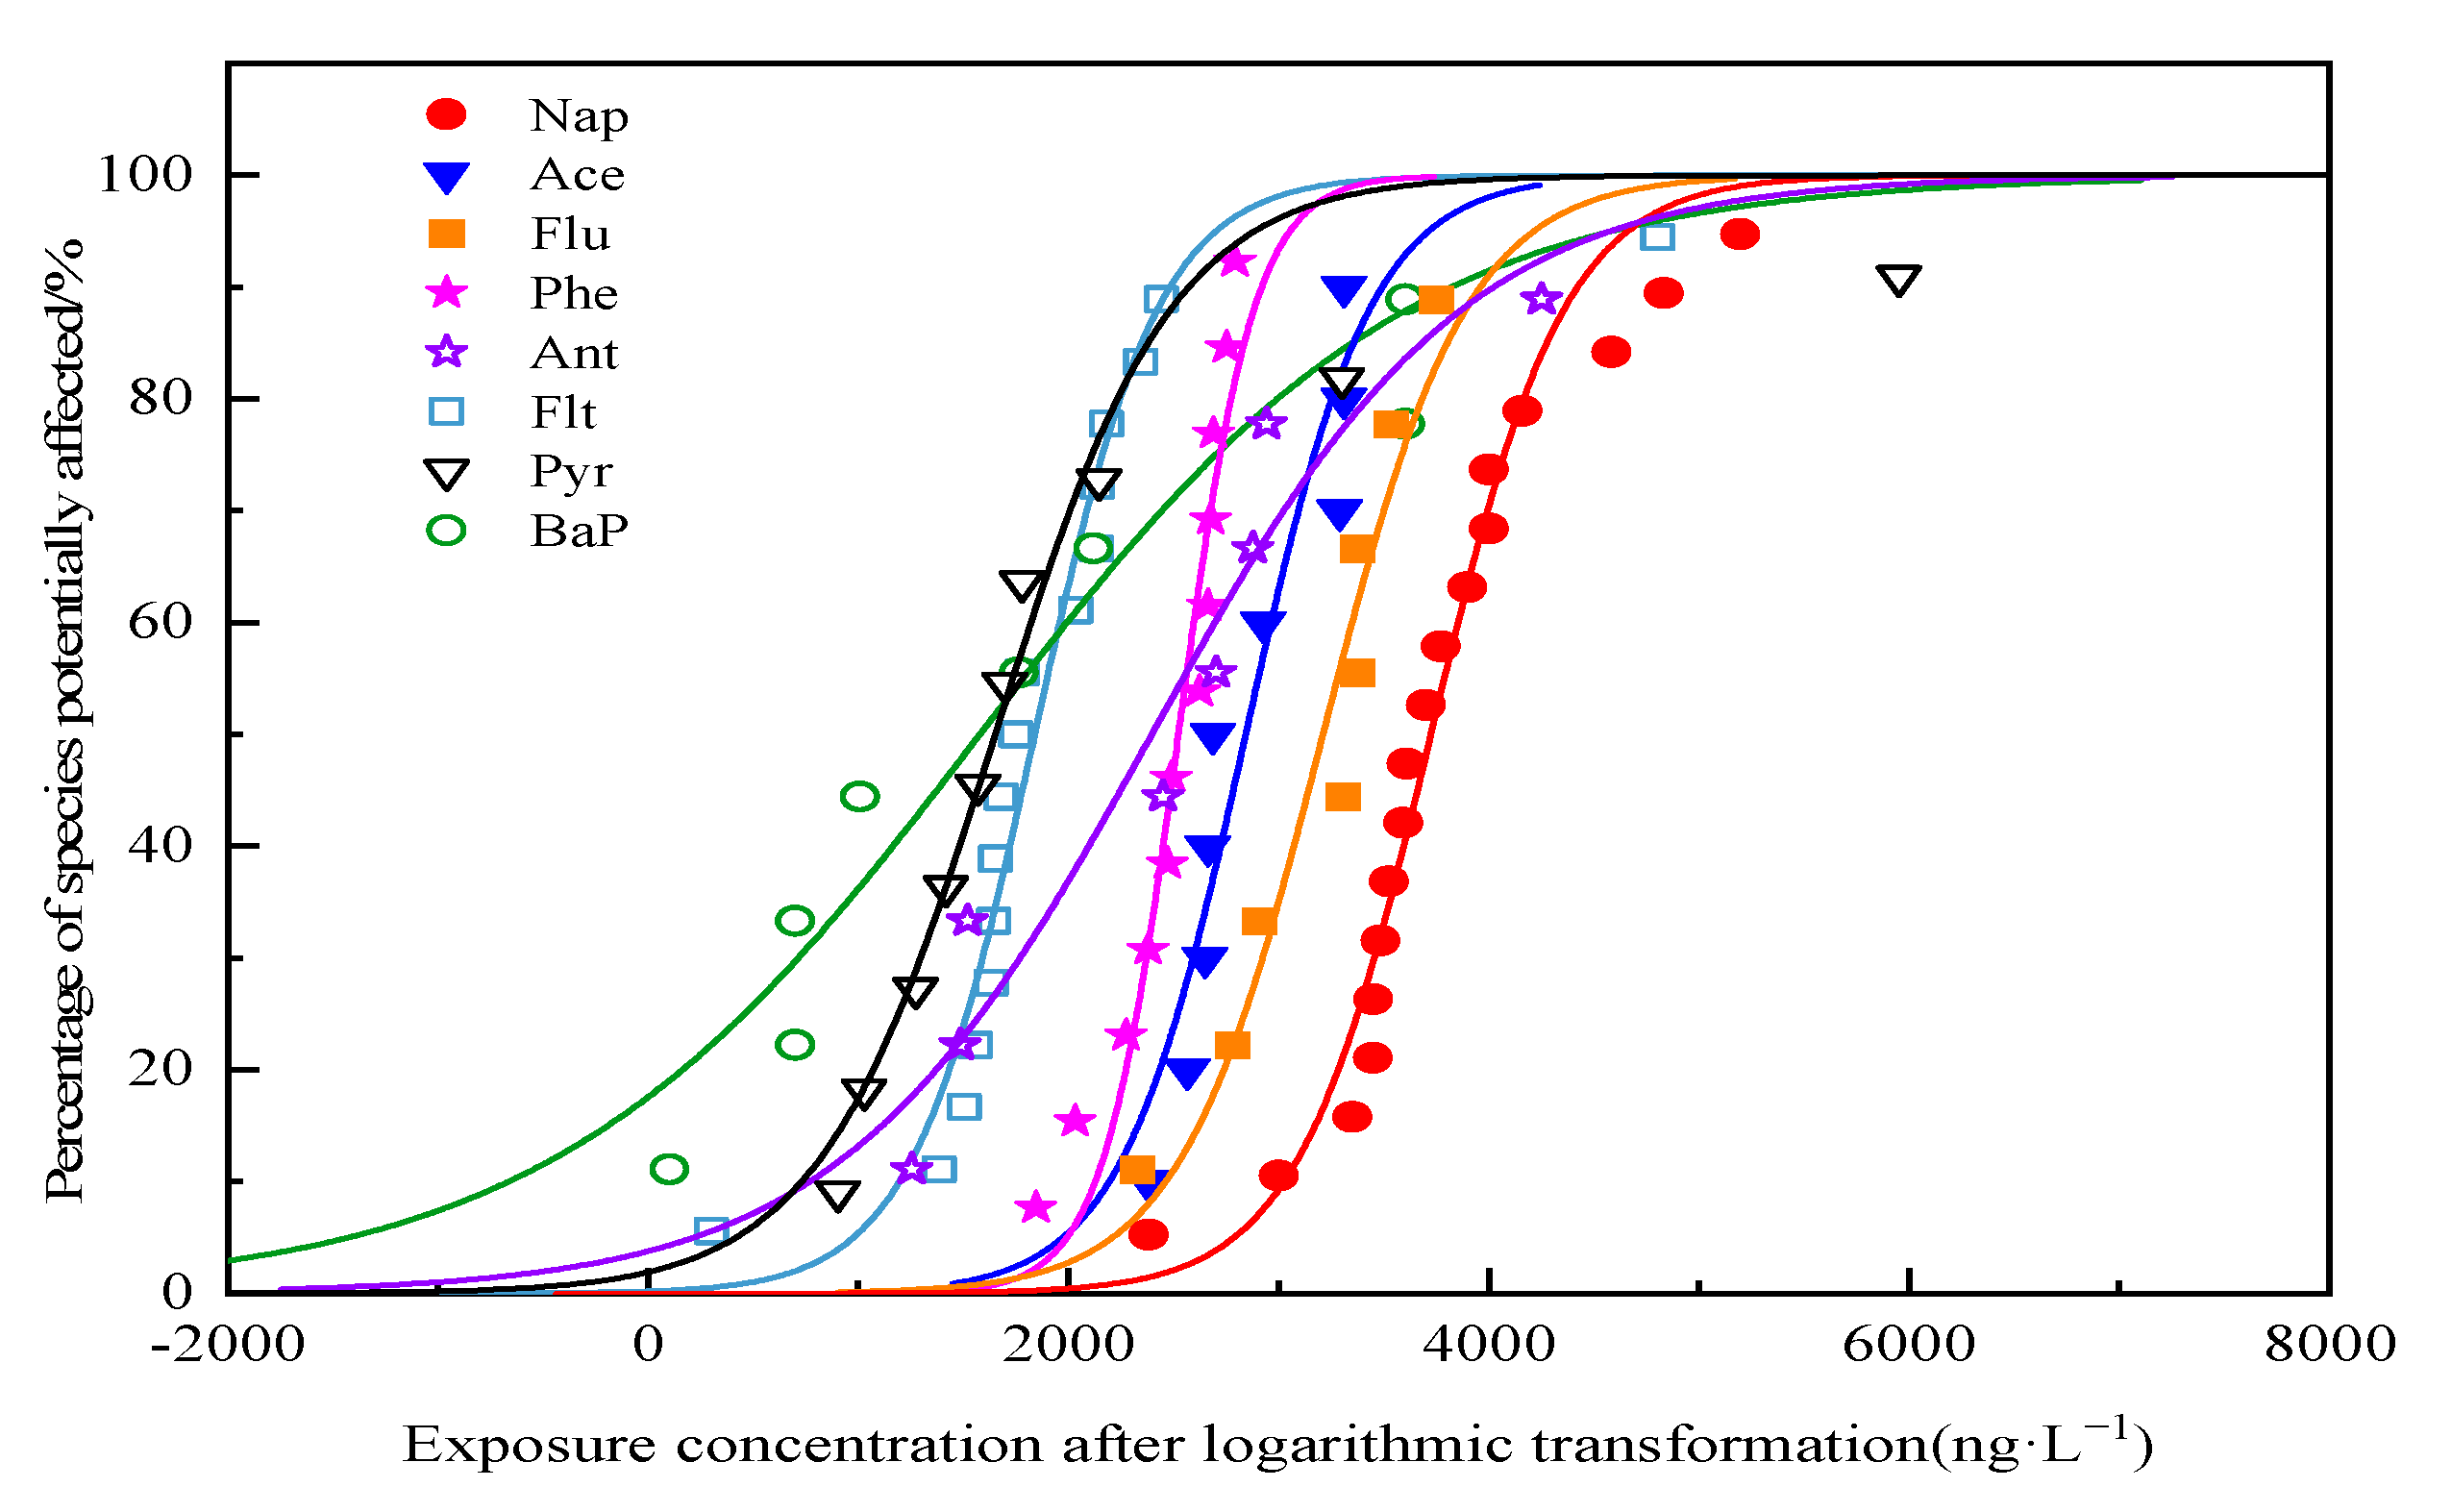
The fitted curves of SSD for the eight PAHs were shown in Figure 5. The judgement coefficients R2 of the fitted curves were all above 0.9, indicating that the logistic model was a good fit for the PAHs’ toxicity data. The acute ecological risks of eight PAHs (Nap, Ace, Flu, Phe, Ant, Flt, Pyr, and Bap) were calculated using the SSD method, and the HC5 were detailed in Table 2.
The serious ecological risks of the eight PAH monomers and their serious combined ecological risks were calculated by using the SSD model, and the results were shown in Table 3. Seen from Table 3, the impact ratios of Nap, Ace, Flu, Phe, Ant, Flt, and Pyr on freshwater organisms were all less than 0.5%, indicating that the ecological risks of the seven PAHs on freshwater aquatic organisms were low; the PAF values of Nap, Ace, Flu, Phe, and Flt were extremely low and the ecological risks were basically negligible.
The effect proportion of Bap to freshwater organisms was greater than 3% and the PAF value of Bap in the Panyi mine reached 3.94%, so the monitoring and evaluation work of PAHs should focus on the change in Bap concentration (especially Panyi mine). Although the concentration of Flt was higher than that of Ant, the ecological risk of Ant was higher than that of Flt, which was closely related to the magnitude of toxicity of PAHs to aquatic organisms [14]. By comparing the HC5 values (Table 2), the toxic effects of the eight PAH monomers on aquatic organisms could be obtained in the descending order of Bap > Ant > Pyr > Flt > Ace > Phe > Flu > Nap. Among them, Bap was the most toxic to aquatic organisms, followed by Ant. It can be seen from Figure 5 that among the SSD curves of the eight PAHs, those closer to the y-axis were Bap and Ant, which had the greater ecological risk compared with other PAHs.
3.3.3. Joint Ecological Risk Assessment of Multiple PAHs
The concentration addition (CA) model and response addition (RA) model were applied to calculate the joint ecological risk of eight PAHs, respectively. Seen from Table 3, the msPAFCA calculated by applying the CA model was lower than the PAFs of some PAH monomers, such as Bap, Ant, and Pyr. The basis for applying the CA model to calculate the msPAF of multiple pollutants was that the various pollutants involved in the calculation should have similar toxic effects, and the toxicity data of various pollutants should have similar distribution models and the same standard deviations [68], but the differences in the standard deviations of the toxicity data of the eight PAHs in the study were large, which might be due to the following reasons: (1) there were differences in the modes of toxic effects of different PAH monomers on aquatic organisms [14]; (2) there were less toxicity data of PAHs and they were insufficient to construct a complete species sensitivity distribution curve [69].
The results of msPAFRA based on the RA model were more reasonable (See Table 3), and the calculated msPAFRA were all higher than the PAFs of PAH monomers, indicating that the RA model was suitable for the joint risk evaluation of aquatic organisms. It can be seen that the msPAFRA of the seven subsidence water bodies were 4.22–4.37%, and their descending order was Panyi mine > Xieqiao mine > Guqiao mine > Xinji’er mine > Yue Zhangji > Houwang village > Xuqiao mine. Among them, 4.37% organisms were affected in the Panyi mine, with relatively highest ecological risk, which might be related to the higher ecological risk of Bap and Ant. The value of msPAFRA in this study area was higher than that of the Haihe River (2.60%) and lower than those of the Yangtze River (5.36%) and the Huaihe River (10.06%) [14]. The high joint ecological risk of PAHs in the study area was mainly associated with the coal mining industry, where coal handling, storage, and use were sources of PAH generation and release.
3.4. Human Health Risk Assessment
3.4.1. Incremental Lifetime Cancer Risk
The carcinogenic risks of PAHs through two exposure pathways, ingestion and dermal exposure, were calculated according to the incremental lifetime cancer risk model. The results are shown in Table S8.
As seen from Table S8, the incremental lifetime cancer risk of PAHs through the ingestion pathway was 1.16 × 10⁻⁵–1.28 × 10⁻⁵. The highest carcinogenic risk of PAHs through the ingestion pathway was found in BaP, which had the highest value of 5.39 × 10⁻⁶, and occurred in Panyi mine; DBA ranked second, with a carcinogenic risk of 4.81 × 10⁻⁶–5.24 × 10⁻⁶.
The incremental lifetime cancer risk through the dermal exposure pathway was 1.33 × 10⁻⁴–1.44 × 10⁻⁴. The highest carcinogenic risk of the dermal exposure was 8.82 × 10⁻⁵ for DBA, which occurred in Panyi mine; BaP ranked second, with a carcinogenic risk of 3.84 × 10⁻⁵–4.04 × 10⁻⁵. The carcinogenic risk of other PAHs through the ingestion and dermal exposure pathways were relatively small, about one order of magnitude lower than that of BaP and DBA (except for the ingestion pathway of BbF at Yue zhangji). Subsequent studies need to increase the focus on these two PAHs.
The carcinogenic risk of carcinogenic PAHs in the study area through the ingestion pathway was at the level of 10−5, which met the permissible limit of multi-element carcinogenic risk (1 × 10⁻⁴) and was at an acceptable level. However, the carcinogenic health risk from the dermal exposure pathway was 1.33 × 10⁻⁴–1.44 × 10⁻⁴, which exceeded the permissible limit (1 × 10⁻⁴) and was an unacceptable level. The carcinogenic risk values of other PAHs were below the 10−6 level and were negligible. In follow-up studies, further studies can be conducted in different age and gender groups using the dermal exposure pathway.
3.4.2. Non-Carcinogenic Health Risk
The non-carcinogenic risks from the ingestion and dermal exposure pathway were 9.51 × 10⁻⁵ –1.26 × 10⁻⁴ (<1) and 1.54 × 10⁻⁴ –1.90 × 10⁻⁴ (<1), respectively, which were negligible (See Table S9 for specific results). In addition, the total non-carcinogenic health risk caused by the ingestion pathway and dermal exposure pathway in the study area had no significant negative effect (HI < 1), and the total non-carcinogenic health risk caused by PAHs was at a low level (2.49 × 10⁻⁴–3.16 × 10⁻⁴). Among the three PAH monomers, Flt, Pyr, and BghiP caused higher non-carcinogenic risk in the dermal exposure pathway than the other monomers, and the sum of the three PAHs accounted for more than 80% of the non-carcinogenic risk in this pathway. For the ingestion pathway, the sum of the three PAH monomers, Flt, Pyr, and BghiP, accounted for about 50% of the non-carcinogenic risk of this pathway.
3.5. Discussion
The concentration of PAHs in the study area was 212–283 ng/L. Compared with other water bodies in China, this is higher than surface drinking water sources in the northeastern Inner Mongolia Autonomous Region [45] (66.39–164.5 ng/L) and lower than Taihu Lake [49] (255–7298 ng/L), the surface water of the Prince River in northeast China [48] (498.09–3218.27 ng/L in dry season). Compared with other water bodies, it is higher than the Bug River in Poland [50] (184.4 ng/L on average) and lower than the surface waters of the Damodar River basin in eastern India [52] (10,110 ng/L on average).
High-ring PAHs remain in the environment for a long time, and some of the high-ring PAHs are strongly carcinogenic. Hao et al. [70] found that surface water bodies in the Fengfeng coal mining area were dominated by high-ring PAHs. According to Figure 3, in this study, PAHs in the subsidence water bodies in the Huainan mining area were mainly high-ring PAHs.
In this study, the ecological risk of the subsidence water bodies for Panyi mine was at a medium–high level, which was consistent with the study result of Xiao [29] for the subsidence water body of Pangzhuang coal mine. Fan [14] et al. applied the species sensitivity distribution method to analyze the toxicity of PAHs in the water bodies of seven major river basins in China, and found that BaP was the most toxic to aquatic organisms, and Nap, Ace, Flu, and Phe had very low ecological risks to aquatic organisms. The results in this paper are the same as those. Compared with seven major river basins in China, the carcinogenic health risk of the intake pathway in the study area was 1.16 × 10⁻⁵–1.28 × 10⁻⁵, higher than that in Liao River (1.03 × 10⁻⁵), and lower than that in Yellow River (1.82 × 10⁻⁵) and Huaihe River (2.73 × 10⁻⁴) [14].
In this study, we not only clarified the high and low ecological risks of each PAH monomer using the RQ method, but also calculated the ecological risk generated by eight PAH monomers and using the SSD model. In addition, we obtained the proportion of high and low ecological risk levels of PAHs, the toxicity effect curve of PAHs on aquatic organisms, and evaluated the ecological risk of subsidence water bodies more comprehensively. However, due to the lack of aquatic toxicity data for most PAHs, not all PAHs could construct a complete species sensitivity distribution curve, and further exploration was needed in obtaining more aquatic toxicity data for PAHs.
Seven subsidence water bodies were selected for this study, but the area of each subsidence water body was large, and only a small number of points (1–2) were collected for each subsidence water body. Further research is needed to sample more water samples under the condition so that they are representative enough. In terms of human health risk evaluation, the different age groups and gender differences could be considered to refine the characteristics of the exposed population types so as to make the evaluation results more accurate.
4. Conclusions
In the study area, 16 PAHs were detected in the subsidence water bodies, and their total concentration levels ranged from 212 to 283 ng L−1. The PAH monomer with the highest average value was BbF. The PAH monomers with the same ring number showed highly significant positive correlations with each other and had similar environmental behavior and contamination sources. Three main factors were screened using factor analysis, which explained 88.37% of the total variance. Combined with the utilization of coal resources in Huainan, coal combustion was the main source of PAH pollution.
The ecological risk of PAHs was at a medium risk. The PAF value of Bap at the Panyi mine reached 3.94%, and Bap was the most toxic to aquatic organisms. By using the RA model, the acute joint ecological risk of the Panyi mine was found to be the highest. For the ingestion and dermal exposure pathways, BaP and DBA caused the highest incremental lifetime cancer risk. The carcinogenic risk from the ingestion pathway (1.16 × 10⁻⁵–1.28 × 10⁻⁵) was acceptable, while the carcinogenic risk from the dermal exposure pathway (1.33 × 10⁻⁴–1.44 × 10⁻⁴) was unacceptable (>1 × 10⁻⁴). The non-carcinogenic risks from both pathways were negligible.
Supplementary Materials
The following supporting information can be downloaded at: https://www.mdpi.com/article/10.3390/su151814003/s1, Table S1: Classification of ecological risk levels; Table S2: Species of aquatic organisms, statistical values of acute toxicity data for different species of aquatic organisms and SSD curve parameters; Table S3: Reference values for calculation of exposure dose and risk assessment of PAHs in water bodies; Table S4: Concentrations of PAHs in surface water samples collected in Huainan, China (ng·L−1); Table S5: Proportion of PAHs in water bodies with different ring composition in 7 subsidence water bodies in Huainan coal mining area; Table S6: Factor loadings and variance contributions of PAHs in subsidence water bodies; Table S7: Results of ecological risk evaluation of PAHs in subsidence water bodies; Table S8: Carcinogenic health risks of PAHs by ingestion and dermal exposure pathways; Table S9: Non-carcinogenic health risks of PAHs by ingestion and dermal exposure pathways. Figure S1: Multi-characteristic ratios of PAHs in subsidence water bodies; Figure S2: Three-dimensional view of the factor load. Reference [28] is cited in Table S1 and [32] in Table S3 in Supplementary Materials.
Author Contributions
X.D. analyzed the data and wrote the manuscript. G.C. reviewed and revised the manuscript, funding acquisition, supervision. H.W. was involved in data collection and discussion. H.S. was involved in discussion. All authors have read and agreed to the published version of the manuscript.
Funding
This work was funded by the National Natural Science Foundations of China (Grant Nos. 41471422) and the Top Notch Talents Program of Universities in Anhui Province (Grant No. 2019gxbjZD24).
Institutional Review Board Statement
Not applicable.
Informed Consent Statement
Not applicable.
Data Availability Statement
All associated data have been included in the text.
Conflicts of Interest
The authors declare no conflict of interest.
References
- National Bureau of Statistics of China. China Statistical Yearbook; China Statistics Press: Beijing, China, 2022. [Google Scholar]
- Feng, J.G.; Chang, J.; Zhang, Z.X.; Lu, T.M.; He, M.H. Distribution Characteristics of Polycyclic Aromatic Hydrocarbons in Raw Coal of Tengxian Coalfield, Shandong Province. Coal. Technol. 2019, 38, 91–93. (In Chinese) [Google Scholar] [CrossRef]
- Wang, Z.Q. Analysis and prevention of mined-out collapse in coal mine: An example from Changguang Coal Mine in Guangde County, China. West-China Explor. Eng. 2020, 32, 4–6. (In Chinese) [Google Scholar]
- Guo, J.X.; Hu, Z.Q.; Yuan, D.Z.; Liang, Y.S.; Li, P.Y.; Yang, K.; Fu, Y.K. Dynamic evolution of cultivated land fragmentation in coal mining subsidence area of the Lower Yellow River Basin: A case study of Jining city, Shandong Province. J. China Coal Soc. 2021, 46, 3039–3055. (In Chinese) [Google Scholar]
- Ma, L.; Gui, H.R. Characteristics and Source Identification of Heavy Metals in Subsidence Lake in Zhuxianzhuang Coal Mine in the North of Anhui Province, China. Earth Environ. 2017, 45, 277–282. (In Chinese) [Google Scholar]
- Liu, J.S.; Yan, J.P.; Xu, L.J.; Gu, B.; Zhang, L. Water Environment in Different Subsidence Pools of Huainan Coal-mining Area: Investigation and Evaluation. Environ. Sci. Technol. 2009, 32, 140–143. (In Chinese) [Google Scholar]
- Chen, G.Z.; Wang, X.M.; Wang, R.W.; Liu, G.J. Health risk assessment of potentially harmful elements in subsidence water bodies using a Monte Carlo approach: An example from the Huainan coal mining area, China. Ecotoxicol. Environ. Saf. 2019, 171, 737–745. [Google Scholar] [CrossRef] [PubMed]
- Jia, J. The Analysis and Evaluation of PanXie Collapse Water Environment Pollution Based on GIS. Ph.D. Thesis, Anhui University of Science and Technology, Huainan, China, 2012. [Google Scholar]
- Bi, Y.L.; Wang, H.C.; Xia, B.; Jiang, C.C.; Wu, W.Y.; Li, Z.L.; Li, S.M.; Su, H.; Bai, Z.H.; Xu, S.J.; et al. Pollution characterization and comprehensive water quality assessment of rain-source river: A case study of the Longgang River in Shenzhen. J. Environ. Sci. 2022, 43, 782–794. (In Chinese) [Google Scholar] [CrossRef]
- Meng, Y.; Liu, X.H.; Lu, S.Y.; Zhang, T.T.; Jin, B.C.; Qiao, W.; Tang, Z.R.; Liu, Y.; Guo, X.C.; Zhou, J.L.; et al. A review on occurrence and risk of polycyclic aromatic hydrocarbons (PAHs) in lakes of China. Sci. Total Environ. 2019, 651 Pt 2, 2497–2506. [Google Scholar] [CrossRef]
- Wang, Y.L.; Xia, Z.H.; Liu, D.; Qiu, W.X.; Duan, X.L.; Wang, R.; Liu, W.J.; Zhang, Y.H.; Wang, D.; Tao, S.; et al. Multimedia fate and source apportionment of polycyclic aromatic hydrocarbons in a coking industry city in Northern China. Environ. Pollut. 2013, 181, 115–121. [Google Scholar] [CrossRef]
- Wise, S.A.; Sander, L.C.; Schantz, M.M. Analytical methods for determination of polycyclic aromatic hydrocarbons (PAHs)—A historical perspective on the 16 U.S. EPA priority pollutant PAHs. Polycycl. Aromat. Compd. 2015, 35, 187–247. [Google Scholar] [CrossRef]
- Zhou, W.M.; Fu, D.Q.; Sun, Z.G. Blacklist of priority control pollutants in water. Environ. Monit. China 1990, 4, 1–3. [Google Scholar]
- Fan, B.; Wang, X.N.; Huang, Y.; Li, J.; Gao, Y.X.; Li, W.W.; Liu, Z.T. Distribution and risk assessment of polycyclic aromatic hydrocarbons in water bodies in seven basins of China. Environ. Sci. 2019, 40, 2101–2114. (In Chinese) [Google Scholar] [CrossRef]
- Dudka, S.; Miller, W.P. Accumulation of potentially toxic elements in plants and their transfer to human food chain. J. Environ. Sci. Health Part B 1999, 34, 681–708. [Google Scholar] [CrossRef] [PubMed]
- Menzie, C.A.; Potocki, B.B.; Santodonato, J. Exposure to carcinogenic PAHs in the environment. Environ. Sci. Technol. 1992, 26, 1278–1284. [Google Scholar] [CrossRef]
- Zeng, C.Y.; Xu, H.; Xu, Y.; You, S.H.; Wang, X.; Hu, Y.; Huang, S.E.; Bian, R.; Qi, W.X.; Lan, H.C.; et al. Distribution and health risk of polycyclic aromatic hydrocarbons (PAHs) and their derivatives in surface water of the Yangtze River. Acta Sci. Circum. 2021, 41, 4932–4941. (In Chinese) [Google Scholar] [CrossRef]
- Hudak, J.P.; McDaniel, J.; Lee, S.H.; Fuhrman, J.A. Mineralization potentials of aromatic hydrocarbons by estuarine microorganisms: Variations with season, location, and bacterioplankton production. Mar. Ecol. Prog. Ser. 1988, 47, 97–102. Available online: https://www.jstor.org/stable/24831561 (accessed on 12 September 2023). [CrossRef]
- Liu, Y.; Shen, J.M.; Chen, Z.L.; Ren, N.Q.; Li, Y.F. Distribution of polycyclic aromatic hydrocarbons in surface water and sediment near a drinking water reservoir in Northeastern China. Environ. Sci. Pollut. Res. 2013, 20, 2535–2545. [Google Scholar] [CrossRef]
- Huang, H.F.; Xing, X.L.; Zhang, Z.Z.; Qi, S.H.; Yang, D.; Yuen, D.A.; Sandy, E.H.; Zhou, A.G.; Li, X.Q. Polycyclic aromatic hydrocarbons (PAHs) in multimedia environment of Heshan coal district, Guangxi: Distribution, source diagnosis and health risk assessment. Environ. Geochem. Health 2016, 38, 1169–1181. [Google Scholar] [CrossRef]
- Zhang, J.; Wang, H.B.; Meng, X.Z.; Zhang, S.L.; Wang, Y.Z.; Xu, W.; Xu, M.X. Pollution characteristic and source identification of PAHs in typical surface water sources in Haihe Basin. Adm. Techn. Environ. Monit. 2020, 32, 61–64. (In Chinese) [Google Scholar]
- Chen, J. Distribution, Occurrence and Environmental Impact of Polycyclic Aromatic Hydrocarbons in Huainan Mining Area. Ph.D. Thesis, China University of Geosciences, Beijing, China, 2005. [Google Scholar]
- Mu, Y.M. Distribution Characteristics of POPs in Coal Mining Subsidence Area. Ph.D. Thesis, AnHui University of Science and Technology, Huainan, China, 2014. [Google Scholar]
- Chen, Y.J. Study on the Influence of DOM on the Environmental Behavior of PAHs in Coal Mining Subsidence Area. Ph.D. Thesis, AnHui University of Science and Technology, Huainan, China, 2017. [Google Scholar]
- Ren, Y.L.; Dong, S.C.; Yao, S.P. Spatial distribution characteristics of heavy metals in Huainan subsidence pond. Coal Geol. Explor. 2018, 46, 125–134. [Google Scholar]
- Cai, Y.L. Discussion on Characteristics and treatment measures of coal mining ground collapse in Huainan Mining area. West-China Explor. Eng. 2019, 31, 15–17. (In Chinese) [Google Scholar]
- Gdara, I.; Zrafi, I.; Balducci, C.; Cecinato, A.; Ghrabi, A. Seasonal occurrence, source evaluation and ecological risk assessment of polycyclic aromatic hydrocarbons in industrial and agricultural effluents discharged in Wadi El Bey (Tunisia). Environ. Geochem. Health 2018, 40, 1609–1627. [Google Scholar] [CrossRef]
- Nguyen, T.N.T.; Park, M.K.; Son, J.M.; Choi, S.D. Spatial distribution and temporal variation of polycyclic aromatic hydrocarbons in runoff and surface water. Sci. Total Environ. 2021, 793, 148339. [Google Scholar] [CrossRef] [PubMed]
- Xiao, S.H.; Zhou, F.; Fan, S.Q.; Wu, T. Investigation and ecological risk assessment of PAHs in subsidence water surrounding coal gangue Hillock. Environ. Monit. 2013, 5, 45–49. (In Chinese) [Google Scholar]
- Qiao, Y.; Yan, Z.F.; Feng, C.L.; Liu, N.; Liao, W.; Hong, Y.J.; Liu, D.Q.; Bai, Y.C. Applications and differences analysis of several typical models in species sensitivity distribution. Environ. Eng. 2021, 39, 85–92+109. [Google Scholar] [CrossRef]
- Wheeler, J.R.; Grist, E.P.M.; Leung, K.M.Y.; Morritt, D.; Crane, M. Species sensitivity distributions: Data and model choice. Mar. Pollut. Bull. 2002, 45, 192–202. [Google Scholar] [CrossRef] [PubMed]
- Cao, S.Z.; Duan, X.L.; Ma, Y.Q.; Zhao, X.G.; Qin, Y.W.; Liu, Y.; Li, S.; Zheng, B.H.; Wei, F.S. Health benefit from decreasing exposure to heavy metals and metalloid after strict pollution control measures near a typical river basin area in China. Chemosphere 2017, 184, 866–878. [Google Scholar] [CrossRef]
- Peng, C.; Chen, W.P.; Liao, X.L.; Wang, M.E.; Ouyang, Z.Y.; Jiao, W.T.; Bai, Y. Polycyclic aromatic hydrocarbons in urban soils of Beijing: Status, sources, distribution and potential risk. Environ. Pollut. 2011, 159, 802–808. [Google Scholar] [CrossRef]
- Rodgers, J.L.; Nicewander, W.A. Thirteen Ways to Look at the Correlation Coefficient. Am. Stat. 1988, 42, 59–66. [Google Scholar] [CrossRef]
- Liu, Y.X.; Shang, J.T.; Qian, H.; Wang, H.K.; Gao, Y.Y. Groundwater chemical characteristics and water quality evaluation in the main urban area of Xi’an. Environ. Chem. 2022, 41, 1976–1987. (In Chinese) [Google Scholar]
- Yang, T.; Chen, H.G.; Cai, W.G.; Qing, J.F.; Jia, X.P. Oxidative stress and damage of Perna viridis by exposure to phenanthrene and benzo(b)fluoranthene. South. China Fish. Sci. 2011, 7, 24–29. (In Chinese) [Google Scholar]
- Yang, T.; Chen, H.G.; Cai, W.G.; Qin, J.F.; Jia, X.P. Response of Antioxidant Enzymes Activities and Lipid Peroxidation Levels in Visceral Mass of Green-Lipped Mussel (Pernaviridis) to Benzo [b]fluoranthene Stress. Asian J. Ecotoxicol. 2011, 6, 539–545. (In Chinese) [Google Scholar]
- Du, H.J.; Gao, S.; Zhang, P.; Yang, Q.; Ning, J.Y.; Li, G.J. Research progress on toxic effects of benzo[b]fluoranthene and its effects on human health. J. Health Toxicol. 2020, 34, 214–219. (In Chinese) [Google Scholar]
- Yao, W.X.; Cao, X.L.; Xun, X.B. Evaluation of Benzo (a) pyrene emission from industrial briquette combustion flue gas. Environ. Pollut. Control. 1992, 14, 27–30. (In Chinese) [Google Scholar]
- Thomas, P.; Peter, S.; Christian, S. The use of toxic equivalency factors in assessing occupational and environmental health risk associated with exposure to airborne mixtures of polycyclic aromatic hydrocarbons (PAHs). Chemosphere 1996, 32, 639–648. [Google Scholar]
- GB5749-2006; Ministry of Health of the People’s Republic of China. Standardization Administration of China. Standards for Drinking Water Quality. Standards Press of China: Beijing, China, 2006.
- GB3838-2002; State Environmental Protection Administration; General Administration of Quality Supervision; Inspection and Quarantine of the People’s Republic of China. Environmental Quality Standards for Surface Water. China Environmental Press: Beijing, China, 2002.
- World Health Organization. Guidelines for Drinking Water Quality, 4th ed.; Shanghai Water Supply Dispatching and Monitoring Center, Shanghai Jiao Tong University: Shanghai, China, 2014. [Google Scholar]
- USEPA. National Recommended Water Quality Criteria; Office of Water & Office of Science and Technology: Washington, DC, USA, 2004. [Google Scholar]
- Zhang, K.F.; Chang, S.; Fu, Q.; Fan, Y.T.; Wang, E.R.; Sun, X.B.; Wang, S.J. Pollution characteristics and risks of polycyclic aromatic hydrocarbons in underground and surface drinking water sources in northeast inner Mongolia. Environ. Sci. 2022, 43, 3005–3015. (In Chinese) [Google Scholar] [CrossRef]
- Liu, Y.; Bu, Q.W.; Cao, H.M.; Zhang, H.D.; Liu, C.S.; He, X.F.; Yun, M.Q. Polycyclic Aromatic Hydrocarbons in Surface Water from Wuhai and Lingwu Sections of the Yellow River: Concentrations, Sources, and Ecological Risk. J. Chem. 2020, 2020, 8458257. [Google Scholar] [CrossRef]
- Xie, Z.L.; Gao, L.; Liang, Z.B.; Chen, J.Y.; Li, S.H.; Zhu, A.P.; Wu, Y.; Yang, Z.G.; Li, R.; Wang, Z.W. Characteristics, sources, and risks of polycyclic aromatic hydrocarbons in topsoil and surface water from the Liuxi River Basin, South China. Arch. Environ. Contam. Toxicol. 2020, 78, 401–415. [Google Scholar] [CrossRef]
- Wang, H.; Liu, C.Y.; Rong, L.G.; Sun, L.N.; Wang, Y.G.; Luo, Q.; Wu, H.; Wang, X.X. Polycyclic aromatic hydrocarbons in the surface water of the Taizi River in Northeast China. Polycycl. Aromat. Compd. 2020, 40, 219–227. [Google Scholar] [CrossRef]
- Kong, J.J.; Dai, Y.X.; Han, M.S.; He, H.; Hu, J.P.; Zhang, J.Y.; Shi, J.Z.; Xian, Q.M.; Yang, S.G.; Sun, C. Nitrated and parent PAHs in the surface water of Lake Taihu, China: Occurrence, distribution, source, and human health risk assessment. J. Environ. Sci. 2021, 102, 159–169. [Google Scholar] [CrossRef]
- Kluska, M. Dynamics of changes in the concentration of polycyclic aromatic hydrocarbons in selected Polish surface water. Environ. Prot. Nat. Resour. 2020, 31, 11–17. [Google Scholar] [CrossRef]
- Grmasha, R.A.; Abdulameer, M.H.; Stenger-Kovács, C.; Al-sareji, O.J.; Al-Gazali, Z.; Al-Juboori, R.A.; Meiczinger, M.; Hashim, K.S. Polycyclic aromatic hydrocarbons in the surface water and sediment along Euphrates River system: Occurrence, sources, ecological and health risk assessment. Mar. Pollut. Bull. 2023, 187, 114568. [Google Scholar] [CrossRef] [PubMed]
- Ambade, B.; Sethi, S.S.; Kurwadkar, S.; Kumar, A.; Sankar, T.K. Toxicity and health risk assessment of polycyclic aromatic hydrocarbons in surface water, sediments and groundwater vulnerability in Damodar River Basin. Groundw. Sustain. Dev. 2021, 13, 100553. [Google Scholar] [CrossRef]
- Yasmine, J.; Laaly, A.; Millet, M. Environmental occurrence, spatial distribution, and source identification of PAHs in surface and groundwater samples of Abou Ali River-North Lebanon. Environ. Monit. Assess. 2021, 193, 714. [Google Scholar] [CrossRef]
- Zhang, X.H.; Zhou, L.X. Environmental behavior of PAHs in soil-plant system. Ecol. Environ. 2003, 12, 487–492. [Google Scholar]
- Ministry of Environmental Protection. National Pollutant Environmental Health Risk List: Chemical Volume 1; China Environmental Press: Beijing, China, 2009. [Google Scholar]
- Bihari, N.; Fafandel, M.; Hamer, B.; Kralj-Bilen, B. PAH content, toxicity an genotoxicity of coastal marine sediments from the Rovinj area, Northern Adriatic, Croatia. Sci. Total Environ. 2006, 366, 602–611. [Google Scholar] [CrossRef]
- Liu, Y.; Chen, L.; Huang, Q.H.; Li, W.Y.; Tang, Y.J.; Zhao, J.F. Source apportionment of polycyclic aromatic hydrocarbons (PAHs) in surface sediments of the Huangpu River, Shanghai, China. Sci. Total Environ. 2008, 407, 2931–2938. [Google Scholar] [CrossRef]
- Liu, Z.F.; Lang, Y.H.; Cao, Z.M.; Ma, Q.M. Source Apportionment of PAHs in Estuarine Sediments from the Yellow River. Res. Environ. Sci. 2008, 21, 79–84. (In Chinese) [Google Scholar] [CrossRef]
- Jiang, Y.F.; Hu, X.F.; Yves, U.J.; Zhan, H.Y.; Wu, Y.Q. Status, source and health risk assessment of polycyclic aromatic hydrocarbons in street dust of an industrial city, NW China. Ecotoxicol. Environ. Saf. 2004, 106, 11–18. [Google Scholar] [CrossRef]
- Li, P.H.; Wang, Y.; Li, Y.H.; Wang, D.Z.; Liu, H.D.; Wang, W.X. Characteristic of concentration distribution and source analysis of PAHs in cloud/fog water at Taishan Mount. China Environ. Sci. 2010, 30, 742–746. (In Chinese) [Google Scholar]
- Wang, Z.; Lu, L.; Pei, J.G. Source analysis and ecological risk assessment of polycyclic aromatic hydrocarbons in surface sediments from suburban type underground river. Environ. Chem. 2020, 39, 2733–2741. (In Chinese) [Google Scholar] [CrossRef]
- Khalili, N.R.; Scheff, P.A.; Holsen, T.M. PAH source fingerprints for coke ovens, diesel and, gasoline engines, highway tunnels, and wood combustion emissions. Atmos. Environ. 1995, 29, 533–542. [Google Scholar] [CrossRef]
- Kavouras, I.G.; Koutrakis, P.; Tsapakis, M.; Lagoudaki, E.; Stephanou, E.G.; Baer, D.V.; Oyola, P. Source Apportionment of Urban Particulate Aliphatic and Polynuclear Aromatic Hydrocarbons (PAHs) Using Multivariate Methods. Environ. Sci. Technol. 2001, 35, 2288–2294. [Google Scholar] [CrossRef]
- Rogge, W.F.; Hildemann, L.M.; Mazurek, M.A.; Glen, R.C. Sources of fine organic aerosol. 2. Noncatalyst and catalyst -equipped automobiles and heavy-duty diesel trucks. Environ. Sci. Technol. 1993, 27, 636–651. [Google Scholar] [CrossRef]
- Cao, Z.G.; Liu, J.L.; Wang, X.M.; Xue, J. Pollution characteristics, ecological risk assessment and sources of polycyclic aromatic hydrocarbons (PAHs)in surface water from the Zhangweinan River. Acta Sci. Circum. 2010, 30, 254–260. (In Chinese) [Google Scholar]
- Zuckerman, A.J. IARC Monographs on the Evaluation of Carcinogenic Risks to Humans; World Health Organization: Geneva, Switzerland, 1994. [Google Scholar]
- Obanya, H.E.; Omoarukhe, A.; Amaeze, N.H.; Okoroafor, C.U. Polycyclic aromatic hydrocarbons in ologe lagoon and effects of benzo[b]fluoranthene in African catfish. J. Health Pollut. 2019, 9, 190605. [Google Scholar] [CrossRef]
- Traas, T.P.; Meent, D.V.D.; Posthuma, L.; Hamers, T.; Kater, B.J.; Zwart, D.D.; Aldenberg, T. The Potentially Affected Fraction as a Measure of Ecological Risk. In Species Sensitivity Distributions in Ecotoxicology; Posthuma, L., Suter, G.W., Eds.; Lewis Publishers: Boca Raton, FL, USA, 2002; pp. 315–343. [Google Scholar]
- Qin, N.; He, W.; Kong, X.Z.; Liu, W.X.; He, Q.S.; Yang, B.; Ouyang, H.L.; Wang, Q.M.; Xu, F.L. Ecological risk assessment of polycyclic aromatic hydrocarbons (PAHs) in the water from a large Chinese lake based on multiple indicators. Ecol. Indic. 2013, 24, 599–608. [Google Scholar] [CrossRef]
- Hao, C.M.; Liu, H.W.; Huang, L.; He, P.Y. Distribution characteristics and ecological risk assessment of polycyclic aromatic hydrocarbons in different types of water in Fengfeng mining field. China Min. Mag. 2018, 27, 93–98. (In Chinese) [Google Scholar]
Figure 1.
Distribution of sampling points in subsidence water bodies in Huainan coal mining area (Some points overlap due to their close proximity).
Figure 1.
Distribution of sampling points in subsidence water bodies in Huainan coal mining area (Some points overlap due to their close proximity).
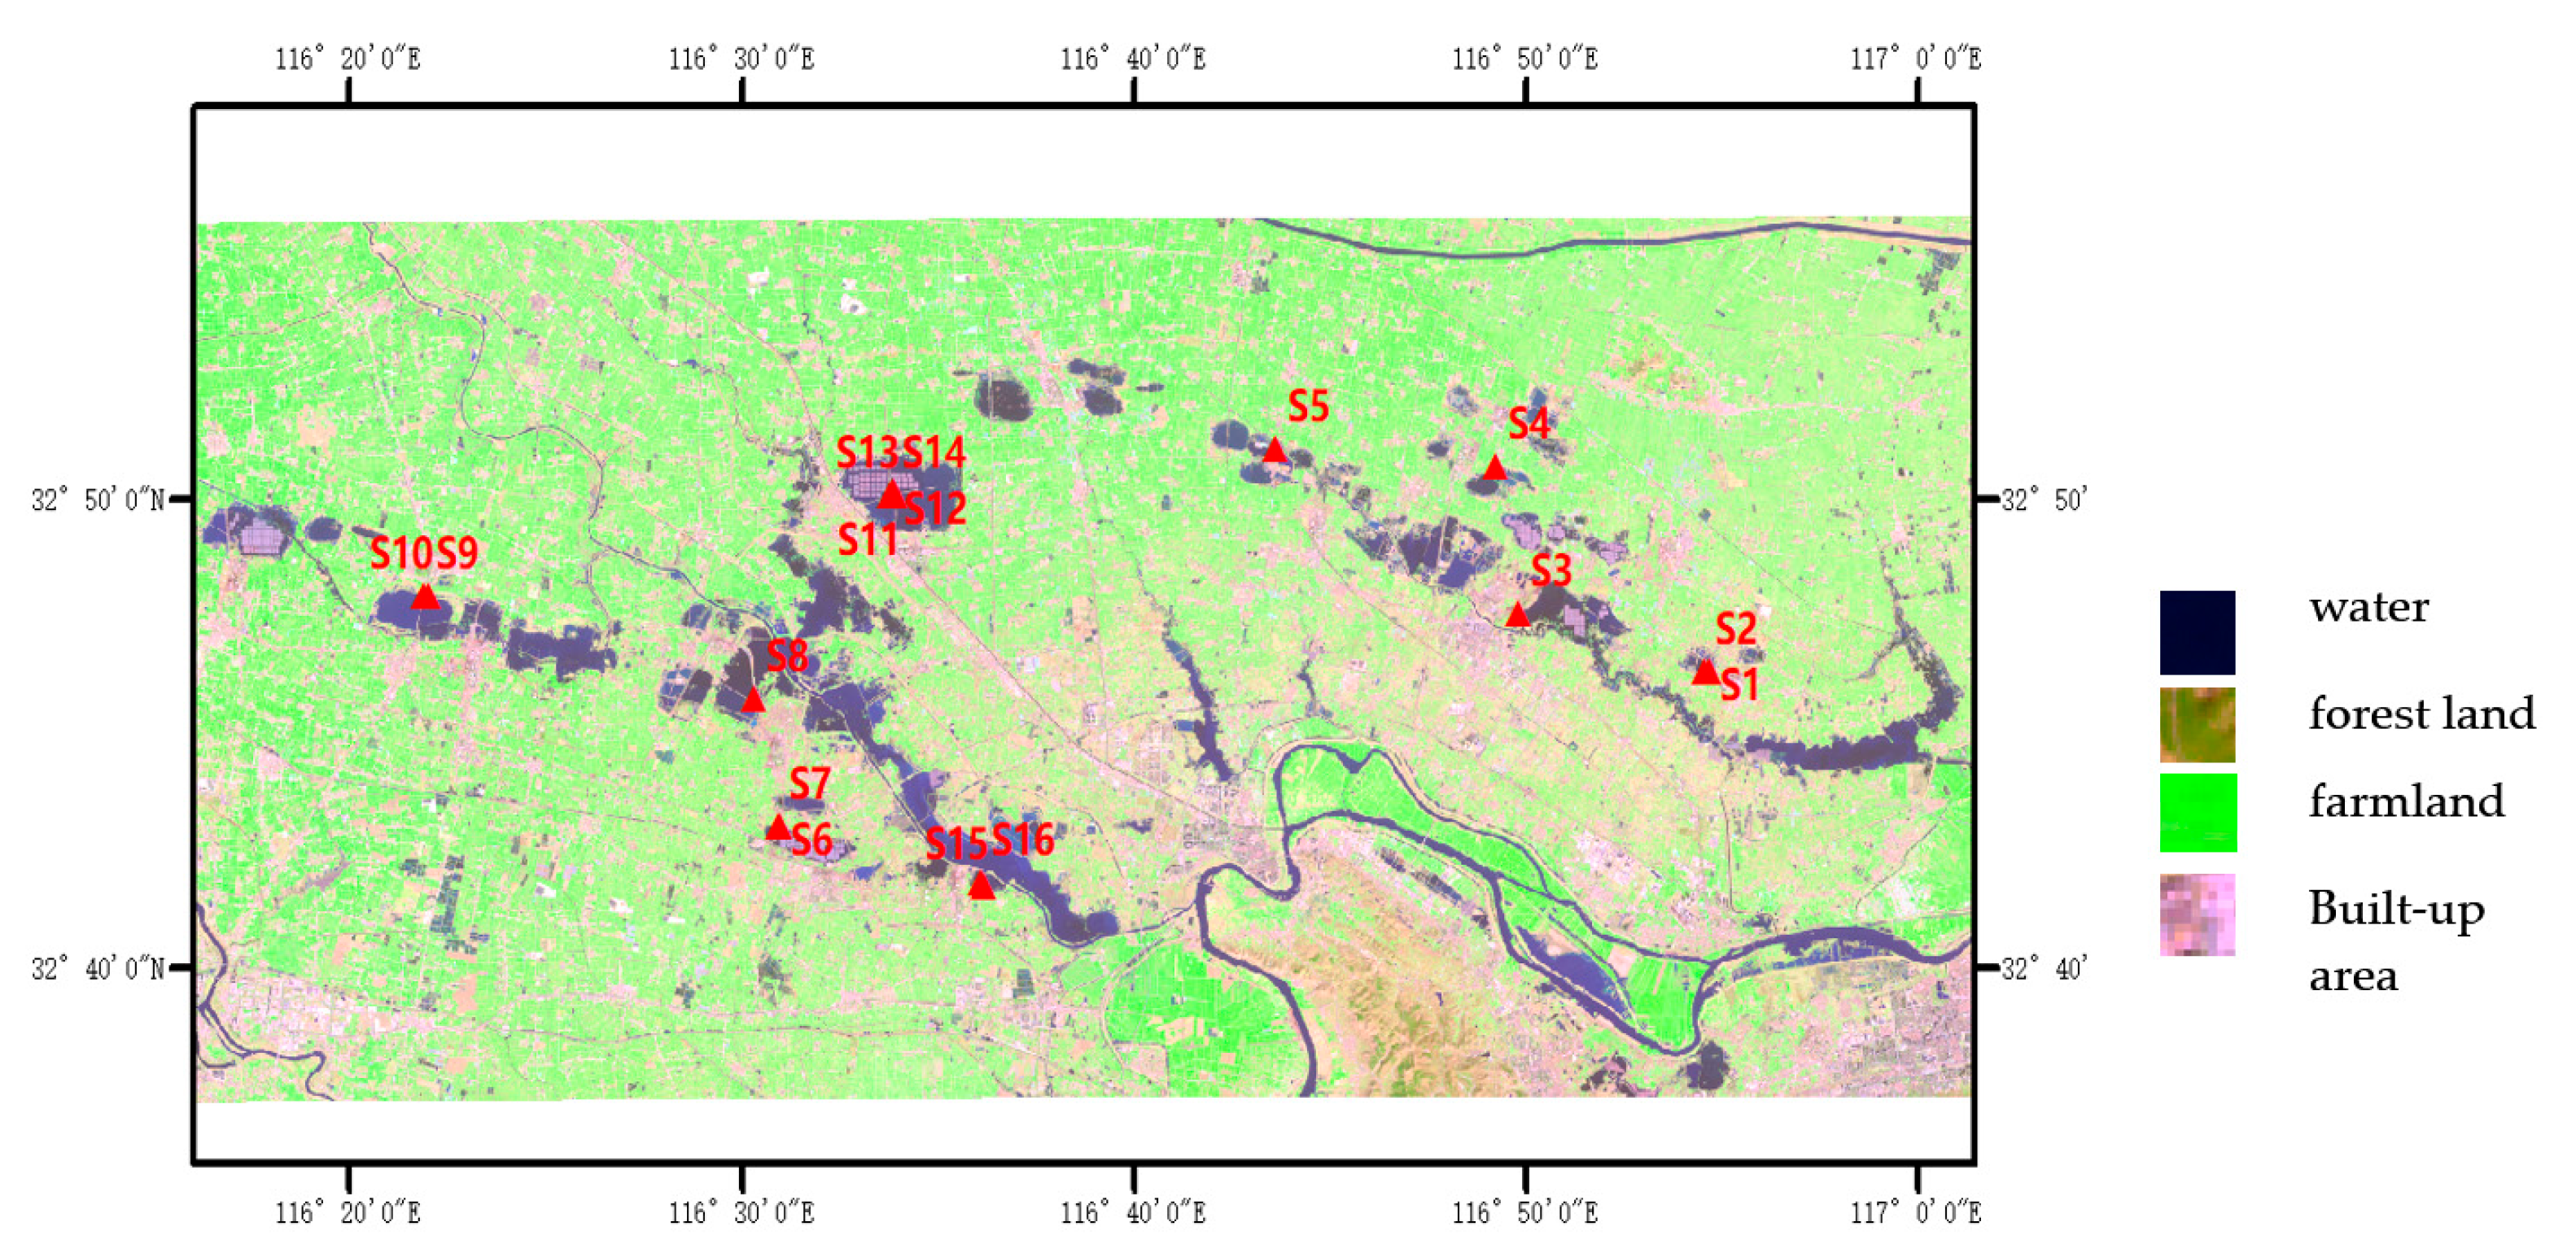
Figure 2.
Comparison of average concentrations of 16 PAHs monomers in Huainan subsidence water bodies (the error bars in the figure were plotted by the standard deviation of the data).
Figure 2.
Comparison of average concentrations of 16 PAHs monomers in Huainan subsidence water bodies (the error bars in the figure were plotted by the standard deviation of the data).

Figure 3.
Composition of PAHs in different subsidence water bodies of Huainan coal mining area.
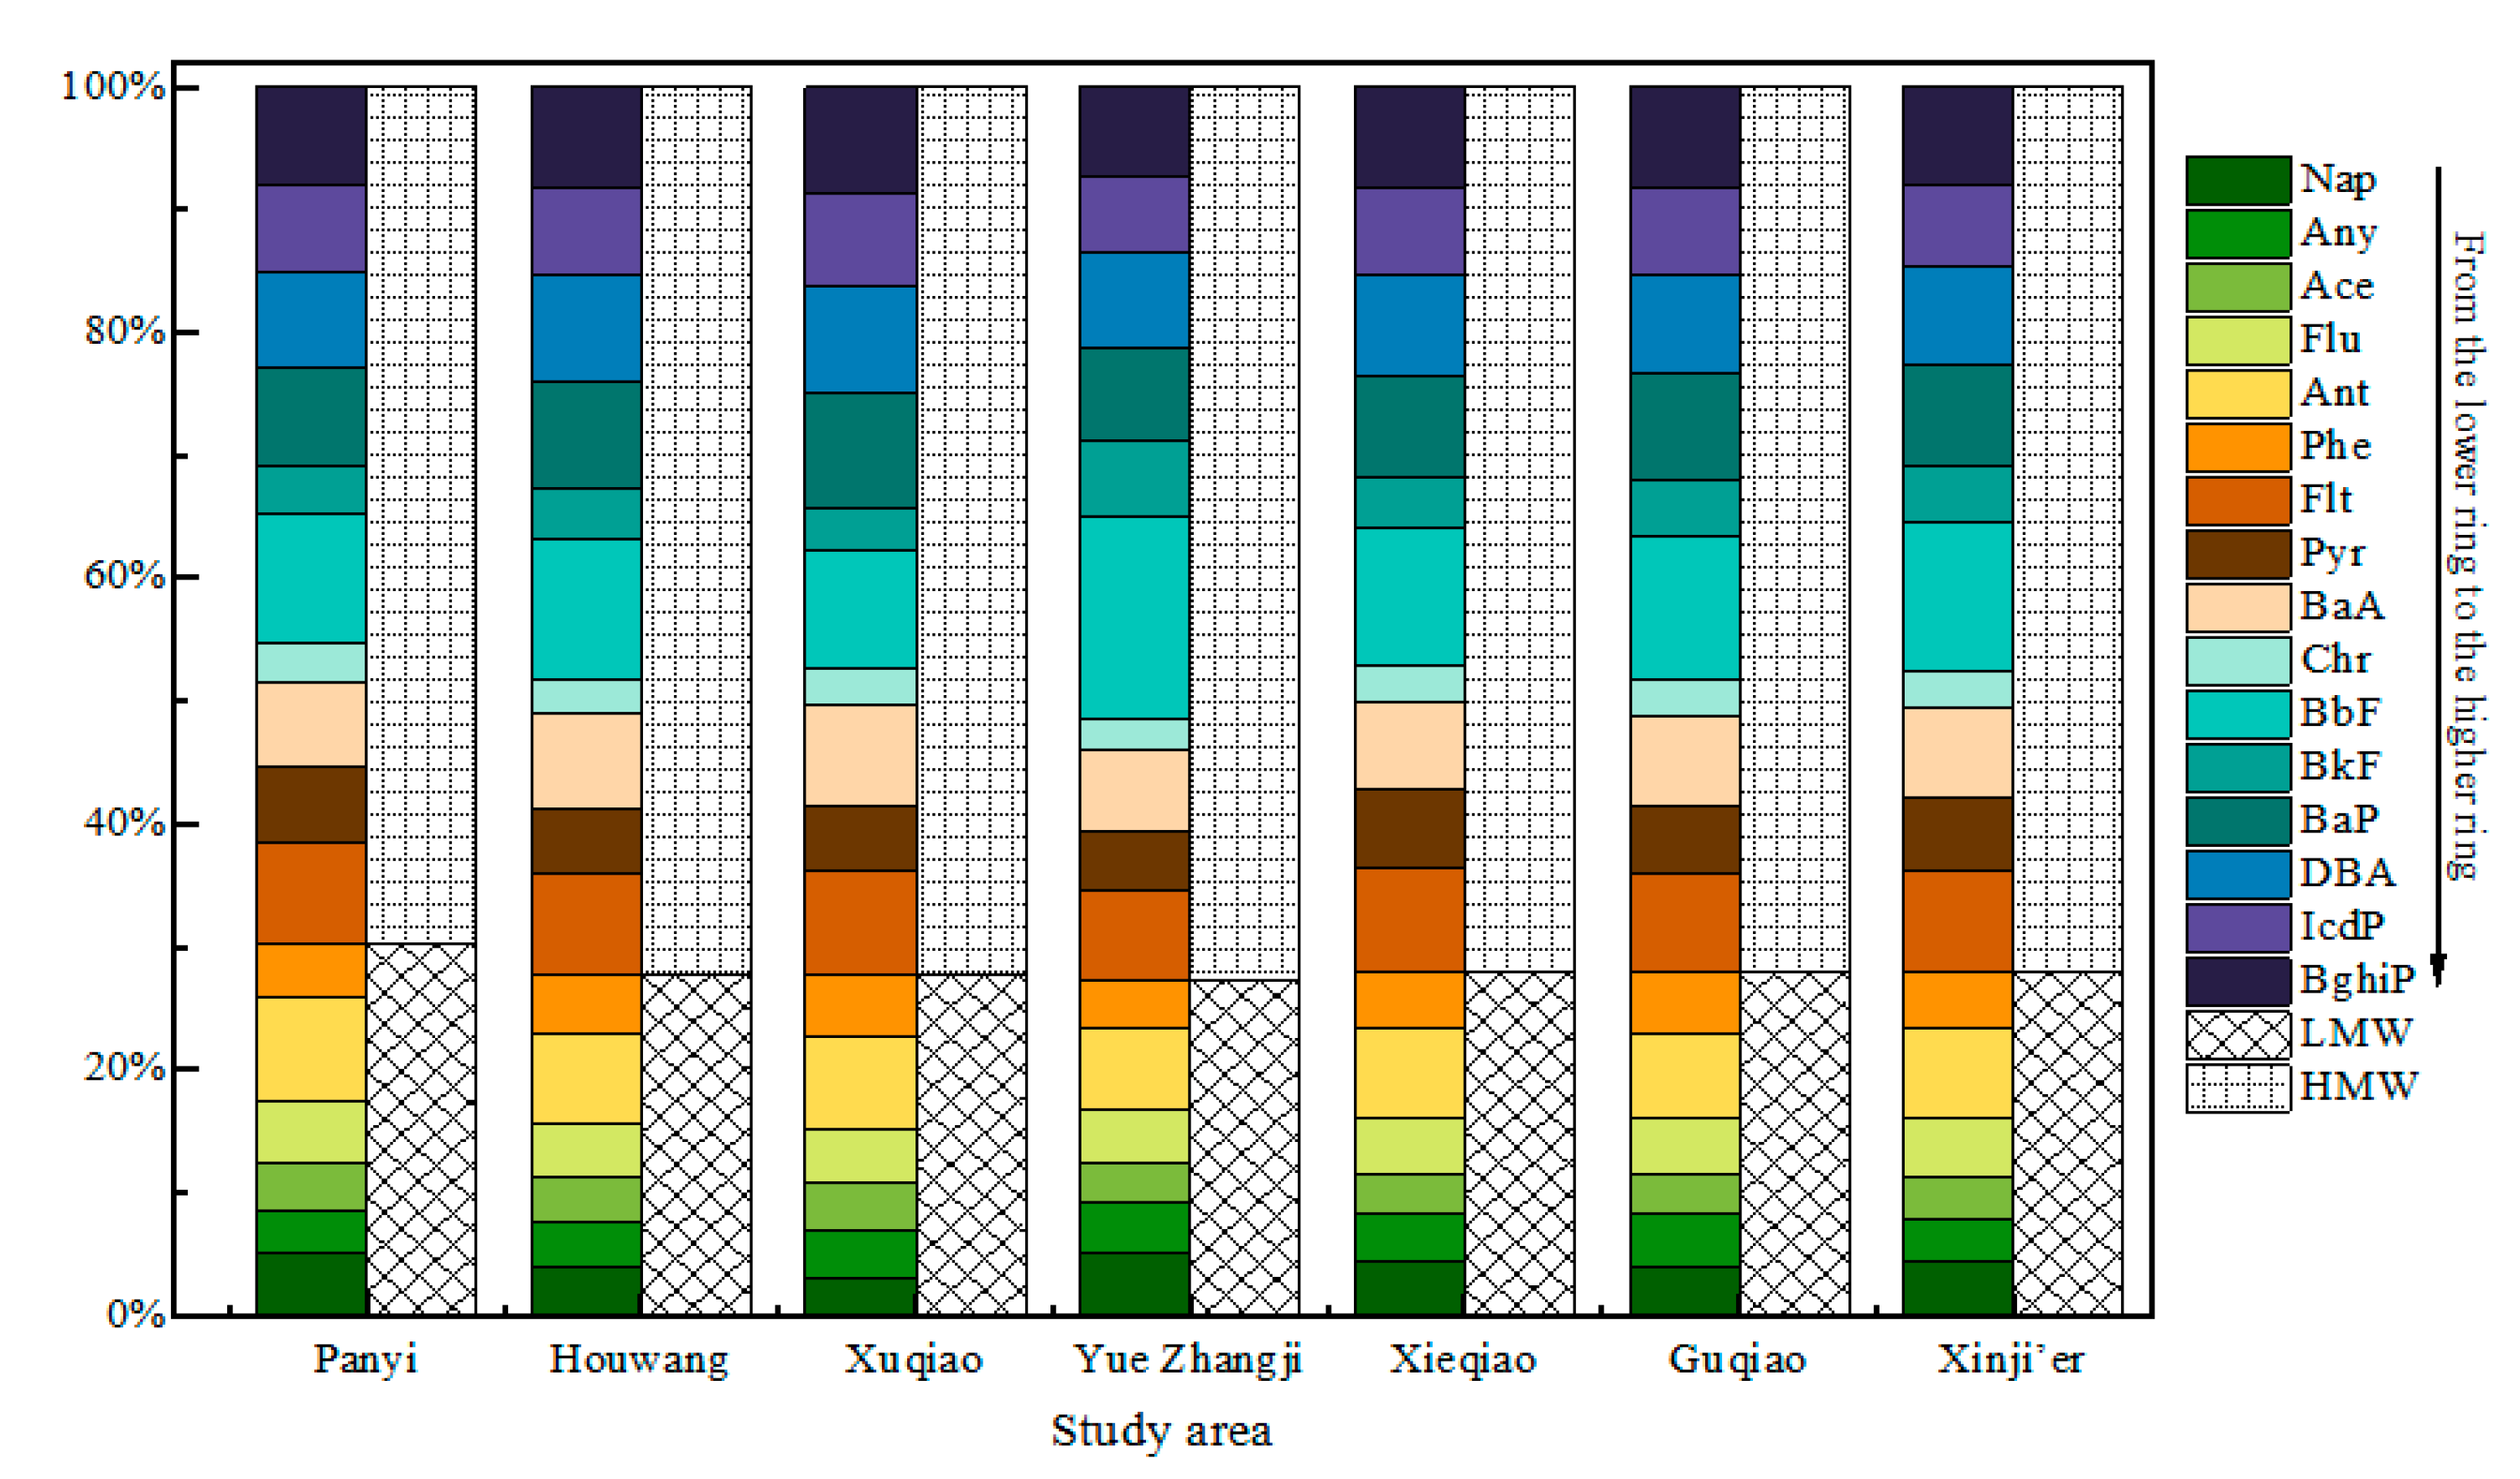
Figure 4.
Heat map of correlation coefficients of PAHs in Huainan subsidence water bodies (the size of the circle in the figure is related to the Pearson correlation coefficient, and the larger the absolute value of Pearson correlation coefficient, the larger the circle).
Figure 4.
Heat map of correlation coefficients of PAHs in Huainan subsidence water bodies (the size of the circle in the figure is related to the Pearson correlation coefficient, and the larger the absolute value of Pearson correlation coefficient, the larger the circle).

Figure 5.
Species sensitivity curves of 8 PAHs.

Table 1.
Comparison of PAH concentrations in different surface water bodies.
| Location | Content of ∑16PAHs (ng·L−1) | Sampling Time | Sources |
|---|---|---|---|
| Northeastern Inner Mongolia, China | 66.39–164.5 | August 2020 | [45] |
| The Wuhai section of the Yellow River, China | 27.5–234 | July 2019 | [46] |
| The Lingwu section of the Yellow River, China | 135–265 | July 2019 | [46] |
| The Haihe River, China | 83.7–278 | the summer of 2017 | [22] |
| The Liuxi River Basin, South China | 156.73–422.03 | April 2018 | [47] |
| The Taizi River, Northeast China | 498.09–3218.27 | May 2011 | [48] |
| The Lake Taihu, China | 255–7298 | January, May, and August 2018 | [49] |
| The Bug River, Poland | 184.4 (the average value) | January 2019 | [50] |
| the Euphrates River, Iraq | 464–992 | March to July 2022 | [51] |
| The Damodar River Basin, India | 10,110 (the average value) | February to April 2019 | [52] |
| The Abou Ali River Basin, Lebanon | ND-15162 | August 2015 to March 2017 | [53] |
Table 2.
HC5 of 8 PAHs monomers (ng·L−1).
| Item | Nap | Ace | Flu | Phe | Ant | Flt | Pyr | Bap |
|---|---|---|---|---|---|---|---|---|
| HC5 | 612,920 | 93,880 | 161,300 | 98,110 | 1640 | 9460 | 2610 | 40 |
Table 3.
Potential impact ratio of 8 PAHs in subsidence water bodies in Huainan coal mining area.
| Subsidence Area | PAFs/% | msPAF/% | ||||||||
|---|---|---|---|---|---|---|---|---|---|---|
| Nap (×10−6) | Ace (×10−6) | Flu (×10−5) | Phe (×10−9) | Ant (×10−1) | Flt (×10−4) | Pyr (×10−2) | Bap (×100) | msPAFCA (×10−2) | msPAFRA (×100) | |
| Panyi | 2.28 | 7.96 | 3.22 | 1.73 | 4.17 | 6.55 | 2.63 | 3.94 | 2.25 | 4.37 |
| Houwang | 1.27 | 5.81 | 2.21 | 1.55 | 3.51 | 4.96 | 1.94 | 3.87 | 1.65 | 4.23 |
| Xuqiao | 0.83 | 5.69 | 2.16 | 1.46 | 3.47 | 4.89 | 1.84 | 3.87 | 1.60 | 4.22 |
| Yue Zhangji | 2.25 | 6.24 | 2.65 | 1.49 | 3.57 | 5.22 | 2.14 | 3.87 | 1.75 | 4.24 |
| Xieqiao | 1.71 | 5.61 | 2.64 | 1.54 | 3.73 | 6.28 | 2.65 | 3.91 | 2.07 | 4.29 |
| Guqiao | 1.46 | 5.59 | 2.53 | 2.03 | 3.50 | 5.46 | 2.18 | 3.93 | 1.86 | 4.28 |
| Xinji’er | 1.57 | 5.30 | 2.74 | 1.50 | 3.65 | 5.49 | 2.36 | 3.87 | 1.83 | 4.25 |
Disclaimer/Publisher’s Note: The statements, opinions and data contained in all publications are solely those of the individual author(s) and contributor(s) and not of MDPI and/or the editor(s). MDPI and/or the editor(s) disclaim responsibility for any injury to people or property resulting from any ideas, methods, instructions or products referred to in the content. |
© 2023 by the authors. Licensee MDPI, Basel, Switzerland. This article is an open access article distributed under the terms and conditions of the Creative Commons Attribution (CC BY) license (https://creativecommons.org/licenses/by/4.0/).
Share and Cite
MDPI and ACS Style
Deng, X.; Chen, G.; Wang, H.; Sun, H. Pollution Characteristics and Risk Evaluation of PAHs in Subsidence Water Bodies in Huainan Coal Mining Area, China. Sustainability 2023, 15, 14003. https://doi.org/10.3390/su151814003
AMA Style
Deng X, Chen G, Wang H, Sun H. Pollution Characteristics and Risk Evaluation of PAHs in Subsidence Water Bodies in Huainan Coal Mining Area, China. Sustainability. 2023; 15(18):14003. https://doi.org/10.3390/su151814003
Chicago/Turabian StyleDeng, Xinyue, Guangzhou Chen, Hua Wang, and Hui Sun. 2023. "Pollution Characteristics and Risk Evaluation of PAHs in Subsidence Water Bodies in Huainan Coal Mining Area, China" Sustainability 15, no. 18: 14003. https://doi.org/10.3390/su151814003
Note that from the first issue of 2016, this journal uses article numbers instead of page numbers. See further details here.