
Towards a Sustainable Future: Economic Cybernetics in Analyzing Romania’s Circular Economy


Department of Economic Informatics and Cybernetics, Bucharest University of Economic Studies, 0105552 Bucharest, Romania
*
Author to whom correspondence should be addressed.
Sustainability 2023, 15(19), 14433; https://doi.org/10.3390/su151914433
Submission received: 23 August 2023
/
Revised: 21 September 2023
/
Accepted: 28 September 2023
/
Published: 2 October 2023
Abstract
:The Circular Economy represents an essential strategy for a more sustainable future, both for the environment and for the economy and society. The main purpose of this article is to conduct a holistic analysis that highlights Romania’s perspectives in the transition and integration process towards the Circular Economy. In this research, we will use economic cybernetics and complex adaptive systems to uncover the complexity of the Circular Economy. Our aim is also to identify the connections and interactions among its various components. To complete this holistic analysis framework, multiple linear regression (MLR) and autoregressive distributed lag (ARDL) models were employed. MLR was applied to assess the impact of variables such as Waste per capita, Recycling rate by region, Labor productivity, Production of environmental goods, and Circular material use rate on real Gross Domestic Product (GDP) per capita. The time series are extracted from Eurostat databases and cover the period 2010–2021. Given the results obtained through MLR, we applied the ARDL model to study the long-run and short-run causal impact of independent variables on real GDP per capita. The analysis results led us to create an ARDL model from another perspective, namely, to examine how greenhouse gas emissions from production activities and labor productivity per person employed and hour worked affect the generation of municipal waste per capita. Our study delves into the Circular Economy as a pivotal strategy for fostering sustainability, offering an exhaustive, data-backed analysis of its effects on economic performance and environmental health in Romania. In light of our findings, we strongly recommend that future policy development in Romania should be aligned with the National Strategy for the Circular Economy. This would facilitate a more effective transition to sustainable practices, not only enhancing economic indicators but also reducing environmental impact.
1. Introduction
According to the European Parliament [1], a production and consumption paradigm known as the “Circular Economy” emphasizes sharing, renting, reusing, repairing, and recycling old goods for as long as possible. The life cycle of items is extended in this way. In practice, it refers to minimizing waste. When a product reaches the end of its useful life, recycling helps to keep as many of its components in the local economy as possible. These can be productively applied repeatedly, adding more value. The standard, linear economic paradigm, which is built on a take-make-consume-throw-away cycle, is disregarded by this. This concept depends on a lot of inexpensive, readily available energy and materials. Planned obsolescence, in which a product is made to have a short lifespan to entice customers to buy it again, is also included in this concept. The European Parliament has demanded action against this behavior. Chen et al. [2], in their study, explore eco-efficiency in the context of rapid economic development and environmental pollution. Advanced econometric methods are used to analyze data from the top 10 most polluted countries, evaluating the impact of green technology and natural resource rents. The results indicate a complex relationship between financial development and eco-efficiency. In the context of this analysis, the European Parliament urges the adoption of the Circular Economy model, which emphasizes reuse and recycling, as a strategy for improving eco-efficiency. This model contrasts with the current linear economic paradigm, which relies on a large amount of cheap, readily available energy and materials, and also includes the practice of planned obsolescence.
Currently, within this context, the European Union’s focus on advancing the Circular Economy is evident through a range of strategies, measures, and regulations. These initiatives are designed to guide and assist Member States in their efforts to transition to a Circular Economy. Consequently, Romania is required to conform to European directives in this regard. The Circular Economy (CE) can represent an essential strategy for a more sustainable future, both for the environment and for the economy and society. This is why our research topic is extremely important, especially considering that Romania is still in the early stages of integrating the Circular Economy. Transitioning to a CE can help promote the rational use of finite resources. Through recycling, reusing, and remanufacturing, it reduces dependence on limited raw materials. On the other hand, pollution and its associated externalities are significant issues both nationally and globally, given their impacts on climate change and weather patterns. From this perspective, the Circular Economy aids in waste reduction, thereby decreasing pollution and contributing to environmental protection and human health. From an economic standpoint, reusing and recycling materials can lead to cost reductions for companies and governments by reducing expenditures on raw materials and waste management [3]. Furthermore, Romania’s transition to a CE can create new job opportunities [4] in sectors such as recycling, remanufacturing, and resource management. Moreover, diversifying resources and reducing dependence on raw materials can make national and global economies more resilient to market shocks and fluctuations. Although Romania is still in an initial phase, transitioning from a linear economic system to a circular one is a complex and lengthy process that would bring not just ecological benefits, but also long-term economic and social advantages. At this stage, it is crucial to acknowledge that economic and social progress is closely tied to the impacts of human activities on the environment. In developing a circular economic model, we must focus on protecting and enhancing natural capital to sustain ecosystems and minimize pollution, such as emissions and waste.
The present research aims to conduct a comprehensive analysis of the transition and integration of the Circular Economy in Romania using an approach from the perspective of systems thinking and statistical analysis. Such an approach represents a novelty in the existing literature, which can contribute to its development.
The Circular Economy is inherently complex, characterized by numerous interdependencies and feedback loops. The economic cybernetics approach can assist in unveiling and comprehending these complexities, by identifying connections and interactions among various components within the CE. Moreover, through the use of complex adaptive systems models, it becomes possible to develop tools that aid in optimizing economic processes within the Circular Economy. This can lead to more efficient resource management and reduced losses. Additionally, the economic cybernetics approach can pinpoint vulnerable or critical points within the Circular Economy, enabling authorities and organizations to focus their efforts on resolving issues that might otherwise disrupt the system’s functionality.
Additionally, the use of econometric models such as multiple linear regression (MLR) and the Autoregressive Distributed Lag (ARDL) model can provide a multifaceted approach to understanding, implementing, and optimizing the CE in Romania. ARDL specializes in analyzing both short-term and long-term relationships between variables. This is valuable in the context of the Circular Economy as it allows for an understanding of both immediate effects and long-term impacts on the environment and the economy. By utilizing empirical data and models, multiple linear regression and ARDL can contribute to the development and optimization of public policies that facilitate the transition to the Circular Economy in Romania. This can lead to improved coordination and better outcomes in terms of sustainability and resource management. These approaches can help form a well-grounded strategy and guide decision making based on concrete data, providing a holistic perspective of analysis.
In the context of growing global challenges related to environmental degradation, resource depletion, and climate change, the adoption of a Circular Economy is becoming increasingly crucial as a pathway to a sustainable future. Our study contributes to the development of specialized literature on the subject of transitioning from a linear to a Circular Economy in Romania. This research distinguishes itself by utilizing sophisticated analytical tools such as economic cybernetics and complex adaptive systems, along with multiple linear regression and autoregressive distributed lag models. These tools allow us to dissect the complexity and interconnectedness of Circular Economy variables, such as waste per capita and recycling rates, and their impact on Romania’s economic performance and environmental health. In light of our findings, we strongly emphasize the need for future policy development in Romania to align with the National Strategy for the Circular Economy, thereby facilitating a more effective transition to sustainable practices that not only improve economic indicators but also reduce environmental impact.
The research presents the following structure: Section 2 presents the current state of knowledge in the field. The research has curated the most pertinent studies within the realm of econometric models applied to the Circular Economy. Additionally, it has gathered specific investigations that adopt a comprehensive viewpoint rooted in economic cybernetics when scrutinizing this new economy. Given the distinctive nature of this article in its endeavor to embrace a holistic outlook through the lens of cybernetic systems, it aims to complement the existing literature in this domain. Section 3 expounds on the conceptual underpinnings of cybernetics approaches, which will be harnessed in Section 4, as well as elucidating the methodology underpinning the MLR and ARDL models employed in Section 5. Section 6 is dedicated to discussions about the importance of transitioning to a Circular Economy, as well as the analysis of the variables used in our models in the context of the COVID-19 pandemic. Section 7 and Section 8 shed light on the practical case study undertaken in this research. The study culminates with a section dedicated to outlining its constraints, proposing avenues for future research, and presenting its conclusions.
2. The Stage of Knowledge in the Field
The Circular Economy is an economic and sustainable concept aimed at reducing resource waste, optimizing material utilization, and minimizing environmental impact through the design, manufacturing, utilization, and recycling of products in the most efficient and sustainable manner. In the context of Romania, the CE holds significant potential to contribute to sustainable economic development and environmental protection. In recent years, the concept of the Circular Economy and its integration in Romania has become a highly important aspect gaining traction in the specialized literature, yet is still considered a relatively novel process given the stage of Circular Economy integration in the country.
Regarding researchers’ interest in the Circular Economy, we used the Web of Science (WoS) to search for the number of ISI publications on the topics “Circular Economy”, “recycling rate”, and “sustainable policies”.
Based on the data related to the number of ISI publications from the WoS for the years 2010–2023, which are graphically represented in Figure 1, there is a continuous and significant increase in academic interest in the fields of the Circular Economy, recycling rate, and sustainable policies. The Circular Economy has experienced a remarkable rise in recent years, possibly reflecting a paradigm shift in how resources are managed and recycled. At the same time, the recycling rate shows a slower and more steady growth, which could indicate the maturity of the subject in research. In contrast, sustainable policies continue to be a prominent field of research, having the highest number of publications each year and recording consistent growth throughout the analyzed period.
These trends suggest a growing academic focus on comprehensive solutions to environmental and social issues. The impact of global events, such as the COVID-19 pandemic, appears to have reinforced this interest, highlighting the importance of developing more sustainable policies and practices. Overall, these data reflect a rising academic and research awareness of the importance of sustainability and the need to develop effective resource management and environmental conservation strategies.
According to Figure 2, the data from the Web of Science show that academic interests in the Circular Economy, recycling rates, and sustainable policies vary considerably across different fields of study. Predominantly, “Environmental Sciences” leads in all three categories, indicating a significant concentration of research on sustainability and resource management within this field. “Green Sustainable Science Technology” and “Environmental Engineering” also stand out, particularly in the areas of Circular Economy and recycling rates, underscoring the role of technology and engineering in promoting sustainable practices. On the other hand, “Environmental Studies” and “Management” show strong interest in sustainable policies but much less in recycling rates. This may suggest that the focus in these fields is more on the formulation and implementation of policies rather than the technical aspects of recycling. “Economics” and “Business” also have a significant number of publications in the area of sustainable policies, indicating a growing interest in integrating sustainability considerations into economic and business decision making.
Overall, these data reflect a multidisciplinary approach to sustainability issues, with various academic fields contributing to the dialogue and research in this expanding space. The fact that these subjects are represented in so many different fields demonstrates the importance and urgency of sustainability-related issues in the academic and research context.
Vermeșan et al. [5] emphasize in their article that, despite the Circular Economy being a highly popular concept in the European Union space, and even though interest in the characteristics of the new economic model in Romania has grown in recent years, the available Romanian specialized literature is still insufficiently structured. Thus, in their research [5], the authors aimed to debate the theme of the Circular Economy in order to analyze the stage of CE implementation in Romania.
Topliceanu et al. [6] analyzed the degree of Circular Economy implementation in Romania in their research using 10 monitoring indicators defined by the European Commission. The authors conducted a comparative study between the level of CE implementation in Romania and the EU, based on data published by Eurostat. The authors’ research conclusion was that despite Romania having an economy affected by current crises, it is progressing in the transition from a linear to a Circular Economy. Dobre-Baron et al. [7] highlighted in their research Romania’s perspectives on the transition process towards the CE, considering the trends recorded at the European level.
In order to explore consumer behaviors and attitudes, Lakatos et al. [8] conducted a nationwide online questionnaire survey that was distributed across four macro-regions in Romania. The research findings by the authors highlighted that generations X, Y, and Z agree on environmental protection and resource consumption reductions, as well as recycling and waste reuse. Despite understanding these benefits, their study indicated that the majority of respondents have not adopted and do not intend to adopt consumption patterns based on the Circular Economy.
Modoi and Mihai [9], in their article, investigated the connections formed between e-waste and end-of-life vehicle (ELV) streams and the CE approach of the European Union. Specifically, Romania was analyzed as a relevant case study for the Central and Eastern European region regarding the best Circular Economy initiatives related to electronic waste, including the opportunity to create new jobs. Furthermore, the authors highlighted the current knowledge gaps and future research directions for these special waste streams in Romania and beyond.
The paradigm shift in the contemporary market economy [10], which is functional and highly competitive, and in established economic structures has necessitated the adoption of innovative economic models that are both profitable and environmentally sustainable, capable of providing high levels of economic well-being and social protection.
Consequently, Drăgoi et al. [10] conducted research to analyze how the developments of the CE in Romania can be identified within the new sustainability paradigm using econometric models. The authors used the LLC test and the IPS test, which were described by Levin, Lin, and Chu in 2002 (LLC) [11] and by Im, Pesaran, and Shin in 2003 (IPS) [12]. These tests are employed to assess the presence of the unit root. Consequently, the authors constructed an autoregressive model [10].
Botezat et al. [13] conducted a study that focuses on identifying how manufacturers in Romania implement Circular Economy principles and evaluating their performance in this regard, aiming to formulate recommendations for the future. To achieve this, the authors conducted a survey among Romanian firms and applied a cluster analysis based on their level of green-oriented supply chain cooperation. The results of the research indicate that belonging to a particular group of firms partially influences Circular Economy practices and significantly affects performance in this direction.
Tripa and Indrie [14] conducted a study to investigate the fate of textile waste in Romanian households under the condition that the population is aware of the environmental impact of textiles and the appropriate recycling methods. Through an online survey, they found that only a small portion of unused clothing items are disposed of in the trash. However, there is a concern that this quantity may increase in the future because most citizens are not informed about the existence of recycling centers or because these centers are not available in their localities.
In the case of quantitative case studies, several researchers have employed autoregressive models to analyze the CE. For instance, Tiwari et al. [15] examined the impact of the Circular Economy on CO2 emissions growth using Quantile Autoregressive Distributed Lags (QARDL) models. Their findings indicate that the Circular Economy and the stringency of climate policies have a significantly negative impact on carbon emissions.
Another analysis that can be indirectly related to the CE is the one conducted by Androniceanu et al. [16], which examines the renewable energy sector in Romania using an approach that integrates economic cybernetics and the ARDL model.
In another study conducted by Xu et al. [17], the ARDL estimation technique was used to measure the impact of logistics digitalization on the efficiency of natural resource utilization and depletion. The case study covered the analysis period from 1990 to 2021 and focused on China. The study found that logistic digitization has a positive impact on the efficiency of natural resource utilization in China, both in the short and long term. This suggests that investments in information technology can contribute to more efficient use of natural resources and sustainable development in China. Practical implications include the development of a regional digital logistics network and the expansion of financing markets for ecological projects. Khan et al. [18] explore another perspective with an impact on the Circular Economy (CE), specifically examining the role of blockchain technology in the CE to improve organizational performance in the context of the China–Pakistan Economic Corridor (CPEC). A closed-ended questionnaire was used to collect data from 290 respondents in manufacturing firms, which were then analyzed using structural equation modeling. Their findings indicate that blockchain technology, with features such as visibility, transparency, relationship management, and smart contracting, plays a positive role in the Circular Economy. Moreover, it was found that green practices have a positive impact on both the economic and environmental pathways concerning firms’ performance. Ultimately, both economic and environmental performances contribute to the improvement of organizational performance.
Regarding the integration of a cybernetic approach into Circular Economy sector analysis, the existing literature has not yet explored this perspective. Our study serves as a starting point for further research in this field and represents a novelty in the current state of knowledge in this domain.
Kabirifar et al. [19] conducted a study focusing on Construction and Demolition Waste (CDW) management within the framework of the CE. The research identifies and prioritizes significant factors affecting CDW management throughout its entire lifecycle, from preconstruction to end-of-life. By employing a cybernetic, fuzzy multicriteria approach, factors such as “on-site sorting, reusing, and recycling of waste materials”, “various procurement models”, and “precise implementation of waste management regulations” were identified as the most important. This study contributes to understanding how CDW can be efficiently managed in construction and demolition projects within the Circular Economy context.
Starting from the premise that consumer contribution is crucial in the CE, the case study conducted by Stoica et al. [20] proposes a model based on the cybernetic principle of external complementarity, applied to consumer behavior, with the aim of minimizing the impact on the environment. Using the data collected within the model and a factor reduction analysis, the most significant elements in the process of generating new production resources were identified.
Through its systemic approach, the study highlights the connections between the factors influencing consumer behavior in the context of the natural environment, thus providing crucial information to manufacturing organizations for the transition from a linear to a Circular Economy.
Chirita et al. [21] analyze the Circular Economy in their research from the perspective of a cybernetic approach, which involves integrating it into a complex adaptive system. Additionally, the authors employ the ARDL model to examine both long-term and short-term causality between renewable energy as the dependent variable and its determinants, such as real GDP per capita, net greenhouse gas emissions, and others. The results highlight not only the dependencies between renewable energy and macroeconomic factors but also the incorporation of the Circular Economy into a cybernetic system. Delcea et al. [22] examined the positive relationship between consumers’ attitudes, awareness, self-efficacy, social norms, and their intention to recycle e-waste in Romania. Additionally, it found that demographic variables such as age and gender can influence residents’ pro-e-waste recycling behavior. These findings can provide guidance to decision makers in developing more effective policies for e-waste management.
3. Materials and Methods
3.1. Exploring Complexity in Economic Analysis: Cybernetics and Complex Adaptive Systems
Economic Cybernetics applies cybernetics principles to tackle intricate economic challenges. It employs systemic models to structure problems and systematically describes the relationships among various economic components [23,24], integrating their functions. The cybernetics of economic systems is a field that extends cybernetics’ principles, methods, and specific models to analyze and manage complex economic systems within dynamic and intricate environments [24]. This approach emphasizes comprehending the interactions between various components and the feedback mechanisms that arise within economic systems. The overarching goal of this holistic analysis, rooted in cybernetics, is to create models and methodologies that optimize economic processes, enhance decision making, and attain desired economic outcomes. Through the application of cybernetics tools and concepts, economic cybernetics aims to tackle issues related to economic stability, efficiency, and adaptability. It provides a framework for analyzing and predicting economic behavior [25].
Complexity theory, which emerged in the mid-1980s at the Santa Fe Institute in New Mexico, primarily focuses on the study of Complex Adaptive Systems (CAS) [26]. This CAS movement is predominantly rooted in the American context, differing from the European “natural science” tradition within cybernetics and systems. Similar to cybernetics and systems theory, CAS investigates the fundamental properties of complex systems that transcend traditional disciplinary boundaries. Nevertheless, CAS stands out by extensively utilizing computer simulations as a research tool and concentrating on systems such as markets or ecologies, which exhibit lower levels of integration or “organization” compared to those explored by the older tradition, such as organisms, machines, and companies [27].
The focus of economic cybernetics today is centered on applying the principles, techniques, and ideas of cybernetics to examine, construct models for, and oversee intricate economic systems within dynamic and unpredictable environments [25,26,27,28]. These systems are characterized as complex adaptive systems, and their attributes are thoroughly described by this field of study.
Figure 3 depicts how a system is examined through a cybernetic lens, identifying various feedback mechanisms that the control operator manages. These mechanisms serve either to stabilize the system or to amplify a particular effect.
As far back as 1997, Kevin Dooley provided a definition for Complex Adaptive Systems (CAS) as a collection of semi-autonomous agents that engage in interconnected interactions, giving rise to overarching patterns within the system [29]. These patterns, in turn, exert an influence on the behavior of the agents. Within human systems of various scales, we observe the emergence of patterns resulting from interactions among the agents within that system. These interactions span thoughts, experiences, and perceptions, ultimately giving rise to patterns of thought. Similarly, shared attitudes regarding aspects such as diet, exercise, and physical awareness interact to sculpt patterns of health within a team or community. Within an organization or business, individuals fulfill their roles, engage in relationships, and hold expectations, collectively shaping patterns such as competition or innovation [30]. Moreover, in organizations and communities, factors such as history, traditions, and expectations all contribute to behavior, thereby molding predominant patterns that we recognize as the culture of that particular group.
According to Sullivan [30], a complex adaptive system exhibits three distinctive features. Firstly, it comprises diverse agents, each responsible for making decisions regarding their behavior. Importantly, these decisions evolve over time. Secondly, these agents engage in interactions with one another. This interaction culminates in the third characteristic known as emergence, where the system as a whole manifests properties that extend beyond the mere aggregation of its individual components. Crucially, comprehending the entire system necessitates more than simply examining its constituent parts in isolation.
Complex Adaptive Systems [31] is a framework for studying systems of agents that work together to create emergent global properties. These agents can vary, from organisms to particles and groups of objects or people. They generate emergent patterns through correlated feedback within the system, which create and reinforce stable patterns of behavior outside of equilibrium. Similarities between complex systems in diverse domains can reveal common fundamental principles, providing insights into seemingly distinct fields.
The National Economy is a complex adaptive system [25] that incorporates millions of other complex adaptive systems such as corporations and businesses, financial markets, commercial banks, households, public and private institutions, and more. Among all these systems, various types of relationships and interdependencies are established: material, financial, energy, human, informational, command based, etc. Complex adaptive systems theory methods address some of the shortcomings and deficiencies in the study of the national economy [25,32], providing a systemic, dynamic, and adaptive perspective on key macroeconomic phenomena and processes. In our study, we will adopt this approach and analyze the national Circular Economy, framing it within a complex adaptive system. The National Economy system can be analyzed using various concepts and methods, ranging from descriptive methods in macroeconomic theory to econometric or econophysics methods. As the economy has evolved, it has incorporated numerous corporations, economic organizations, real and financial markets, sectors, and services, among others. Among these components, significant connections and interdependencies [24,32] have emerged through which material and energy flows, information, and knowledge are exchanged, both within and outside the system. Within these networks, labor and financial flows circulate, decisions are made, and regulations are developed. Furthermore, coevolution is another characteristic specific to complex adaptive systems. The complex system of a national economy or a national Circular Economy coevolves in a fitness landscape that can exhibit significant differences between the paths taken in certain periods. The fitness landscape of an economy is constantly changing due to the influence of external factors on the economy, such as political, social, environmental, or external factors [33]. Dooley [34] defines a complex adaptive system based on three principles: history is irreversible in such a system, the future is uncertain in a CAS, and order and control specific to cybernetics are emergent properties, not predetermined. Mitleton-Kelly [35] considers that a complex adaptive system can be characterized by ten generic traits: connectivity, interdependence, coevolution, historicity, trajectory dependence, far-from-equilibrium behavior, exploration of possibility space, feedback, self-organization, and emergence. Complex Adaptive Systems [36] form the core of significant contemporary challenges, encompassing numerous components that adjust and acquire knowledge through their interactions.
Another valuable tool offered by the field of economic cybernetics is the Viable System Model (VSM) [16,37,38]. Initially used for the cybernetic analysis and synthesis of enterprises, the VSM provides a qualitative assessment of strategies for handling the inherent complexity of cybernetic systems. It facilitates the development of practical tools for operational diagnosis and optimal decision-making processes [38]. Stafford Beer, a pioneer in managerial cybernetics, developed the VSM, drawing from cybernetic concepts by Norbert Wiener, McCulloch, and Ross Ashby. Beer’s [39] work drew parallels between the functioning of the human organism and that of an organization. The author viewed the human organism as consisting of three interdependent parts: organs and muscles, nervous systems, and the external environment (body, brain, environment). Later, the author identified five interactive systems within the human body (S1: totality of muscles and organs; S2: sympathetic nervous system; S3: the basic brain; S4: the middle brain, diencephalon; S5: the functions of the higher brain, cortex), which the author analogously applied to five systems relevant to an organization [39]:
- ➢
- System 1: Primary Activities;
- ➢
- System 2: Conflict Resolution;
- ➢
- System 3: Internal Regulation, Optimization, Synergy;
- ➢
- System 4: Adaptation, Action Planning, Strategy;
- ➢
- System 5: Policies, Final Decisions, Identity.
Today, through the utilization of the viable system model (VSM), intricate systems have the capability to recognize and tackle the intricacies and uncertainties they encounter. This empowers them to remain flexible and attain enduring success. While the model was originally employed for evaluating and shaping businesses, its applicability extends to various scenarios including strategic decision making and operational evaluation within both organizations and complex systems [40].
3.2. Multiple Linear Regression Model and ARDL (Autoregressive Distributed Lag) Econometric Model
Multiple linear regression is a statistical method employed to model the connection between a dependent variable (often referred to as the target) and two or more independent variables (known as predictors) [41]. This method involves constructing a linear equation based on observed data to understand the relationship. Notably, multiple linear regression expands upon the principles of simple linear regression, which utilizes a single predictor to account for changes in the dependent variable.
Unknown parameters in multiple linear regression models can be estimated using various criteria, such as minimizing the sum of squared errors (MSSE), minimizing the sum of absolute errors (MSAE), and minimizing the maximum absolute error (MMAE). However, the MSSE criterion remains the most popular in the research [41]. In uncertain or ambiguous cases, it is appropriate to use estimates based on multiple criteria rather than a single criterion to estimate the unknown parameters in a multiple linear regression model.
To describe the mathematical form of multiple linear regression, we will denote the observation j on a response variable and n predictor variables as , where . In a multiple linear regression, the model takes the following form:
where represents the dependent variable, are the independent variable, is the intercept (constant), and are the coefficients of the independent variables, representing the change in the dependent variable for a one-unit change in the respective independent variable, holding all other variables constant. represents the error term, the random variation in the dependent variable that cannot be explained by the independent variables.
In matrix notation, multiple linear regression can be stated as:
where and are vectors, is a vector, and is a matrix.
Multiple Linear Regression (MLR) and Autoregressive Distributed Lag (ARDL) are two different statistical modeling techniques used for different purposes. MLR is used to model the relationship between a dependent variable (also known as the response or target variable) and multiple independent variables (also known as predictors or features).
The methodological steps for constructing a multiple linear regression model that I used in the case study are:
- 1.
- Problem Definition: based on the objectives stated at the beginning of the study, I identified the variables that could be considered in the model.
- 2.
- Data Collection: official sources were sought from which I extracted the dataset containing the variables of interest.
- 3.
- Data Exploration and Preprocessing: the extracted data were checked and cleaned to prepare them for modeling. This stage includes handling missing values, normalization, and data transformation.
- 4.
- Variable Selection: typically, selection techniques such as correlation analysis or specific techniques such as forward elimination and backward elimination are used to choose the variables that will be included in the model.
- 5.
- Model Construction: the data will be used to construct the multiple linear regression model.
- 6.
- Model Evaluation and Validation: statistics such as R-squared, F-test, and t-test for coefficients were used to evaluate and validate the quality of the model.
To analyze time series data and model the short-term and long-term relationships between economic variables, the ARDL (Autoregressive Distributed Lag) econometric model can be used, according to Adebayo et al. [42]. This model combines elements of autoregression (AR) and distribution (DL). Regarding the structure of independent variables, the model is flexible, which is one of its characteristics. Additionally, it allows for the inclusion of outcome and control variables, typical in cybernetic modeling.
Another description of the ARDL model is that, as Hassler et al. [43] point out, it is a tool used in dynamic regressions based on a single equation. This model has become an essential instrument in econometrics, especially because cointegration for non-stationary variables is described as an error correction mechanism. This is also supported by Granger’s representation theorem, defined in the work of Engle and Granger [44]. If we analyze this statement from a cybernetic perspective, we once again see how cybernetics can provide a holistic understanding of economic phenomena. The error correction mechanism through cointegration can be understood as a system regulation process (feedback mechanism). While developing feedback control mechanisms for stabilization policy, Phillips [45,46] introduced error correction (EC) models to the field of economics. Sargan [47] employed them for estimating structural equations that had autocorrelated residuals, and Hendry [48] played a significant role in popularizing their application in econometrics through a series of papers.
The ARDL model is used for variables that are stationary at I (0) or I (1), or a combination of both I (0) and I (1). The autoregressive distributed lag model of order p and n, denoted as ARDL (p, q), is defined for a scalar variable as follows, according to Pesaran and Shin [49]:
where a -dependent variable is determined by its past values and the delayed values of the independent variables found within vector . According to Hassler et al., is a K-dimensional column vector process. p and q are often determined by the Akaike information criterion (AIC). a and c are constants, called short-run coefficients. represents the scalar zero mean error term.
The ARDL framework, pioneered by Pesaran and Shin [48] and further developed by Pesaran et al. [50] has found extensive use in practical research.
The ARDL model finds applications across various fields within the social sciences, notably in finance and macroeconomics. The ARDL (p, q) process is favored for its intuitive representation, enabling partial adjustments towards a significant long-term equilibrium relationship between and . Furthermore, this model effectively addresses the serial correlation structure among the first differences of and and yields reliable estimates of long-run parameters even in cases of weak endogeneity.
Constructing an ARDL model is a complex and meticulous process, with each step having an impact on the final quality and interpretation of the model. Similar to the MLR (Multiple Linear Regression) model, the ARDL model also requires initial steps of problem and objective definition, data collection, and a data quality stage. Subsequently, one checks the stationarity of the time series, tests for cointegration, performs stability tests and diagnostics, and uses impulse response functions.
In summary, the key difference is that MLR models relationships between variables at a single point in time, while ARDL models dynamic relationships over time by considering lagged values of the variables. The choice between these models depends on the nature of your data and the research question you want to address. However, MLR and ARDL models each have their own set of disadvantages [51,52,53,54,55]. MLR assumes that there is a linear relationship between the independent variables and the dependent variable. If this assumption is violated, the model’s predictions may not be accurate. When independent variables in a MLR model are highly correlated, it can lead to multicollinearity issues. This can make it difficult to determine the individual impact of each predictor variable on the dependent variable. MLR assumes that the residuals (the differences between predicted and actual values) are normally distributed. If this assumption is violated, it can affect the reliability of the model [54,55].
ARDL models can become quite complex, especially when dealing with multiple lags and different orders of integration. This complexity can make interpretation challenging. ARDL models assume that the time series data are stationary, which means that the statistical properties of the data remain constant over time. Ensuring stationarity can be a non-trivial task in practice. Choosing the appropriate number of lags for the ARDL model can be subjective and requires testing various lag lengths, which can be computationally intensive [51,52,53].
In conclusion, both MLR and ARDL models have their limitations, and the choice between them depends on the specific characteristics of the data and the research question at hand. It is essential to be aware of these limitations and conduct appropriate diagnostics when using either model.
4. Holistic Cybernetics Analysis of the AS-IS Context of Circular Economy Integration in Romania
The Circular Economy represents a comprehensive and interconnected approach to production and consumption, encompassing concepts such as resource efficiency, waste management, transition to renewable resources, and more. This concept replaces the linear model of unsustainable resource exploitation with a circular and sustainable one, offering economic, social, and environmental benefits. The goal of CE is to establish a system where waste and pollution are not generated, promoting optimal resource circulation and material reuse to regenerate natural capital. This leads to reduced resource consumption and minimized negative environmental impact, while simultaneously contributing to the enhancement of human well-being.
The transition to the Circular Economy involves a reassessment of production and consumption models, urging a redefinition of the concept of “growth” to encompass social and environmental benefits beyond economic gains. The goal of the CE is to decouple economic activity from the exploitation of natural resources through the safe circulation of materials and the elimination of negative externalities, waste, and pollution from the system.
For Romania, as outlined in the National Strategy for Circular Economy, the transition to the CE includes several key directions. Raw material consumption should be reduced through sustainable mining, recycling, and recovery practices. Likewise, consumption of consumables should be minimized by extending product life and reducing the environmental impact of manufacturing operations. In addition, efforts are made to minimize the environmental impact of waste management and treatment activities, as well as wastewater. These goals also involve developing and improving a governance framework based on effective communication and cooperation between local, regional, and national governments.
Analyzing the national Circular Economy from the perspective of economic cybernetics and complex adaptive systems can provide insight into how the Circular Economy works as a dynamic system and is linked together. This approach can help identify the complex interactions between the different components of the Circular Economy and how they affect the long-term evolution and adaptation of the system.
Economic cybernetics focuses on the study of regulation, control, and feedback processes in the economy, similar to the operation of a cybernetic system. In the context of the Circular Economy, cybernetics can be applied to analyze how resource cycles, recycling, and material reuse are regulated to ensure a balanced flow of resources and that they are effective in the circulatory system. This may involve analyzing the interactions between production, consumption, recycling, and waste management, as well as how feedback from these processes may influence economic decisions and system adaptation. On the other hand, the circular economic system can also be approached from the perspective of complex adaptive systems. This involves recognizing that the Circular Economy is a system composed of multiple interconnected components that change and adapt over time in response to internal and external changes. Complex adaptive systems can exhibit emergent properties, such as self-organization and adaptation to environmental or contextual changes. In this case, the analysis can focus on how feedback and interactions among different sectors and economic actors can lead to changes and transformations in the Circular Economy. In the following, several variables will be analyzed to build an understanding of the current (AS-IS) state of the framework defining the context of the CE in Romania. Comparisons will be made with the levels recorded in the European Union (EU).
The Circular Material Use Rate quantifies the proportion of recycled materials that are reintegrated into the economy relative to the total material consumption. The Circular Material Use Rate provides insights into how resources are efficiently utilized and the circular practices within a country’s economy. Comparing the rate’s value in Romania to that at the European level (Appendix A—Figure A1), it exhibited a slight decreasing trend from 2012 to 2021. This suggests potential areas where circularity and resource efficiency in Romania could be enhanced.
Emissions represent the measurement of environmental emissions within material flows for the Circular Economy. This indicator provides information about the environmental impact and sustainability of Circular Economy practices, specifically focusing on emissions associated with various stages of material utilization, production, and recycling. Regarding Romania’s analysis from the perspective of this indicator within the CE context (Appendix A—Figure A2), since 2016, there have been several periods of slight growth. This suggests that Romania, despite being in the early stages of Circular Economy integration, is making efforts towards reducing pollution and contributing to the fight against climate change.
Imports of waste for recovery refer to the amount of waste materials that a country imports with the intention of recycling or recovering valuable resources from them. According to Figure A3 from Appendix A, the analysis reveals that Romania’s imports of waste for recovery have shown some fluctuations over the years. While there have been periods of increase, there have also been periods of decrease. This indicates a certain level of variability in Romania’s efforts to import waste for recovery, which can be influenced by factors such as market demand, policy changes, and technological advancements. Since 2014, a significant increase in this indicator can be observed in Romania (Figure A3). This shows that Romania is importing a large amount of waste for recovery and reuse in its economic processes. It may reflect efforts to access recyclable or recoverable resources from other countries for use in the domestic production or manufacturing process. An increase in this variable could also suggest increased efforts to improve the circularity of the economy, with a focus on more sustainable use of existing resources.
Exports of waste for recovery represent the quantity of waste that a country exports to other countries for the purpose of recovery or recycling. Exporting waste for recovery involves the practice of sending waste materials to other countries with the purpose of recovering and reusing them in their economic activities. This can be seen as a way to optimize resource utilization and promote CE practices. In this case, Romania is above the European average (Appendix A—Figure A4), which signifies its active participation in the international circulation of resources through the export of waste materials to other countries for recovery purposes.
Persons employed in Circular Economy sectors quantifies the “Number of individuals employed” within three specific sectors: recycling, repair and reuse, and rental and leasing sectors. The number of people employed in Circular Economy sectors provides insight into the impact of this approach on the labor market in Romania. Romania has seen an increase in this variable since 2020 (Appendix A—Figure A5), which may indicate a growing trend towards involvement in Circular Economy activities such as recycling, reuse, and sustainable resource management. It may also suggest a rise in job opportunities in sectors such as waste management, recycling, sustainable production, and other Circular Economy-related activities.
Private Investments related to Circular Economy sectors represent the total investment made in physical assets during the reference year. Private Investments related to Circular Economy sectors, also referred to as “Gross Investment in Tangible Goods”, denote the total financial resources allocated by private entities to tangible assets associated with the Circular Economy. Regarding the trajectory of this metric, it reached its highest point in the year 2014, succeeded by a sequence of notable decreases. Starting from 2019 and continuing through 2021, private investments in Romania have remained at a constant level, a phenomenon that can also be explained by the COVID-19 pandemic, which has created a sense of economic uncertainty.
Gross added value related to Circular Economy sectors denotes the adjusted gross income derived from operational activities, accounting for operating subsidies and indirect taxes. Gross added value in Circular Economy sectors represents the economic measure of the contribution of these sectors to the total production of the country. This value reflects the sum of added values created in the processes of production, reuse, recycling, and resource management within the Circular Economy. In the context of Romania’s analysis, we observe a fluctuating trend of this value over the analyzed time period, being at about half of the values recorded at the European level.
Based on the correlation matrix in Table 1, we can describe the following aspects:
- The Circular Material Use Rate (CMR) is negatively correlated with Emissions (−0.22), but positively correlated with Gross added value related to CE sectors (0.47) and Imports of waste for recovery (−0.79). In other words, an increase in the circular material use rate appears to be associated with a decrease in emissions, but an increase in gross added value in Circular Economy sectors and imports of waste for recovery.
- Emissions have a positive correlation with Imports of waste for recovery (0.60) and Exports of waste for recovery (0.37). This suggests that an increase in emissions may be associated with an increase in imports and exports of waste for recovery.
- Private Investments related to CE sectors have a negative correlation with Gross added value related to CE sectors (−0.44) and Persons employed in CE sectors (−0.36). This may indicate that an increase in private investments in Circular Economy sectors could be associated with a decrease in gross added value and the number of people employed in these sectors.
- Persons employed in CE sectors are positively correlated with Gross added value related to CE sectors (0.49) and Imports of waste for recovery (0.49). This suggests that an increase in the number of people employed in Circular Economy sectors may be associated with an increase in gross added value and imports of waste for recovery.
- Gross added value related to Circular Economy sectors has a negative correlation with Imports of waste for recovery (−0.07) and Exports of waste for recovery (−0.07). This may indicate that an increase in gross added value in Circular Economy sectors could be associated with a decrease in imports and exports of waste for recovery.
- Imports of waste for recovery and Exports of waste for recovery are positively correlated with each other (0.27). This suggests a correlation between the quantity of waste imported and exported for recovery purposes.
A comprehensive and objective approach used to monitor and guide the transition towards a Circular Economy is the monitoring framework of the European Commission based on five directions. This holistic framework was established by the European Commission to track progress towards a Circular Economy. While this common approach exists, in the case of Romania, there is a limitation due to the lack of data, with certain indicators missing. Furthermore, not all information is updated to the same annual reference. This has also posed a limitation to our research, making it quite challenging to select a series of variables and indicators for analysis that are statistically significant and provide a framework for analyzing and diagnosing the current situation of Romania regarding the integration of a Circular Economy.
In Table 2, the differences in values for each monitored direction regarding the current level of transition to the Circular Economy can be observed. It is noticeable that Romania has a double value of the total amount of materials used in the processes of production, reuse, and recycling of goods compared to the value recorded at the EU level for the last available year, 2021. This aspect highlights how this indicator contributes to Romania’s Circular Economy. Another measure in which Romania records a higher value than the one registered at the European level is total waste generation per capita. In the year 2020, Romania had a value of 7.338 compared to the EU which recorded a value of 4.813. The high value in Romania indicates inefficient resource utilization and an increased generation of waste, suggesting the need to improve recycling, reuse, and waste management practices to promote a more sustainable and circular model of the economy. From the perspective of GHG emissions from production activities, Romania has a lower quantity than the value at the EU level. This indicates that Romania is taking action in this direction to reduce GHG emissions.
Considering the previous analyses, we can establish the cybernetic framework of the Circular Economy in Romania. Contemporary cybernetics directs its attention toward the examination of intricate adaptive systems. Thus, in the first stage of the cybernetic analysis, we will describe the Circular Economy from the perspective of a complex adaptive system. Thus, among the most prominent properties of a complex adaptive system that categorize the Circular Economy within such a framework, we enumerate the following: self-organization, adaptability, emergence, feedback, diversity, non-linearity, and inter-connectivity.
Self-organization: The Circular Economy involves the interaction of numerous actors and economic entities, which can self-organize to create efficient structures and operating models. In this context, companies, consumers, and other entities can develop initiatives and partnerships to promote circular activities without the need for strict regulation.
Adaptability: The Circular Economy adapts to internal and external changes, such as shifting consumer preferences, technological advancements, or policy changes. Circular systems can adjust processes and practices in real time to meet new requirements and conditions.
Emergence: Circular Economy practices can lead to the emergence of properties and patterns that are not evident at the level of individual components. For example, reuse and recycling strategies can generate new and innovative supply chains or stimulate the development of secondary industries.
Feedback mechanism: In the Circular Economy, feedback plays a crucial role. The continuous exchange of information between producers, consumers, NGOs, and governments can influence the direction of Circular Economy development. Moreover, feedback regarding the performance and impact of circular practices can guide future decisions and strategies.
Diversity: This property manifests itself through the involvement of various industries, sectors, and stakeholders, each bringing unique perspectives and expertise. This diversity fosters collaboration and innovation, contributing to the development of creative solutions for complex problems related to resource management and waste. Essentially, diversity makes the circular economic system more resilient and adaptable to changes and challenges.
Non-linearity: Small changes in some components of the Circular Economy can have disproportionate and nonlinear effects on the overall system. For example, widespread adoption of circular practices can trigger rapid growth in the recycling industry or the market for reusable products.
Inter-connectivity: The components of the Circular Economy are closely interconnected and mutually influence each other. Changes in one part of the system can have chain effects on other components. For example, an innovation in product design can impact the lifecycle of materials and how they are used and managed.
Designing a Circular Economy at the national level involves the development and implementation of a comprehensive and sustainable framework for resource management, production, consumption, and waste management. It can be a complex process and involves several steps and components. Starting from the integration of the most relevant characteristics of the complex adaptive system specific to the Circular Economy, in Figure 4 we have created the cybernetic system of the National Circular Economy (NCE) at a high level. This is a general framework that can be further developed and decomposed into subsystems.
Among the entities and general economic agents identified within a national Circular Economy are the National Government, Local Authorities, Enterprises and Industries, Consumers and Citizens, Research and Education Institutions, and Non-Governmental Organizations. Applying complexity in the field of the Circular Economy requires, in the first instance, a different way of looking at the enterprise itself, the people within it, the environment in which it operates, as well as the collaborative, control, and communication relationships with decision-making entities. Thus, the cybernetic system of the National Circular Economy has been described, starting from the very definition of cybernetics as the science of communication and control of complex systems in complex, dynamic, and adaptive environments. Additionally, in Figure 4, you can observe the feedback mechanisms that form based on communication and relationship channels between economic entities.
Having designed the cybernetic system of the National Circular Economy and demonstrated that the NCE falls within the specific characteristics of a complex adaptive system, for a comprehensive understanding of holistic analysis from the perspective of economic cybernetics, in Figure 3, we have constructed the Viable System Model (VSM), starting from the development proposed by the father of managerial cybernetics, Stafford Beer. The novelty of this model in our research comes from its application within the NCE, with VSM initially being developed and applied to a company.
This model represents a complex cybernetic approach that can be used to analyze and manage complex systems, such as the Circular Economy. It enables an understanding of the interactions and interdependencies between the system’s constituent parts and the external environment. The following specific systems of the NCE have been identified [57] to develop this model:
National Commission on Climate Change: It is an inter-ministerial body that has a consultative role, without legal personality, and its activities are coordinated by the Ministry of Environment. The National Commission for Climate Change has main competencies, such as proposing modifications to Romania’s National Strategy on Climate Change and the Action Plan, analyzing reports from the technical group, informing the Romanian Government, recommending specialized studies for implementing European policies on climate change, proposing external collaboration actions, and contributing to raising public awareness about the effects of climate change and the need to support policies and measures for its reduction.
The Interdepartmental Committee for Sustainable Development: It is an interministerial advisory body operating within the Prime Minister’s Cabinet. This committee’s main objectives include monitoring, evaluating, and reviewing the implementation of Romania’s National Strategy for Sustainable Development until 2030, integrating it into national programs and policies, and ensuring Romania’s compliance with reporting obligations to the European Union in the field of sustainable development. Therefore, the Committee plays an essential role in ensuring coherence in the process of developing and promoting sustainable development policies.
The Interministerial Committee on Climate Change: This is an interministerial body with an advisory role within the Prime Minister’s Cabinet, focusing on coordinating and monitoring government actions related to climate change. The main responsibilities include proposing a well-founded message on climate change, ensuring policy coherence, suggesting annual priority climate policies, evaluating implementation progress, proposing solutions for emission reduction, overseeing budgeting, and recommending indicators for assessing climate commitments.
Figure 5 illustrates Beer’s five developed systems [39], with System 3* emphasizing a particular degree of complexity and adaptability. This level of adaptability is crucial for sustaining the system’s viability and efficient operation, especially when facing environmental changes and challenges.
By representing the cybernetic system of the national Circular Economy in Figure 4, as well as applying the Viable System Model (VSM) in Figure 5, we can establish a framework in which the analysis of Romania’s circular economic system as a complex system provides an understanding of key elements and their interactions. In other words, it aids in comprehending how resources flow through the economic network and how they are transformed and reintroduced into the economy, processes understood through the feedback mechanisms that form among different agents within the Circular Economy system. Through the application of the VSM, specific bottlenecks or inefficiencies can be identified, and decisions can be made to optimize resource flows.
Circular economies must be adaptable and resilient to changes and disruptions in the economic environment. The model can assist in evaluating the capacity of Romania’s Circular Economy to adapt to changes and withstand disruptive factors. The VSM can serve as a tool for strategic decision-making in the development of the Circular Economy. It can provide a framework for defining strategic objectives, identifying necessary resources, and assessing the impact of decisions on the entire system.
Circular economies entail significant complexity, involving multiple sectors, resource flows, and interactions. The VSM can help manage this complexity by offering a systemic view and clarifying the roles and responsibilities of various stakeholders. The VSM can also be employed as an educational tool to help professionals and decision-makers in the field of circular economics better understand the complexity and interconnections of the system.
5. Analysis of Circular Economy in Romania Using Multicriteria Linear Regression and ARDL Model
The proposed study examines causal relationships, both in the long and short term, between the dependent variable, namely real GDP per capita, and its factors such as waste generation per capita, recycling rate per region, labor productivity, production of environmental goods, and circular material use rate. The information was collected from Eurostat for Romania between 2010 and 2021. The variables used in the first analysis are presented in Table 3.
At the core of this analysis lies the Multicriteria Linear Regression (MLR) model, which is a data analysis method used to model the dependence between variables, with a dependent variable (Y) and a number of independent variables (X).
In the case of our analysis, logarithm-transformed data were utilized due to the presence of variables with different measurement units, such as percentages, EUR per capita, EUR 1 million, or kilograms per capita. Consequently, in order to develop a valid model, we normalized the dataset by logarithmizing the input data.
For model estimation, we employed the econometric software EViews 12, following the subsequent steps: loading the data into the system, defining the dependent and independent variables, normalizing the dataset to establish a common measure, executing the multicriteria regression within the system, analyzing the outcomes through examination of key indicators such as , t-Statistic, or the p-value, and interpreting the results. We note that in the following tables, the obtained values are presented with only two decimal places. Regarding the mathematical form of the equations based on the obtained results, the coefficients will include all decimals.
Following the model construction analysis, we obtained the results presented in Table 4 and Table 5. Analyzing the results from Table 5, the model’s which in our case is 75.95%, signifies the amount of information by which the dataset explains the dependent variable, namely GDP per capita in our case. Similarly, we need to examine the F-statistic, which should be relatively large, and the probability associated with the F-statistic should be below the accepted threshold of 0.05, indicating that the model explains the variable with a 95% probability. After assessing the and F-statistic, we will examine the individual probability (p-value) of each indicator, which should also be below the model’s acceptable limit of 0.05 (Table 4). In our case, we observe that out of the five selected indicators for analysis, four are significant, and only one is not compatible.
The mathematical form of the linear regression can be expressed as follows:
The Autoregressive Distributed Lag (ARDL) model is an econometric model that involves the analysis of a dependent variable and its independent variables over a longer period. This model allows for the combination of autoregressive and distributed lag components, capturing both short-term and long-term effects of independent variables on the dependent variable. Therefore, we can examine and observe the results obtained in the above-multicriteria linear regression analysis to determine whether the variables exhibit dependency over the long term or only in the short term.
The definition of variables is carried out similarly to the Multicriteria Linear Regression model in Table 1, with the only modification being the abbreviation used for each variable, namely, Y—LGDP, X1—waste per capita = WST, X2—regional recycling rate = RCY, X3—labor productivity = LBR, X4—environmental goods production = LPRD, and X5—circular material utilization rate = MTR.
Below, we will observe the ARDL model implemented in EViews, where the dependent variable is GDP per capita and the other variables are independent. In our case, we used logarithm-transformed data since the variables had different measurement units such as %, EUR per capita, EUR 1 million, or kilograms per capita. This normalization through logarithm transformation was performed to obtain a valid model.
According to Table 6 and Table 7, the validity of the model is evident from the values of and F-statistic. The significant F-statistic indicates that the variables in the model are efficiently used and collectively explain approximately 98.56% of the variance in the dependent variable, GDP per capita. The independent variables contribute significantly to explaining the variation in the dependent variable.
To confirm the validity of the obtained model’s performance, we conducted the Bounds test (Table 8) to assess the presence of long-term relationships between the independent variables and the dependent variable. The purpose of this test is to verify whether a bidirectional causal relationship exists between the variables.
The F-statistic for the Bounds test, which represents the critical values, is 3.38 at the 10% level. Therefore, long-term causality between the variables can be explained at a 10% significance level, inferred from the value of the F-statistic.
We observe from Table 9 that the cointegration term value is −0.85, which is a negative and significant value at the 10% level. Thus, we deduce the idea that there is long-term cointegration. The speed of adjustment to the long-term equilibrium after deviation is 85.2%. For instance, the deviation from the equilibrium of environmental goods production is 32.92% from the next year’s average. In addition, in Table 6, we can notice significant coefficient values at the 10% level of significance. The explained value of the dependent variable GDP per capita is given by , which is 98.56% of the information.
The form of the cointegration equation can be written, according to the results from Table 6, as follows:
We further aim to investigate whether “greenhouse gas emissions from production activities” and “labor productivity per person employed and hour worked” have an impact on the “generation of municipal waste per capita”. By utilizing these variables, we seek to explore whether an increase in greenhouse gas emissions from production activities could lead to an increase in the generation of municipal waste per capita. This could potentially be attributed to the fact that industrial production and other activities associated with greenhouse gas emissions may contribute to a higher overall consumption of resources, thus leading to an increase in waste generation. Additionally, we want to see how a unit change in labor productivity per person employed and hours worked influences a change in the generation of municipal waste per capita. For this purpose, we will use the R Studio 4.2.3 software tool, the “dLagM“ library, the ardlDlm function, and construct an ARDL model with the independent variable being Greenhouse gases emissions from production activities and the dependent variable being Generation of municipal waste per capita. The data for the two variables were collected from Eurostat, covering the period 2010–2021. These data were loaded into R Studio and declared as time series. Stationarity was checked using the Phillips–Perron test.
In the case of unit root tests such as Dickey–Fuller or Phillips–Perron for the stationarity of time series, the null hypothesis asserts that the data series is non-stationary, meaning it exhibits trends or patterns of variation that may not be constant over time. The alternative hypothesis, on the other hand, asserts that the data series is stationary, indicating it does not display significant trends or patterns of variation and its values fluctuate around a constant mean. Thus, the two hypotheses are as follows:
: The series is non-stationary;
: The series is stationary.
In the case of the Phillips–Perron test, the lower or negative the value of the test statistic, the higher the probability that the series is stationary. In our case, as observed in Table 10, the Dickey–Fuller statistic for both variables is negative, and the p-value is greater than 0.05, which means we reject the null hypothesis and conclude that the series is stationary.
For the purpose of constructing the ARDL model, we will select the appropriate lags based on the information observed from the data’s autocorrelation test and according to the Akaike Information Criterion (AIC), Hannan–Quinn criterion (HQ), Bayesian Schwarz criterion (SC), and Final Prediction Error (FPE) criteria. For this purpose, we used the VARselect function from the “vars” library in R Studio to analyze the information criteria.
The AIC measures the quality of model fit to the data, considering how well the model fits the data and how many variables are used to adjust it. The lower the AIC value, the better the model is considered. In our case (Table 11), if the AIC is 1, it means that the model with one lag is preferred according to AIC. HQ, similar to AIC, puts more weight on the number of parameters in the model. The goal is to find a compromise between model fit and complexity. In our case, if HQ is 1, then the model with one lag is preferred according to the HQ criterion. The SC criterion penalizes model complexity more strongly than AIC and HQ. The goal is to avoid overfitting the model. If SC is 1, then the model with one lag is preferred according to the SC criterion. FPE assesses the model’s performance in predicting future data. The lower the FPE value, the better the model is considered. If FPE is 1, it means that the model with one lag is preferred according to the FPE criterion.
Selecting the appropriate lags for an ARDL model can be an empirical process and depends on the nature of the data and the context of the proposed analysis. The results of the information criteria tests, as well as the ACF tests in Figure 6 and Figure 7, indicate that the appropriate lag for the ARDL model with the three variables is (1,0,0). Such a model is interpreted as the dependent variable being regressed on its own lagged value and independent variables without lags.
In the model resulting in Table 12, greenhouse gas emissions from production activities (GEP) and labor productivity per person employed and hours worked (LBR) are the independent variables, and the generation of municipal waste per capita is the dependent variable. The interpretation of the coefficients from the output of the ARDL model using the ardlDlm function in R Studio is as follows:
- Intercept (3.45): This is the expected value of the dependent variable when all independent variables are zero.
- L(LGWA, 1) (0.23): This coefficient represents the impact of a one-unit change in the lagged value of “Generation of municipal waste per capita” on the current value of the dependent variable.
- LGEP (0.11): This coefficient indicates how a one-unit change in “Labor productivity per person employed and hour worked” affects the dependent variable.
- LLBR (0.43): This coefficient represents the effect of a one-unit change in “Greenhouse gas emissions from production activities” on the dependent variable.
For p-values associated with the coefficients:
- p-values less than 0.05 (commonly used significance level) indicate that the corresponding independent variable has a statistically significant impact on the dependent variable.
- t-value is the coefficient divided by its standard error, and it helps determine if the coefficient is statistically different from zero.
In summary, the model suggests that the variables LGWA (lagged value of municipal waste), LGEP (labor productivity), and LLBR (greenhouse gas emissions) have significant impacts on the generation of municipal waste per capita. The high R-squared values indicate a good fit of the model to the data. Multiple R-squared (94.06%) indicates that approximately 94.06% of the variability in the dependent variable (LGWA) is explained by the independent variables in the model. The adjusted R-squared considers the number of independent variables and provides a measure of the model’s goodness of fit. In this case, around 91.51% of the variability in the dependent variable is explained by the independent variables, considering the model’s complexity. The F-statistic tests the overall significance of the model. A higher F-statistic and a very low p-value suggest that at least one of the independent variables is significantly related to the dependent variable. The residual standard error measures the dispersion of the residuals around the fitted values. A lower value indicates a better fit of the model to the data.
According to Figure 8, it can be observed that the residuals are within the range of −0.02 and 0.02, indicating that the model is relatively stable and consistent over time.
In Table 13, we conducted a cointegration analysis using the Johansen procedure. Regarding the eigenvalues, these are used to determine the number of cointegration relationships (r). In our case, the first eigenvalue (0.99) is significant, indicating the presence of at least one cointegration relationship. As for the values of the test statistic and critical values, these are used to test the cointegration hypotheses. The values of the test statistic should be smaller than the critical values to reject the null hypothesis (absence of cointegration). In our case, we observe a potential presence of cointegration.
The cointegration coefficients represent the links between the cointegrated variables. For instance, the cointegration coefficient between LGWA.l2 and LGEP.l2 is 1.00, suggesting a direct relationship between these two variables. Overall, the results indicate that our variables are cointegrated in at least one long-run equilibrium relationship. This implies that changes in these variables are connected and can influence each other in the long term. A detailed interpretation of the cointegration coefficients can provide more specific insights into the nature of relationships among your variables.
Figure 9 compares the actual evolution of municipal waste generation per capita with the values estimated using the ARDL model. It provides a visual depiction of the model’s performance in fitting the actual data. The blue line (real values) represents the actual trend of municipal waste generation per capita over the given period. The data points on this line correspond to observed values from the input data. The red line (estimated values) depicts the estimated values of municipal waste generation per capita using the ARDL model. The better the red line aligns with the blue line, the better the model fits the data. The distance between the blue line and the red line at each point indicates the error or difference between the real and estimated values. If the residuals are small and randomly distributed around the blue line, it suggests a good fit of the model to the utilized data. In our case, this statement is confirmed.
6. Limitations and Future Research
The analysis of complex adaptive systems can offer multiple advantages in framing the Circular Economy within the context of Romania. The Circular Economy, by its nature, is complex and interconnected. The cybernetic approach from the perspective of CAS aids in the in-depth understanding of how various components of the CE interact with each other. This perspective can identify vulnerable, critical points, and potential secondary effects. The Circular Economy involves various sectors and diverse interests. The analysis of complex adaptive systems offers a comprehensive view on the interconnections and mutual influences among various components, which is crucial for the development of effective strategies and for coordinating efforts among different stakeholders. This approach enables a deeper understanding of the system’s dynamics, including how small changes can have a large-scale impact or how the system adapts over time. By considering the complexity and adaptability of the system, planners and decision makers can better anticipate future challenges and opportunities, leading to more resilient and sustainable solutions.
However, our study has encountered several barriers and limitations. First and foremost, the most significant barrier was obtaining data and information regarding the indicators/variables that characterize the Circular Economy in Romania. Due to this limitation, only a few variables for which the necessary data for the analyzed time period were available were selected. Furthermore, for certain variables that we would have liked to include in the analysis, no data at all were published on the Eurostat platform. For example, “food waste”, “End-of-life recycling input rates (EOL-RIR)”, “EU self-sufficiency for raw materials”, etc.
Although we have identified six systems that influence the Circular Economy through holistic analysis from the perspective of economic cybernetics, the ARDL analysis covers only a limited set of variables, thus failing to capture the complexity of the model. This integral aspect of the research remains a significant limitation.
For future research, we recommend diversifying the econometric tools to model the relationship between economic growth and variables across all five thematic areas described in the EU Monitoring framework in Romania. For instance, a specific analysis could involve the comprehensive examination of the new dimension introduced in the framework, which is global sustainability and resilience.
Another future research direction we have in mind is to explore the development and implementation of digital platforms that connect producers, consumers, and other stakeholders in the Circular Economy, facilitating the exchange of resources and products. Furthermore, we could investigate how artificial intelligence and data analysis can be applied to optimize processes within the Circular Economy, such as waste identification and management or resource planning.
7. Discussion
In the last decade, interest in the Circular Economy has increased, especially as part of efforts to create a more sustainable society [57]. However, this revival of the concept has also come with a series of controversies and confusions, both in the academic and practical realms. In their study, Reike et al. [57] suggest that policymakers and the business sector should focus their attention on implementing short-term value retention options, such as remanufacturing, reconditioning, and reusing, while also considering the feasibility and overall system impact. In contrast, researchers should support practical efforts to advance the Circular Economy by taking a more prominent role in harmonizing views on what the Circular Economy entails. The conclusions of Reike et al. [57] also underscore some of the findings we have elaborated on in our own study, namely that sustainable practices and policies are critically important in Romania’s transition towards a Circular Economy.
The Circular Economy can have a significant impact in Romania, especially considering the general objective outlined in the National Strategy for the Circular Economy in Romania. According to this strategy, policy approaches should aim to advance the Circular Economy in Romania in the following ways [58]:
- I.
- Promoting the conservation of natural resources by adopting sustainable practices in extraction, recycling, and recovery processes;
- II.
- Prolonging product lifecycles to curtail the demand for consumer goods;
- III.
- Alleviating the environmental repercussions of production methods;
- IV.
- Minimizing the ecological footprint associated with waste management and wastewater treatment;
- V.
- Enhancing collaboration and coordination among governmental entities at local, regional, and national levels.
In a context where Romania faces both economic and environmental challenges, the transition to a Circular Economy becomes essential. Our study adopted a holistic approach, combining economic cybernetics and complex adaptive systems to understand the complexity of the Circular Economy in Romania. This approach allowed us to identify multi-dimensional relationships and propose viable solutions for promoting sustainable development. Moreover, our research suggests that transitioning to a Circular Economy could bring significant benefits for both GDP and environmental indicators. Additionally, we identified several critical connections between recycling rates, labor productivity, and sustainable resource use. These connections are vital for formulating policies that simultaneously address multiple aspects of the Circular Economy.
MLR and ARDL modeling highlighted a series of key factors affecting per capita GDP and the generation of municipal waste. The results emphasize the importance of an integrated approach in public policy formulation. Based on our findings, we recommend aligning future development policies with Romania’s National Strategy for the Circular Economy. This would not only boost economic performance but also reduce environmental impact. The transition to a Circular Economy in Romania has the potential to lower greenhouse gas emissions and improve environmental quality, aligning with global sustainability objectives.
Our study also has limitations, such as the use of a limited dataset. The COVID-19 pandemic has had a significant impact on various aspects of the Circular Economy, both in Romania and at the European level. Given that the time period we are analyzing also includes the context of the pandemic, some aspects of analysis are necessary concerning the variables used in the models. Regarding the “circular material use rate” variable, as can be observed in Figure A1, the rate at the European level dropped in 2019, while it showed a slight increase in Romania. Lockdown periods led to decreased consumption, explaining the reduction in the circular material use rate. However, consumer interest in sustainability has increased, counterbalancing this effect in Romania. Emission releases initially dropped due to reduced industrial activities and traffic, although this decrease was temporary, as can be seen in Figure A2. Imports and exports of waste for recovery and recycling were likely affected by supply chain disruptions and quarantine measures, as indicated in Figure A3 and Figure A4. As many businesses closed or scaled back operations, employment in the Circular Economy sectors may have been negatively affected, at least in the short term. However, starting from 2020, there is observable growth in Romania in the number of people employed in the Circular Economy sector (Figure A5). According to Figure A6, investments in tangible goods related to the Circular Economy declined at the European level during the pandemic, which can be explained by the fact that these investments were postponed or reduced due to economic uncertainty. Gross added value in the Circular Economy sectors (Figure A7) could have been influenced by a range of factors, including reduced demand for products and services as well as potential supply chain disruptions. Nevertheless, the EU’s post-pandemic economic recovery initiatives, such as the European Green Deal [59], could offer opportunities to boost investments and innovation in the Circular Economy.
Future research could incorporate more variables and utilize advanced modeling methods to solidify the results and we can explore the opportunities offered by the European Green Deal.
8. Conclusions and Policy Recommendations
Regarding the comprehensive approach to the subject discussed in the study concerning the current status of Circular Economy implementation and transition in Romania, aiming towards a sustainable economic future analyzed through the lens of economic cybernetics and the ARDL econometric models, we have managed to outline a holistic perspective on how we can assess the complex challenges of Romania’s transition to a Circular Economy. In this context, the Circular Economy has been explored from the standpoint of an adaptive complex system, which represents a novelty in the current state of research in this field, allowing us to identify and highlight its characteristics.
Furthermore, we have conceptualized the Circular Economy as a cybernetic system to illustrate and understand who the key agents are within this Circular Economy and how this system can be regulated through the feedback mechanisms that form. As a result, we conclude that the national Circular Economy is a complex adaptive system in which numerous parts and elements interact dynamically and change in response to the environment. In other words, the cybernetic perspective has enabled us to understand the key elements of this sector and how it can be considered as a complex system. In other words, analyzing the Circular Economy as a complex adaptive system confirms that to ensure a fair and equitable transition to a Circular Economy, it is essential to involve all stakeholders—governments, industry, communities, and civic organizations—in planning and implementing changes. Equal access to resources, training opportunities, and technology is crucial. Social and economic support programs should be put in place to assist vulnerable and disadvantaged groups. Regulations should be designed in such a way as to not create inequalities, but rather to encourage sustainable development for all.
To better understand the subcomponents of this complex system, the Viable System Model was applied as a managerial diagnostic framework, focusing on the Circular Economy in Romania as a complex adaptive system. The analysis conclusions have highlighted the advantages of this CE, which can be invested in to ensure sustainable development. These advantages include adaptability and resilience, synergy, policy, and strategy integration, as well as coordination and learning. At the same time, there may also be negative effects on workers and communities involved in the Circular Economy. To minimize the negative impact, it is important to develop transition strategies for the affected workers and communities. This could include retraining and vocational programs, providing people with the skills needed to work in emerging sectors. Additionally, a robust social protection system should be in place to help mitigate any short-term economic or social shocks. Consulting and involving communities in the decision-making process could also help identify the best ways to address the specific challenges and opportunities for each community. In the long term, investments in education and job creation in sustainable sectors can aid in a smoother and less painful transition.
After cybernetic analysis provided us with a holistic framework for understanding the CE, another analytical direction we pursued was examining causal relationships, both in the short and long term, between the dependent variable, namely real GDP per capita, and its factors such as waste generation per capita, regional recycling rates, labor productivity, production of environmental goods, and the circular material use rate. Consequently, a multicriteria linear regression model was constructed.
Based on this model, we observed that the variable LBR is not statistically significant in the model. Therefore, we constructed an ARDL model where we logged all the variables to increase the level of statistical significance. The results of the initial ARDL model led us to the conclusion that all the selected independent variables impact real GDP per capita.
Following the analyses conducted so far, we considered examining separately, also by constructing an ARDL model, how greenhouse gas emissions from production activities and labor productivity per person employed and hour worked impact the generation of municipal waste per capita. The model results suggested that the new independent variables do influence the generation of municipal waste per capita.
The novelty of this article and its significance in advancing the specialized literature lie in the holistic analysis from a cybernetic perspective and its integration with econometric models, such as the ARDL model.
Author Contributions
Conceptualization, I.N., C.D. and N.C.; methodology, I.N.; software, I.N.; validation, I.N. and C.D.; formal analysis, I.N.; investigation, I.N. and C.D.; resources, I.N., C.D. and N.C.; data curation, I.N. and C.D.; writing—original draft preparation, I.N.; writing—review and editing, I.N., C.D. and N.C.; visualization, N.C. and C.D.; supervision, I.N.; project administration, I.N., C.D. and N.C. All authors have read and agreed to the published version of the manuscript.
Funding
This research received no external funding.
Institutional Review Board Statement
Not applicable.
Informed Consent Statement
Not applicable.
Data Availability Statement
Data are available upon request.
Conflicts of Interest
The authors declare no conflict of interest.
AppendixA
Figure A1.
The evolution of Circular Material Use Rate in Romania compared to the EU during the 2012–2020 Period.
Figure A1.
The evolution of Circular Material Use Rate in Romania compared to the EU during the 2012–2020 Period.

Figure A2.
The evolution of Emissions in Romania compared to the EU during the 2012–2020 period.

Figure A3.
The evolution of Imports of waste for recovery in Romania compared to the EU during the 2012–2020 period.
Figure A3.
The evolution of Imports of waste for recovery in Romania compared to the EU during the 2012–2020 period.

Figure A4.
The evolution of Exports of waste for recovery in Romania compared to the EU during the 2012–2020 period.
Figure A4.
The evolution of Exports of waste for recovery in Romania compared to the EU during the 2012–2020 period.

Figure A5.
The evolution of Persons employed in Circular Economy sectors from Romania compared to the EU during the 2012–2020 period.
Figure A5.
The evolution of Persons employed in Circular Economy sectors from Romania compared to the EU during the 2012–2020 period.

Figure A6.
The evolution of gross investment in tangible goods from Romania compared to the EU during the 2012–2020 period.
Figure A6.
The evolution of gross investment in tangible goods from Romania compared to the EU during the 2012–2020 period.

Figure A7.
The evolution of gross added value related to Circular Economy sectors from Romania compared to the EU during the 2012–2020 period.
Figure A7.
The evolution of gross added value related to Circular Economy sectors from Romania compared to the EU during the 2012–2020 period.

References
- European Parliament. Circular Economy: Definition, Importance, and Benefits. Available online: https://www.europarl.europa.eu/news/en/headlines/economy/20151201STO05603/circular-economy-definition-importance-and-benefits (accessed on 26 July 2023).
- Chen, F.; Ahmad, S.; Arshad, S.; Ali, S.; Rizwan, M.; Saleem, M.H.; Driha, O.M.; Balsalobre-Lorente, D. Towards achieving eco-efficiency in top 10 polluted countries: The role of green technology and natural resource rents. Gondwana Res. 2022, 110, 114–127. [Google Scholar] [CrossRef]
- Moraru, R.I.; Paun, A.P.; Dura, C.C.; Dinulescu, R.; Potcovaru, A.M. Analysis of the Drivers of Occupational Health and Safety Performance Disclosures by Romanian Companies. Econ. Comput. Econ. Cybern. Stud. Res. 2020, 54, 197–214. [Google Scholar]
- Obrad, C.; Circa, C. Determinants of Work Engagement among Teachers in the Context of Teleworking. Amfiteatru Econ. 2021, 23, 718–735. [Google Scholar] [CrossRef]
- Vermeșan, H.; Mangău, A.; Tiuc, A.-E. Perspectives of Circular Economy in Romanian Space. Sustainability 2020, 12, 6819. [Google Scholar] [CrossRef]
- Topliceanu, L.; Puiu, P.G.; Drob, C.; Topliceanu, V.V. Analysis Regarding the Implementation of the Circular Economy in Romania. Sustainability 2023, 15, 333. [Google Scholar] [CrossRef]
- Dobre-Baron, O.; Nițescu, A.; Niță, D.; Mitran, C. Romania’s Perspectives on the Transition to the Circular Economy in an EU Context. Sustainability 2022, 14, 5324. [Google Scholar] [CrossRef]
- Lakatos, E.S.; Cioca, L.-I.; Dan, V.; Ciomos, A.O.; Crisan, O.A.; Barsan, G. Studies and Investigation about the Attitude towards Sustainable Production, Consumption and Waste Generation in Line with Circular Economy in Romania. Sustainability 2018, 10, 865. [Google Scholar] [CrossRef]
- Modoi, O.-C.; Mihai, F.-C. E-Waste and End-of-Life Vehicles Management and Circular Economy Initiatives in Romania. Energies 2022, 15, 1120. [Google Scholar] [CrossRef]
- Drăgoi, M.C.; Popescu, M.-F.; Andrei, J.V.; Mieilă, M. Developments of the Circular Economy in Romania under the new sustainability paradigm. Econ. Comput. Econ. Cybern. Stud. Res. 2018, 52, 125–138. [Google Scholar]
- Levin, A.; Lin, C.-F.; Chu, C.-S.J. Unit root tests in panel data: Asymptotic and finite-sample properties. J. Econ. 2002, 108, 1–24. [Google Scholar] [CrossRef]
- Im, K.S.; Pesaran, M.; Shin, Y. Testing for unit roots in heterogeneous panels. J. Econ. 2003, 115, 53–74. [Google Scholar] [CrossRef]
- Botezat, E.A.; Dodescu, A.O.; Văduva, S.; Fotea, S.L. An Exploration of Circular Economy Practices and Performance Among Romanian Producers. Sustainability 2018, 10, 3191. [Google Scholar] [CrossRef]
- Tripa, S.; Indrie, L. Households textile waste management in the context of a circular economy in Romania. Environ. Eng. Manag. J. 2021, 20, 81–87. [Google Scholar] [CrossRef]
- Tiwari, S.; Mohammed, K.S.; Mentel, G.; Majewski, S.; Shahzadi, I. Role of circular economy, energy transition, environmental policy stringency, and supply chain pressure on CO2 emissions in emerging economies. Geosci. Front. 2023. [Google Scholar] [CrossRef]
- Androniceanu, A.; Georgescu, I.; Nica, I.; Chiriță, N. A Comprehensive Analysis of Renewable Energy Based on Integrating Economic Cybernetics and the Autoregressive Distributed Lag Model—The Case of Romania. Energies 2023, 16, 5978. [Google Scholar] [CrossRef]
- Xu, A.; Qian, F.; Ding, H.; Zhang, X. Digitalization of logistics for transition to a resource-efficient and circular economy. Resour. Policy 2023, 83. [Google Scholar] [CrossRef]
- Khan, S.A.R.; Yu, Z.; Sarwat, S.; Godil, D.I.; Amin, S.; Shujat, S. The role of block chain technology in circular economy practices to improve organizational performance. Int. J. Logist. Res. Appl. 2022, 22, 605–622. [Google Scholar] [CrossRef]
- Kabirifar, K.; Ashour, M.; Yazdani, M.; Mahdiyar, A.; Malekjafarian, M. Cybernetic-parsimonious MCDM modeling with application to the adoption of Circular Economy in waste management. Appl. Soft Comput. 2023, 139. [Google Scholar] [CrossRef]
- Stoica, M.; Mircea, M.; Lixandru, I.-D. A cyber dimension to the circular economy—The model of external complementarity in consumer behaviour. Econ. Comput. Econ. Cybern. Stud. Res. 2023, 57, 153–170. [Google Scholar]
- Chirita, N.; Georgescu, I.; Nica, I. Cybernetics Analysis of the Circular Economy from Romania; Springer Book Chapter; Springer: Singapore, 2023; forthcoming. [Google Scholar]
- Delcea, C.; Crăciun, L.; Ioanăș, C.; Ferruzzi, G.; Cotfas, L.-A. Determinants of Individuals’ E-Waste Recycling Decision: A Case Study from Romania. Sustainability 2020, 12, 2753. [Google Scholar] [CrossRef]
- Naudé, M. Sustainable development and complex adaptive systems. Corp. Ownersh. Control 2012, 10, 535–546. [Google Scholar] [CrossRef]
- Nica, I.; Chirita, N. Holistic Approach of Complex Adaptive Systems. In Theory, Applications and Case Studies; LAB Lambert Academic Publishing: Chisinau, Republic of Moldova, 2021. [Google Scholar]
- Scarlat, E.; Chirita, N. Cibernetica Sistemelor Economice, 3rd ed.; Economică Publishing: Bucharest, Romania, 2019. [Google Scholar]
- Chan, S. Complex Adaptive Systems. ESD.83 Research Seminar in Engineering Systems. 2001. Available online: https://web.mit.edu/esd.83/www/notebook/Complex%20Adaptive%20Systems.pdf (accessed on 10 August 2023).
- Chirita, N.; Nica, I. Cibernetica Firmei: Aplicatii si Studii de Caz; Economică Publishing: Bucharest, Romania, 2019. [Google Scholar]
- Nica, I. Seminar Support—Cybernetics of Economic Systems; Faculty of Economic Cybernetics, Statistics and Informatics, Bucharest University of Economic Studies: Bucharest, Romania, 2023; unpublished. [Google Scholar]
- Human Systems Dynamics Institute. Complex Adaptive System. Available online: https://www.hsdinstitute.org/resources/complex-adaptive-system.html (accessed on 12 August 2023).
- Sullivan, T. Embracing Complexity. Available online: https://hbr.org/2011/09/embracing-complexity (accessed on 12 August 2023).
- Carmichael, T.; Hadžikadić, M. The Fundamentals of Complex Adaptive Systems; Carmichael, T., Collins, A., Hadžikadić, M., Eds.; Complex Adaptive Systems; Understanding Complex Systems; Springer: Cham, Switzerland, 2019. [Google Scholar] [CrossRef]
- Richardson, K.A. Thinking About Complexity: Grasping the Continuum through Criticism and Pluralism; ISCE Publishing: Leicester, UK, 2010. [Google Scholar]
- Bertelle, C.; Duchamp, G.H.E.; Kadri-Dahmani, H. (Eds.) Complex Systems and Self-Organization Modelling; Springer: Berlin/Heidelberg, Germany, 2009. [Google Scholar]
- Dooley, K. A Nominal Definition of Complex Adaptive Systems. Chaos Netw. 1996, 8, 2–3. [Google Scholar]
- Mitleton-Kelly, E. Complexity Systems and Evolutionary Perspectives on Organisations: The Application of Complexity Theory to Organisations; Elsevier: Amsterdam, The Netherlands, 2003. [Google Scholar]
- Holland, J.H. Studying Complex Adaptive Systems. J. Syst. Sci. Complex 2006, 19, 1–8. [Google Scholar] [CrossRef]
- Espejom, R.; Gill, A. The Viable System Model as a Framework for Understanding Organizations. Available online: http://www.moderntimesworkplace.com/good_reading/GRRespSelf/TheViableSystemModel.pdf (accessed on 19 August 2023).
- Kybernetick. The Theory of Practice. Available online: https://www.kybernetik.ch/en/fs_methmod3.html (accessed on 19 August 2023).
- Beer, S. Brain of the Firm, 2nd ed.; John Wiley & Sons: Hoboken, NJ, USA, 1981. [Google Scholar]
- Nica, I.; Chirita, N. The Economic Cybernetics Analysis and the Effects of the Occurrence of COVID-19 in Romania. J. e-Health Manag. 2020, 2020, 644164. [Google Scholar]
- Narula, S.C.; Wellington, J.F. Linear Regression Using Multiple-Criteria; Fandel, G., Gal, T., Eds.; Multiple Criteria Decision Making Theory and Application; Lecture Notes in Economics and Mathematical Systems; Springer: Berlin/Heidelberg, Germany, 1980; Volume 177. [Google Scholar] [CrossRef]
- Adebayo, T.S.; Akinsola, G.D.; Kirikkaleli, D.; Bekun, F.V.; Umarbeyli, S.; Osemeahon, O.S. Economic performance of Indonesia amidst CO2 emissions and agriculture: A time series analysis. Environ. Sci. Pollut. Res. 2021, 28, 47942–47956. [Google Scholar] [CrossRef]
- Hassler, U.; Wolters, J. Autoregressive Distributed Lag Models and Cointegration, Diskussionsbeiträge, No. 2005/22; Freie Universität Berlin, Fachbereich Wirtschaftswissenschaft: Berlin, Germany, 2005. [Google Scholar]
- Engle, R.; Granger, G. Cointegration and Error Correction: Representation, Estimation and Testing. Econometrica 1987, 55, 251–276. [Google Scholar] [CrossRef]
- Phillips, A.W. Stabilization Policy in a Closed Economy. Econ. J. 1954, 64, 290–323. [Google Scholar]
- Phillips, A.W. Stabilization Policy and the Time Form of Lagged Responses. Econ. J. 1957, 67, 265–277. [Google Scholar]
- Sargan, J.D. Wages and Prices in the United Kingdom: A Study in Econometric Methodology. In Econometric Analysis for National Economic Planning; Hart, R.E., Mills, G., Whittaker, J.K., Eds.; Butterworths: Totnes, UK, 1964; pp. 25–54. [Google Scholar]
- Hendry, D.F.; Pagan, A.; Sargan, J.D. Dynamic Specification. In Handbook of Econometrics, II; Griliches, Z., Intriligator, M.D., Eds.; North-Holland: Amsterdam, The Netherland, 1984; pp. 1023–1100. [Google Scholar]
- Pesaran, M.H.; Shin, Y. An Autoregressive Distributed Lag Modeling Approach to Cointegration Analysis. In Centennial Volume of Rangar Frisch; Strom, S., Holly, A., Diamond, P., Eds.; Cambridge University Press: Cambridge, UK, 1999. [Google Scholar]
- Pesaran, M.H.; Shin, Y.; Smith, R.P. Bounds testing approaches to the analysis of level relationships. J. Appl. Econom. 2001, 16, 289–326. [Google Scholar] [CrossRef]
- Ghouse, G.; Khan, S.A.; Rehman, A.U. ARDL Model as a Remedy for Spurious Regression: Problems, Performance and Prospectus. Munich Pers. RePEc Arch. 2018. Available online: https://www.hippocampus.si/ISSN/1854-6935/19_1.pdf (accessed on 28 June 2023).
- Nkoro, E.; Uko, A.K. Autoregressive Distributed Lag (ARDL) cointegration technique: Application and interpretation. J. Stat. Econom. Methods 2016, 5, 63–91. [Google Scholar]
- Sam, C.Y.; McNown, R.; Goh, S.K. An augmented autoregressive distributed lag bounds test for cointegration. Econ. Model. 2019, 80, 130–141. [Google Scholar] [CrossRef]
- Sciencing. The Advantages&Disadvantages of a Multiple Regression Model. Available online: https://sciencing.com/advantages-disadvantages-multiple-regression-model-12070171.html (accessed on 19 August 2023).
- Marill, K.A. Advanced Statistics: Linear Regression, part II: Multiple Linear Regression. Acad. Emerg. Med. 2004, 11, 94–102. [Google Scholar] [CrossRef]
- Eurostat. Monitoring Framework. Available online: https://ec.europa.eu/eurostat/web/circular-economy/monitoring-framework (accessed on 19 August 2023).
- Reikea, D.; Vermeulena, W.J.V.; Witjesb, S. The circular economy: New or Refurbished as CE 3.0?—Exploring Controversies in the Conceptualization of the Circular Economy through a Focus on History and Resource Value Retention Options. Resour. Conserv. Recycl. 2018, 135, 246–264. [Google Scholar] [CrossRef]
- European Union. National Strategy for the Circular Economy in Romania. Available online: https://circulareconomy.europa.eu/platform/en/strategies/national-strategy-circular-economy-romania (accessed on 19 August 2023).
- Council of the European Union. European Green Deal. Available online: https://www.consilium.europa.eu/en/policies/green-deal/ (accessed on 21 September 2023).
Figure 1.
Yearly evolution of the number of publications in Web of Science containing the terms “Circular economy”, “Recycling rate”, and sustainable policies.
Figure 1.
Yearly evolution of the number of publications in Web of Science containing the terms “Circular economy”, “Recycling rate”, and sustainable policies.

Figure 2.
WoS categories records, using “Circular economy”, “Recycling rate” and sustainable policies as keyword.
Figure 2.
WoS categories records, using “Circular economy”, “Recycling rate” and sustainable policies as keyword.

Figure 3.
Design of cybernetics systems.

Figure 4.
Cybernetics system of the National Circular Economy (high-level). Authors’ design.

Figure 5.
Beer’s five developed systems Authors’ design.

Figure 6.
The result of applying the autocorrelation function (ACF) to the variable GWA. Authors’ computation.
Figure 6.
The result of applying the autocorrelation function (ACF) to the variable GWA. Authors’ computation.

Figure 7.
The result of applying the autocorrelation function (ACF) to the variables: GEP, LBR. Authors’ computation.
Figure 7.
The result of applying the autocorrelation function (ACF) to the variables: GEP, LBR. Authors’ computation.

Figure 8.
Residuals cumulative sum for ARDL model.

Figure 9.
The real and estimated values of the dependent variable of the Generation of municipal waste per capita.
Figure 9.
The real and estimated values of the dependent variable of the Generation of municipal waste per capita.


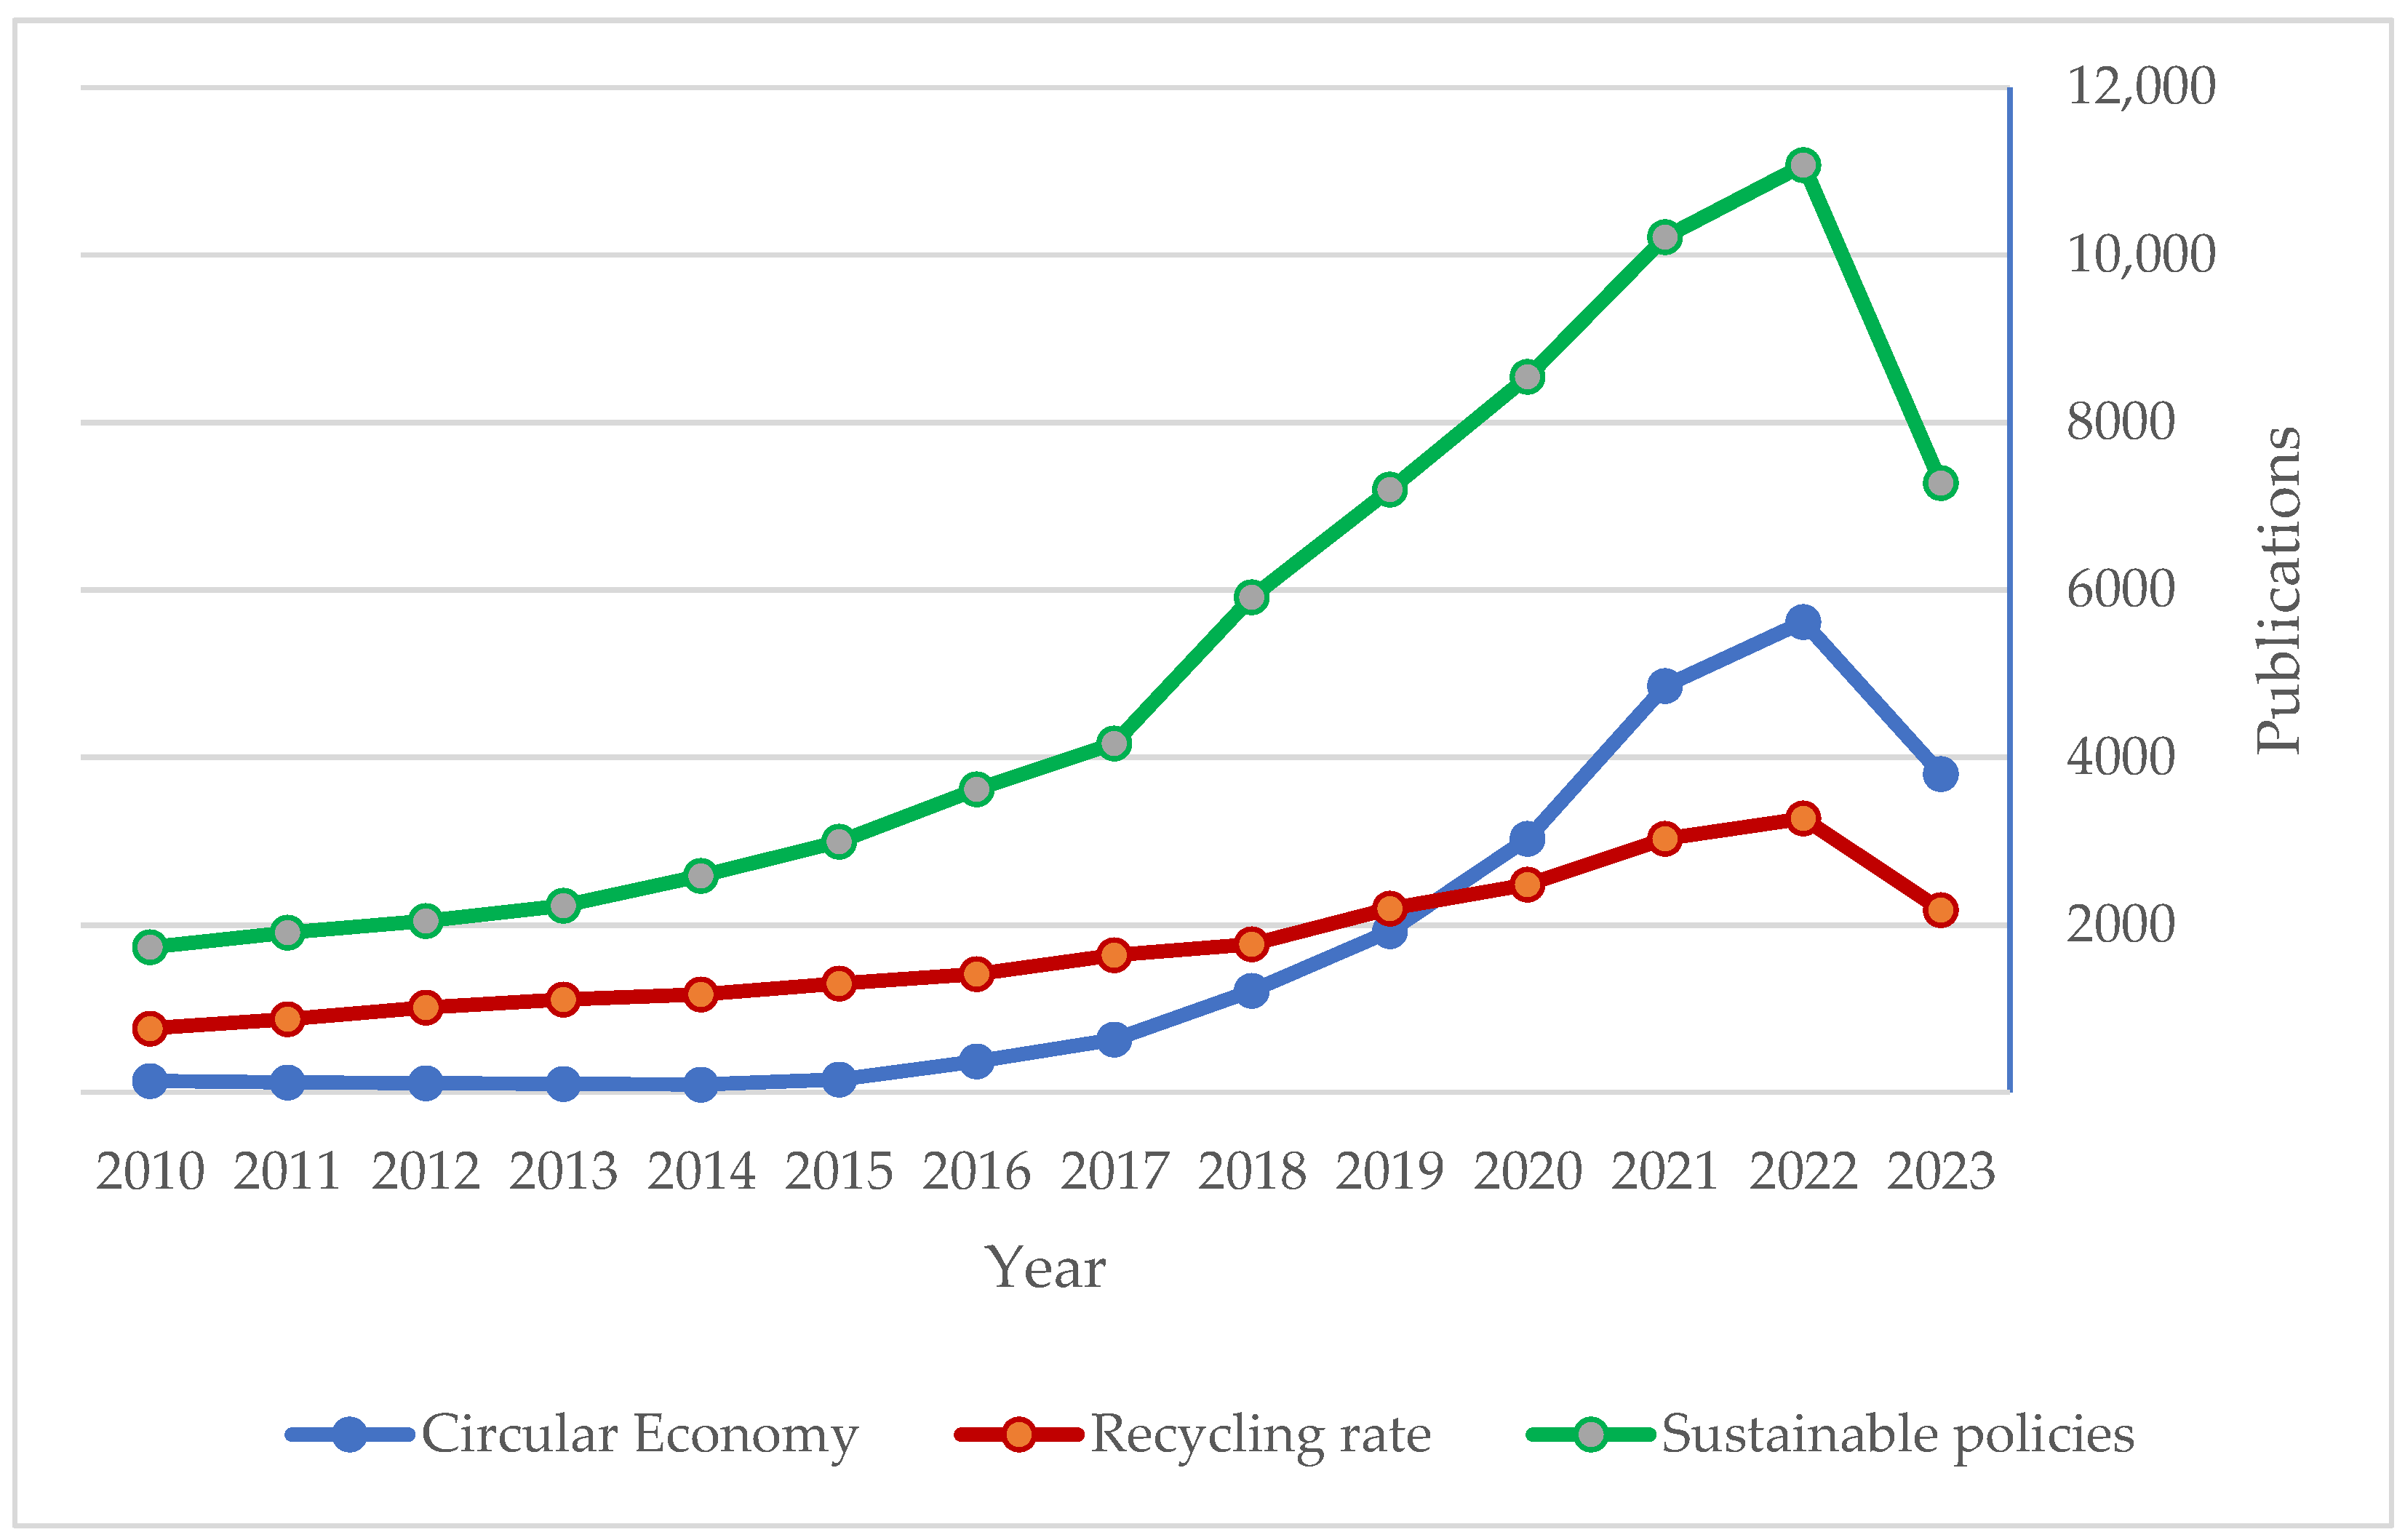
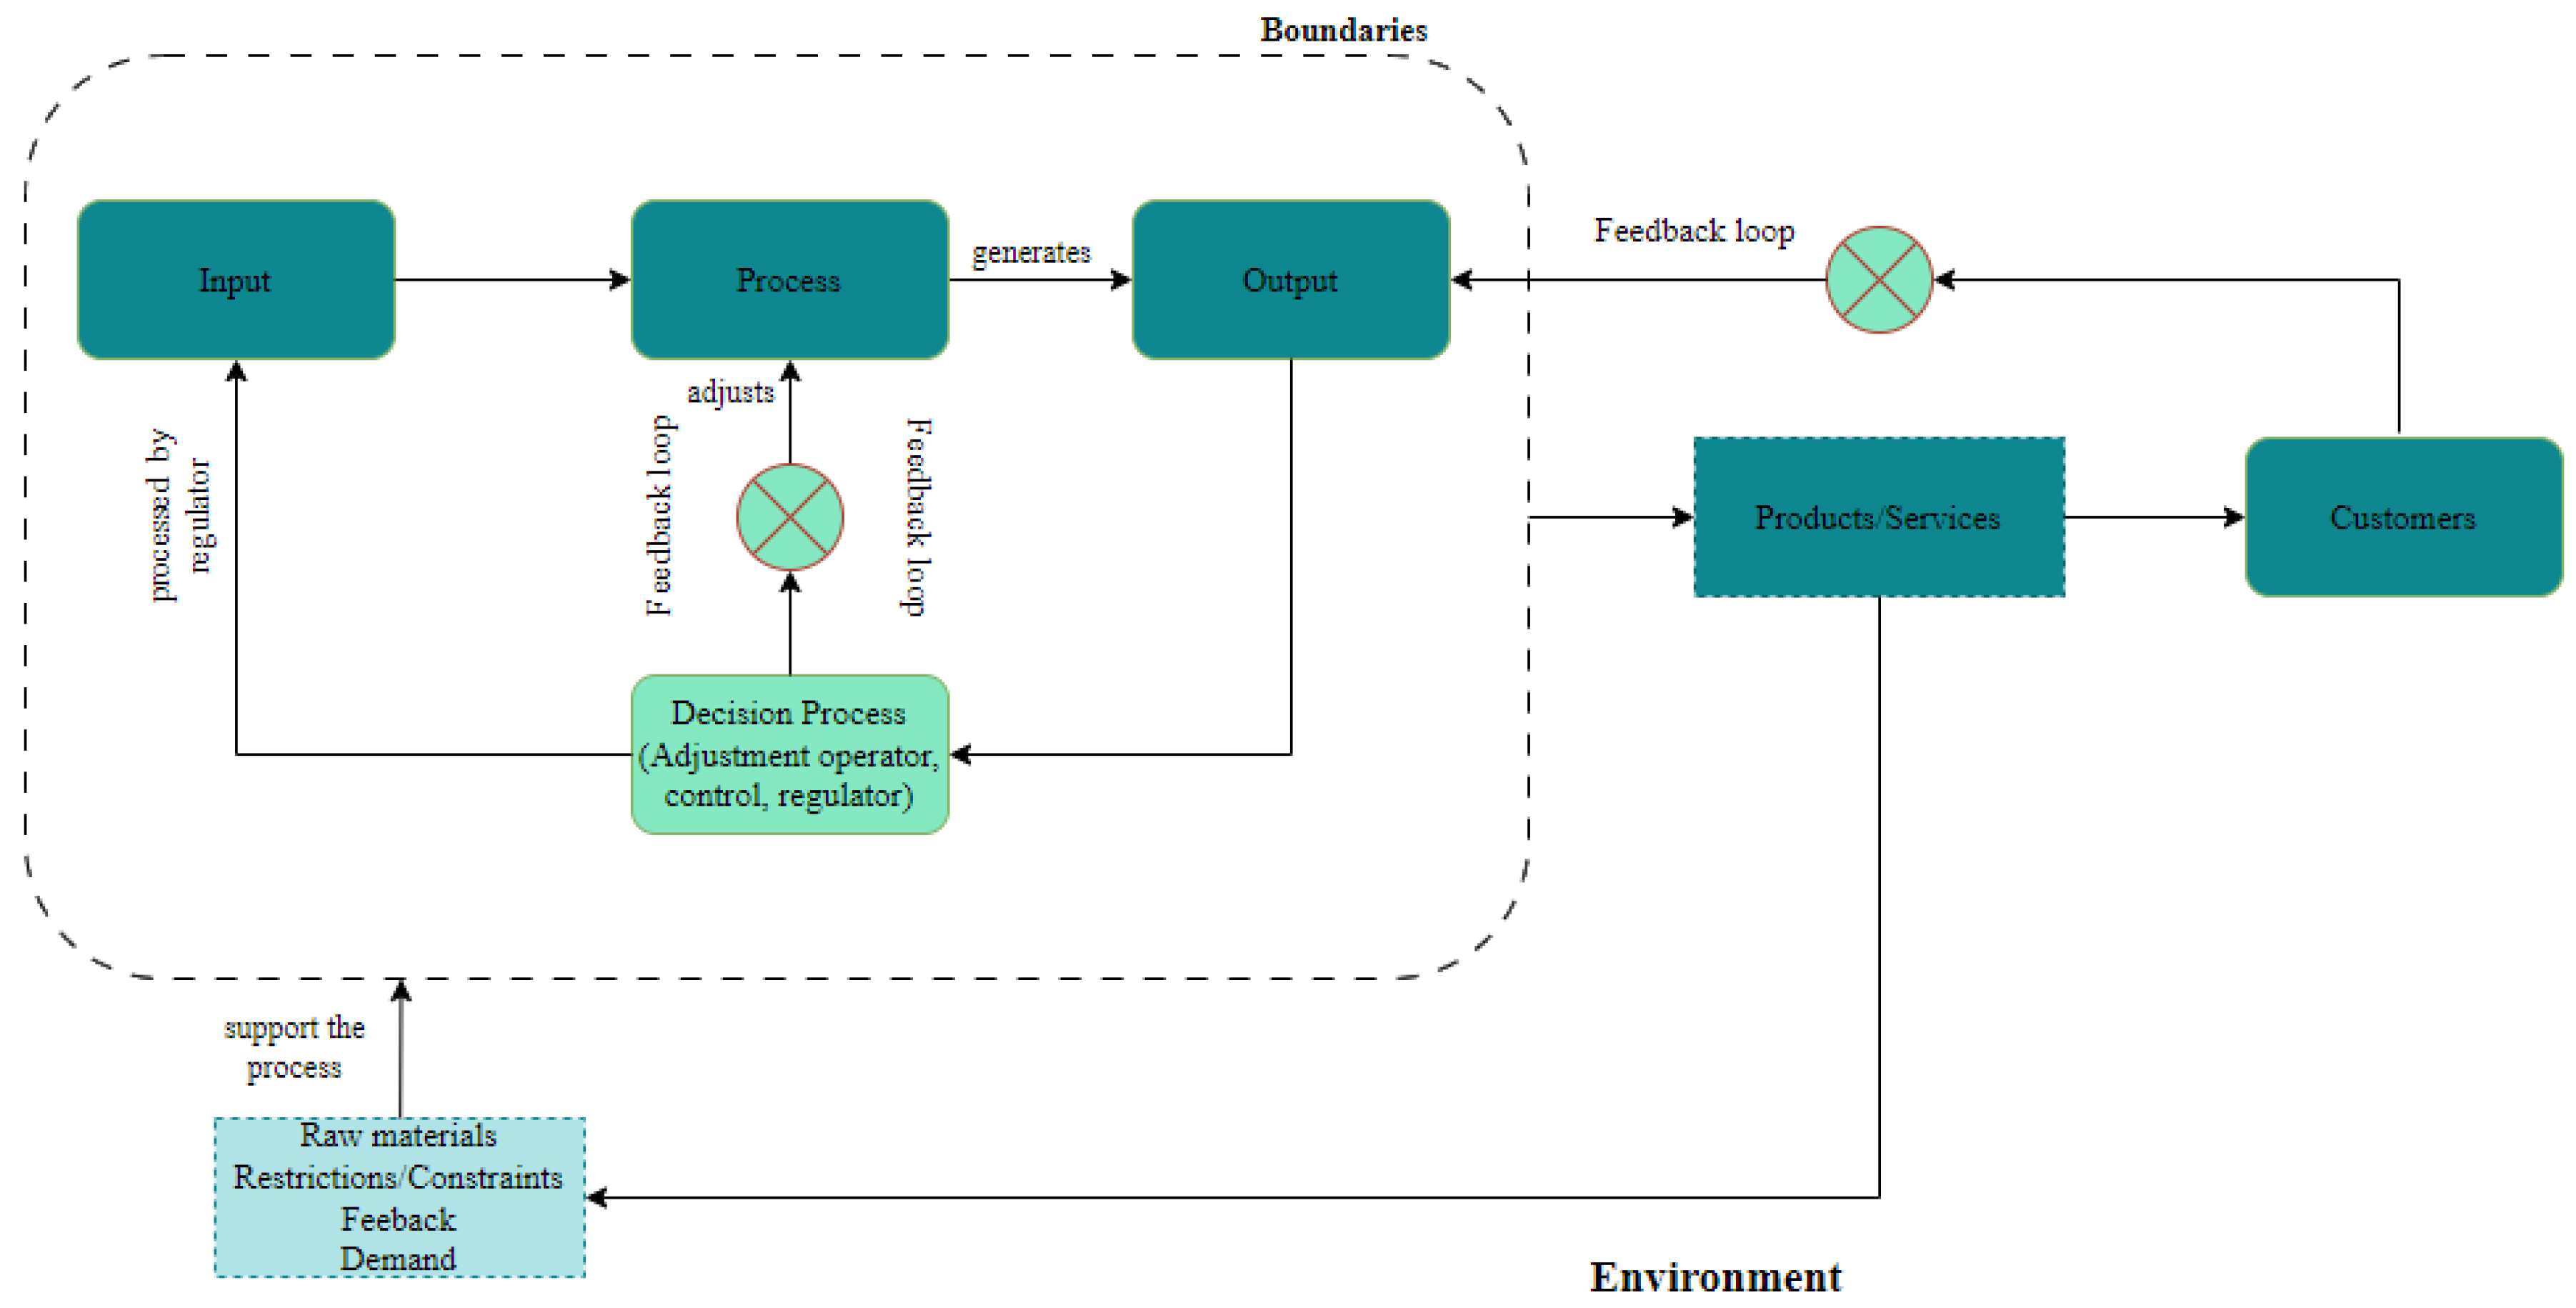
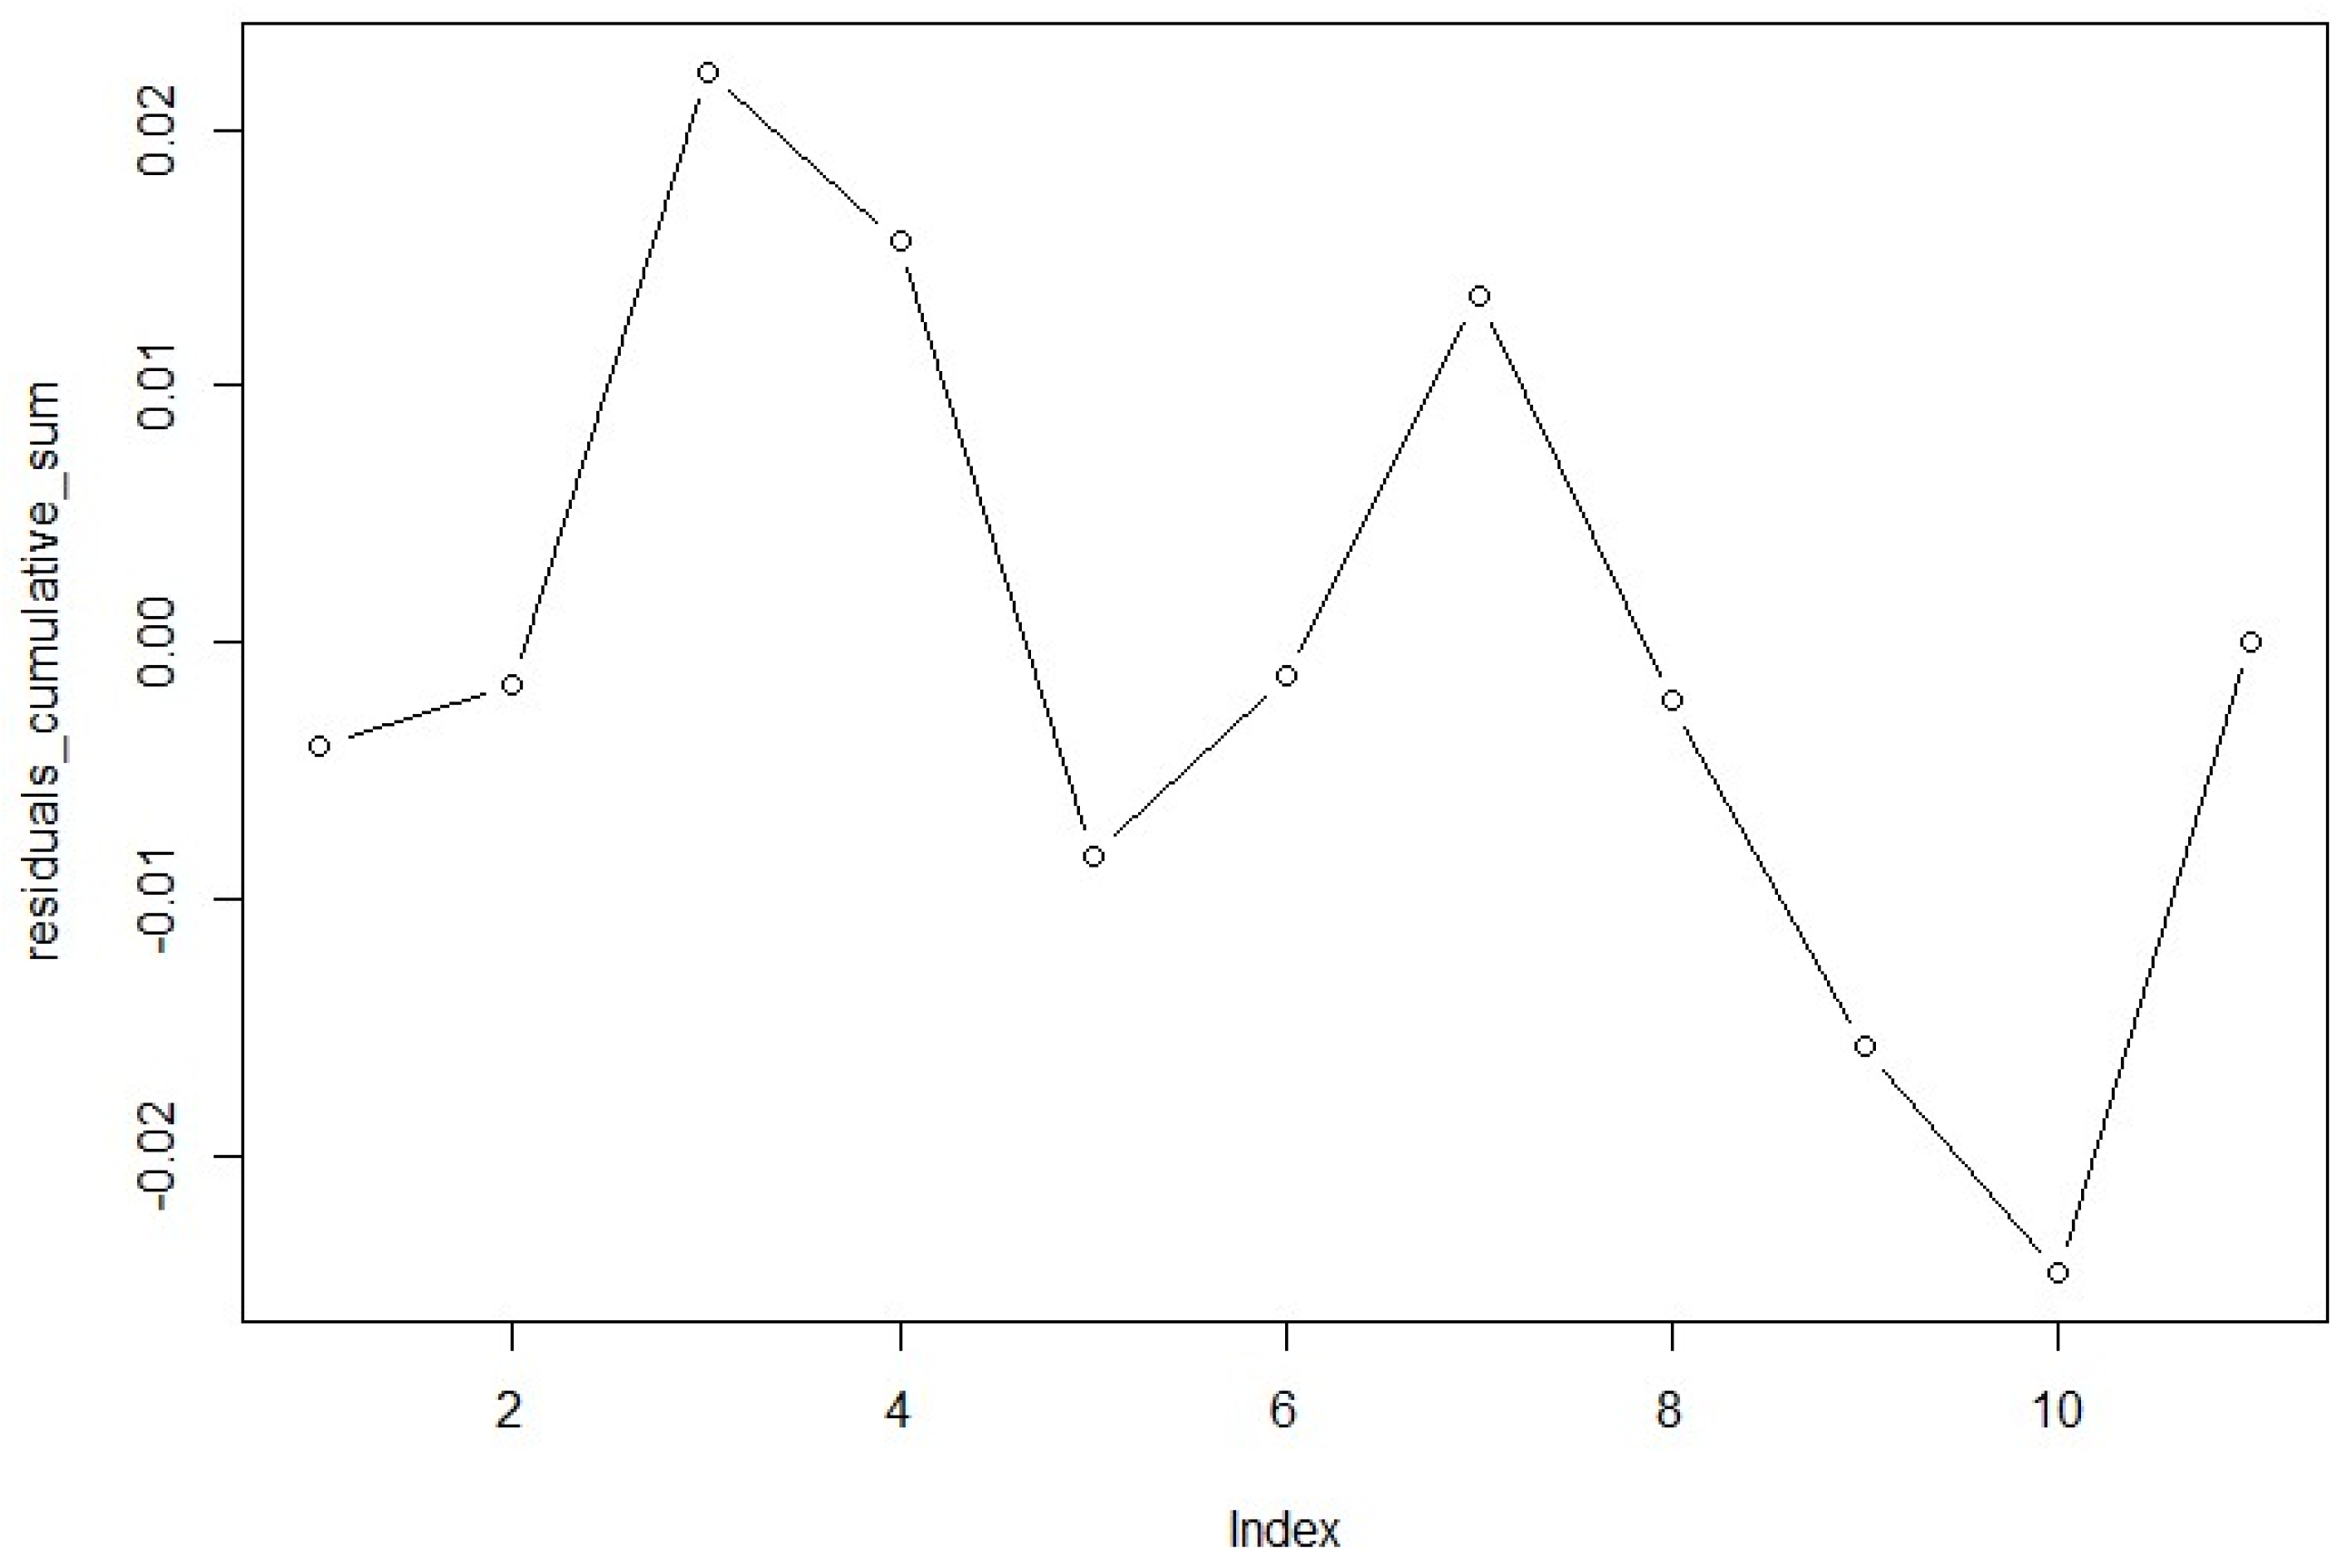
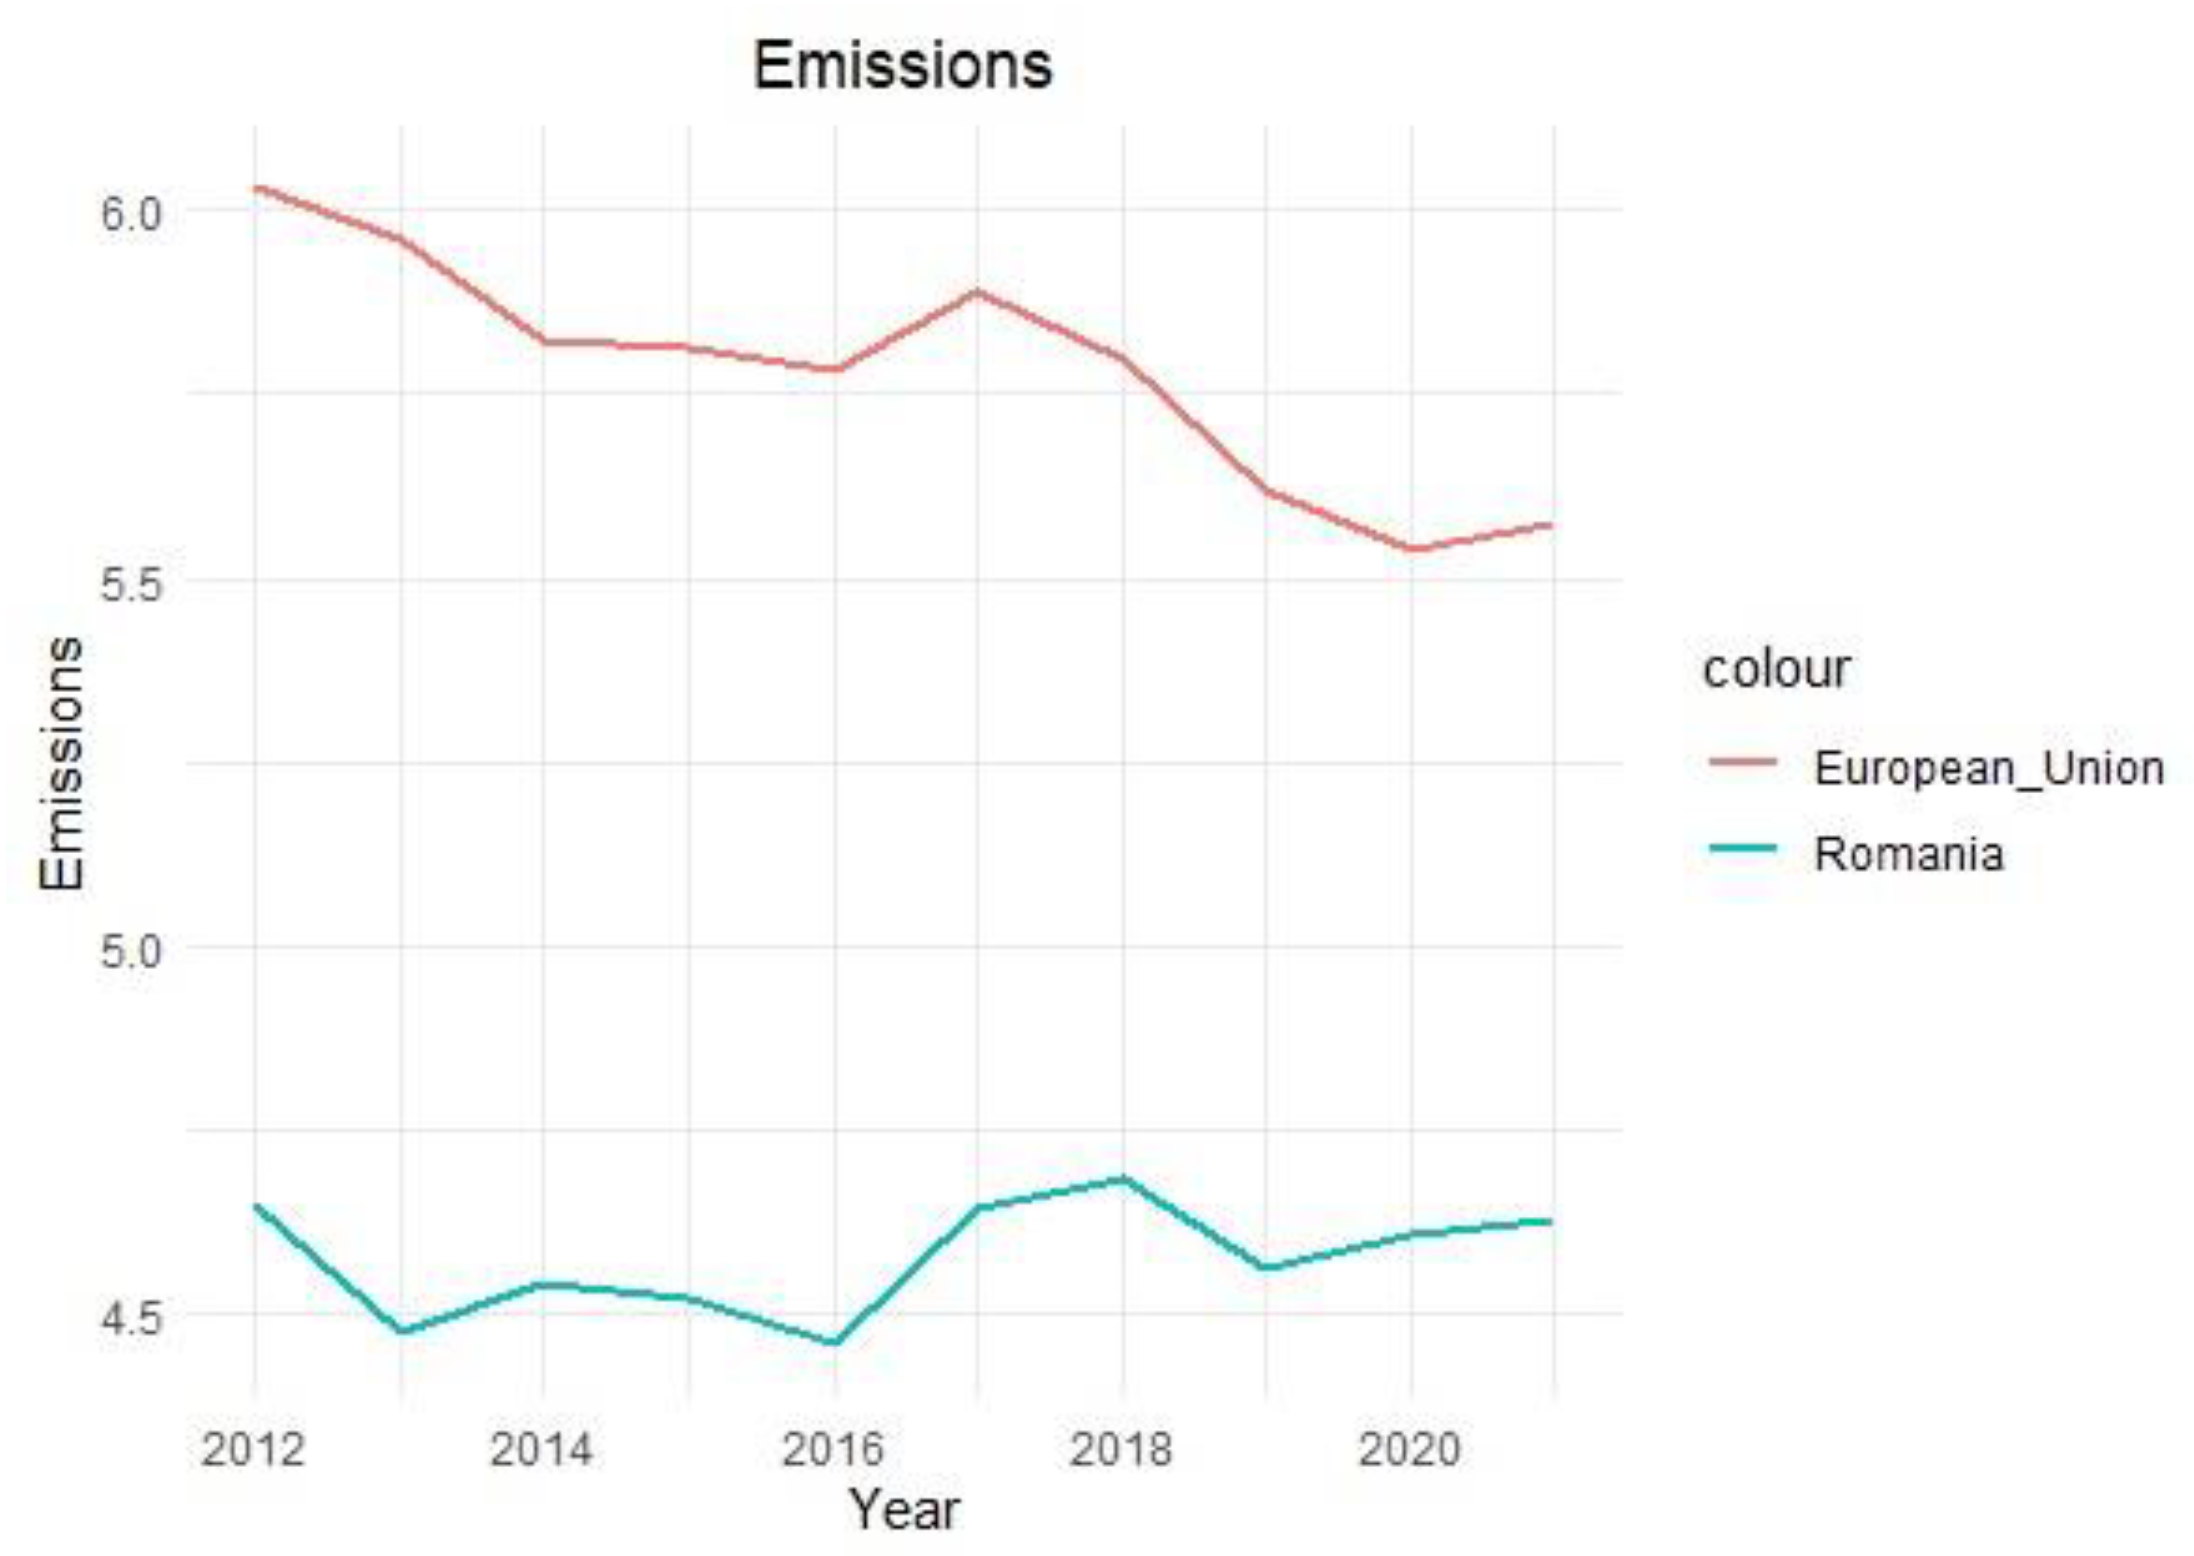
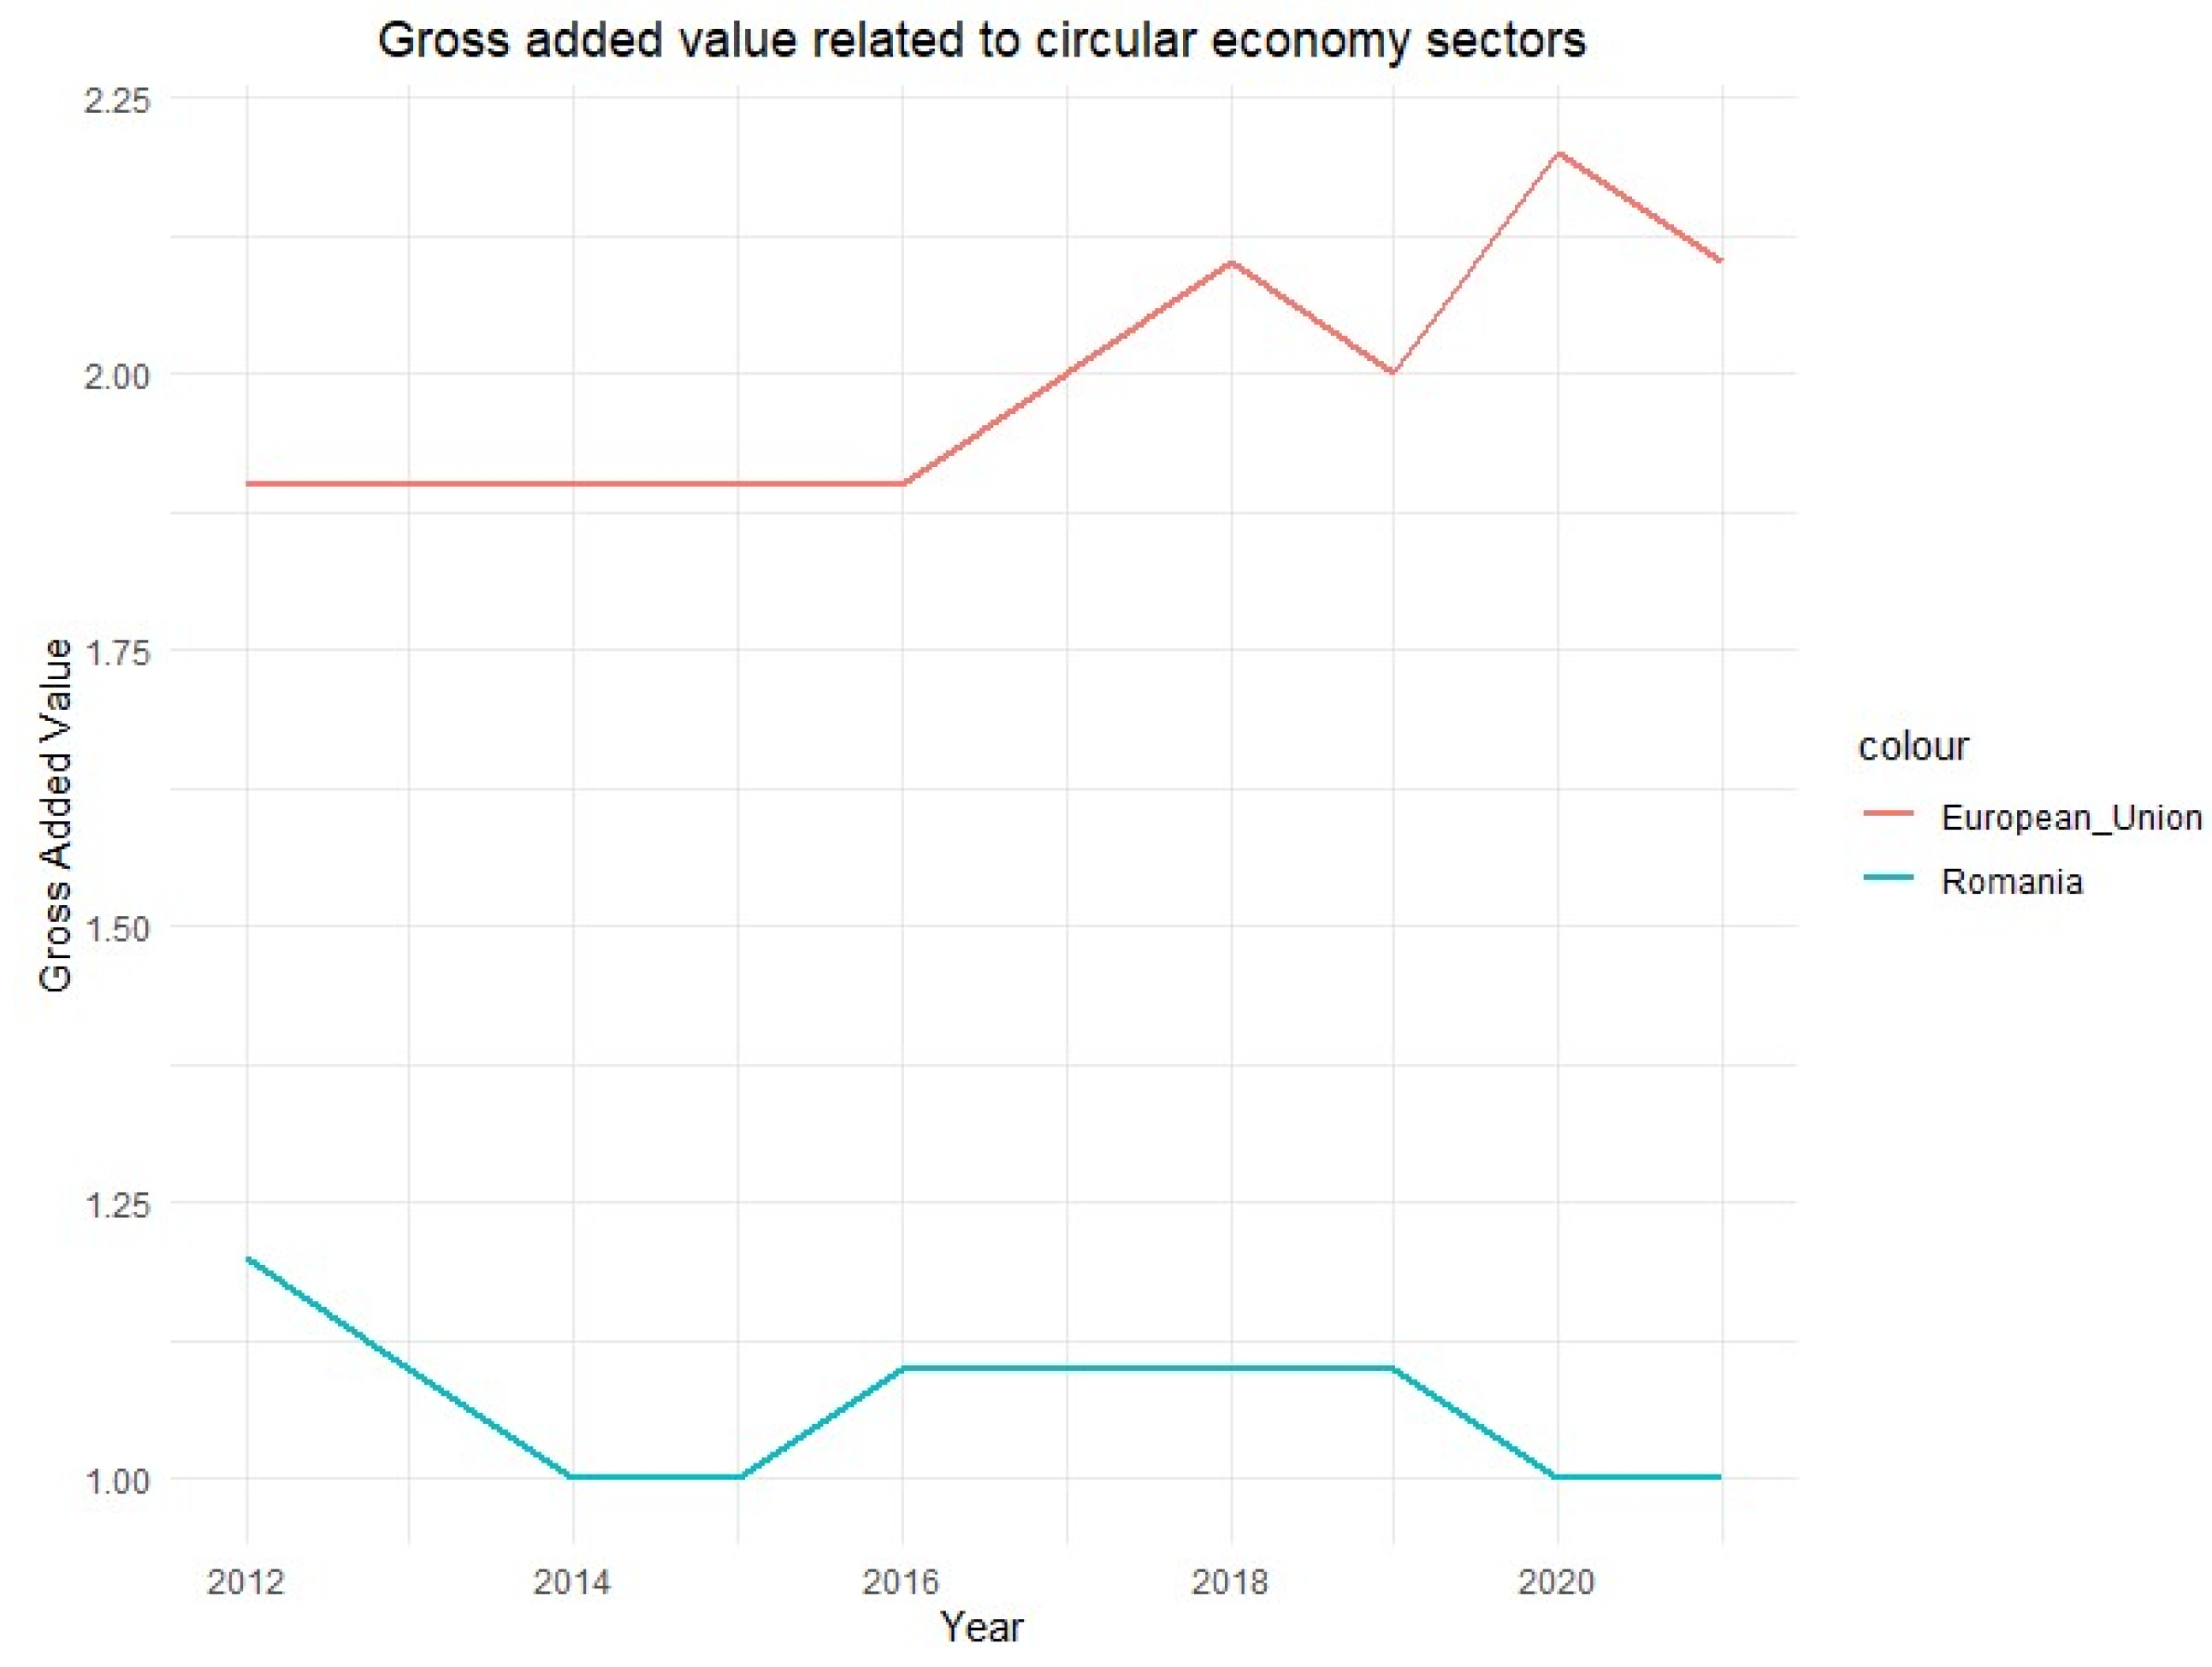
Table 1.
Correlation Matrix.
| Variables | 1 | 2 | 3 | 4 | 5 | 6 | 7 |
|---|---|---|---|---|---|---|---|
| 1. Circular Material Use Rate | 1 | ||||||
| 2. Emissions | −0.22 | 1 | |||||
| 3. Private Investments related to CE sectors | 0.10 | −0.14 | 1 | ||||
| 4. Persons employed in CE sectors | −0.31 | 0.23 | −0.10 | 1 | |||
| 5. Gross added value related to CE sectors | 0.47 | 0.17 | −0.44 | −0.36 | 1 | ||
| 6. Imports of waste for recovery | −0.79 | 0.6 | −0.41 | 0.49 | −0.07 | 1 | |
| 7. Exports of waste for recovery | 0.14 | 0.37 | −0.2 | 0.52 | −0.07 | 0.27 | 1 |
Authors’ calculation.
Table 2.
Monitoring framework of Circular Economy.
| Monitoring Framework | Romania | European Union | |
|---|---|---|---|
| Production and consumption | Material footprint (tons per capita), 2020; | 30 | 14 |
| Resource productivity (index 2000 = 100), 2021; | 67.40 | 135.5 | |
| Total waste generation per capita (kg per capita), 2020; | 7338 | 4813 | |
| Waste management | Recycling rate of municipal waste (percentage), 2021; | 37.30 | 49.6 |
| Recycling rate of overall packaging (percentage), 2020; | 37 | 64 | |
| Secondary raw materials | Circular material use rate (percentage), 2021; | 1.4 | 11.7 |
| Imports from non-EU countries (thousand tons), 2021; | 706.8 | 41,388.1 | |
| Exports to non-EU countries (thousand tons), 2021; | 2018 | 37,616.2 | |
| Competitiveness and innovation | Private Investments (% of GDP at current prices), 2021; | 0.5 | 0.8 |
| Persons employed (% of total employment), 2021; | 1.2 | 2.10 | |
| Gross value added (% of GDP at current prices), 2021; | 1 | 2.1 | |
| Patents related to waste management and recycling (number), 2019; | 5.5 | 295.3 | |
| Global sustainability and resilience | Consumption footprint (Index 2010 = 100), 2021; | 109 | 104 |
| GHG emissions from production activities (kg per capita), 2021; | 5183.7 | 6412 | |
| Material import dependency (procentage), 2021; | 10 | 22.9 | |
Authors’ collection according to [56].
Table 3.
Description of the variable used in model.
| Variables | Description of Variables | Abbreviations | Unit of Measurement | Source of Data |
|---|---|---|---|---|
| Real GDP per capita | Ratio of Real GDP to average population in a specific year | GDP (Y) | Euro per capita | Eurostat |
| Waste per capita | The indicator represents the amount of waste per capita at the national level | WST (X1) | Kilograms per capita | Eurostat |
| Recycling rate by region | The indicator measures the proportion of municipal waste recycled in the total municipal waste generation | RCY (X2) | (%) | Eurostat |
| Labor productivity | It is calculated as real production per unit of labor input (measured by the total number of hours worked) | LBR(X3) | (%) | Eurostat |
| Production of environmental goods | Represents the quantity of products that have been made using environmentally reused resources | PRD (X4) | mil. Euros | Eurostat |
| Circular material use rate | The indicator measures the proportion of recycled material reintroduced into the economy | MTR (X5) | (%) | Eurostat |
Authors’ collection.
Table 4.
Multicriteria Linear Regression Output.
| Variables | Coefficient | Std. Error | t-Statistic | Prob. |
|---|---|---|---|---|
| C | 3.27 | 1707.64 | 0.00 | 0.99 |
| X1 | 0.52 | 6.42 | 3.30 | 0.01 |
| X2 | 0.76 | 65.84 | 1.43 | 0.01 |
| X3 | 2.08 | 27.35 | 0.65 | 0.53 |
| X4 | 0.19 | 0.07 | 2.52 | 0.04 |
| X5 | 1.01 | 321.68 | −4.62 | 0.00 |
Authors’ calculation.
Table 5.
Performance Metrics of MLR.
| Statistics Metrics | Values | Performance Metrics | Values |
|---|---|---|---|
| R-squared | 0.75 | Mean dependent var | 7843.33 |
| Adjusted R-squared | 0.57 | S.D. dependent var | 1145.10 |
| S.E. of regression | 158.61 | Akaike info criterion | 13.27 |
| Sum squared resid | 150,948.10 | Schwarz criterion | 13.52 |
| Log likelihood | −73.66 | Hannan-Quinn criterion | 13.18 |
| F-statistic | 113.46 | Durbin-Watson statistic | 1.72 |
| Prob (F-statistic) | 0.00 |
Authors’ calculation.
Table 6.
ARDL model Output.
| Dependent Variable | LGDP (Logarithmic GDP) | |||
|---|---|---|---|---|
| Sample | 2010–2021 | |||
| Dependent Lags | 1 (Fixed) | |||
| Dynamic Regressors (0 Lag, Fixes) | LBR, MTR, RCY, WST, LPRD | |||
| Variables | Coefficient | Std. Error | t-Statistic | Prob. |
| LGDP (−1) | 0.14 | 0.39 | 0.37 | 0.02 |
| LBR | 0.00 | 0.00 | 0.10 | 0.02 |
| MTR | −0.17 | 0.06 | −2.91 | 0.04 |
| RCY | 0.01 | 0.01 | 1.09 | 0.03 |
| WST | 0.00 | 0.00 | 1.05 | 0.05 |
| LPRD | 0.28 | 0.18 | 1.54 | 0.02 |
| C | 4.48 | 3.42 | 1.31 | 0.25 |
Authors’ calculation.
Table 7.
Bounds Test—statistics cointegration output.
| Statistics Metrics | Values | Performance Metrics | Values |
|---|---|---|---|
| R-squared | 0.98 | Mean dependent var | 8.97 |
| Adjusted R-squared | 0.96 | S.D. dependent var | 0.13 |
| S.E. of regression | 0.02 | Akaike info criterion | −4.21 |
| Sum squared resid | 0.00 | Schwarz criterion | −3.95 |
| Log likelihood | 30.16 | Hannan-Quinn criterion | −4.37 |
| F-statistic | 45.77 | Durbin-Watson statistic | 1.60 |
| Prob (F-statistic) | 0.00 |
Authors’ calculation.
Table 8.
Bounds Test.
| Null Hypothesis: No Long-Run Relationships Exist | ||
|---|---|---|
| Test Statistic | Value | K |
| F-Statistic | 3.37 | 5 |
| Critical value bounds | ||
| significance | I0 bounds | I1 bounds |
| 10% | 2.26 | 3.35 |
| 5% | 2.62 | 3.79 |
| 2.5% | 2.96 | 4.18 |
| 1% | 3.41 | 4.68 |
Authors’ calculation.
Table 9.
Cointegration and Long Run model.
| ARDL Cointegration and Long Run Form | ||||
|---|---|---|---|---|
| Dependent Variable | LGDP | |||
| Selected Model | ARDL (1,0,0,0,0,0) | |||
| Sample | 2010–2021 | |||
| Cointegration Form | ||||
| Variables | Coefficient | Std. Error | t-Statistic | Prob. |
| D(LBR) | 0.00 | 0.00 | 0.10 | 0.02 |
| D(MTR) | −0.17 | 0.06 | −2.91 | 0.04 |
| D(RCY) | 0.01 | 0.11 | 1.09 | 0.03 |
| D(WST) | 0.00 | 0.00 | 1.05 | 0.05 |
| D(LPRD) | 0.28 | 0.18 | 1.54 | 0.04 |
| CointEq (−1) | −0.85 | 0.39 | −2.13 | 0.00 |
| long run coefficient | ||||
| variables | coefficient | std. error | t-statistic | prob. |
| LBR | 0.00 | 0.01 | 0.10 | 0.01 |
| MTR | −0.21 | 0.09 | −2.32 | 0.00 |
| RCY | 0.01 | 0.01 | 1.04 | 0.05 |
| WST | 0.00 | 0.00 | 0.83 | 0.05 |
| LPRD | 0.32 | 0.23 | 1.41 | 0.03 |
| C | 5.26 | 2.24 | 2.34 | 0.07 |
Authors’ calculation.
Table 10.
Stationarity: Phillips–Perron test.
| Phillips–Perron Unit Root Test | ||
|---|---|---|
| Greenhouse gases emissions from production activities (GEP) | Dickey–Fuller z(alpha) | −8.19 |
| Truncation lag parameter | 2 | |
| p-value | 0.59 | |
| Labor productivity per person employed and hour worked (LBR) | Dickey–Fuller z(alpha) | −3.44 |
| Truncation lag parameter | 2 | |
| p-value | 0.90 | |
| Generation of municipal waste per capita (GWA) | Dickey–Fuller z(alpha) | −6.77 |
| Truncation lag parameter | 2 | |
| p-value | 0.69 | |
Authors’ calculation.
Table 11.
Information criteria.
| GEP | LBR | GWA | |
|---|---|---|---|
| Akaike (AIC) | 1 | 0 | 1 |
| Hannan–Quinn (HQ) | 1 | 1 | 1 |
| Schwarz Bayesian (SC) | 1 | 1 | 1 |
| Final Prediction Error | 1 | 0 | 0 |
Authors’ calculation.
Table 12.
ARDL model2 Output.
| Dependent Variable | Generation of Municipal Waste per Capita | |||
|---|---|---|---|---|
| Sample | 2010–2021 | |||
| Multiple R-Squared | 94.06% | |||
| Adjusted R-Squared | 91.51% | |||
| F-Statistic; p-Value | 36.92; 0.01% | |||
| Residual Standard Error | 0.01 | |||
| Residuals | ||||
| Min | 1Q | Median | 3Q | Max |
| −0.02 | −0.01 | −0.04 | 0.01 | 0.02 |
| variables | estimate | std. error | t-value | Pr(>|t|) |
| Intercept | 3.45 | 1.26 | 2.73 | 0.02 |
| L(LGWA, 1) | 0.23 | 0.12 | 2.85 | 0.01 |
| LGEP | 0.11 | 0.17 | 1.69 | 0.05 |
| LLBR | 0.43 | 0.07 | 6.04 | 0.00 |
Authors’ calculation.
Table 13.
Cointegration analysis.
| Johansen Procedure | ||||
|---|---|---|---|---|
| Eigenvalues (lambda) | 0.99 | 0.76 | 0.03 | |
| Values of test statistic and critical value of test | ||||
| Test | 10 pct | 5 pct | 1 pct | |
| 0.32 | 6.50 | 8.18 | 11.65 | |
| 14.78 | 15.66 | 17.95 | 23.52 | |
| 75.52 | 28.71 | 31.52 | 37.22 | |
| Cointegration relations | ||||
| LGWA.l2 | LGEP.l2 | LLBR.l2 | ||
| LGWA.l2 | 1.00 | 1.00 | 1.00 | |
| LGEP.l2 | −0.38 | 0.52 | 0.88 | |
| LLBR.l2 | −0.48 | −0.39 | −1.95 | |
| Cointegration matrix | ||||
| LGWA.l2 | LGEP.l2 | LLBR.l2 | ||
| LGWA.l2 | −0.65 | −0.44 | −0.01 | |
| LGEP.l2 | 2.00 | −0.48 | −0.01 | |
| LLBR.l2 | 0.57 | −0.56 | 0.03 | |
Authors’ calculation.
Disclaimer/Publisher’s Note: The statements, opinions and data contained in all publications are solely those of the individual author(s) and contributor(s) and not of MDPI and/or the editor(s). MDPI and/or the editor(s) disclaim responsibility for any injury to people or property resulting from any ideas, methods, instructions or products referred to in the content. |
© 2023 by the authors. Licensee MDPI, Basel, Switzerland. This article is an open access article distributed under the terms and conditions of the Creative Commons Attribution (CC BY) license (https://creativecommons.org/licenses/by/4.0/).
Share and Cite
MDPI and ACS Style
Nica, I.; Chiriță, N.; Delcea, C. Towards a Sustainable Future: Economic Cybernetics in Analyzing Romania’s Circular Economy. Sustainability 2023, 15, 14433. https://doi.org/10.3390/su151914433
AMA Style
Nica I, Chiriță N, Delcea C. Towards a Sustainable Future: Economic Cybernetics in Analyzing Romania’s Circular Economy. Sustainability. 2023; 15(19):14433. https://doi.org/10.3390/su151914433
Chicago/Turabian StyleNica, Ionuț, Nora Chiriță, and Camelia Delcea. 2023. "Towards a Sustainable Future: Economic Cybernetics in Analyzing Romania’s Circular Economy" Sustainability 15, no. 19: 14433. https://doi.org/10.3390/su151914433
Note that from the first issue of 2016, this journal uses article numbers instead of page numbers. See further details here.