
Geomechanical Characterization of Crushed Concrete–Rubber Waste Mixtures

Water Centre WULS, Warsaw University of Life Sciences—WULS, 6 Ciszewskiego Street, 02-787 Warsaw, Poland
Sustainability 2023, 15(19), 14446; https://doi.org/10.3390/su151914446
Submission received: 14 August 2023
/
Revised: 24 September 2023
/
Accepted: 27 September 2023
/
Published: 3 October 2023
(This article belongs to the Special Issue Resilience and Sustainability in Geotechnical Engineering)
Abstract
:The present study investigates the dynamic and cyclic behavior of mixtures of waste materials, i.e., rigid anthropogenic mineral aggregates (RCA) mixed with recycled soft particles (RTW), based on a series of standard resonant column tests and cyclic torsional shear tests. The laboratory tests presented in this article are part of a larger research project that aims to provide useful insights to facilitate the application of RCA–RTW compositions as geotechnical materials. The impacts of various parameters including shear strain, mean effective stress, and, in particular, rubber content on the shear modulus (G), and damping ratio (D), are considered in detail. Rubber content is considered by the percentage of rubber in the mix weight. In general, the results show that as the RTW content increases, the shear modulus decreases while the damping ratio increases. The largest reduction in the G−modulus values occurs for the highest rubberized mix. The observed damping ratio for pure RCA is approx. three times lower versus rubber-reinforced specimens. The compliance of the behavior of the new RCA–RTW mixtures and pure recycled concrete waste tested under dynamic and cyclic loading is demonstrated. The effects of crushing of the RCA material itself during cyclic loading are visible, and dilution of this process due to the addition of rubber. Furthermore, the test data reveal that the values of the G−modulus and D−ratio at small and medium strain levels are considered independent of the time of vibration.
1. Introduction
In today’s society, dependence on the use of motor vehicles is growing rapidly in various sectors of the economy. As a result, the ever-increasing production of motor vehicles not only causes more noise and air pollution but also creates problems in the disposal of waste materials such as tires. Tire disposal is a major challenge throughout the world. The global market of tire disposal is estimated at 1.5 billion units, with an equal number falling into the end-of-life tire category [1]. Tires are designed to withstand the rigors of the environment so that they are durable and safe when used on a vehicle. Since rubber does not decompose quickly, a suitable disposal method must be found that is both economical and environmentally friendly [2]. Some of the common and effective methods of using scrap tires for engineering purposes can be found in geotechnical engineering projects. Table 1 provides a summary of statistics on tire waste generation and recovery rates in different countries [3].
From a material point of view, the tire is a mixture of synthetic and natural rubber to which some specific substances are added to ensure performance, durability, and safety (Table 2).
There are different ways of using scrap tires [5]. In general, the use of shredded rubber waste depends on the degree of shredding. The particle size gradation of scrap tire products is summarized in Table 3, regarding ASTM D6270-17 (2017) [6]. According to Siddique (2008) [7], scrap tires can be managed as whole tires, as slit tires, as shredded or chopped tires, as ground rubber, or as crumb rubber. shredded tires, ground rubber, or crumb rubber products. Shredded tires are produced in tire shredding machines. These machines can cut the tire into two halves or separate the sidewalls from the tread of the tire. Shredded/chipped tires are tire shreds or chips that have undergone primary or secondary shredding or both. The size of tire shreds produced from primary shredding can vary from as large as 300–460 mm long and 100–230 mm wide to as small as 100–50 mm long, depending on the manufacturer’s shredder model and the condition of the cutting edges. The production of tire chips, which typically range in size from 76 mm to 13 mm, requires both primary and secondary shredding to achieve adequate volume (quantity) reduction. Another type of tire-derived aggregate is ground rubber, which for commercial applications may be as large as 19 mm and as small as 0.15 mm. This depends on the type of crushing equipment and the intended applications. Ground rubber in rubber applications is typically subjected to two stages of magnetic separation and screening. Different size fractions of rubber are recovered [8]. The smallest size fraction is called crumb rubber. It consists of particles ranging in size from 4.75 mm to less than 0.075 mm.
After shredding, tire waste can be used on its own, incorporated into the soil, or mixed with soil. The geotechnical applications of soil–waste tire compositions are mainly favored in transport infrastructure or in damping systems to reduce vibrations, such as railway bedding or machine foundations [9]. Other geotechnical applications of rubber include embankment fill, retaining walls and bridge abutment fill, insulation layers to limit frost penetration and drainage layers. Whole tires are sometimes used as retaining walls or reinforcing layers in earth fill or floating breakwaters [10].
Over the last few decades, extensive research has been carried out on the behavior of natural soil–recycled tire waste (NS–RTW) mixtures. These studies are usually based on the evaluation of conventional engineering properties, such as permeability, compaction characteristics, and/or shear strength parameters, where the mixtures studied are mostly considered under static loading conditions. Despite the extensive studies on the physical, chemical, and mechanical properties of NS–RTW mixtures, experimental data on their dynamic properties are still rather limited [11]. In Tsang’s research [12] it is possible to find the application of soil–rubber mixture as a seismic isolation layer under the foundation of building structures. In particular, there are no reports in the literature on the dynamic properties of geocomposites based on recycled waste concrete (e.g., recycled concrete aggregate, RCA) and recycled tire waste (RTW). Most of the studies to date relate to mixtures of natural, non-cohesive soils–generally sandy soils. Li et al. [13] provide a summary of the last decade of research into the dynamic behavior of sand–rubber mixtures. Kaneko et al. [14], in their work, dealt with tire chips and their mixture with sand for the purpose of mitigating liquefaction. The objective of the Il-Sang and Lijuan [15] research was, for example, to understand the dynamic characteristics of Tire Derived Aggregate (TDA) employed in retaining wall backfill through a full-scale shake table test. There are also few papers in the literature relating to cohesive soils mixing with rubber waste (e.g., [16,17,18,19]). However, the use of waste products to improve other waste products has received limited research. Therefore, the study of new mixtures made exclusively from recycled waste (construction, demolition, incineration, or rubber) is the focus of this paper.
The authors previously investigated the compaction properties [20], compressibility [21], and shear strength [22] of RCA–RTW composites. The static properties of such composites could thus be determined. The evaluation of the dynamic and cyclic response of RCA–RTW mixes is required for the design of many geotechnical structures such as retaining walls, foundations, and slopes subjected to cyclic shear loading (e.g., earthquake or traffic loads). The main objective of this research is to find out if and how the soil–rubber mixtures could be used for vibration reduction. Vibrations are associated with cyclic loading, which is particularly significant in densely populated areas. They can be caused, for example, by heavy traffic, geotechnical works (pile driving, soil compaction), or seismic or paraseismic events. The latter problem occurs, for example, in Poland, although the country as a whole is considered to be non-seismic. Quasi-earthquakes caused by deep mining of coal and copper ores occur in two Polish regions: the Upper Silesian Coal Basin (GZW) near Katowice and Bytom, and the Legnica-Głogów Copper District (LGOM) near Lubin and Polkowice, to the west of Wroclaw. Both areas are heavily urbanized. The intensity of the paraseismic can reach magnitude VII on the MSK scale and 4.5 on the Richter scale [23]. Although such tremors usually do not cause serious damage to well-constructed buildings, they have a negative impact on the buildings, they have a negative impact on people’s well-being.
The purpose of this paper is therefore to investigate the small–strain shear stiffness (Gmax) and shear modulus (G) degradation with increasing shear strain and damping ratio (D). The stiffness and damping parameters were quantified as a function of the RCA–RTW mixture. A comparison was also made between the results obtained for the tested geocomposites and pure RCA specimens. In this study, using a GDS-modified resonant column apparatus, a series of resonant column tests and torsional shear tests were carried out. The results help to elucidate the dynamic and cyclic properties of the crushed concrete–rubber mixture over a wide range of deformations, which in turn can broaden the horizons of the application of recycled materials to protect infrastructure against vibrations.
2. Materials and Methods
2.1. Characteristics of Research Material
This study utilized a synthetic material, recycled tire waste, supplied by the local shredder. Crushed rubber without any textile or steel cord was collected in the size of 0.5–2.0 mm. This material was screened and separated into two homogeneous fractions: powdered (P) of 0.5–1.0 mm and granulates (G) of 1.0–2.0 mm (Figure 1a,b). Rubber was classified into powder and granulate based on available literature related to this kind of waste [24,25]. No amounts of textile parts or steel strapping were found in either rubber additive. There were no health hazards associated with the two recycled rubber wastes used. The National Institute of Hygiene gave them a positive health assessment.
For the soil material, recycled concrete aggregate was used (Figure 1c). RCA is an example of anthropogenic material that is a product of construction and demolition (C&D) [26]. Construction waste is created when buildings, roads, and infrastructure projects are demolished, dismantled, constructed, and extended. It comprises materials such as concrete, limestone, brick, asphalt, natural stone or gravel, and sand. These materials, together with soil excavated during construction, are among the largest waste streams in Poland. They account for more than 50% of the total waste generated. At the same time, the demand for mineral raw materials for the construction industry in Poland remains high. Consistently recycling C&D waste is therefore a fundamental part of conserving natural mineral resources and forms part of our corporate social responsibility. From a sustainability perspective, the reuse of recycled building materials is essential [27]. Using non-renewable resources such as Natural Aggregates (NA) is undesirable and substitutes are strongly recommended, especially for structures such as roads [28].
As an artificial aggregate, RCA has a different structural composition compared to natural aggregates. RCA contains fragments of the cement matrix, which consists of anhydrous cement and hydration products that form a porous microstructure. The high water absorption of RCA, especially the outer layers called “attached mortar,” may be responsible for the lower mechanical properties compared to natural aggregates [29,30]. On the other hand, however, the results of repeated load triaxial tests on RCA [31] reported that this material produces comparatively smaller permanent strain and greater resilient modulus than those of commonly used granular natural base materials [32].
The RCA used in this study was collected from a building demolition site in Warsaw through a skid-mounted impact crusher. The strength class properties of the Portland cement structural concrete were estimated to be in the range of C16/20 to C30/35. This was done based on data obtained from the building plans. Subsequently, the material was separated using a mechanical shaker and divided into several species, each consisting of screened fractions. In this study, only one type of aggregate, with a grain size range of 0–2.0 mm, was the subject of laboratory testing. The aggregate was 99% broken cement concrete, the remainder being glass and brick (Σ(Rb, Rg, X) ≤ 1% m/m), according to the ISO 17892–4:2016 standard [33], and did not contain any asphalt or tar elements.
RTW and RCA parameters are listed in Table 4.
In order to investigate small and medium strain responses of RCA–RTW mixtures, four different compositions were prepared with varying percentages of recycled rubber content. The details of the composition of the samples are given in Table 5.
The proportion of rubber waste by mass (χ%) in RCA–RTW mixtures considered in this study was maximum equal to 20%, corresponding to a proportion of rubber waste by volume of 35–40%. RCA–RTW (20%) was identified as the optimum mixture, avoiding the rubberlike behavior of the composition [35]. Particle size distribution curves of tested blends are shown in Figure 2 with photographs.
2.2. Mixtures Preparation
The mixtures tested were produced by meticulously mixing rubber with recycled concrete aggregates at different weight proportions. For sample preparation, the dry tamping (DT) technique was chosen. The RCA was dried in an oven at a temperature of 105 °C for 24 h, and the tire scrap was left to stand at room temperature for 36 h. Compaction was employing tamping with a wooden hammer. Very dense blends with initial relative densities Dr > 85% were tested. A standard split mold bolted over the resonant column pedestal with a diameter of 70 mm and a height of 140 mm was used to prepare RCA–RTW mixtures. A rubber membrane was first stretched inside the mold and held taut by applying a continuous vacuum to the inner walls of the mold. A tamping rod weighing 400 g was employed. The mixes were produced in 3 to 5 layers with a free fall height of 10 to 50 mm. The under-compaction effect induced by the energy of tamping the next layers during sample preparation was adopted to achieve uniform density [36]. The under-compaction of each layer was calculated following the equations given by Bai (2011) [37]. The samples were prepared in 3 layers—8, 16, and 25 blows; and 5 layers—5, 10, 15, 20, and 25 blows, respectively.
As different percentages of the composition were studied, each mixture had a slightly different dry density, with ρd = 1.30 g/cm3, 1.38 g/cm3, 1.46 g/cm3, and 1.50 g/cm3, for the M1_R, M2_R, M3_R, and M4_R mixtures respectively. For all blends tested, the ρd values approached the maximum dry densities. The values of the maximum and minimum void ratios, as well as the maximum and minimum dry densities for the analyzed blends, are following Gabryś (2023) [20]. Soil grains in prepared mixes were equal to or slightly smaller than rubber particles. Since the rubber content is below 30% and DRTW ≥ DRCA, the RCA skeleton controls the mix’s behavior.
2.3. Tests Procedure and Apparatus
The initial stages of the measurements included the first flushing of the equipment (especially the saturation of the pore pressure system). De-aired water was then slowly released from below with the top valve open to the atmosphere. Saturation was achieved by a stepwise increase in cell pressure and back pressure. At this stage, the cell pressure was allowed to exceed the back pressure by no more than 10 kN/m2. Saturation was considered complete when the pore pressure coefficient, B [38], was greater than 0.95. The change in height was carefully measured when saturation ceased to occur. After saturating, the specimens were isotropically consolidated at three different effective stresses, i.e., 90, 180, and 270 kPa (covering a range of pressures expected in many geotechnical applications) [39]. The volume change of the samples during consolidation was measured using volume change equipment. These procedures are identical to those used in conventional triaxial testing.
The dynamic and cyclic tests were performed in an integrated resonant column/cyclic torsional shear device, the GDSRCA. The resonant column (RC) test is based on the theory of wave propagation in prismatic rods. The analysis of the test data was described in detail by Drnevich (1985) [40] using ASTM D4015 [41].
A computer-controlled modified Stokoe-type resonant column apparatus was used in this study (Figure 3a, see the scheme given by Gu et al. [42], and its modification by Sas et al. [43]) to excite one end of an isotopically confined solid cylindrical soil specimen. This apparatus is an example of a fixed–free resonant column, where the soil specimen fixed at the bottom (the passive end) and free at the top (the active end) oscillated only in a torsional mode. The instrumentation, placed on the top of the sample, included a loading cap, an electromagnetic drive system incorporating precision wound coils and a permanent magnet, a counter-balance, and an accelerometer. The energization mode of coils was switchable by software in order to provide the torsional tests [44].
Cyclic torsional shear tests were performed in the GDSRCA through the addition of a high-precision proximitor transducer system (Figure 3b). The proximitor encompassed two components: a sensor and target plates. The target plates were attached to the GDSRCA rotor arm and moved when the sample was excited. The sensor was mounted on the (fixed) plate of the GDSRCA drive system and monitored the lateral displacement of the target metal plate [45]. The new model of the GDSRCA Control Box (version 2) allowed for more reliable measurements of the peak shear strain with a precision of 1 × 10⁻⁶. In addition to the new control box, the improved experimental accuracy was attributed to the addition of a higher precision proximitor with a hardware offset potentiometer, two selectable proximitor gain channels, and two input channels for recording axial displacement and pore water pressure.
The research started with the standard test performed in a resonant column cell, i.e., with resonance in torsion. Next in line was a damping ratio test in torsion. An electric motor was used to provide harmonic torsional vibration to each mixture. A harmonic torsional load of constant amplitude was applied in a certain frequency range (10 to 200 Hz). The response curve (strain amplitude) was measured. By recording the resonant frequency of the first mode, the shear wave velocity (VS) was obtained. From the shear wave velocity and soil density, the Gmax parameter was calculated. From the distribution of free vibrations after the end of the imposed vibrations, the DT (damping ratio in torsion) parameter of the material was obtained [46]. After Gmax and DTmin were determined, the amplitude of the cyclic torsional harmonic load was increased to obtain the strain-dependent shear modulus and damping values for a wide range of strains (γ from about 1.5 × 10⁻⁶ to 1.3 × 10⁻⁴). To vary the strain levels, each specimen was tested at between 10 and 20 output amplitude values.
To compare the shear modulus and damping ratio calculated based on the standard tests, cyclic torsional shear (CTS) studies were performed on the same specimen, already placed in a cell. The torsional shear upgrade allowed us to measure the torque that the resonant column drive could apply to the soil sample per mV of system output in Nm/mV. This is the result of the measurement of the displacement which is produced by applying an output voltage with a known shear modulus (G). Knowing the system’s torque/mV capability, the G–modulus of the mixture could be determined. Since the applied torque is known when an output voltage is given, it is converted to shear stress. The shear strain was calculated from the proximitor’s direct measurements of displacement. The shear strain was controlled by applying a voltage to the coil in the range of 1 × 10⁻² to 1 × 100, which produced a shear strain of approx. γ = 1 × 10⁻⁶ to 1 × 10⁻². The shear stress and strain were plotted on a graph. The slope of the graph was the shear modulus of the tested mixture.
The undoubted advantage of the resonant column test implemented in this research was its non-destructive nature, so multiple tests could be performed exactly on the same RCA–RTW composition. On the other hand, however, as also pointed out in the work herein, shear modulus and damping in soils should be measured at the same frequency and amplitude of excitations [47,48].
3. Results and Discussion
This section presents the test results obtained from the resonant column apparatus. This is followed by a discussion of the dynamic and cyclic properties of the RCA–RTW blends, with special attention to the influence of rubber waste, and finally a comparison with the pure RCA sample.
3.1. Standard Resonant Column and Cyclic Torsional Shear Test Curves
Typical frequency versus strain curves and exemplary free vibration decay curves from the resonant column test for the mean effective stress p’ = 90 kPa and input amplitude A = 0.08 V are shown in Figure 4. Based on Figure 4a, it is evident that the value of strain increases with increasing frequency up to the resonance frequency (fr), at which point the level of strain begins to decline. The lowest frequency, showing the highest shearing stress, gives the resonant frequency. The linear-elastic behavior of the tested compounds at low strain is indicated by the symmetry of the curves concerning the resonant frequency. The frequency response curve becomes increasingly asymmetrical and shifts to the left as the strain increases. This is in line with the behavior of natural soil [49].
The effect of RTW is also noticeable here. With increasing rubber content, both the resonant frequency and shear strain values decrease. This trend is general for all pressures and amplitudes. The maximum fr is obtained for the pure recycled concrete aggregate, while the minimum fr is about doubled for the mix with χ = 20% rubber insert, which is also the most outlying of the others. The next three compositions, M2_R, M3_R, and M4_R, have similar values for both fr and γ.
From Figure 4b it is clear that the M1_R compound with χ = 20% of RTW is characterized by the highest values of the damping parameters. As χ is reduced, the damping parameters decrease. Analysis of the data presented in Figure 4b shows that the more rubber-modified the compound, the faster the attenuation (the attenuation is represented only by the straight section of the graph). For M1_R, it takes less than 10 cycles, whereas for M4_R (χ = 5%) it takes 30 cycles.
Graphical interpretation of the results from cyclic torsional shear tests in the form of hysteresis loops, i.e., shear stress (τ)—shear strain (γ) relation, is shown in Figure 5 and Figure 6. Shear stiffness (G) is defined in the CTS test by secant modulus at reversal points as shown in Figure 5. Initial shear stiffness (Gmax) is shear modulus at infinitesimal strain when shear strain is from γ = 1 × 10⁻⁶ to 1 × 10⁻⁵. Hysteresis damping (DCTS) is defined as:
where AL and AT are the area of the hysteresis loop in Figure 5, and the area of the triangular in Figure 5, respectively [46].
The hysteresis loops τ(γ) presented in Figure 6a,b were plotted for all RCA–RTW mixtures, obtained for excitation amplitude A = 1 V, two different excitation frequencies f = 1 Hz and 10 Hz, and two different mean effective stresses p’ = 90 kPa and 180 kPa. The hysteresis loops were recorded during the 3rd excitation cycle. Only a few examples of hysteresis loops have been included in this article. Each compound was tested with different loading steps, that is with different excitation amplitudes, from Amin = 0.01 V up to Amax = 1 V. A hysteresis loop τ(γ) can be generated for each such test.
Reviewing the data in Figure 6a,b, it can be seen the small level of strains for all blends; the strain did not exceed 1%. All hysteresis loops are represented as a “spindle-shape” [50]. The mean effective stress exhibits a distinct influence on the obtained hysteresis loops. A lower value of p’ results in a higher strain, even up to a value of 1.5 × 10⁻²%, but in a lower shear stress, a maximum of about 7 kPa. The angle of inclination of all hysteresis loops together in Figure 6a is generally higher in comparison with those in Figure 6b, but not greater than 65–70°. At p’ = 180 kPa (Figure 6b), most hysteresis loops are more compressed, with an angle to the horizontal of about 45–50°. γmax in this case is approx. 8.0 × 10⁻³%, while the maximum value of τ is almost 8 kPa.
Regarding the excitation frequency, it demonstrates a significant impact on the results from CST tests. Lower frequency, here f = 1 Hz, results in smaller hysteresis loops. This effect should translate into smaller values of shear modulus and, consequently, a smaller damping ratio. The exception is the M2_R blend for p’ = 90 kPa, where the hysteresis loop obtained for f = 1 Hz is many times larger than that obtained for f = 10 Hz.
It is possible to see the effect of the addition of rubber waste on the hysteresis loops too, but it is not clear. It must be considered together with other factors such as p’ and f. For example, for a compound with a rubber content of 20% (M1_R), if the test is carried out at p’ = 90 kPa and f = 1 Hz (Figure 6a), the hysteresis loop is the outermost and also the most inclined to the 0X axis. The highest values of the dynamic parameters can be expected. Conversely, the lowest values are projected for χ = 15% (the M2_R mixture), where the hysteresis loop is the smallest of any. In the case of p’ = 180 kPa (Figure 6b), irrespective of the frequency, χ = 20% and χ = 5% of rubber additive results in very similar hysteresis loops (predicted similar values of dynamic parameters). For the M2_R and M3_R compounds with 15% and 10% rubber compactness respectively, the situation is similar.
The dynamic diaphysis curves are presented in Figure 7 and Figure 8. They can be obtained by connecting the peaks of the shear stress–shear strain hysteresis loops for different load steps. In general, increasing stress–strain curves were obtained for all specimens tested. The maximum dynamic shear stress has not yet been marked and it can be assumed that this will occur at higher strain values. Overall, by CTS testing, dynamic properties in the low strain range can be obtained. At the moment, it is difficult to predict the direction of changes of τd(γd), whether it will be linear or, as reported in the literature for soil–rubber mixtures, rather hyperbolic [13].
Analyzing the dynamic diaphysis curves in Figure 7, it can be noticed that, irrespective of the excitation frequency, the curves move downwards with increasing RTW content. This behavior can be observed at any p’. It also follows that the mixture with a higher rubber additive shows lower shear stress. The M1_R mixture breaks down this trend. This compound, with the highest rubber content tested, produced the most divergent results (as shown already in Figure 4) and does not follow the general trend. Considering only the blends M2_R, M3_R, and M4_R, a decreasing distance between the curves can be found. The results obtained are similar to the conclusions seen by researchers of natural soil mixtures with rubber (e.g., [51]). As the rubber content increases, the variation in the curves becomes smaller. At a certain point, there is such a degree of saturation with rubber that further addition does not have any effect on the dynamic diaphysis curves.
As illustrated in Figure 8, for the example of χ = 20%, an increase in mean effective stress shifts the dynamic diaphysis curve upwards. This shift is more pronounced at the higher pressures tested, here p’ = 180 and 270 kPa.
3.2. Shear Modulus and Damping Ratio
In Figure 9 and Figure 10, the degradation of the compound stiffness and the change in damping ratio with the progression of shear strain are presented. Figure 9 relates to the results from the standard resonant column apparatus, while Figure 10 illustrates the results from cyclic torsional shear. In general, the distribution of the dynamic shear modulus and damping ratio data of the mixtures is in good accordance with the curves of the pure RCA specimen regardless of the type of test carried out, mainly when rubber content is less than 15% (M3_R and M4_R). As a rule, the G−modulus significantly decreases and the D−ratio increases with shear strain amplitudes, more pronounced when the strain exceeds approx. 1.0 × 10⁻³%.
Stiffness degradation is more significant with increasing rubber content under different mean effective stress. The opposite observations can be found in the work of Feng et al. [52] and Sarajpoor et al. [53]. It should be noted, however, that the works cited concerned natural materials, and sand–rubber mixtures, not recycled waste materials. It is clear that specimens with a lower rubber additive have higher stiffness than specimens with a higher RTW during both dynamic and cyclic loading. Whether the ‘parent’ material is natural or sustainable does not matter. In the case of dynamic tests (Figure 9), it can be further observed that the largest reduction in the G–modulus values occurs for the M1_R mix, the smallest one—for the RCA specimen. In the M1_R mix, RCA is modified with two sizes of RTW, powder and granulate. The rubber sizes are relatively large up to 2.0 mm, and therefore contain more voids than the other three compounds. With increasing void content (e) for a given cell pressure, shearing moduli are reduced [54]. Moreover, pure RCA just like pure sand exhibits the highest dynamic shear modulus with a value of approx. 90–89 MPa for p’ = 90 kPa and γ up to 1.0 × 10⁻³%, 143–140 MPa for p’ = 180 kPa, and 181–180 MPa for p’ = 270 kPa. The addition of as little as 5% rubber to the RCA (see the M4_R mix) results in a reduction in the G values of approximately 25–50 MPa (a 26% reduction compared to pure RCA). The exception is the blend M2_R (χ = 15%), where a strong decrease in stiffness is observed for the lowest stress, and already a very gentle one for the highest stress.
In the case of cyclic loading of all the mixtures tested here (Figure 10), similarly, the blend M2_R is the most outlandish mix. It results deviate from the other mixtures and does not cover the trend in the dynamic behavior of soil–rubber compositions. The cyclic shear moduli of this mixture are the smallest compared with the other mixtures and pure RCA specimen (a 26–27 MPa reduction in the G−modulus), for p’ = 90 kPa and 180 kPa, regardless of the excitation frequency.
Current research confirms also the effect of mean effective stress on the dynamic and cyclic behavior of the tested RCA–RTW compositions. In Figure 9 and Figure 10, it is clearly shown that when the p’ increases then the G–modulus increases and the D–ratio decreases. The contact pressure between the artificial soil particles, as with the natural aggregates, increases with the increase in the p’, hence all the specimens exhibit higher G and lower D [1].
At mean effective stress of over 90kPa and an RTW of 20%, the reduction in the G values is of the order of 27% in the standard resonant column tests. In the cyclic tests, taking the same mixture as an example (M1_R), the greater reduction in the moduli around 40% is for lower pressures. For higher pressures, the change is in the range of 16–17%. Moreover, it should be noted here that at the higher frequency, there is a slightly greater change in the shear modulus, of 2–3%, than at the lower frequency. In the case of RCA modification with less than 20% rubber waste, the reduction in stiffness is more significant at lower pressure values for both dynamic and cyclic loads. This is due to the low number of rubber particles and their small size, up to 1.0 mm. They fill the gaps between the recycled concrete particles, making the mixture denser and therefore stiffer.
Irrespective of the mean effective stress, the reduction in the G–modulus is of the order of about 13% for RC tests and of about 30% for CTS tests (exactly 29% for f = 1 Hz and 31% for f = 10 Hz) for the pure anthropogenic aggregate specimen.
The damping characteristics of the tested RCA–RTW mixtures show the relationship between the damping ratio and RTW content. In general, the tendency of the D−ratio to increase as the rubber content increases can be seen here, as illustrated in Figure 9 and Figure 10. The exception is the mixture of χ = 15% (M2_R), especially under cyclic loading and higher pressures (see Figure 10b,c), as well as under dynamic load and at a pressure of 270 kPa (see Figure 9c). For all remaining RCA–RTW compounds, the damping ratios increase with increasing rubber waste content.
Figure 9 indicates that the inclusion of 20% of rubber particles results in torsion damping of about 3.0% to around 6.5%. The torsion damping ratio of pure RCA under dynamic loading is 3 times lower, reaching the maximum value of 2.0%. From an analysis of Figure 9, it appears that the optimal RTW content when the mixture damping ratio is significantly higher than the other results is about 20%. As far as CTS tests are concerned, an addition of 20% of RTW to pure RCA allows hysteresis damping of up to 11–12% to be achieved, whereas an addition of 5% achieves maximum hysteresis damping of approximately 4%. Naturally, the effect of excitation frequency is also observed, as with the G-moduli. At a frequency of 10 Hz, the hysteresis damping is approx. 2% higher than at 1Hz for each mixture tested. The damping ratio of pure RCA under cyclic loading can be even 70% greater compared to the highest rubber waste sample, reaching a maximum of 4.8% for p’ = 90 kPa and f = 10 Hz.
Obviously, the effect of the rubber waste content on the damping properties of the mixture is also dependent on the mean effective stress and shear strain. As the p’ stress increases, the D−parameter decreases, reaching the minimum values at the highest applied p’. The research presented here confirms a recent study carried out in a resonant column by Mog and Anbazhagan [55]. In the anthropogenic material studied, as in the natural aggregate, sand, and gravel, the D−ratio decreases with increasing pressure due to the higher contact between the particles, which reduces the attenuation of the wave as it propagates.
In rubber-reinforced anthropogenic material mixtures, the same phenomenon is not observed as in sand/gravel-rubber mixtures. That is namely, the damping ratio increases with increasing rubber content at low shear strain levels (1.0 × 10⁻⁴%–1.0 × 10⁻³%), and then it exhibits lower values than the clean sands for higher strain levels [56]. At medium strains, γ > 10−3%, the variation in the D−ratio is more pronounced. This is due to the increasing stiffness of the material.
The effects of the addition of recycled tire waste on the geomechanical characterization of recycled concrete aggregate can be compared to the effect of this additive on natural aggregate, e.g., sand. According to Jastrzębska and Tokarz [57], rubber particles have low stiffness, strong deformation capacity, and large elasticity. These properties make them easily change shape. In comparison with this waste, the crushed RCA particles are rigid, rough, and highly porous, with an angular shape [32]. In terms of stiffness, RCA particles are similar to sand. In line with the findings of Liu et al. [58], it should be noted here that the addition of RTW to RCA results in a weakening of the structural surface contact. As the rubber content rises, more rubber particles touch one another, making the sample characteristics increasingly rubbery. The low stiffness and high elastic deformation of the rubber particles added to the RCA mix cause weak contact between the sample particles, which adversely affects the shear modulus. On the other side, the rubber particles provide inherent damping. This inherent damping contributes more to energy dissipation than other factors at small strain levels, which is the case in the studies presented. As a result, the RCA–RTW blends have a greater damping effect than pure RCA, which is extremely important from a vibration reduction point of view. Due to the low density of rubber compared to RCA employed in this research [22], the distribution of rubber particles is random and difficult to control. Therefore, the experimental damping ratio data are scattered in character.
3.3. Maximum Shear Modulus and Minimum Damping Ratio
For the compounds tested, the addition of even 5% RTW has a significant effect on the small strain shear modulus (Figure 11a). For the standard resonant column tests, the 5% rubber inclusion results in a reduction in Gmax by approx. 26% for pure RCA. Increasing the RTW content by a further 5% in the subsequent blends results in a decrease in dynamic Gmax of around 20–30% for each composition. The largest difference in the dynamic Gmax values is between χ = 20% and χ = 15%, at least for the first two pressures applied in this study (90 and 180 kPa). As shown in Figure 11a, the dynamic Gmax results obtained are very well structured, with the lowest Gmax values for the M1_R mixture and the highest for pure anthropogenic material. This effect of the rubber inclusion is due to the low shear stiffness of the rubber material itself.
In the case of cyclic loading the results of the cyclic small–strain shear modulus are not consistent (see Figure 12a). The maximum addition of rubber, in this case, χ = 20%, does not result in a maximum decrease in the initial cyclic stiffness of the mixture. The lowest initial stiffness, in most cases, except for p’ = 90 kPa, regardless of the excitation frequency, is represented by the M3_R mixture. These values are respectively around 55 MPa, 95 MPa, and 125 MPa. The cyclic maximum shear modulus is therefore on average 39% lower than the initial stiffness of pure concrete aggregate. Analysis of the data in Figure 12a shows that the highest cyclic initial stiffness at the highest pressure is characteristic of the M1_R mixture and is equal to 232 MPa for f = 1 Hz, and 246 MPa for f = 10 Hz.
As also discussed for the dynamic Gmax, at high rubber content (the M1_R compound, with ≥ 20% by weight of compound), and all confining pressures, the small–strain damping ratio is the highest (Figure 11b) with the values DTmin between 3.0% and 4.5%. There is an increase of about 3% compared to the M2_R specimen (χ = 15%). This effect of the rubber inclusion is not as significant for DTmin when RTW ≤ 15%. Thereafter, each 5% decrease in rubber content causes a further 0.5–0.3% decrease in DTmin. The effect of rubber on the minimum damping ratio in torsion gradually decreases as well with increasing p’.
In terms of hysteresis damping (Figure 12b), a higher RTW results in higher DCTSmin, except for the M2_R mix, which coincides with the results from the dynamic tests. The highest initial hysteresis damping characterizes again M1_R mixtures with the values DCTSmin between 1.5% and 4.4%. As presented in Figure 12b, the excitation frequency affects the initial hysteresis damping of the RCA–RTW mixtures, as for f = 10 Hz it can increase between 2.5 and 3 times compared to f = 1 Hz. The CTS test results show the dependence of DCTSmin on mean effective stress. An increase in p’ results in a 10–20% decrease in damping for most mixtures.
The effect of the rubber on damping properties is because, for small shear deformations, the damping mechanisms are mainly because of friction at the interface of the RCA grains, rather than their dislocation. In the case of granular crushed concrete aggregates with granular rubber, the increase in Dmin occurs due to the higher coefficient of friction between the soil and rubber particles, as well as due to the mechanical interlocking of the particles. The latter process is more effective due to the local deformation of the rubber particles in their contact with the RCA particles of the mixture.
A comparison of Gmax from RC and CTS tests shows similar values of Gmax at a pressure of 90 kPa, between 45 and 100 MPa. The most similar results were obtained for compounds M2_R, M3_R, and M4_R, with up to 15% of rubber content per mixture weight. As the pressure increases, the results from the two tests are different. With increasing p’ the difference between the Gmax results obtained is even up to 80% for, e.g., the M2_R mixture. In the case of the tested materials, the reported stiffness results can be strongly influenced by the crushing process of the RCA material itself. RCA can be readily crushed, and there is a high possibility that the particles may be crushed during the loading process [32]. It is clear from the above that RCA’s own crushing is greater under cyclic loading and higher effective confining pressure, hence the slightly lower shear modulus in the CTS tests. The addition of RTW to crushed concrete seems to weaken the breakage of the RCA particles and induce higher shear modulus from CTS tests than from RC tests.
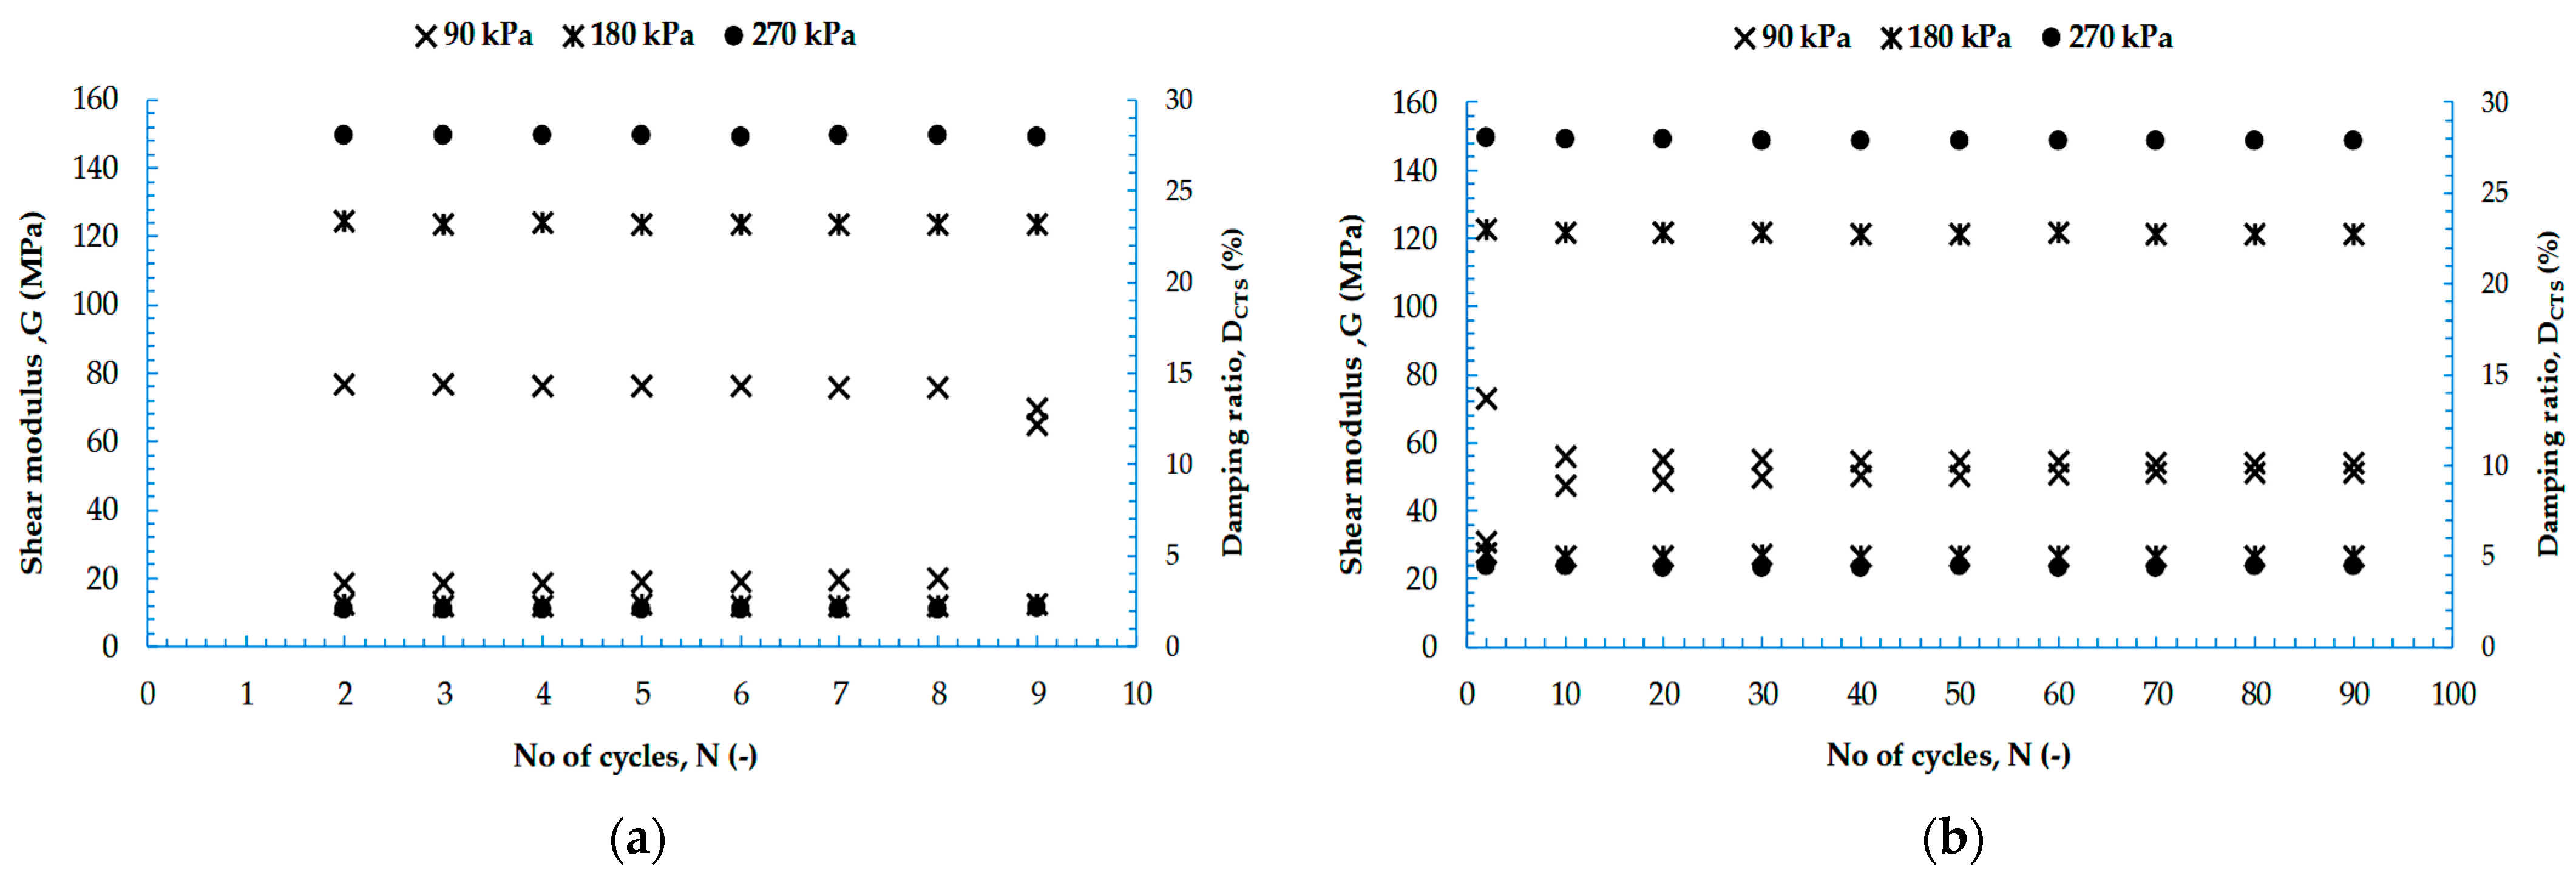
Comparing torsion and hysteresis damping, it is clear that the damping ratios obtained in standard RC tests are higher than the DCTSmin obtained at 1 Hz with the difference increasing with the higher rubber compound content. At higher frequencies, here 10 Hz, cyclic tests provide higher damping values than dynamic tests. According to the study conducted on natural soils, e.g., cohesive soils [59], the excitation frequency above 1 Hz significantly affects the minimum damping ratio, as it can increase by 100% over a log-cycle increase in excitation frequency. Current research seems to support this theory, although it concerns recycled concrete waste mixtures modified with rubber waste. In general, the literature suggests [60] that the two tests should give similar results as the strain range is small. However, it should be remembered that both tests operate over a different frequency spectrum. The cyclic torsional test is conducted here at frequencies between 1.0–10 Hz. In the resonant column test, the resonant frequency ranges from 30 Hz to 200 Hz. Of course, each type of test also involves a different number of loading cycles. However, many researchers observed that the number of cycles does not affect the shear modulus below the elastic threshold strain, usually in the range of 1 × 10⁻⁴% to 1 × 10⁻²% [61,62,63]. This is also evident from the results presented in this paper. An example of the variation of the cyclic shear modulus and hysteresis damping coefficient as a function of the number of cycles for the M1_R compound is shown in Figure 13. Thus, the values of the G−modulus and D−ratio at small and medium strain levels are considered independent of the time of vibration.
4. Conclusions and Recommendations
The main conclusions drawn from this study are highlighted below.
- It is possible to improve the dynamic and cyclic properties of crushed concrete, especially damping characteristics, by modifying RCA with the corresponding RTW content. During both dynamic and cyclic loading, the stiffness modulus of the compound created tends to decrease while damping tends to increase due to soil yielding and consequent increase in deformation. The experimental results for mixtures made of small RCA grains and similar size or slightly larger RTW particles [the ratio of median particle sizes (D (50, RTW)/D (50, RCA)) ≈ 1] show that even a small amount of rubber (χ < 10%) results in a reduction of the G and Gmax–modulus by an average of about 20–25% (due to the soft nature of rubber), as well as an increase in the D–ratio by an average of approx. 2–3% (due to the energy absorption nature of rubber). Therefore, it can be seen that on the one hand, there is a reduction in RCA stiffness, but on the other hand an improvement of its capability to transmit vibrations as observed based on the cyclic tests.
- The addition of rubber was deliberately set at 20% by weight of the mixture. In the case of higher rubber content in the mixture acquiring the Gmax−modulus and the Dmin− ratio from RC tests could become a rigorous task due to the deformability of the material. This characteristic of the rubber waste is also the reason why recycled concrete aggregate enriched with rubber has lower stiffness than unmodified crushed concrete.
- Combining the results of the RC and CTS tests, a safe approximation of the smallstrain shear modulus and damping ratio was obtained for rubber contents of up to 15% by weight of the RCA–RTW mixture. Because RCA particle crushing occurs after cyclic stress, the increase in RTW in the designed mixtures reduced the crushing process consequently leading to mixes with higher stiffnesses after cyclic tests than dynamic tests.
However, further study is needed to assess the optimum value of the rubber content to achieve maximum improvement in the geomechanical behavior of the RCA–RTW mixtures. It is most likely that a positive increase in stiffness could be achieved by making a slight change in the mix design. It would be necessary to select the proportions of rubber additive to soil in such a way that (D (50, RTW)/D (50, RCA)) ≤ 1 where soil forms a percolation skeleton and rubber-rubber particle interaction takes place [13]. In summary, what is still relevant, and what would be important in future studies, is changing the rubber additive’s size.
In addition, the current study did not perform tests in the higher deformation range, which is achievable, for example, in cyclic triaxial tests. These tests would be a good complement to the research plan. Probably with a sufficient increase in strain, the shear modulus values will begin to stabilize. However, this may result in the opposite trend, i.e., decreasing values, for the damping characteristics. Moreover, the experimental results indicate that by increasing RTW content and increasing the mean effective stress, the G−modulus increases too. This behavior is due to the soft nature of rubber particles relative to hard concrete aggregate. Also, interparticle frictional forces increase with increasing pressure. The effect of rubber on shear modulus gradually decreases with increasing p’.
Author Contributions
All authors have read and agreed to the published version of the manuscript.
Funding
This work is the result of the implementation of research project No. DEC-2020/04/X/ST8/00732 founded by the National Science Centre of Poland.
Institutional Review Board Statement
Not applicable.
Informed Consent Statement
Not applicable.
Data Availability Statement
Data is available on request due to their size properties. The data presented in this study are available on request from the corresponding author.
Acknowledgments
The author would like to thank Emil Soból and Jan Ziółkowski for their help in organizing the materials to make the mixtures. The laboratory assistance provided by Jacek Bąkowski is greatly appreciated. The author would like to thank as well Bruno Camargo for his help in organizing the raw data. The author would like to express her gratitude to the representatives of the tire-shredding company ORZEŁ S.A., who delivered the rubber waste for this study free of charge.
Conflicts of Interest
The authors declare no conflict of interest.
References
- ETRMA. Annual Report 2017; Moving Innovation that Cares; ETRMA: Brussels, Belgium, 2017. [Google Scholar]
- Das, S.; Bhowmik, D. Dynamic Behaviour of Sand−Crumbed Rubber Mixture at Low Strain Level. Geotech. Geol. Eng. 2020, 38, 6611–6622. [Google Scholar] [CrossRef]
- Tasalloti, A.; Chiaro, G.; Murali, A.; Banasiak, L. Physical and Mechanical Properties of Granulated Rubber Mixed with Granular Soils—A Literature Review. Sustainability 2021, 13, 4309. [Google Scholar] [CrossRef]
- USTMA. 2017 U.S. Scrap Tire Management Summary; U.S. Tire Manufacturers Association: Washington, DC, USA, 2018. [Google Scholar]
- Takano, D.; Chevalier, B.; Otani, J. Experimental and numerical simulation of shear behavior on sand and tire chips. In Proceedings of the 14th International Conference of International association for Computer Methods and Recent Advances in Geomechanics, Kyoto, Japan, 22–25 September 2014; pp. 1545–1550. [Google Scholar]
- Mistry, M.K.; Shukla, S.J.; Solanki, C.H. Reuse of waste tyre products as a soil reinforcing material: A critical review. Environ. Sci. Pollut. Res. 2021, 28, 24940–24971. [Google Scholar] [CrossRef] [PubMed]
- Siddique, R. Waste Materials and By-Products in Concrete; Springer Science & Business Media: Berlin, Germany, 2008. [Google Scholar]
- Heitzman, M. Design and Construction of Asphalt Paving Materials with Crumb Rubber; Transportation Research Board: Washington, DC, USA, 1992. [Google Scholar]
- Edil, T.B.; Park, J.K.; Kim, J.Y. Effectiveness of scrap tire chips as supportive drainage material. J. Environ. Eng. 2004, 130, 824–831. [Google Scholar] [CrossRef]
- Aydilek, A.H.; Madden, E.T.; Demirkan, M.M. Field evaluation of a leachate collection system constructed with scrap tires. J. Geotech. Geoenviron. 2006, 132, 990–1000. [Google Scholar] [CrossRef]
- Okur, D.V.; Umu, S.U. Dynamic Properties of Clean Sand Modified with Granulated Rubber. Adv. Civ. Eng. 2018, 2018, 5209494. [Google Scholar] [CrossRef]
- Tsang, H.H. Seismic isolation by rubber–soil mixtures for developing countries. Earthq. Eng. Struct. Dynam 2008, 37, 283–303. [Google Scholar] [CrossRef]
- Li, J.; Cui, J.; Shan, Y.; Li, Y.; Ju, B. Dynamic Shear Modulus and Damping Ratio of Sand–Rubber Mixtures under Large Strain Range. Materials 2020, 13, 4017. [Google Scholar] [CrossRef]
- Kaneko, T.; Orense, R.P.; Hyodo, M.; Yoshimoto, N. Seismic response characteristics of saturated sand deposits mixed with tire chips. J. Geotech. Geoenviron. Eng. 2013, 139, 633–643. [Google Scholar] [CrossRef]
- Il-Sang, A.; Lijuan, C. Tire derived aggregate for retaining wall backfill under earthquake loading. Constr. Build. Mater. 2014, 57, 105–116. [Google Scholar] [CrossRef]
- Daud, N.; Yusoff, Z.; Muhammed, A. Ground Improvement of Problematic Soft Soils Using Shredded Waste Tire. In Proceedings of the 6th Jordanian Int. Civil Engineering Conference (JICEC06), Amman, Jordan, 10–12 March 2015. [Google Scholar]
- Cetin, H.; Fener, M.; Gunaydin, O. Geotechnical Properties of Tire-Cohesive Clayey Soil Mixtures as a Fill Material. Eng. Geol. 2006, 88, 110–120. [Google Scholar] [CrossRef]
- Das, T.; Singh, B. Strength Behaviour of Cohesive Soil-Fly Ash-Waste Tyre Mixtures. In Proceedings of the SAITM Research Symposium on Engineering Advancements, University of Moratuwa, Malabe, Sri Lanka, 27–28 April 2012; pp. 35–38. [Google Scholar]
- Tajdini, M.; Nabizadeh, A.; Taherkhani, H.; Zartaj, H. Effect of Added Waste Rubber on the Properties and Failure Mode of Kaolinite Clay. Int. J. Civ. Eng. 2016, 15, 949–958. [Google Scholar] [CrossRef]
- Gabryś, K.; Zając, K.; Sas, W. Compaction characteristics of waste materials: Recycled concrete aggregate, recycled rubber waste, and recycled concrete aggregate−recycled rubber waste mixtures. In Proceedings of the 17th Danube European Conference on Geotechnical Engineering (17DECGE), Bucharest, Romania, 7–9 June 2023. [Google Scholar]
- Gabryś, K. Experimental research on compressibility characteristics of recycled concrete aggregate—Recycled tire waste mixtures. J. Mater. Cycles Waste Manag. 2023, 25, 1966–1977. [Google Scholar] [CrossRef]
- Gabryś, K.; Radzevičius, A.; Szymański, A.; Šadzevičius, R. Shear Strength Characteristics of Recycled Concrete Aggregate and Recycled Tire Waste Mixtures from Monotonic Triaxial Tests. Materials 2021, 14, 7400. [Google Scholar] [CrossRef]
- Lipski, Z.; Wawrzynek, A. Numerical effort analysis of buildings with paraseismic loading, supported with measurements. In 1st International Scientific Seminar ‘New Trends in Statics and Dynamics of Buildings’ Seminar proceedings; Slovak University of Technology: Bratislava, Slovakia, 7 December 2001; pp. 155–160. [Google Scholar]
- Quadrini, F.; Bellisario, D.; Santo, L.; Hren, I. Direct Moulding of Rubber Granules and Powders from Tyre Recycling. Appl. Mech. Mater. 2013, 371, 315–319. [Google Scholar]
- Amiri, M.; Hatami, F.; Golafshani, E.M. Evaluating the synergic effect of waste rubber powder and recycled concrete aggregate on mechanical properties and durability of concrete. Case Stud. Constr. Mater. 2021, 15, e00639. [Google Scholar] [CrossRef]
- Duda, A.; Sobala, D.; Siwowski, T.; Kaleta, D. Wykorzystanie materiałów z recyklingu opon samochodowych w budownictwie komunikacyjnym (In Polish) (Utilization of recycled materials from automobile tires in traffic construction). Arch. Inst. Inżynierii Lądowej 2016, 21, 97–111. [Google Scholar]
- Mehta, P.K.; Monteiro, J.M. Concrete: Structure, Properties, and Materials; Prentice Hall: Englewood Cliffs, NJ, USA, 1993. [Google Scholar]
- Mróz, R. Problem(atyka) gruzu betonowego (In Polish) (Problem(s) of concrete aggregate). Bud. Technol. Archit. 2014, 4, 64–68. [Google Scholar]
- Pepe, M.; Toledo Filho, R.D.; Koenders, E.A.; Martinelli, E. Alternative processing procedures for recycled aggregates in structural concrete. Constr. Build. Mater. 2014, 69, 124–132. [Google Scholar] [CrossRef]
- Tam, V.W.Y.; Tam, C.M. Crushed aggregate production from centralized combined and individual waste sources in Hong Kong. Constr. Build. Mater. 2007, 21, 879–886. [Google Scholar] [CrossRef]
- Wang, J.; Fang, Z.; Cai, Y.; Chai, J.; Wang, P.; Geng, X. Preloading using fill surcharge and prefabricated vertical drains for an airport. Geotext. Geomembr. 2018, 46, 575–585. [Google Scholar] [CrossRef]
- Li, B.; Wang, Y.; Jin, Q.; Chen, H. Liquefaction characteristics of recycled concrete aggregates. Soil. Dyn. Earthq. Eng. 2019, 120, 85–96. [Google Scholar] [CrossRef]
- ISO 17892-4:2016 Geotechnical Investigation and Testing—Laboratory Testing of Soil—Part 4: Determination of Particle Size Distribution. Available online: http://sklep.pkn.pl/pn-en-iso-17892-4-2017-01e.html (accessed on 18 January 2017).
- ASTM D854-02; Standard Test Methods for Specific Gravity of Soil Solids by Water Pycnometer. ASTM International: West Conshohocken, PA, USA, 2002.
- Kim, H.-K.; Santamarina, J.C. Sand–rubber mixtures (large rubber chips). Can. Geotech. J. 2008, 45, 1457–1466. [Google Scholar] [CrossRef]
- Kodicherla, S.P.K.; Gong, G.; Fan, L.; Moy, C.K.S.; He, J. Effects of preparation methods on inherent fabric anisotropy and packing density of reconstituted sand. Cogent Eng. 2018, 5, 1533363. [Google Scholar] [CrossRef]
- Bai, L. Preloading Effects on Dynamic Sand Behavior by Resonant Column Tests. Ph.D. Thesis, Technische Universitaet Berlin, Berlin, Germany, 2011. [Google Scholar]
- Skempton, A.W. The pore-pressure coefficients A and B. Géotechnique 1954, 4, 143–147. [Google Scholar] [CrossRef]
- Tasalloti, A.; Chiaro, G.; Banasiak, L.; Palermo, A. Experimental investigation of the mechanical behaviour of gravel granulated tyre rubber mixtures. Constr. Build. Mater. 2020, 273, 121749. [Google Scholar] [CrossRef]
- Drnevich, V.P. Recent Developments in Resonant Column Testing; Soil Mechanics Series, No. 33; Dept. of Civil Engineering, University of Kentucky: Lexington, KY, USA, 1985. [Google Scholar]
- ASTM D4015-15; Standard Test Methods for Modulus and Damping of Soils by Fixed-Base Resonant Column Devices. ASTM International: West Conshohocken, PA, USA, 2015.
- Gu, X.; Yang, J.; Huang, M.; Gao, G. Bender element tests in dry and saturated sand: Signal interpretation and result comparison. Soils Found. 2015, 55, 951–962. [Google Scholar] [CrossRef]
- Sas, W.; Soból, E.; Gabryś, K.; Markowska-Lech, K. Study of the cohesive soil stiffness in a modified resonant column. Zesz. Nauk. Inst. Gospod. Surowcami Miner. I Energią Pol. Akad. Nauk. 2016, 93, 21–34. [Google Scholar]
- Sas, W.; Gabryś, K.; Szymański, A. Experimental studies of dynamic properties of Quaternary clayey soils. J. Soil Dyn. 2017, 95, 29–39. [Google Scholar] [CrossRef]
- GDS Resonant Column 2010. The GDS Resonant Column System Handbook (Version 2.2.2010). Available online: www.gdsinstruments.com (accessed on 11 March 2010).
- Gabryś, K.; Sas, W.; Markowska-Lech, K.; Soból, E.; Głuchowski, A.; Bieniawski, J. Laboratoryjne metody wyznaczania współczynnika tłumienia drgań na przykładzie gruntu spoistego (In Polish) (Laboratory methods for determination of damping ratio on the example of cohesive soil). Acta Sci. Pol. Archit. 2017, 16, 13–24. [Google Scholar] [CrossRef]
- Lai, C.G.; Pallara, O.; Lo Presti, D.C.F.; Turco, E. Low-Strain Stiffness and Material Damping Ratio Coupling in Soils. In Advanced Laboratory Stress-Strain Testing of Geomaterials; Tatsuoka, F., Shibuya, S., Kuwano, R., Eds.; Routledge: Oxfordshire, UK, 2001; pp. 265–274. [Google Scholar]
- Sabogal, K.G.; Getchell, A.; Santagata, M.; Drnevich, V.P. Resonant Column Calibration and Dynamic Torsional Shear Testing Using Stepped Frequency Sweeps. Geotech. Test. J. 2023, 46, 379–402. [Google Scholar] [CrossRef]
- Gabryś, K. Charakterystyki Odkształceniowe Wybranych Gruntów Spoistych (In Polish) (Deformation Characteristics of Selected Cohesive Soils). Ph.D. Thesis, Warsaw University of Life Sciences, Warsaw, Poland, 2014. [Google Scholar]
- Murono, Y.; Nogami, Y. Shear Stress-Shear Strain Relationship Taking into Account S-Shape Hysteresis Loop. In Proceedings of the Symposium of 12th Japan Earthqake Engineering, Hayama, Japan, 24–29 September 2006; Volume 12, pp. 494–497. [Google Scholar]
- Madhusudhan, B.R.; Boominathan, A.; Banerjee, S. Static and Large-Strain Dynamic Properties of Sand–Rubber Tire Shred Mixtures. J. Mater. Civ. Eng. 2017, 29, 04017165. [Google Scholar] [CrossRef]
- Feng, Z.Y.; Sutter, K.G. Dynamic properties of granulated rubber/sand mixtures. Geotech. Test. J. 2000, 23, 338–344. [Google Scholar] [CrossRef]
- Sarajpoor, S.; Kavand, A.; Zogh, P.; Ghalandarzadeh, A. Dynamic behavior of sand-rubber mixtures based on hollow cylinder tests. Constr. Build. Mater. 2020, 251, 118948. [Google Scholar] [CrossRef]
- Gabryś, K.; Sas, W. Dynamic shear modulus and damping ratio of recycled concrete aggregate−recycled tire waste mixture using resonant column apparatus. In Proceedings of the 8th International Symposium on Deformation Characteristics of Geomaterials, Porto, Portugal, 3−6 September 2023; ISSMGE: Porto, Portugal, 2023; pp. 1–8. [Google Scholar]
- Mog, K.; Anbazhagan, P. Evaluation of the damping ratio of soils in a resonant column using different methods. Soils Found. 2022, 62, 101091. [Google Scholar] [CrossRef]
- Ahmad, M.; Ray, R. The Dynamic Properties of Sand under Torsion: A Literature Review. Geotechnics 2023, 3, 480–514. [Google Scholar] [CrossRef]
- Jastrzębska, M.; Tokarz, K. Strength Characteristics of Clay–Rubber Waste Mixtures in Low-Frequency Cyclic Triaxial Tests. Minerals 2021, 11, 315. [Google Scholar] [CrossRef]
- Liu, F.C.; Wu, M.T.; Yang, J. Experimental Study on Normalized Stress-Strain Behavior of Geogrid Reinforced Rubber Sand Mixtures. In Proceedings of the GeoShanghai International Conference, Shanghai, China, 27–30 May 2018; Springer: Berlin, Germany, 2018; pp. 307–317. [Google Scholar]
- Darendeli, B. Development of a New Family of Normalized Modulus Reduction and Material Damping Curves. Ph.D. Dissertation, University of Texas, Austin, TX, USA, 2001; pp. 1–362. [Google Scholar]
- Hardin, B. The Nature of Damping in Sands. J. Soil Mech. Found. Div. 1965, 91, 63–98. [Google Scholar] [CrossRef]
- Afifi, S.S.; Woods, R.D. Long -Term Pressure Effects on Shear Modulus of Soils. J. Soil Mech. Found. Div. ASCE 1971, 97, 1445–1460. [Google Scholar] [CrossRef]
- Anderson, D.G.; Richart, F.E.J. Effects of straining on shear modulus of clays. J. Geotech. Eng. Div. 1976, 102, 975–987. [Google Scholar] [CrossRef]
- Alarcon-Guzman, A.; Chameau, J.; Leonards, G.A.; Frost, J.D. Shear Modulus and Cyclic Undrained Behavior of Sands. Soils Found. 1989, 29, 105–119. [Google Scholar] [CrossRef] [PubMed]
Figure 1.
Testing materials: (a) RTWP—recycled tire waste powder 0.5–1.0 mm; (b) RTWG—recycled tire waste granulate 1.0–2.0 mm; (c) RCA—recycled concrete aggregate.
Figure 1.
Testing materials: (a) RTWP—recycled tire waste powder 0.5–1.0 mm; (b) RTWG—recycled tire waste granulate 1.0–2.0 mm; (c) RCA—recycled concrete aggregate.

Figure 2.
Particle size distributions and photos of tested materials.
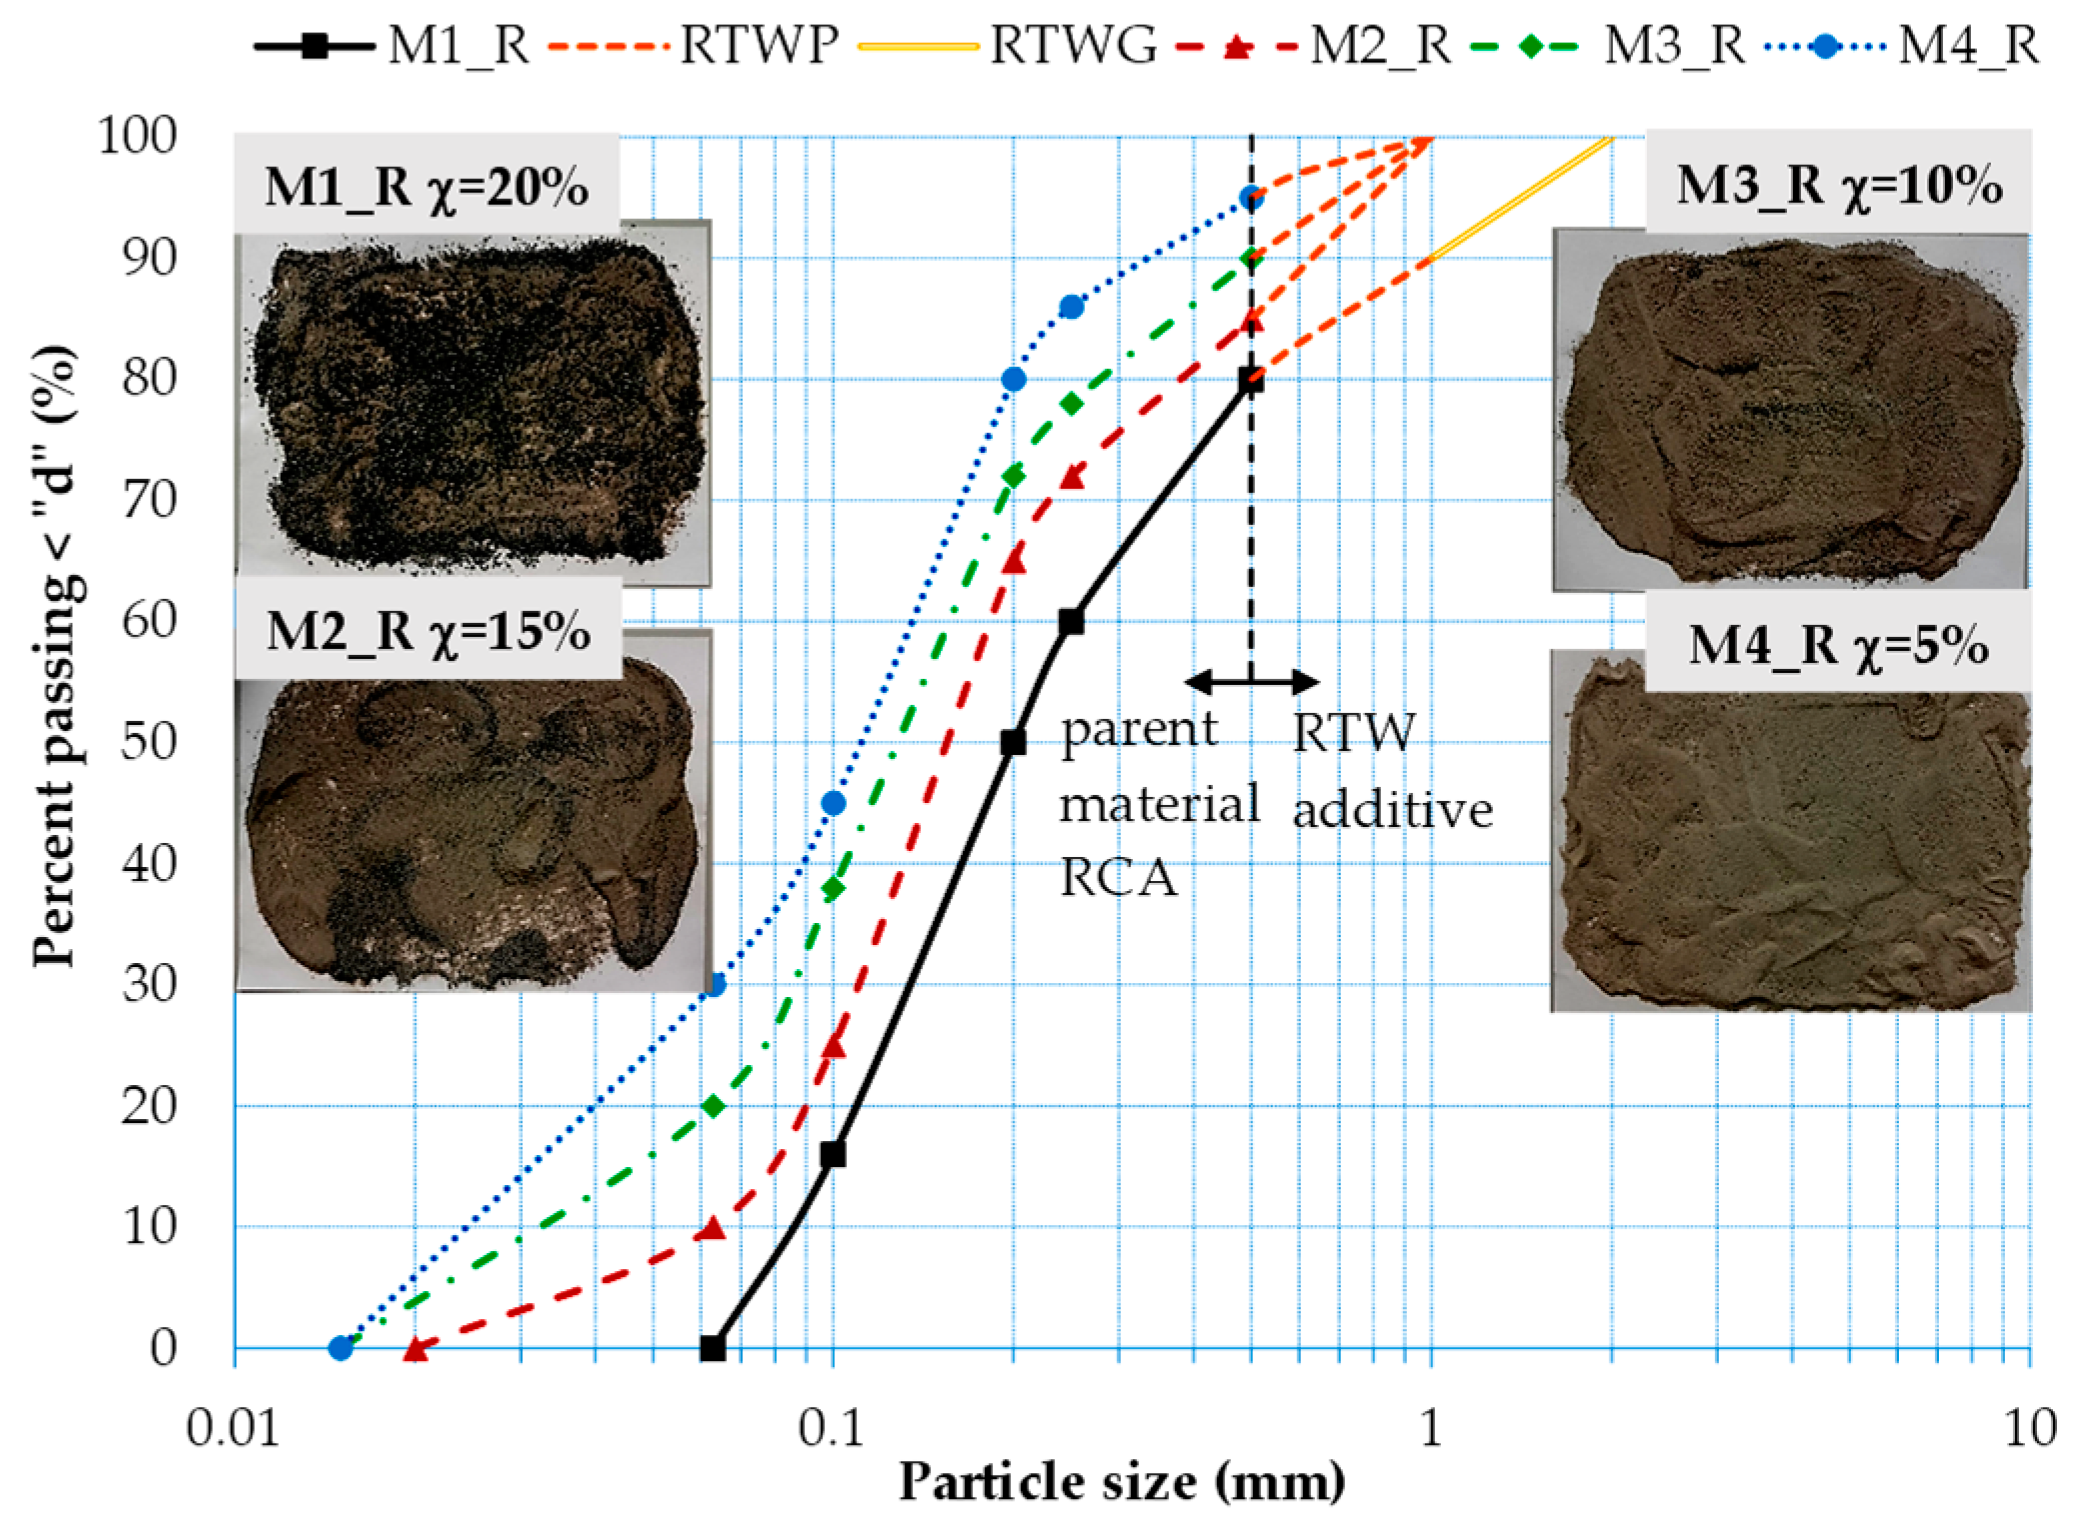
Figure 3.
Resonant column/torsional shear apparatus (a) view of the laboratory stand; (b) high precision MicroEpsilon proximitor for torsional shear testing: proximitor targets—A, proximitor sensor—B, proximitor lead—C.
Figure 3.
Resonant column/torsional shear apparatus (a) view of the laboratory stand; (b) high precision MicroEpsilon proximitor for torsional shear testing: proximitor targets—A, proximitor sensor—B, proximitor lead—C.
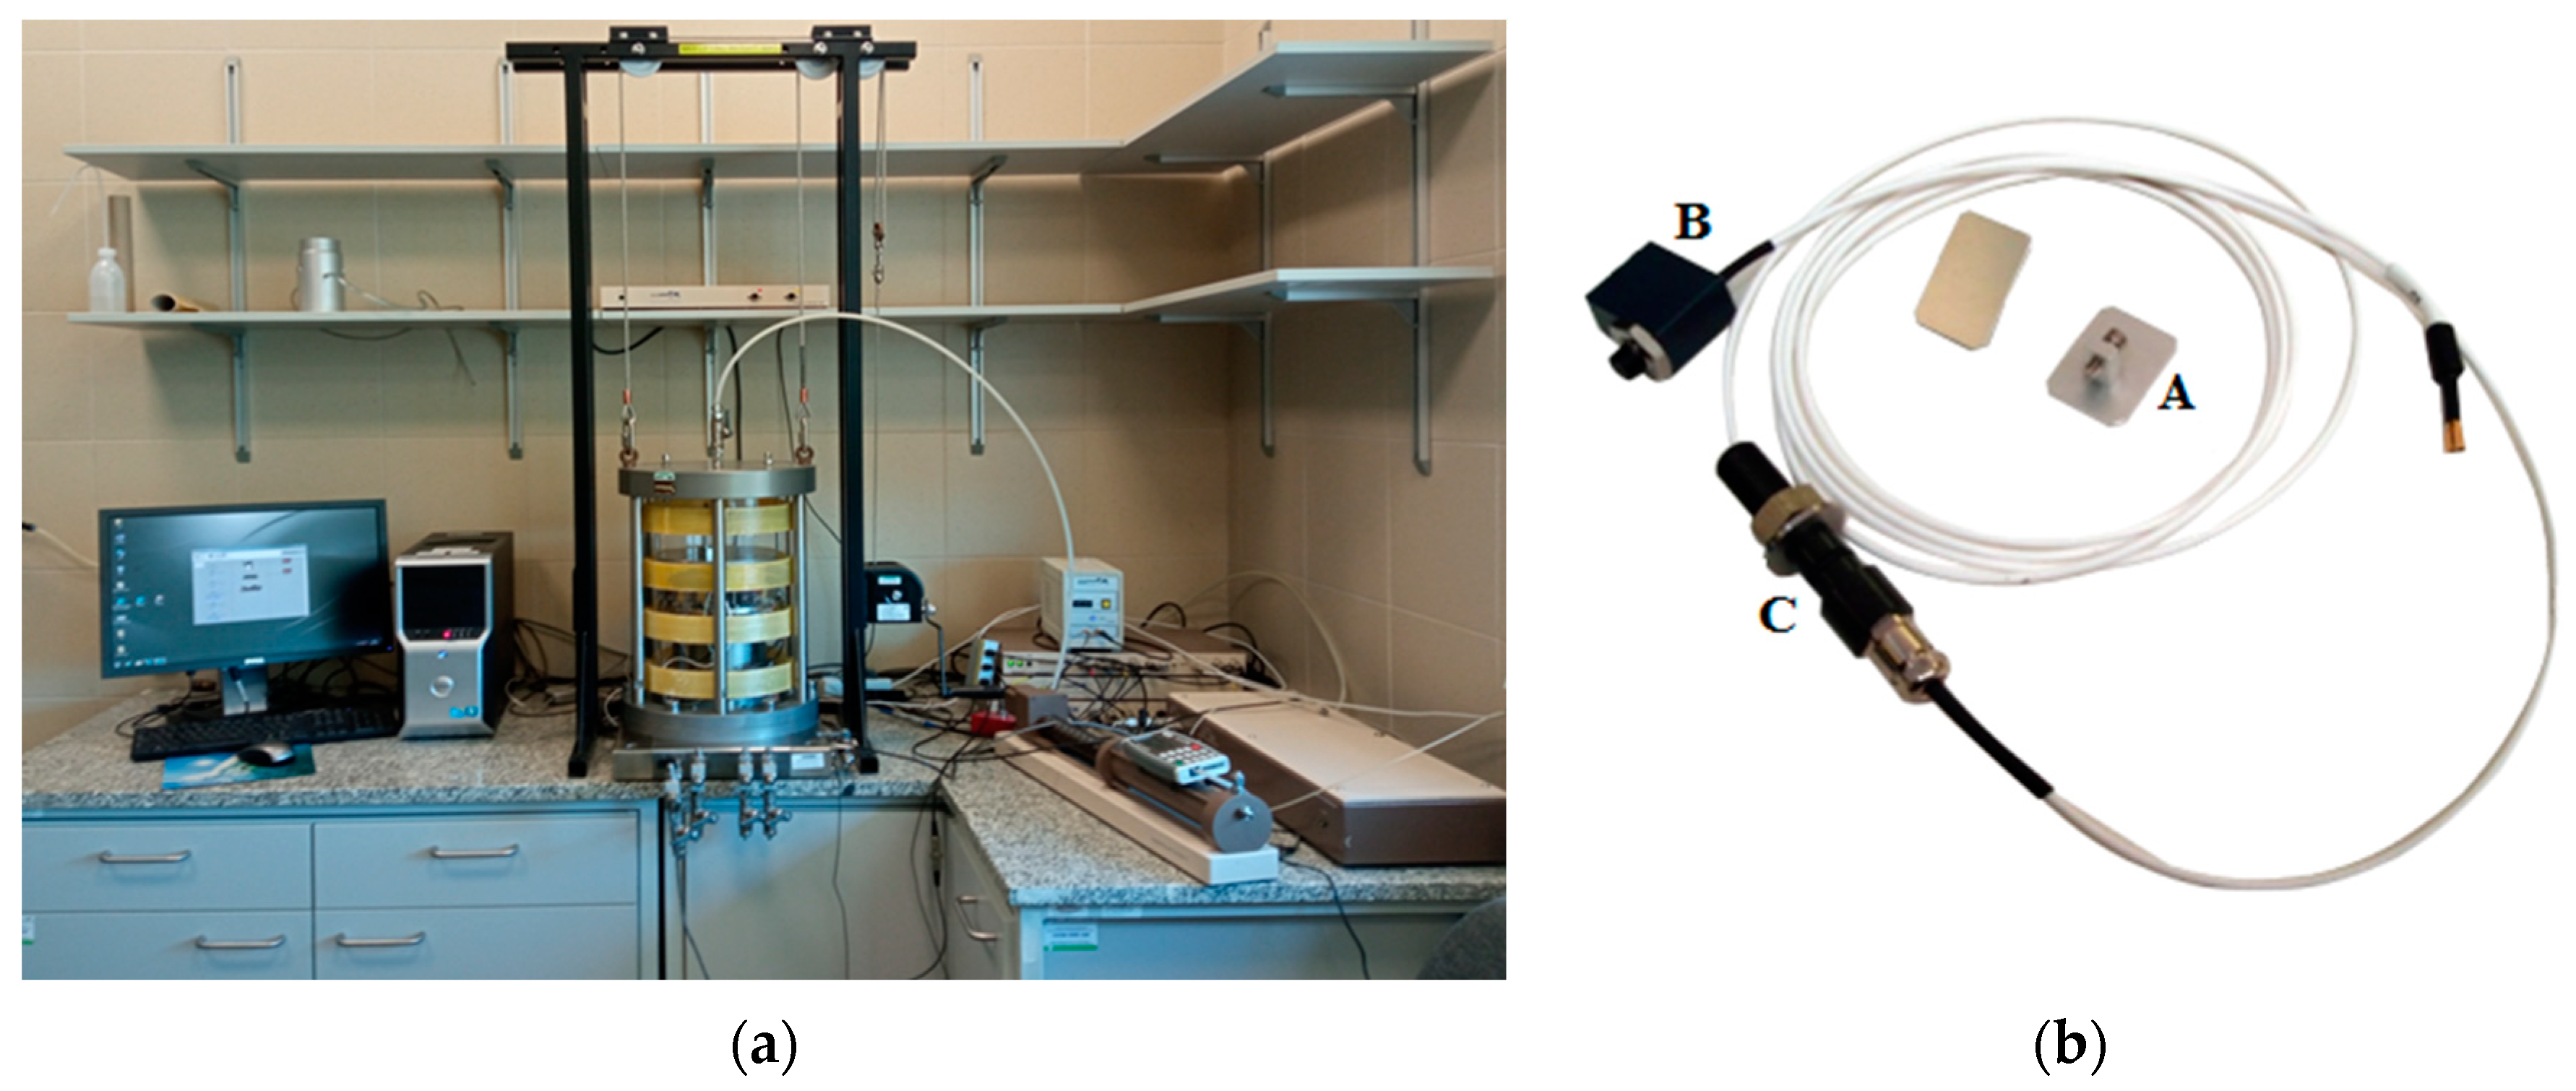
Figure 4.
Typical curves from RC test: (a) amplitude versus frequency; (b) free vibration decay.
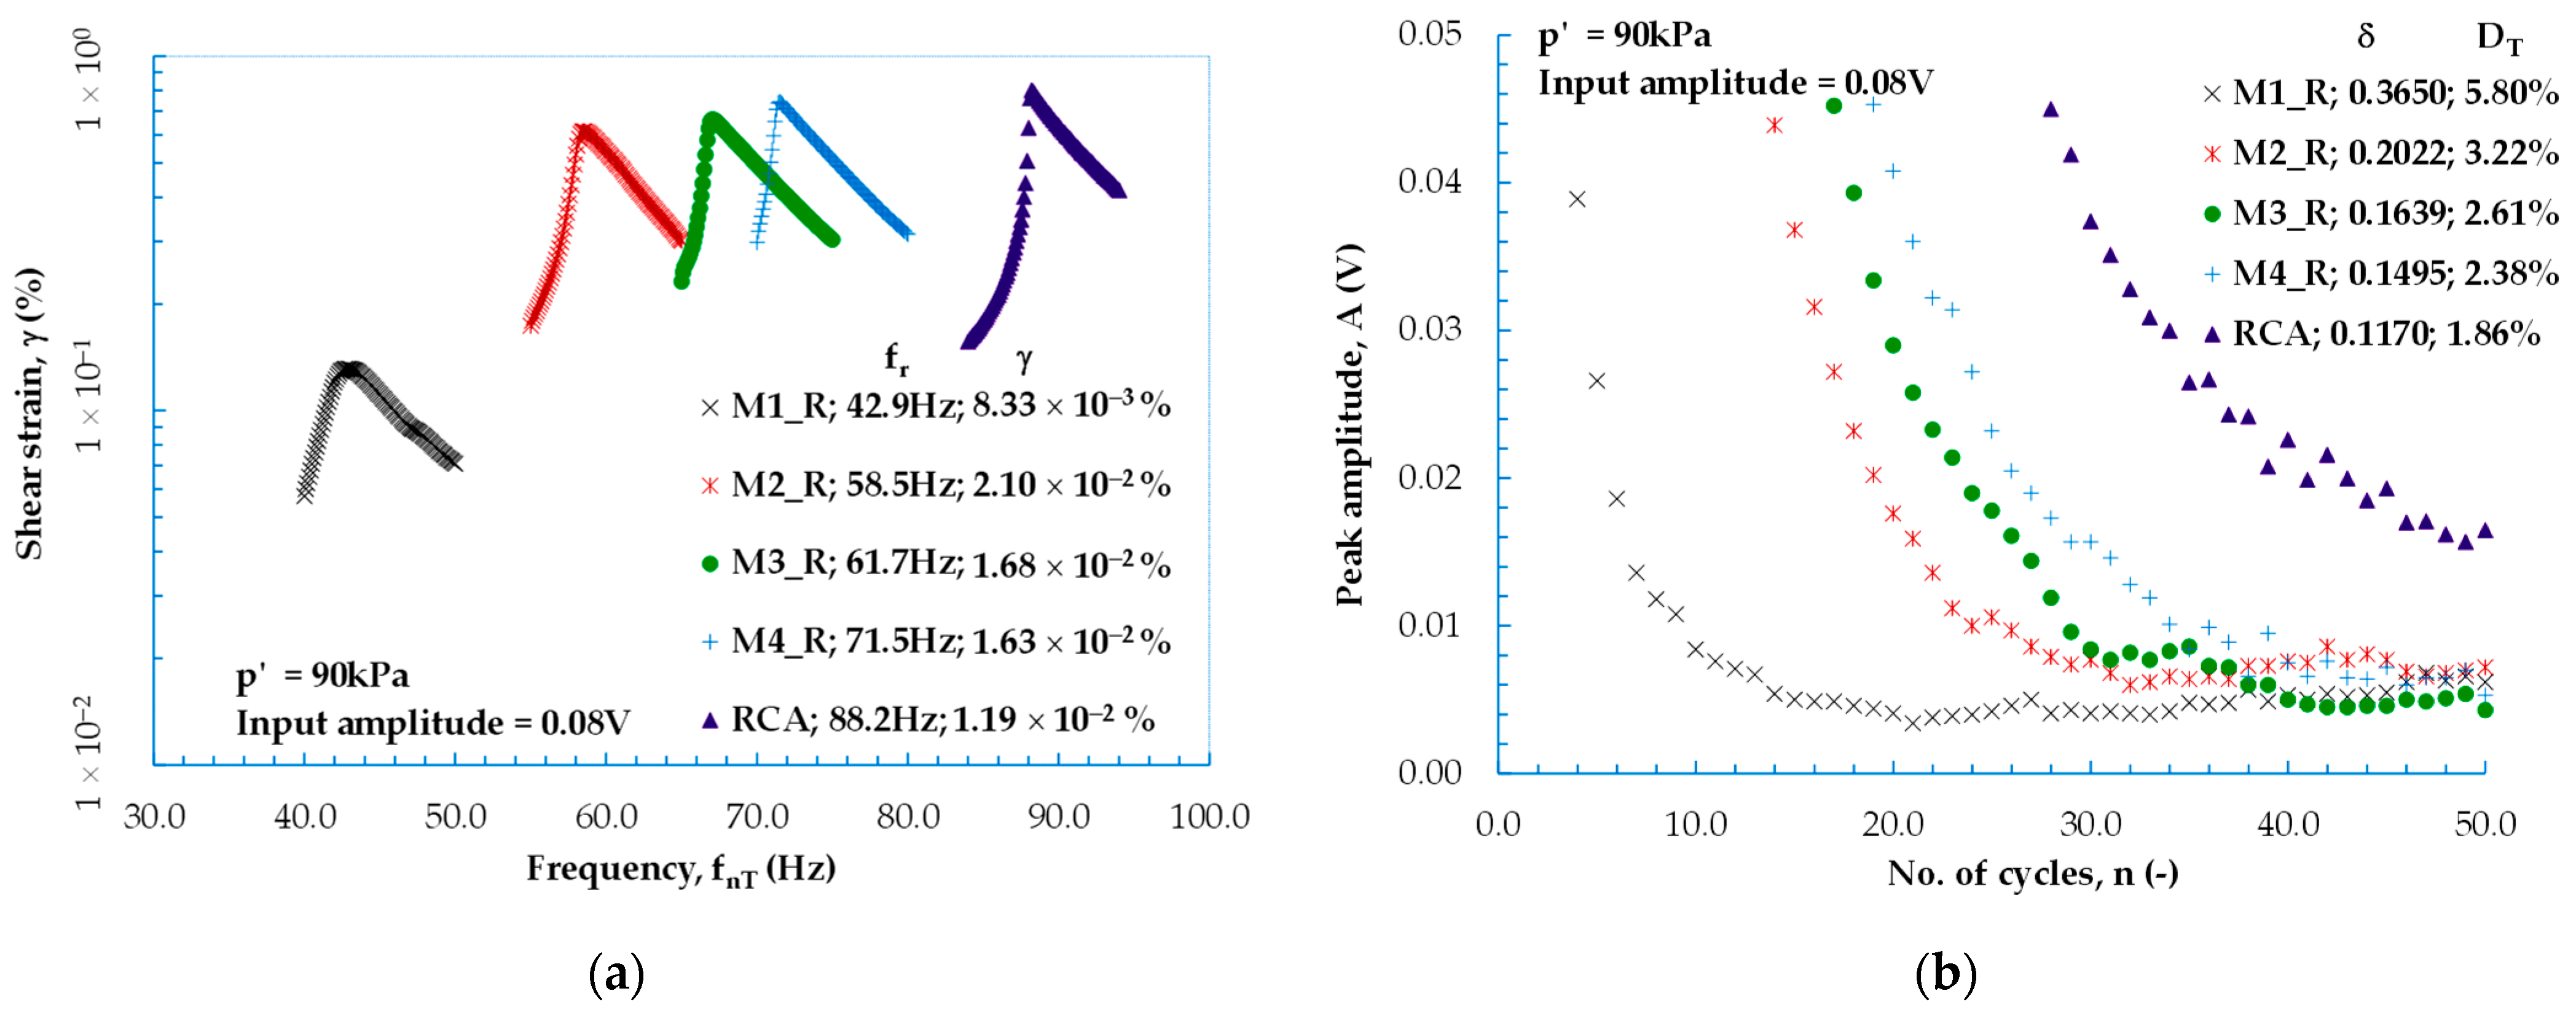
Figure 5.
Definition of G, AL, and AT based on hysteresis loop for M1_R.

Figure 6.
Exemplary hysteresis loops obtained for amplitude value A = 1 V, frequency values f = 1 Hz (solid line) and 10 Hz (dashed line), and mean effective stress values: (a) p’ = 90 kPa; (b) p’ = 180 kPa.
Figure 6.
Exemplary hysteresis loops obtained for amplitude value A = 1 V, frequency values f = 1 Hz (solid line) and 10 Hz (dashed line), and mean effective stress values: (a) p’ = 90 kPa; (b) p’ = 180 kPa.
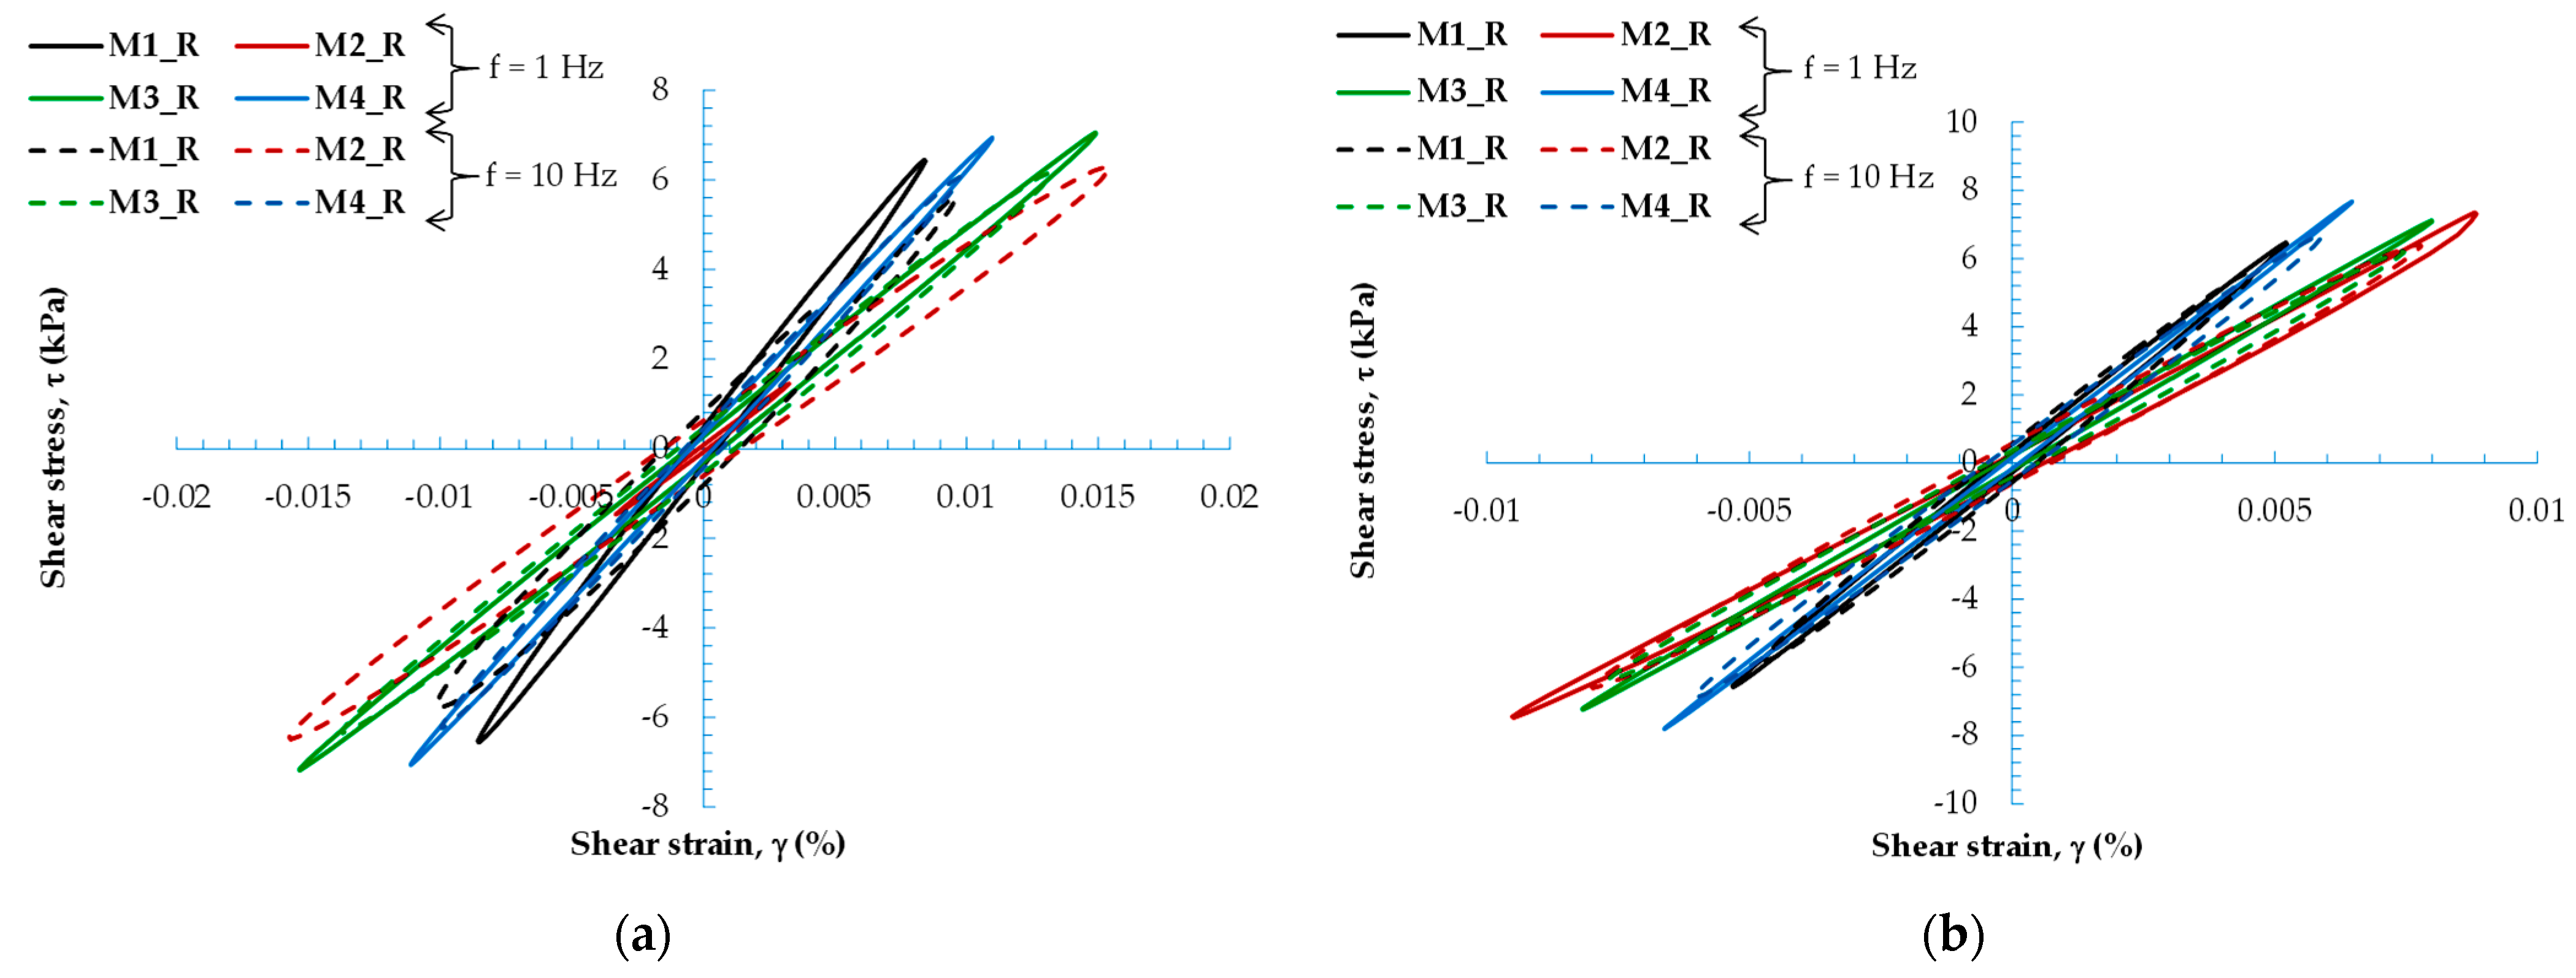
Figure 7.
Effect of rubber content on stress–strain relation of the RCA–RTW mixtures at p’ = 90 kPa, an example.
Figure 7.
Effect of rubber content on stress–strain relation of the RCA–RTW mixtures at p’ = 90 kPa, an example.
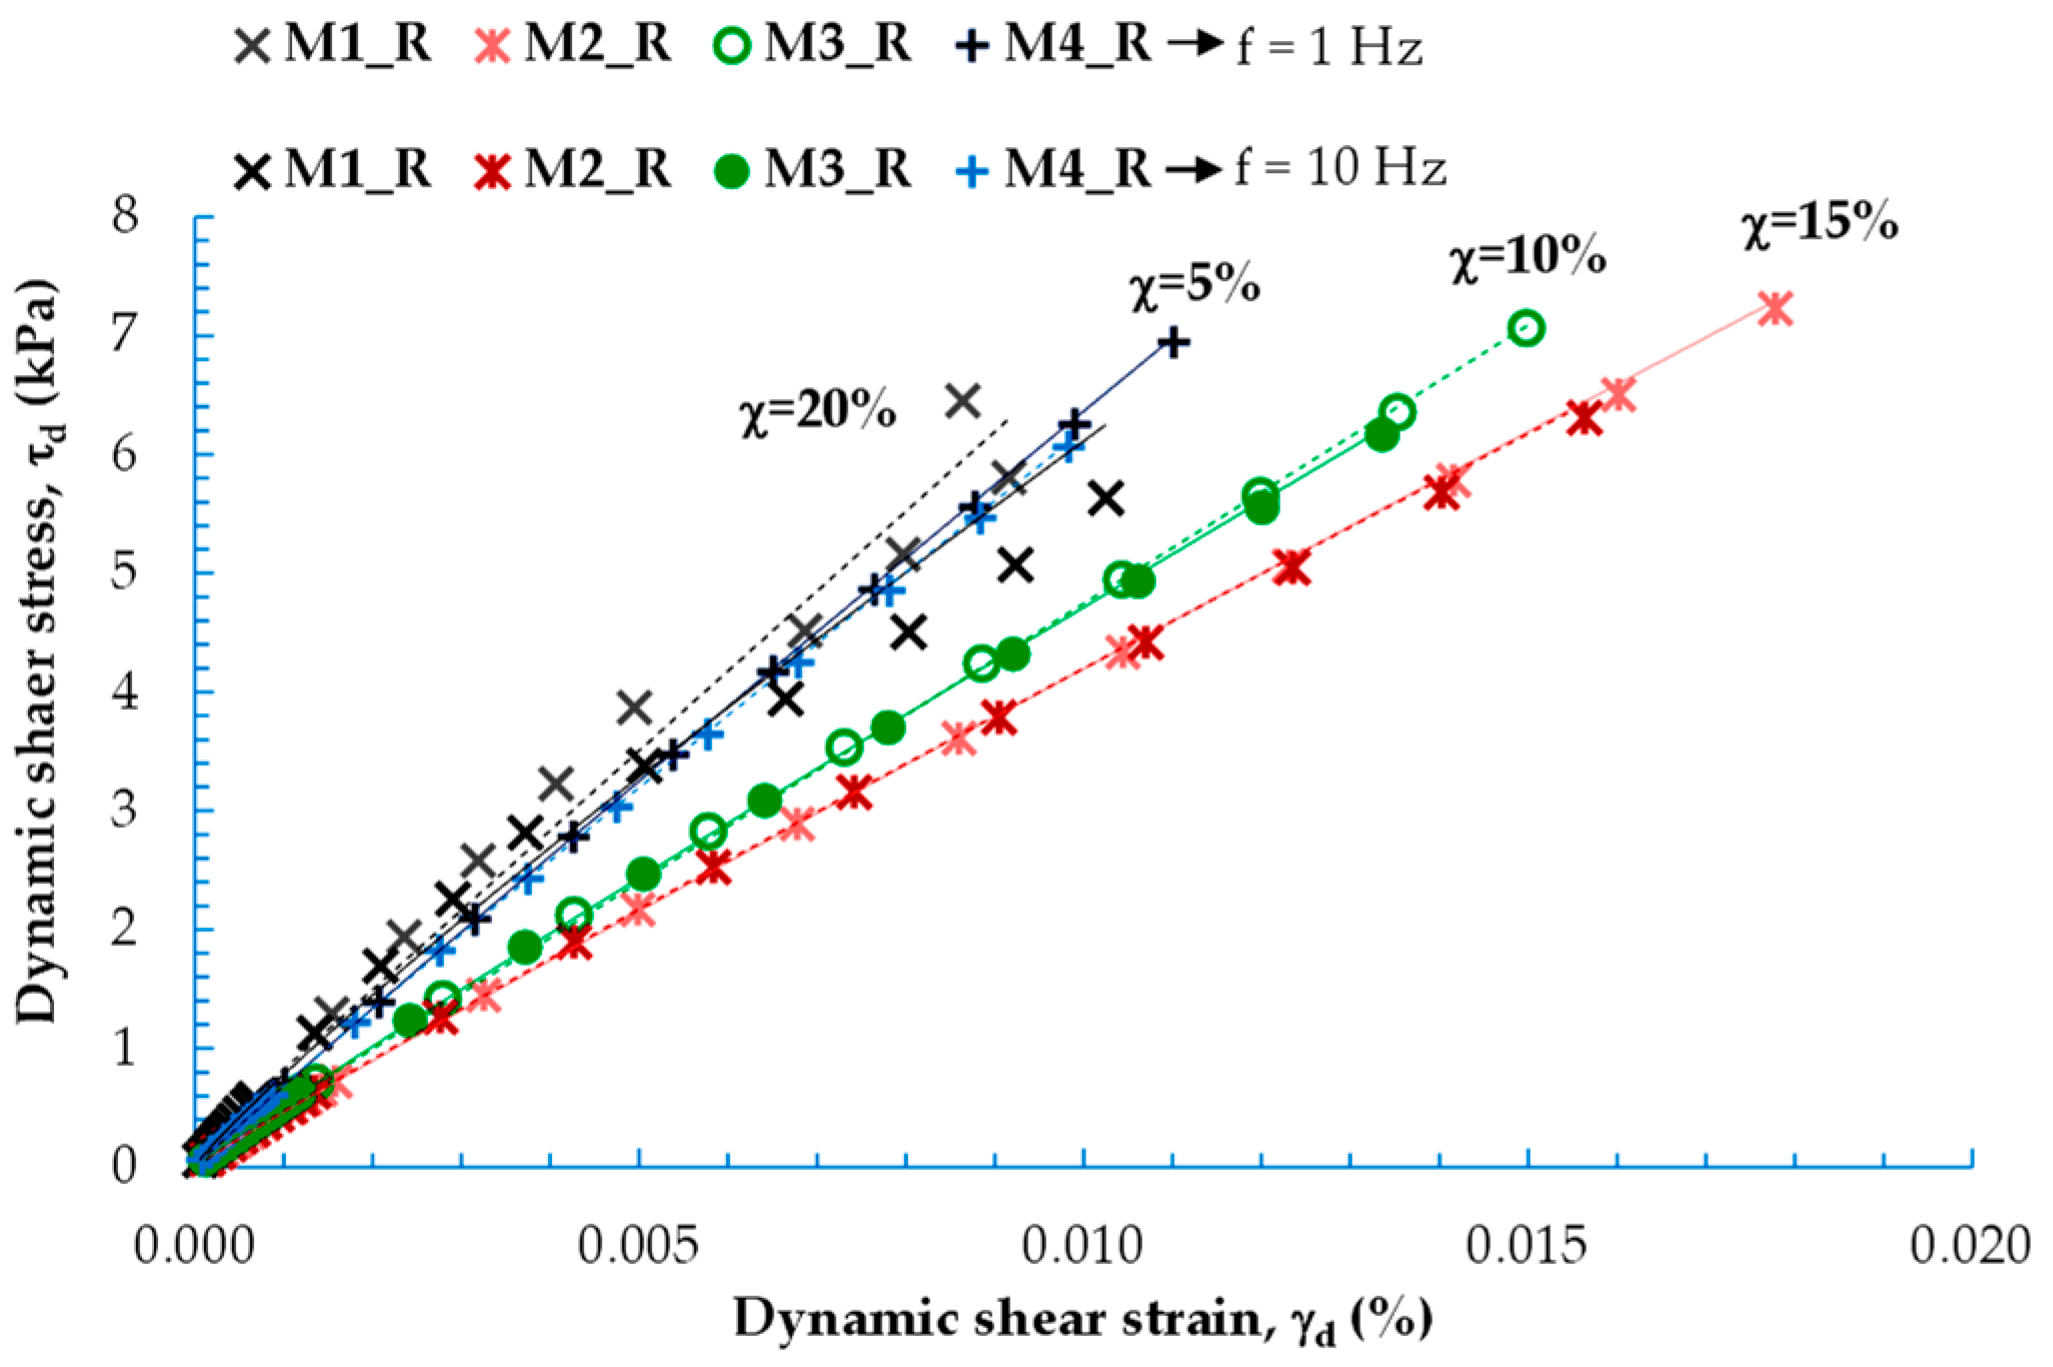
Figure 8.
Effect of mean effective stress on stress–strain relation of the M1_R mixture with χ = 20%.
Figure 8.
Effect of mean effective stress on stress–strain relation of the M1_R mixture with χ = 20%.
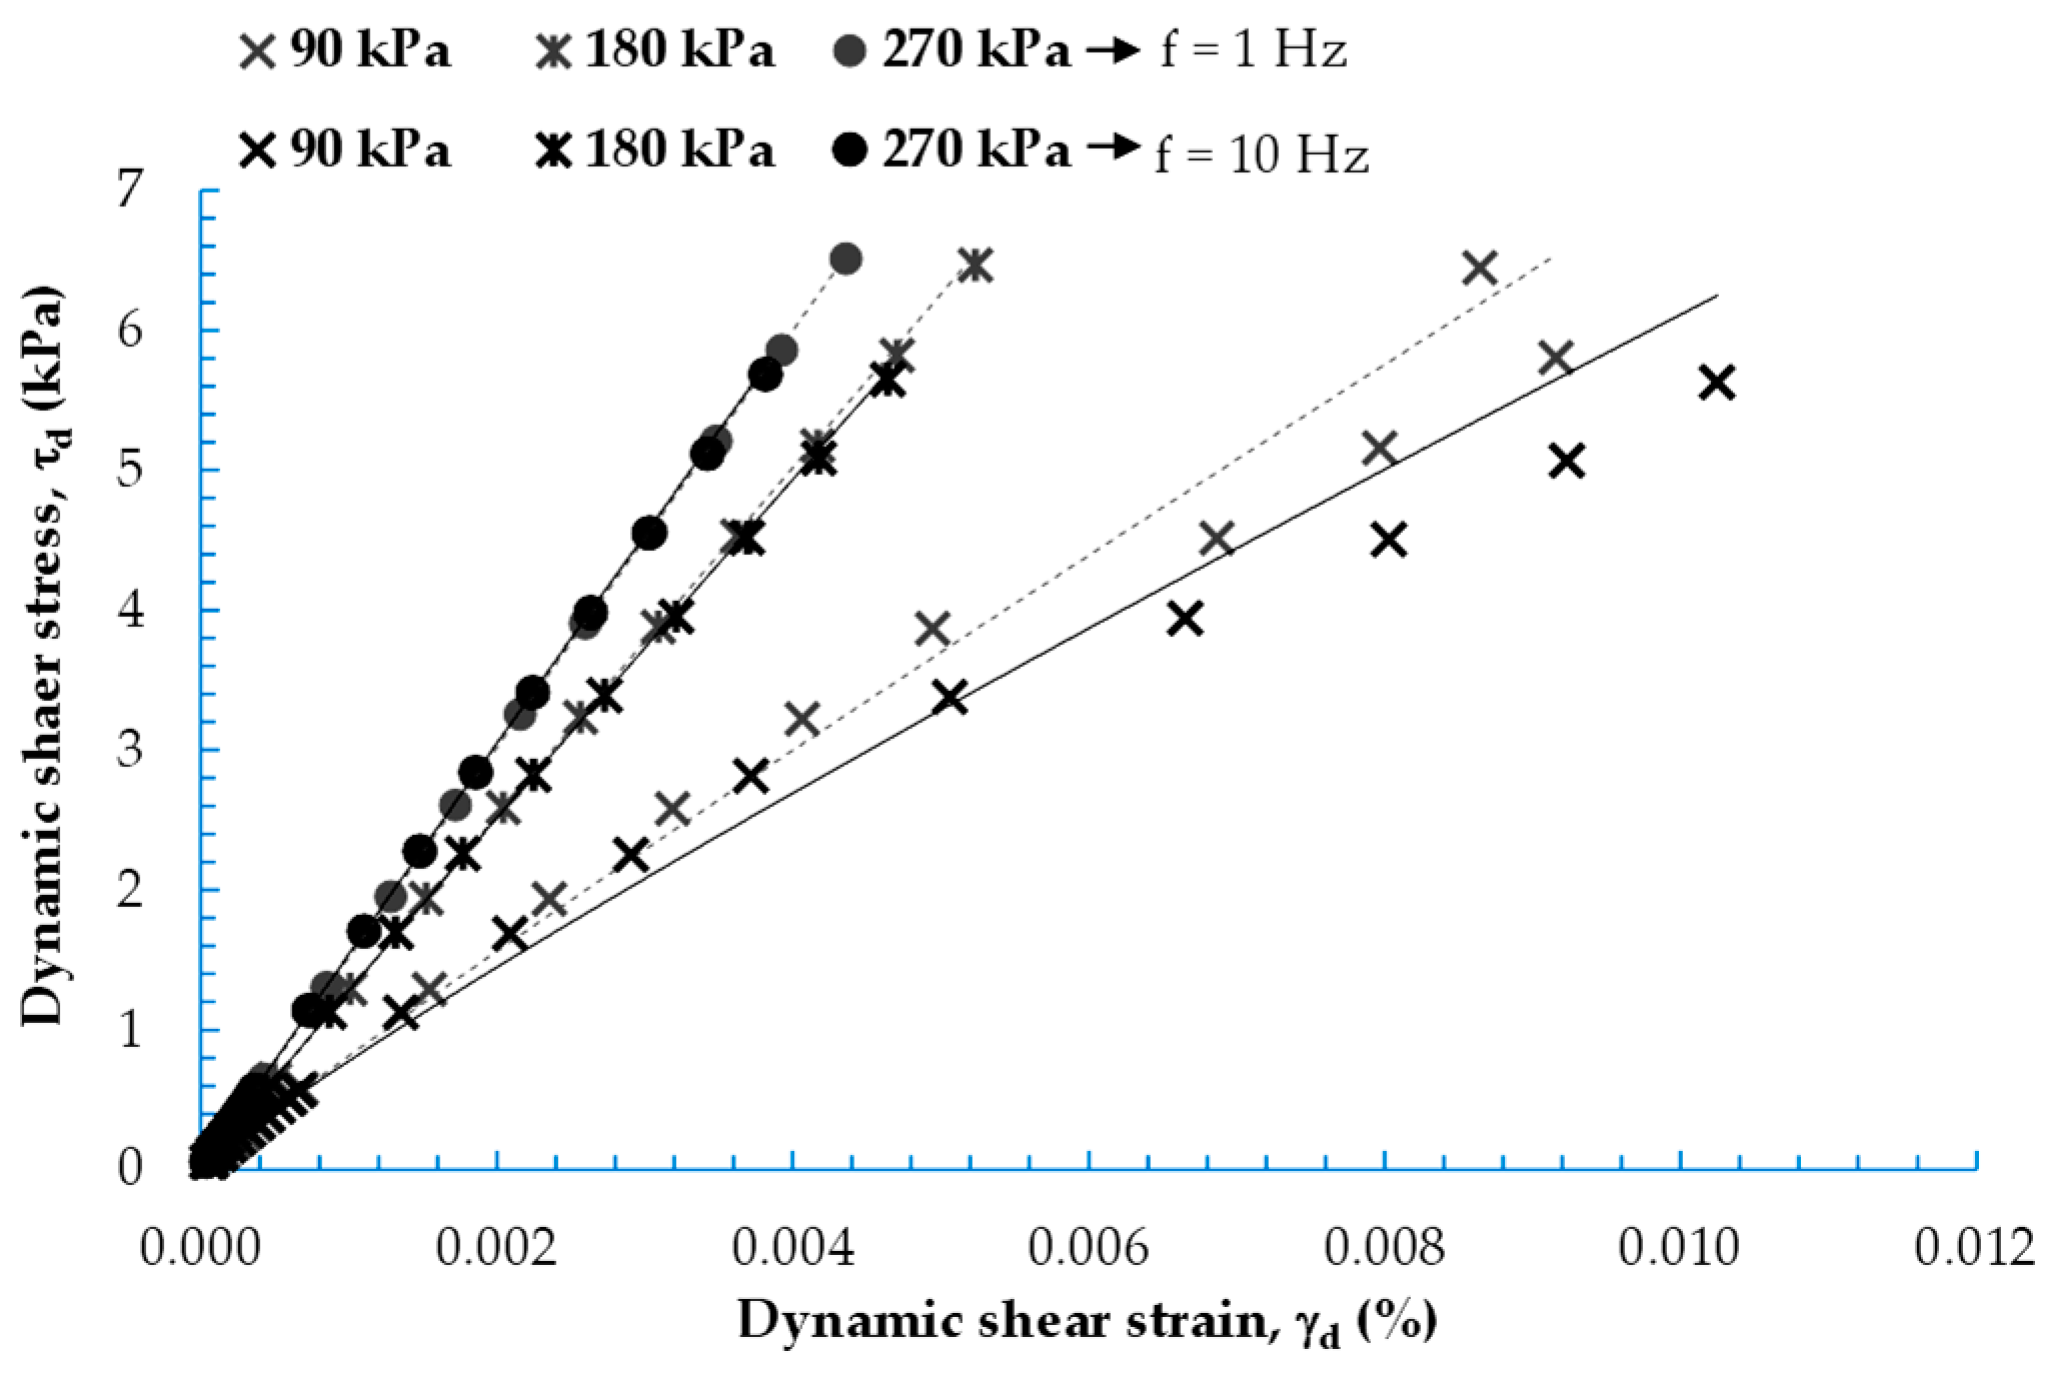
Figure 9.
Normalized dynamic shear modulus and torsion damping ratio versus shear strain from RC tests: (a) p’ = 90 kPa; (b) p’ = 180 kPa; (c) p’ = 270 kPa.
Figure 9.
Normalized dynamic shear modulus and torsion damping ratio versus shear strain from RC tests: (a) p’ = 90 kPa; (b) p’ = 180 kPa; (c) p’ = 270 kPa.

Figure 10.
Normalized cyclic shear modulus and hysteresis damping ratio versus shear strain from CTS tests: (a) p’ = 90 kPa; (b) p’ = 180 kPa; (c) p’ = 270 kPa.
Figure 10.
Normalized cyclic shear modulus and hysteresis damping ratio versus shear strain from CTS tests: (a) p’ = 90 kPa; (b) p’ = 180 kPa; (c) p’ = 270 kPa.

Figure 11.
(a) Maximum shear modulus (small-strain shear modulus) and (b) minimum damping ratio (small-strain damping ratio) versus mean effective stress for a different proportion of RTW from RC tests.
Figure 11.
(a) Maximum shear modulus (small-strain shear modulus) and (b) minimum damping ratio (small-strain damping ratio) versus mean effective stress for a different proportion of RTW from RC tests.
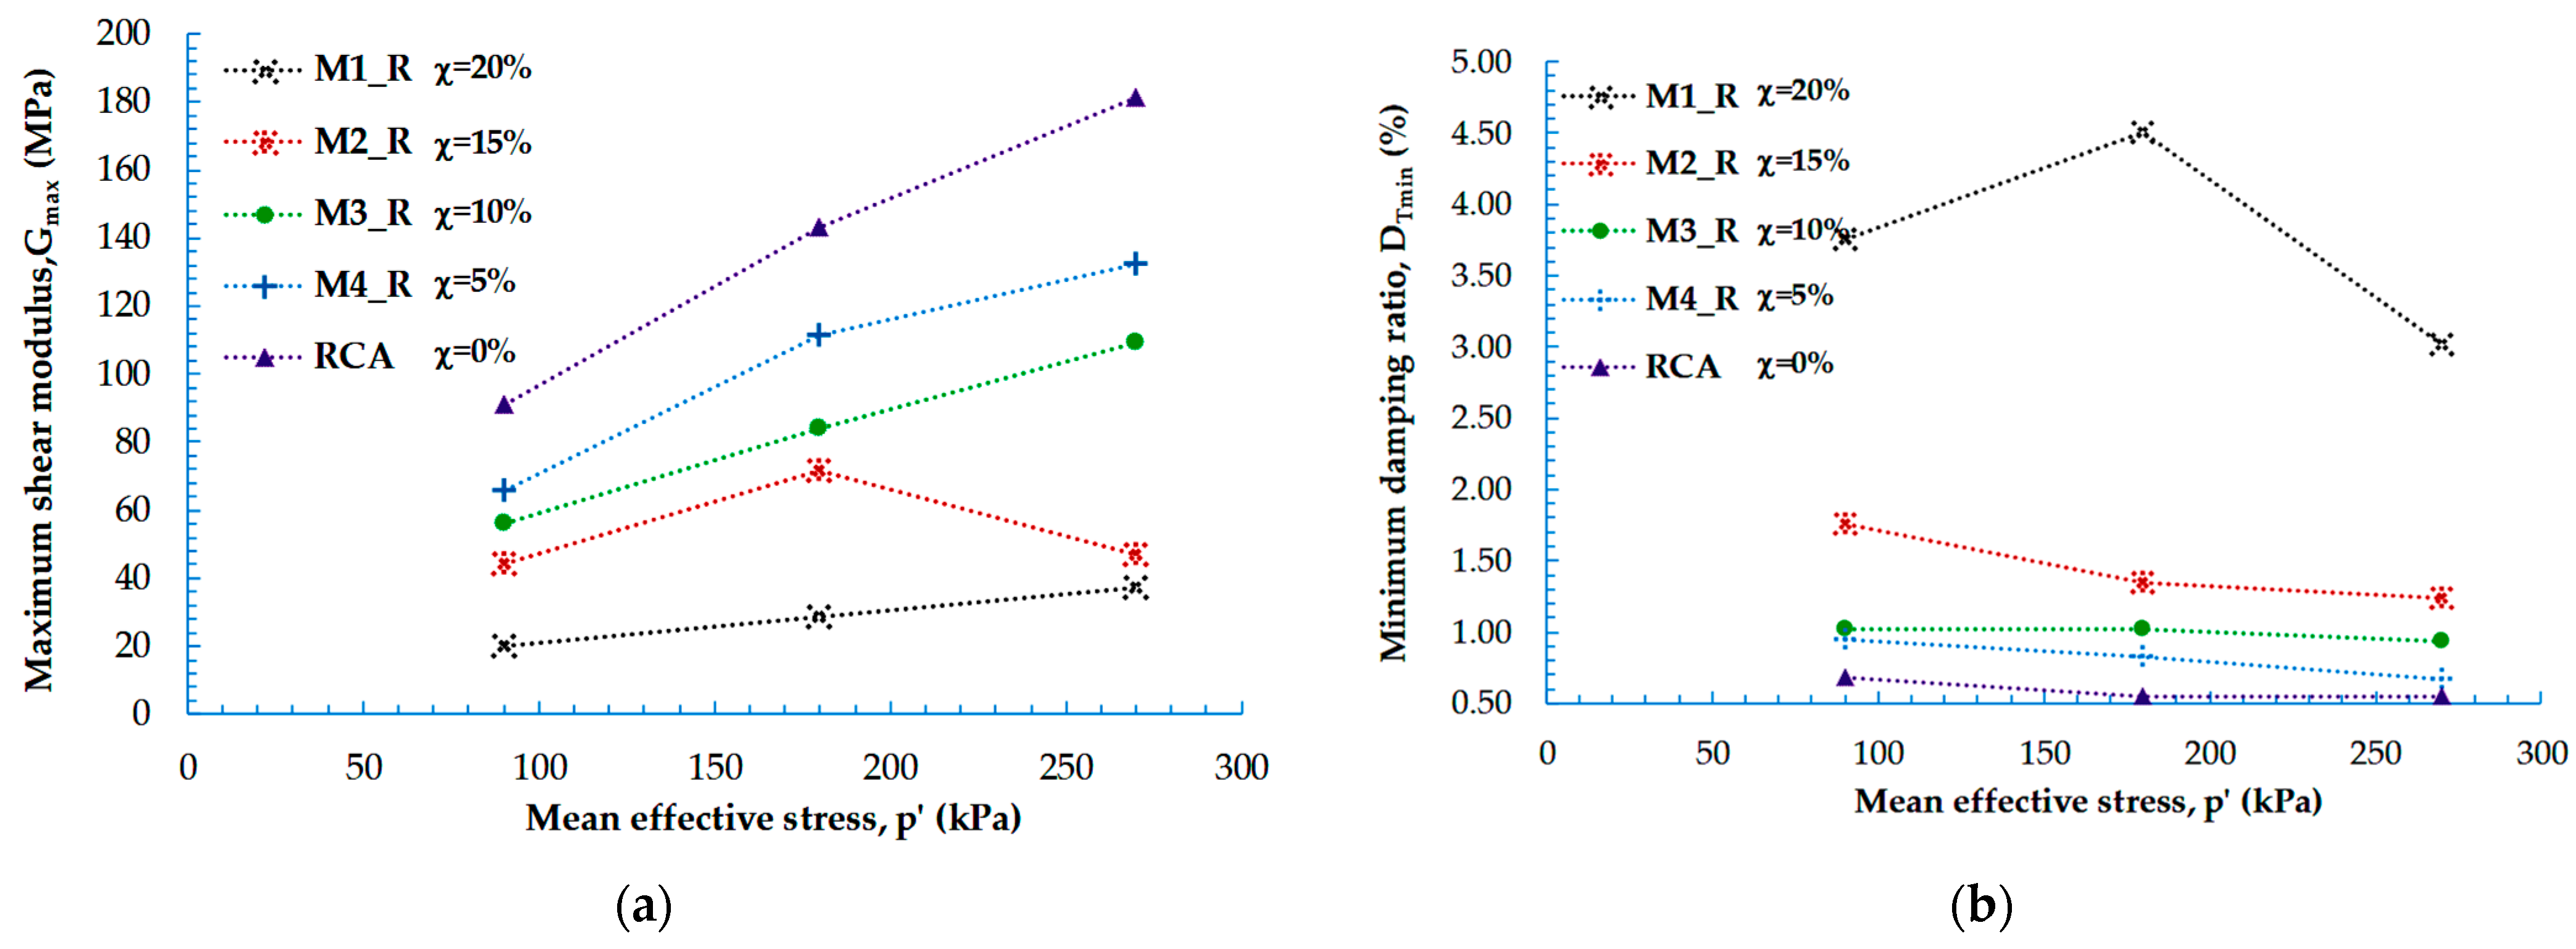
Figure 12.
(a) Maximum shear modulus (small–strain shear modulus) and (b) minimum damping ratio (small–strain damping ratio) versus mean effective stress for a different proportion of RTW from CTS tests.
Figure 12.
(a) Maximum shear modulus (small–strain shear modulus) and (b) minimum damping ratio (small–strain damping ratio) versus mean effective stress for a different proportion of RTW from CTS tests.

Figure 13.
Shear modulus and damping ratio versus the number of cycles of the M1_R mixture with χ = 20%; CTS test performed at the frequency of: (a) 1 Hz; (b) 10 Hz.
Figure 13.
Shear modulus and damping ratio versus the number of cycles of the M1_R mixture with χ = 20%; CTS test performed at the frequency of: (a) 1 Hz; (b) 10 Hz.

Table 1.
Generation and recovery rate of tire waste in different countries [3].
Table 1.
Generation and recovery rate of tire waste in different countries [3].
| Country | Tire Waste Generation per Year | Recovery Rate (%) | Areas of Application | ||
|---|---|---|---|---|---|
| By Weight | By Number | Tire Waste/Person | |||
| (Million Tons) | (Million) | ||||
| United States | 4.200 | 250 | 0.77 | 84 | Tire-derived, Fuel |
| Europe | 3.300 | 270 | 0.53 | 92 | Energy generation |
| Japan | 1.034 | 97 | 0.77 | 93 | Thermal recycling |
| United Kingdom | 0.436 | 40 | 0.62 | 98 | Energy generation |
| Australia | 0.410 | 20 | 0.80 | 38 | Export (Energy generation) |
| Canada | 0.420 | 28 | 0.74 | 98 | Tire crumbs and molded |
| New Zealand | 0.040 | 5 | 1.25 | 30 | Energy generation |
| Tire Component | Car Tire * | Truck Tire * | Car Tire ** | Truck Tire ** | |
|---|---|---|---|---|---|
| (%) | (%) | (%) | (%) | ||
| Rubber | Natural | 19 | 34 | 47 | 45 |
| Synthetic | 24 | 11 | |||
| Fillers (carbon black, silica) | 26 | 24 | 21.5 | 22 | |
| Plasticizers (oil and resin), chemical additives, and others | 14 | 10 | 9.5 | 7 | |
| Reinforcement | Steel | 12 | 25 | 16.5 | 23 |
| Fabric | 5 | - | 5.5 | 3 | |
Table 3.
Categories of granulated tires [6].
Table 3.
Categories of granulated tires [6].
| No | Nomenclature | Rubber Size (mm) and Design | ||
|---|---|---|---|---|
| 1 | Rough shreds | 40~1000 |  | |
| 2 | Tire–derived aggregate (TDA) | Tire shreds | 10~305 | |
| 3 | Tire chips | 12~50 | ||
| 4 | Particulate rubber | Granulated rubber | 0.425~12 | |
| 5 | Ground rubber | 0.425~2 | ||
| 6 | Buffing rubber | 0.1~1 | ||
Table 4.
Properties of recycled rubber waste and recycled concrete aggregate.
| Type | Specific Gravity a Gs | Dimensions | D50 b (mm) | Cu c | Cc d | emax e | emin f |
|---|---|---|---|---|---|---|---|
| RTW | 1.15–1.19 | 0.5–2.0 | 0.65–2.5 | 1.97–2.46 | 0.79–1.14 | 0.88–1.09 | 0.70–0.86 |
| RCA | 2.61–2.62 | 0.015–2.0 | 0.092–0.2 | 2.86–5.60 | 0.91–1.29 | 1.04–1.23 | 0.71–0.91 |
a according to ASTM D854 [34], b median diameter, c uniformity coefficient, d curvature coefficient, e maximum void ratio, f minimum void ratio.
Table 5.
Composition of mixtures used in the study.
| Designation | % RCA | % Fines of RCA | % RTWP | % RTWG |
|---|---|---|---|---|
| M1_R | 80 | 0 | 10 | 10 |
| M2_R | 75 | 10 | 15 | 0 |
| M3_R | 70 | 20 | 10 | 0 |
| M4_R | 65 | 30 | 5 | 0 |
Disclaimer/Publisher’s Note: The statements, opinions and data contained in all publications are solely those of the individual author(s) and contributor(s) and not of MDPI and/or the editor(s). MDPI and/or the editor(s) disclaim responsibility for any injury to people or property resulting from any ideas, methods, instructions or products referred to in the content. |
© 2023 by the author. Licensee MDPI, Basel, Switzerland. This article is an open access article distributed under the terms and conditions of the Creative Commons Attribution (CC BY) license (https://creativecommons.org/licenses/by/4.0/).
Share and Cite
MDPI and ACS Style
Gabryś, K. Geomechanical Characterization of Crushed Concrete–Rubber Waste Mixtures. Sustainability 2023, 15, 14446. https://doi.org/10.3390/su151914446
AMA Style
Gabryś K. Geomechanical Characterization of Crushed Concrete–Rubber Waste Mixtures. Sustainability. 2023; 15(19):14446. https://doi.org/10.3390/su151914446
Chicago/Turabian StyleGabryś, Katarzyna. 2023. "Geomechanical Characterization of Crushed Concrete–Rubber Waste Mixtures" Sustainability 15, no. 19: 14446. https://doi.org/10.3390/su151914446
Note that from the first issue of 2016, this journal uses article numbers instead of page numbers. See further details here.