
Persistence of Hg-Contaminated Soil Stabilization in Typical Areas of Dehua County, Fujian Province, China


1
Ministry of Natural Resources Key Laboratory of Metallogeny and Mineral Assessment, Institute of Mineral Resources, Chinese Academy of Geological Sciences, Beijing 100037, China
2
Environmental Development Centre of Ministry of Ecology and Environment, Beijing 100029, China
*
Author to whom correspondence should be addressed.
Sustainability 2023, 15(2), 1018; https://doi.org/10.3390/su15021018
Submission received: 27 November 2022
/
Revised: 27 December 2022
/
Accepted: 28 December 2022
/
Published: 5 January 2023
(This article belongs to the Special Issue Future Directions for Soil Remediation and Environmental Management)
Abstract
:The in-situ stabilization remediation of Hg-contaminated soil in Qianyang, Dehua County, Fujian Province, was studied through the pre-experiments (stabilization orthogonal experiment and pot experiment) and field plot experiments for two consecutive years. The pre-experiments results showed that the main factors of the stabilization were the initial concentration of Hg in the soil and the amount of amendment added, followed by the amendment type, while the aging time had less effect. When the initial concentration of Hg in the soil was less than 10 mg·kg−1 and the amendment (modified biochar with modified attapulgite) added ratio was 0.2–0.4%, indicating optimized stabilization effect. After one-time application of 6750 and 11,250 kg·hm−2 amendment in low (1.38 mg·kg−1), medium (2.46 mg·kg−1), and high (8.52 mg·kg−1) Hg-contaminated soils, it could accelerate the transformation of Hg from exchangeable to residual and oxidizable Hg, enhance the activities of catalase, urease, and invertase in the soil. After one year of remediation, the case of adding 6750 kg·hm−2 amendment showed a significant stabilization effect. Compared to the control group, the available Hg content in the soil and Hg content in the water spinach reduced to 52.1–62.0% and 58.2–66.6%, respectively. When the application amount was increased to 11,250 kg·hm−2, the reduction rates were 43.2–46.0% and 58.2–62.0%, respectively. After two years of remediation, the stabilization effect was weakened, but the available Hg content in the soil and the water spinach was still significantly lower than that of the control, indicating that the persistence of the stabilization was good. For the soil contaminated slightly by Hg, the Hg content in the water spinach within two years was lower than the limit value of the Chinese standard (0.01 mg·kg−1). Although the Hg content in the water spinach for the soil contaminated highly by Hg was higher than the limit value, it could reduce to 67.3%, indicating an acceptable stabilization effect on heavily contaminated soil.
1. Introduction
As one of the most toxic pollutants in nature, Hg exhibits high neurotoxicity and teratogenicity, a significant accumulation effect, and bio-genetic toxicity. In fact, Hg has been listed as one of the pollutants under strict control by the United States Environmental Protection Agency [1,2,3,4,5]. When it is transferred into the human body via the food chain, Hg and its compounds can have a biomagnification effect, inhibiting the activity of enzymes, interfering with cellular metabolism, and endangering human health [6,7].
The emission sources of Hg can be divided into natural and anthropogenic sources [8,9]. However, natural emissions of Hg are only a small fraction compared with those related to human activities [3]. Anthropogenic sources of Hg include mining, fossil fuel combustion, and various industrial processes. Among them, gold mining activities still represent a widely recognized source of soil Hg. The gold extraction process based on amalgam metallurgy requires a large amount of Hg [10,11]. There are “three small” gold extraction methods commonly used to carry out secondary gold extraction from tailing slag in China, namely the small-mix Hg mill, small cyanide tank, and small ball mill methods. Since only 50–60% of the Hg can be recovered, the rest of the Hg residue in the slag is directly dumped beside the river channel and in the plains or valleys, aggravating the soil Hg contamination [12,13].
In-situ chemical stabilization is one of the most common remediation techniques for Hg-contaminated soil [14,15,16,17,18]. In this process, amendments (e.g., clay minerals, phosphates, metal oxides, biochar, and nanomaterials) are added to soil to induce the adsorption, complexation, precipitation, and ion exchange of Hg. This method can reduce the mobility and bioavailability of Hg to achieve the purpose of soil remediation [19,20,21,22,23,24,25]. However, the surface activity and adsorption performance of natural materials have some limitations. Recently, they are often modified or formulated with multiple materials for better stabilization [26,27,28,29]. Additionally, most of the current studies on the stabilization remediation of Hg-contaminated soils are indoor cultivation or pot experiments. However, the results of pot experiments need to be verified by field tests due to the complexity of the soil properties and the dependence of crops on the growing environment [30]. To date, there have been relatively few studies on the field effects of in-situ stabilization remediation on Hg-contaminated soil, especially in terms of the long-term effects. It has been demonstrated that after in-situ stabilization remediation the soil is exposed to the reactivation of heavy metals during long-term crop planting. As a result, heavy metals can migrate into the crops and cause potential harm [31,32].
Based on the principle of stabilization remediation, this study took biochar and attapulgite as the basic amendments and conducted an orthogonal experiment and pot experiment to determine the suitable conditions for stabilization remediation of typical Hg-contaminated soil in Dehua County, Fujian Province. Then, the field plot experiment was conducted to verify the in-situ stabilization persistence of typical Hg-contaminated soil after the one-time application of amendment for two consecutive years. This study is expected to provide a scientific basis for ensuring the quality and safety of the local farmland.
2. Materials and Methods
2.1. The Study Area
Dehua is in the central part of Fujian, northwest of Quanzhou, and it has a high terrain and complex topography. The annual average temperature is 18.0 °C, and the annual average rainfall is 1600–2100 mm. The strata are relatively well-developed, and the gold deposits are distributed on a large scale. Previous studies show that the Hg contamination of the soil due to gold mining is serious in Dehua and is typical of the Qianyang area. A greenhouse was built as the fieldwork site here. The geographical location and sampling sites are shown in Figure 1.
2.2. Chemicals
Biochar was purchased from Yangzhong Huafeng Agricultural Biological Engineering Co., Ltd. (Yangzhong, China). Attapulgite was purchased from Xuyi Sinoma Attapulgite Clay Co., Ltd. (Huaian, China). Experimental acids (HCl, HNO3, HF, and HClO4), H2O2, KMnO4, NaClO, and the organic solvent (C6H5ONa, C7H4N2O7) used in the determination of soil enzyme activity were purchased from Chemical Works (Beijing, China). The purity of all the experimental acids was guaranteed reagent (GR), while the purity of other chemicals mentioned above was analytical reagent (AR). HAc, NH2OH·HCl, and NH4OAc were purchased from Sinopharm Chemical Reagent Beijing Co., Ltd. (Beijing, China), and their purity was GR.
2.3. Experimental Design and Processing
2.3.1. Pre-Test
Soil
A total of 121 dryland surface soil samples were collected in Qianyang with a sampling density of 100 × 100 m (Figure 1). The amount of soil that was collected ranged from 0 to 20 cm for each sample point and weighed about 2 kg. According to the measured content of Hg at the sampling points, we divided the 121 values into seven different Hg concentration intervals, ranging from 0 to 1.5 mg·kg−1, 1.5 to 3.0 mg·kg−1, 3.0 to 4.5 mg·kg−1, 4.5 to 6.0 mg·kg−1, 6.0 to 7.5 mg·kg−1, 7.5 to 9.0 mg·kg−1 and > 9.0 mg·kg−1, respectively. Then, the soil samples at different initial Hg concentrations for the orthogonal experiment and pot experiment were prepared by mixing the soils from the above intervals. All soil samples were air-dried and sieved through a 2-mm polyethylene sieve for use.
Amendments
Four different amendments (A1 = modified biochar, A2 = modified attapulgite, A3 = biochar with attapulgite, and A4 = modified biochar with modified attapulgite; the ratio of biochar to attapulgite in A3 and A4 was 3:5) were used in this study. The modified attapulgite was prepared by acid modification combined with thermal modification. The natural attapulgite was dried, passed through a 200-mesh sieve, and mixed with 4 mol·L−1 HNO3 solution at a ratio of 1:3 of solid to liquid. Then, it was soaked and stirred for 2 h at 70–80 °C, and it was heat-treated at 300–450 °C for 2–4 h. In addition, the biochar was modified by KMnO4. The biochar, 65% HNO3 solution, and 0.5 mol·L−1 KMnO4 solution were mixed at a ratio of 1:2:5, then it was left to cool, and oxidation was conducted at 90 °C for 2 h. Subsequently, it was washed, centrifuged, and dried for further use.
Stabilization Orthogonal Experiment
We weighed 200 g of the sieved soil into plastic flowerpots and added the four different amendments according to the additional amounts of 0.5%, 1%, 2%, and 3% (mass fractions, which is the ratio of application amounts of the amendment to the total mass of the soil), and they were mixed well with the Hg-contaminated soil (initial concentrations: 3.85, 8.97, 18.4, and 28.7 mg·kg−1, respectively). We regularly added DI water to the soil to keep the soil moist, and the flowerpots were placed in a ventilated area of the test greenhouse to mature and stabilize for 30, 60, 90, and 120 d for each treatment. There were three replicates for each of the above treatments, and a control group was set up at the same time to compare the effects of the amendment type, amount of amendment added, initial concentration of Hg, and aging time on the reduction rate of the available Hg content in the soil (Table 1). This study adopted a four-factor and four-level orthogonal experiment design scheme, which did not consider interactions, and an empty column was set as the experimental error to measure the reliability of the experiment. The selected orthogonal table L16(45) is shown in Table 2.
2.3.2. Pot Experiment
Based on the stabilization orthogonal experiment results, we weighed 200 g of sieved soil into plastic flowerpots, and the initial Hg concentrations were about 4.32, 9.81, 13.5, 18.7, and 29.3 mg·kg−1. Amendment A4 was selected, and the addition ratios were 0, 0.2%, 0.4%, 0.6%, and 0.8% (mass fractions). After aging for 90 d, 10 water spinach seeds with full grains and uniform size were sown at a depth of 2 cm, and the soil was kept moist every day. The seedlings were thinned about 7 d after emergence, with six evenly spaced plants per pot. There were three replicates for each group, and compound fertilizer (N:P2O5:K2O = 10:4:3) was added to the soil during growth. The plants and soil samples were collected at the maturity of the water spinach, and indicators such as the available Hg content in the soil, Hg content in the water spinach, and dry weight of the water spinach were measured.
2.3.3. Field Plot Experiment
Based on the pre-experiment results, the low, medium, and high levels of the Hg-contaminated soil were set at the initial concentrations of about 1.38, 2.46, and 8.52 mg·kg−1, respectively. There were three treatments for the amendment A4 application ratio for each level, which were 0, 0.3%, and 0.5% (mass fractions). Based on the soil thickness of the 20 cm tillage layer, the actual application amounts of the amendment in each plot were about 0, 6750, and 11,250 kg·hm−2, respectively. Each group had three replicates, with a total of 27 plots, and each plot area was 6 m3 (3 × 2 m), with a random arrangement. To prevent each community from influencing the other, ridges were used to separate the plots, and they were covered with a film to protect the peripheral plots. After the land was leveled in July 2015, amendment A4 was applied (one-time application) and mixed with the soil. After aging for 90 d, water spinach was planted in the first year (September 2015) and the second year (August 2016), with 15 rows per plot, 20 plants per row, 20 cm row spacing, and 10 cm plant spacing. The selected water spinach seeds and compound fertilizers were the same as those used in the pot experiment. During the experiment, the water content was maintained at 60% to 70% of the maximum water-holding capacity in the field and was checked every day. The crop planting, fertilization, and control of pests and weeds were all carried out in accordance with the local planting habits. After the water spinach matured, the actual yield of each plot was measured by the multi-point sampling method. Then, 30 water spinach samples with the same growth rate were simultaneously collected with corresponding root soil samples, and the pH value of the soil, total Hg content, available Hg content, morphological Hg content, enzyme activity, Hg content in the water spinach, and the water spinach yield, were determined.
2.3.4. Sample Pretreatment and Analysis Methods
The soil samples were naturally air-dried to remove the plant residues, gravel, and other debris, and they were placed in a dry and ventilated place to dry out in the shade. Then, the soil samples were quartered and passed through a 200-mesh sieve. The water spinach samples were first rinsed with water to remove the adhered soil and pollution due to fertilization, and then they were rinsed 1–2 times with DI water, drained, and air-dried at room temperature. Next, they were dried at 65 °C to a constant mass, weighed, and passed through a 100-mesh sieve.
The total Hg in the soil was extracted using an HCl-HNO3-H2O2 (3:1:1 volume ratio). The available Hg was extracted with a 0.1 mol·L−1 NH4OAc. The morphological analysis of the Hg was continuously extracted by the BCR method, which included the exchangeable (F1), reducible (F2), oxidizable (F3), and residual (F4) Hg [33,34]. The Hg in the water spinach was extracted with an HNO3. Furthermore, the Hg in the extracts was measured by inductively coupled plasma mass spectrometry (ICP-MS, Agilent 7700x, Agilent, CA, USA). The limit of detection (LOD) and the limit of quantitation (LOQ) was 0.007 mg·kg−1 and 0.024 mg·kg−1, respectively. Duplicate samples, blank samples, and reference materials (GBW series) were inserted into each batch of samples during the testing process to control the analytical quality. The Hg recoveries of the total Hg content, available Hg content, morphological Hg content, and Hg content in the water spinach during the analysis were 93.7–98.3%, 90.0–93.3%, 95.6–107.8%, and 93.5–106.3%, respectively. The relative double-differences of the repeatable samples were 1.85–6.12%, 1.37–7.16%, 1.56–4.34%, and 5.08–6.21%, respectively.
The pH value of the soil was determined by the glass electrode method. The soil catalase activity (CAT) was determined by the KMnO4 titration method [35]. The urease activity (URE) was determined by the sodium phenate-sodium hypochlorite colorimetric method [36,37]. In addition, the invertase activity (INV) was determined by the 3,5-dinitrosalicylic acid colorimetric method [37].
2.3.5. Assessment of the Stabilization Effect
The stabilization effect (SE) was evaluated by the reduction rate of the available Hg content in the soil (SE1), the reduction rate of the Hg content in the water spinach (SE2), or the growth rate of the dry weight of the water spinach when collected at maturity (SE3):
where c0 is the available Hg content in the soil of the control group; cs is the available Hg content in the soil after the addition of the amendment; cp is the Hg content in the water spinach in the control group; cr is the Hg content in the water spinach after adding the amendment; ma is the dry weight of the water spinach when collected after the addition of the amendment; mb is the dry weight of the water spinach in the control group.
2.3.6. Data Processing
Excel 2010 and SPSS 25.0 were used for data processing and statistical analysis, a one-way analysis of variance method (ANOVA) was used to determine the significant differences, the Pearson correlation coefficient was used to analyze the correlation, and the graphs were drawn using Sigmaplot 14.0 (Systat Software Inc., San Jose, CA, USA), Surfer 13.0 (Golden Software Inc., Golden, CO, USA) and R 4.2.1 (Ihaka, R. and Gentleman, R., Auckland, New Zealand).
3. Results
3.1. Results of the Stabilization Orthogonal Experiment
Through the four-level and four-factor stabilization orthogonal experiment, the effects of the amendment type, amount of amendment added, initial concentration of Hg, and aging time on the available Hg content in the soil were investigated, as shown in Table 3.
When compared to the control group without the amendment addition, the 16 groups could reduce the available Hg content in the soil, and the average SE1 was 20.5–42.5%. The R-value showed that the influence of the four factors on the SE1 was in the order of C > B > A > D. According to the average k value of the different treatments, the optimal combination of each factor was A4-B1-C2-D3, that is, the addition of amendment A4 with a mass fraction of 0.5%, with an initial Hg concentration of 8.97 mg·kg−1, and after aging for 90 d, it had the best stabilization effect on the soil Hg.
The results of the ANOVA (Table 4) showed that there were significant differences in the effects of the four factors on the stabilization. Specifically, the p-values of factors C and B were 0.024 and 0.032, respectively, suggesting that the initial concentration of Hg and the amount of amendment that was added had a more significant effect on the results. Moreover, the p-value of factor A was 0.069, suggesting that the amendment type had a significant effect on the results. Then, the p-value of factor D was greater than 0.1. Thus, the effect of the aging time was not significant. Hence, it can be concluded that the initial concentration of Hg and the amount of amendment added were the primary factors, and the amendment type was a secondary factor, while the aging time had less impact on the stabilization.
3.2. Results of the Pot Test
Based on the analysis results of the stabilization orthogonal experiment, to obtain better experimental conditions, we further determined the optimal level of the two factors that had a significant impact on the stabilization, namely the initial concentration of the soil Hg and the amount of amendment added, through the pot experiment. The changes in the available Hg content in the soil, Hg content in the water spinach, and dry weight of the water spinach that was collected at maturity are illustrated in Figure 2.
As shown in Figure 2a, compared to the control group, the average reduction in the available Hg content in the soil decreased from 45.5% to 30.8% as the amendment added ratio increased from 0.2% to 0.8%. When the amendment added ratio was 0.4%, the average reduction in the Hg content in the water spinach with different initial concentrations of Hg was the largest, at about 52.6%. When the addition ratio was increased to 0.8%, the average Hg content in the water spinach was reduced to 37.5% (Figure 2b). Additionally, the available Hg content in the soil, the Hg content in the water spinach, and the dry weight of the water spinach decreased from 50.7% to 24.3%, 55.1% to 25.4%, and 40.6% to 19.2%, respectively, as the initial concentration of Hg increased from 4.32 to 29.3 mg·kg−1.
In order to investigate the optimal applicable conditions of Hg-contaminated soil stabilization, the amount of amendment added was taken as the horizontal coordinate and the initial concentration of Hg in the soil was taken as the vertical coordinate, and then the changes in SE1, SE2, and SE3 under the dual influence of the two factors were plotted, as shown in Figure 3.
For the soil with an initial concentration of Hg that was less than 10 mg·kg−1, when the amendment added ratio was 0.2% and 0.4%, the SE1, SE2, and SE3 were about 55.0–61.2%, 66.2–70.9%, and 37.8–47.1%, respectively. When the amendment added ratio increased to 0.6% and 0.8%, the SE1, SE2, and SE3 were 37.9–49.6%, 46.7–50.1%, and 33.6–37.8%, respectively. For the soil with an initial Hg concentration between 10 and 20 mg·kg−1, after applying 0.2–0.8% amendment, the SE1, SE2, and SE3 were 25.5–45.4%, 34.0–57.2%, and 21.2–36.8%, respectively. In addition, for the soil with an initial concentration of Hg that was as high as 29.3 mg·kg−1, the stabilization efficiency value did not exceed 30%. An overall evaluation of the SE1, SE2, and SE3 revealed that the initial Hg concentration in the soil was below 10 mg·kg−1 when the amendment added ratio was 0.2–0.4%, indicating an optimized stabilization effect.
3.3. Results of the Field Plot Experiment
3.3.1. Variation in the Available Hg Contents in the Soil
Figure 4 shows the available Hg contents in the soil for two consecutive years in the field plot experiment.
After one year of remediation, the SE1 of each treatment’s available Hg content decreased with the increase in the initial concentration of Hg in the soil. When the amendment added ratio was 0.3% and 0.5%, the SE1 values were 52.1–62.0% and 43.2–46.0%, respectively. After two years of remediation, with the amendment application ratio of 0.3% and 0.5%, the SE1 values were 43.8–52.4% and 47.3–50.8%, respectively. In summary, with the prolongation of the stabilization time, the available Hg content of each treatment increased year-on-year but was still significantly lower than that of the control group (p < 0.05), and the persistence of the stabilization was good.
3.3.2. Soil Hg Form Changes
Figure 5 shows the changes in the proportion of Hg in each form in the soil for two consecutive years.
Before applying the amendment, the morphology of the soil Hg was dominated by residual Hg, accounting for about 38.1–47.3%. The proportions of F3, F2, and F1 were about 19.7–25.1%, 9.76–16.3%, and 20.5–25.6%, respectively. Compared to the control group, the addition of the amendment could effectively reduce the proportion of F1 and increase the proportion of F2, F3, and F4. That is, it could accelerate the transformation of Hg from an active form to a stable form. In the first year, the F1 content in the high, medium, and low Hg-contaminated soils reduced to 23.4%, 26.7%, and 22.6%, respectively, while the F4 content increased to 10.3%, 8.59%, and 9.30%, respectively, and the proportion of F3 and F2 did not change significantly. With the prolongation of the stabilization time, although the proportion of F1 in each treatment increased, it was always lower than that of the control group. In addition, the average F1 content in the high, medium, and low Hg-contaminated soils reduced to 19.7%, 23.1%, and 25.6%, respectively. The average increments of F3 were 9.84%, 12.2%, and 4.93%, and the averages of F4 were 7.93%, 3.92%, and 10.2%. The proportion of F2 did not change significantly.
3.3.3. Hg content in the Water Spinach and the Water Spinach Yield
Figure 6 and Figure 7 show the changes in Hg content in the water spinach at maturity and the yield of the water spinach in two consecutive years.
According to Figure 6, after one year of remediation, when the amendment added ratio was 0.3% and 0.5%, the SE2 values were 58.2–66.6% and 58.2–62.0%, respectively. The difference between the two different amounts of each amendment was not significant (p > 0.05). After two years of remediation, the SE2 values were 50.1–61.4% and 51.9–69.4%, respectively. Additionally, for the medium and low Hg-contaminated soils, the average Hg content in the water spinach in the control group were about 0.009 and 0.018 mg·kg−1, respectively, which is at or close to the limit value of Chinese standard for Hg in vegetables (0.01 mg·kg−1) [38]. After the amendment application, the Hg content in the water spinach could be reduced to less than 0.01 mg·kg−1, which is in line with the national food safety standards. For the soil contaminated highly by Hg, the Hg content in the water spinach in the control group was 0.052 mg·kg−1, which is about five times higher than the limit value. After applying 0.3% or 0.5% amendment, the average Hg content in the water spinach in two consecutive years decreased to 0.021 and 0.017 mg·kg−1, respectively, and the average SE2 values were about 59.6% and 67.3%, respectively.
In Figure 7, the water spinach yield decreased as the initial concentration of Hg in the soil increased. After the one-time amendment application, the water spinach yield increased to a certain extent within two years, but it did not reach a significant level (p > 0.05). For the high, medium, and low Hg-contaminated soils, after applying 0.3% amendment, the average water spinach yield increased by about 4.39%, 2.84%, and 1.46% when compared with that of the control group in two years. Whereas in the 0.5% treatment group, the average increment of the water spinach yields were 4.81%, 1.61%, and 1.29%, respectively.
3.3.4. Changes in the Enzyme Activity in the Soil
The enzyme activity in the soil is one of the most sensitive indicators for evaluating soil fertility and measuring changes in soil quality. It plays an important role in the material cycle and energy flow of the soil ecosystem [39]. Moreover, it can characterize the metabolic functions of the microorganisms well and control the release of biological nutrients in the soil. Recently, soil catalase, urease, and invertase have been widely used to monitor the biological properties of contaminated soil [40]. Catalase is a kind of soil oxidoreductase, and it is used to decompose hydrogen peroxide in the soil and plays a vital role in crop growth. When its content is too high or too low, it is not conducive to crop growth. Then, urease can directly reflect the level and ability of the nitrogen supply in the soil, and it is closely related to the nitrogen cycle system in the soil. In addition, invertase can convert sucrose into glucose and fructose through hydrolytic conversion, which can be utilized by plants and microorganisms. The enzyme activities in the Hg-contaminated soil are shown in Table 5.
It has been demonstrated that the enzyme activity in the soil is susceptible to heavy metals in the soil. In this study, the catalase, urease, and invertase activities were reduced to about 26.3%, 53.0%, and 43.9%, respectively, indicating that urease and invertase have a higher sensitivity to Hg-contaminated soil. Firstly, heavy metals may form stable complexes by coordinating with the active sites, such as the sulfhydryl groups in enzyme molecules, thereby inhibiting enzyme activity. Secondly, heavy metals may affect the growth and reproduction of microorganisms and reduce the synthesis and secretion of enzymes in the organism, resulting in a decrease in enzyme activity [41].
After applying 0.3% or 0.5% amendment to the soil, the average catalase, urease, and invertase activities increased by 25.5–29.3%, 30.6–32.8%, and 28.5–31.9%, respectively, suggesting that amendments can accelerate biochemical reactions in the soil. This is beneficial for the material circulation and energy flow in the soil system, which enhances the environmental quality of the soil. The reason for this response may be that the amendment enhances the structure and the water-holding capacity of the soil and is beneficial for the enhancement of microbial activity. Thus, the toxic effect of the heavy metal on the enzyme activity in the soil was slowed down [42,43]. In this study, as the amendment added ratio increased from 0.3% to 0.5%, the enzyme activity in the soil gradually decreased. This may be because the amendment adsorbs the enzyme molecules in the soil to create a protective effect on the binding site of the enzymatic reaction, thereby inhibiting the enzyme activity in the soil [42,43].
3.3.5. Correlation Analysis
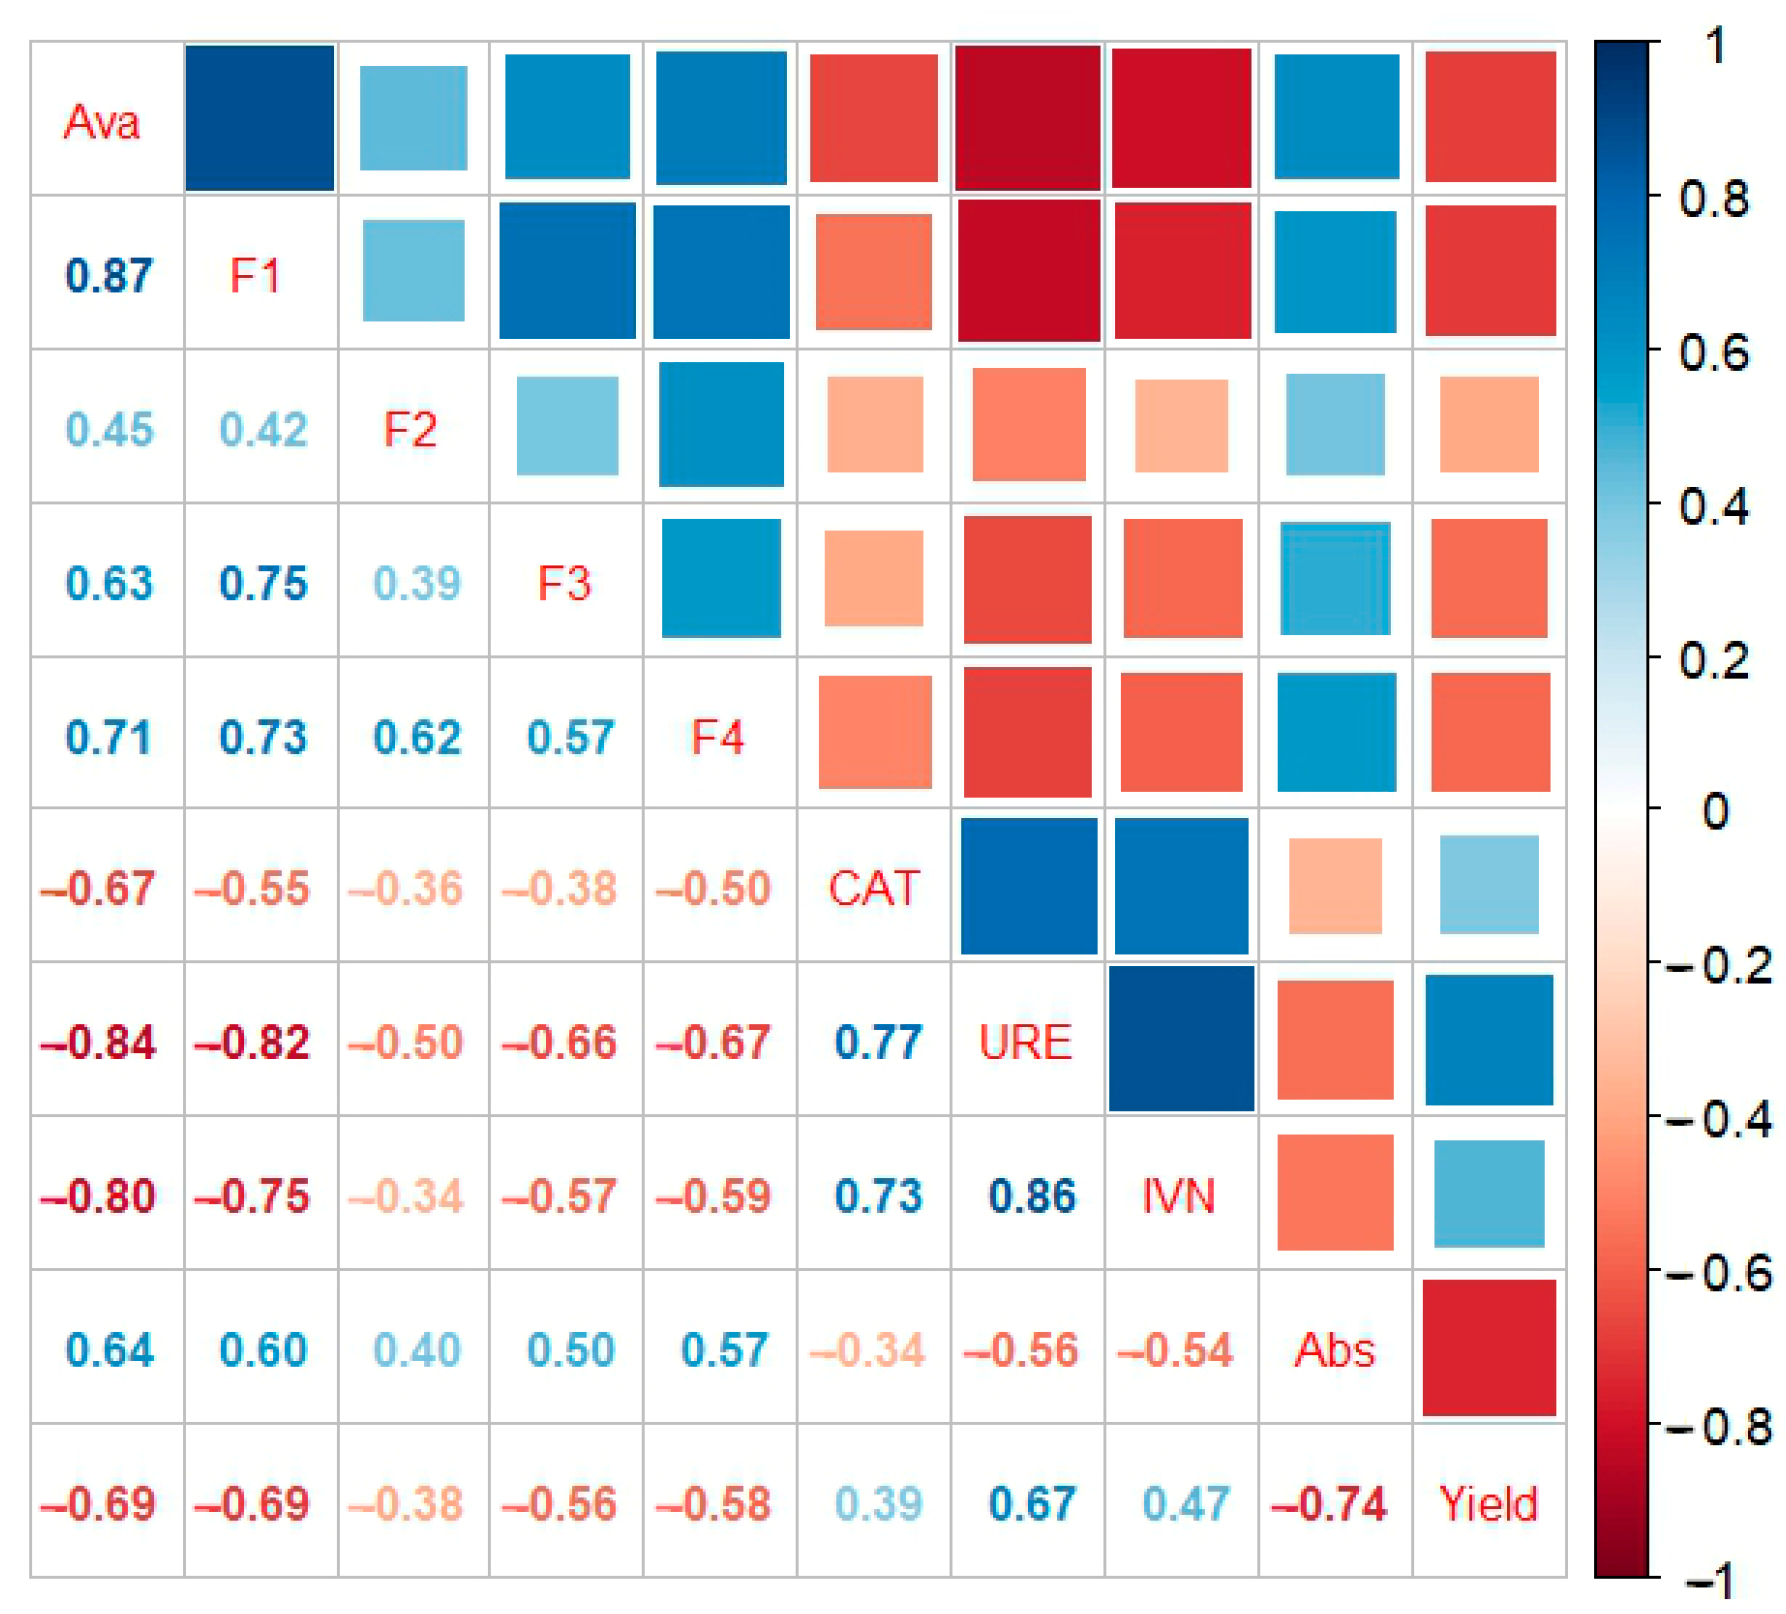
The correlation analysis of various environmental factors is shown in Figure 8.
There were extremely significant correlations (p < 0.01) or significant correlations (p < 0.05) among the available Hg content in the soil, the content of exchangeable, reducible, oxidized, and residual Hg in the soil, enzyme activities, Hg content in the water spinach and the yield of water spinach. As shown in Figure 8, the Hg in the water spinach was significantly correlated with the content of available Hg, exchangeable Hg, oxidized Hg, and residual Hg in the soil, the urease and invertase activities, and the water spinach yield. The correlation coefficients were between 0.5 and 0.8, indicating a moderate correlation. The available Hg content in the soil was positively correlated with exchangeable Hg and negatively correlated with urease and invertase activities, and the correlation coefficients were above 0.8, indicating a strong correlation. Therefore, they can be used as an evaluation index to guide the stabilization effect of Hg-contaminated soil.
4. Discussion
In this study, a composite amendment of modified biochar and modified attapulgite was used for Hg-contaminated soil, and a good stabilization effect was obtained. Previous studies showed that after adding the composite amendments to the soil, the activity of Hg2+ can be reduced by physical and chemical reactions with Hg2+, and the mechanism of stabilization mainly involves ion exchange, complexation reactions, and precipitation reactions [44,45,46]. Among them, the biochar surface contains sufficient oxygen-containing functional groups, which can reduce the effectiveness of Hg through adsorption and complexation. Attapulgite is a hydrous silicate mineral that mainly contains aluminum and magnesium. It has a unique layered chain structure, good ion exchange performance, and good adsorbing performance; it can also transform Hg in the soil from a highly active exchangeable form to a more stable obligate binding form through the complexation reaction, reducing the activity of the heavy metal in the soil [47]. Additionally, biochar and attapulgite can promote the adsorption of heavy metals by soil colloids and clay particles by increasing the pH value of the soil and increasing the variable negative charge on the soil surface [28,48]. After the pH value increases, it promotes the hydrolysis of Hg2+ to Hg(OH)+, and the affinity of Hg(OH)+ on the adsorption site in the soil is significantly higher than that of Hg2+. Moreover, OH− reacts with CO2 and generates CO32−, and carbonate can form insoluble carbonic acid Hg with Hg2+, which can increase the stabilization effect of Hg [47,49]. In this study, it could be seen that the pH value of the soil increased gradually with the increase in the amount of amendment added, and the average increase was 0.26–1.41 units with different initial concentrations of Hg in the soil.
The in-situ stabilization technology mainly reduces the mobility of the Hg in the soil by changing the existing form of the Hg. However, Hg still exists in the soil and maintains a dynamic balance. As environmental conditions change, the immobilized Hg may be re-released, so the persistence of the stabilization of the amendment on Hg is important. After the one-time amendment application, the application of 6750 kg·hm−2 amendments showed a significant effect in the first year. When the application amount was increased to 11,250 kg·hm−2, the stabilization effect was decreased. The correlation analysis results showed that the Hg in the water spinach had an extremely significant positive correlation with the available Hg content in the soil, while the available Hg content in the soil had an extremely significant negative correlation with the activities of urease and invertase, and the correlation coefficient was high. Therefore, it was inferred that excessive amendment inhibited the soil enzyme activities and thus affected the adsorption performance of Hg. For the medium and low Hg-contaminated soil, there was no significant difference between treatments with different amounts of the amendment. After applying 6750 and 11,250 kg·hm−2 amendment, Hg contents in the water spinach within two consecutive years were lower than the limit value of Chinese standard (0.01 mg·kg−1). Therefore, from an economic point of view, the application of the 6750 kg·hm−2 amendment can be used to achieve the target effect. For the high Hg-contaminated soil, applying different amounts of the amendment, although the Hg content in the water spinach was still higher than the limit value, it decreased greatly, indicating that the persistence of the stabilization was good. It has been demonstrated that water-soluble organic substances and species, such as K, Ca, P, N, and S, dissolve and diffuse into the surrounding soil either in the carbon lattice or in the micron-scale mineral phase and will change the pH value and oxidation-reduction potential of the soil, thereby changing the surface structure and chemical properties of the amendment and leading to its aging. It can form new heavy metal adsorption sites and ensure that the amendment surface remains active and continuously adsorbs heavy metals [50]. To sum up, these findings could be used to improve the efficiency of stabilization remediation for Hg-contaminated soil over a longer time scale. In the practical application, the appropriate amount of amendment added should be considered in combination with the degree of soil Hg pollution and economic benefits.
5. Conclusions
The main factors of the stabilization of Hg-contaminated soil in Qianyang, Gekeng, and Dehua County were the initial concentration of Hg in the soil and the additional amount of amendment, followed by the amendment type, while the aging time had less effect. When the initial concentration of Hg in the soil was less than 10 mg·kg−1 and the amendment (modified biochar with modified attapulgite) added ratio was 0.2–0.4%, indicating optimized stabilization effect. The field plot experiment confirmed that the persistence of the stabilization was good for two consecutive years. After one year of remediation, the case of adding 6750 kg·hm−2 amendment showed a significant stabilization effect. Compared to the control group, the available Hg content in the soil and Hg in the water spinach reduced to 52.1–62.0% and 58.2–66.6%, respectively. When the application amount was increased to 11,250 kg·hm−2, the reduction rates were 43.2–46.0% and 58.2–62.0%, respectively. After two years of remediation, the stabilization effect was weakened, but they were still significantly lower than the control. For the soil contaminated slightly by Hg, Hg contents in the water spinach within two years were lower than the limit value of Chinese standard (0.01 mg·kg−1). Although the Hg content in the water spinach for the soil contaminated highly by Hg was higher than the limit value, Hg contents could reduce to 67.3%, indicating an acceptable stabilization effect on heavily contaminated soil.
Author Contributions
Writing—original draft preparation, formal analysis, and methodology, R.W.; Writing—review and editing, R.W., N.C. and G.L.; Software, N.C.; Funding acquisition, J.D.; Investigation, sample collection, sample determination and project administration, M.C. and J.Z. All authors have read and agreed to the published version of the manuscript.
Funding
This research was funded by the Science & Technology Fundamental Resources Investigation Program (Grant No.2022FY101704) and the Geological Survey Projects (DD20221694).
Institutional Review Board Statement
Not applicable.
Informed Consent Statement
Not applicable.
Data Availability Statement
The data presented in this study are available on request from the corresponding author.
Conflicts of Interest
The authors declare no conflict of interest.
References
- Qiu, G.L.; Feng, X.B.; Wang, S.F.; Shang, L.H. Environmental contamination of mercury from Hg-mining areas in Wuchuan, northeastern Guizhou, China. Environ. Pollut. 2006, 142, 549–558. [Google Scholar] [CrossRef] [PubMed]
- Chen, C.F.; Ju, Y.R.; Lim, Y.C.; Chen, C.W.; Wu, C.H.; Lin, Y.L.; Dong, C.D. Dry and wet seasonal variation of total mercury, inorganic mercury, and methylmercury formation in estuary and harbor sediments. J. Environ. Manag. 2020, 253, 109683. [Google Scholar] [CrossRef] [PubMed]
- Acquavita, A.; Floreani, F.; Covelli, S. Occurrence and speciation of arsenic and mercury in alluvial and coastal sediments. Curr. Opin. Environ. Sci. Health 2021, 22, 100272. [Google Scholar] [CrossRef]
- Uc-Peraza, R.G.; Gutiérrez-Galindo, E.A.; Delgado-Blas, V.H.; Munoz-Barbosa, A. Total mercury content in the California ribbed sea mussel Mytilus californianus from the west coast of Baja California, México: Levels of contamination and human health risk. Mar. Pollut. Bull. 2021, 170, 112585. [Google Scholar] [CrossRef] [PubMed]
- Windham-Myers, L.W.; Marvin-DiPasquale, M.; Kakouros, E.; Agee, J.L.; Kieu, L.H.; Stricker, C.A.; Fleck, J.A.; Ackerman, J.T. Mercury cycling in agricultural and managed wetlands of California, USA: Seasonal influences of vegetation on mercury methylation, storage, and transport. Sci. Total Environ. 2014, 484, 308–318. [Google Scholar] [CrossRef]
- Elumalai, V.; Sujitha, S.B.; Jonathan, M.P. Mercury pollution on tourist beaches in Durban, South Africa: A chemometric analysis of exposure and human health. Mar. Pollut. Bull. 2022, 180, 113742. [Google Scholar] [CrossRef]
- Zahir, F.; Rizwi, S.J.; Haq, S.K.; Khan, R.H. Low dose mercury toxicity and human health. Environ. Toxicol. Phar. 2005, 20, 351–360. [Google Scholar] [CrossRef]
- Sun, G.Y.; Feng, X.B.; Yang, C.M.; Zhang, L.M.; Yin, R.S.; Li, Z.G.; Bi, X.Y.; Wu, Y.J. Levels, sources, isotope signatures, and health risks of mercury in street dust across China. J. Hazard. Mater. 2020, 392, 122276. [Google Scholar] [CrossRef]
- Jung, S.; Kwon, S.Y.; Hong, Y.; Yin, R.; Motta, L.C. Isotope investigation of mercury sources in a creek impacted by multiple anthropogenic activities. Chemosphere 2021, 282, 130947. [Google Scholar] [CrossRef]
- Martinez, G.; Restrepo-Baena, O.J.; Veiga, M.M. The myth of gravity concentration to eliminate mercury use in artisanal gold mining. Extract. Ind. Soc. 2021, 8, 477–485. [Google Scholar] [CrossRef]
- Cordy, P.; Veiga, M.M.; Salih, I.; Al-Saadi, S.; Console, S.; Garcia, O.; Mesa, L.A.; Velásquez-López, P.C.; Roeser, M. Mercury contamination from artisanal gold mining in Antioquia, Colombia: The world’s highest per capita mercury pollution. Sci. Total Environ. 2011, 410–411, 154–160. [Google Scholar] [CrossRef]
- Yevugah, L.L.; Darko, G.; Bak, J. Does mercury emission from small-scale gold mining cause widespread soil pollution in Ghana? Environ. Pollut. 2021, 284, 116945. [Google Scholar] [CrossRef]
- Gyamfi, O.; Sørensen, P.B.; Darko, G.; Ansah, E.; Vorkamp, K.; Bak, J.L. Contamination, exposure and risk assessment of mercury in the soils of an artisanal gold mining community in Ghana. Chemosphere 2021, 267, 128910. [Google Scholar] [CrossRef]
- Eckley, C.S.; Gilmour, C.C.; Janssen, S.; Luxton, T.P.; Randall, P.M.; Whalin, L.; Austin, C. The assessment and remediation of mercury contaminated sites: A review of current approaches. Sci. Total Environ. 2020, 707, 136031. [Google Scholar] [CrossRef]
- Rajendran, S.; Priya, T.A.K.; Khoo, K.S.; Hoang, T.K.A.; Ng, H.S.; Muñawaroh, H.S.H.; Karaman, C.; Orooji, Y.; Show, P.L. A critical review on various remediation approaches for heavy metal contaminants removal from contaminated soils. Chemosphere 2021, 287, 132369. [Google Scholar] [CrossRef]
- Xu, D.M.; Fu, R.B.; Wang, J.X.; Shi, Y.X.; Guo, X.P. Chemical stabilization remediation for heavy metals in contaminated soils on the latest decade: Available stabilizing materials and associated evaluation methods—A critical review. J. Clean. Prod. 2021, 321, 128730. [Google Scholar] [CrossRef]
- Makarova, A.S.; Yarovaya, O.V.; Fedoseev, A.N.; Yakubovich, L.M. Development of a technology for immobilizing mercury in solid mercury-containing wastes. Clean. Eng. Technol. 2020, 1, 100030. [Google Scholar] [CrossRef]
- Aghaei, E.; Alorro, R.D.; Tadesse, B.; Browner, R. A review on current practices and emerging technologies for sustainable management, sequestration and stabilization of mercury from gold processing streams. J. Environ. Manag. 2019, 249, 109367. [Google Scholar] [CrossRef]
- Wang, M.M.; Zhu, Y.; Cheng, L.R.; Andserson, B.; Zhao, X.H.; Wang, D.Y.; Ding, A.Z. Review on utilization of biochar for metal-contaminated soil and sediment remediation. J. Environ. Sci. 2018, 63, 156–173. [Google Scholar] [CrossRef]
- Xie, X.F.; Zhang, Z.H.; Chen, Z.K.; Wu, J.Y.; Li, Z.L.; Zhong, S.P.; Liu, H.; Xu, Z.F.; Liu, Z.L. In-situ preparation of zinc sulfide adsorbent using local materials for elemental mercury immobilization and recovery from zinc smelting flue gas. Chem. Eng. J. 2022, 429, 132115. [Google Scholar] [CrossRef]
- Donatello, S.; Fernández-Jiménez, A.; Palomo, A. An assessment of mercury immobilisation in alkali activated fly ash (AAFA) cements. J. Haz. Mat. 2012, 213–214, 207–215. [Google Scholar] [CrossRef] [PubMed]
- Xiong, Z.; He, F.; Zhao, D.Y.; Barnett, M.O. Immobilization of mercury in sediment using stabilized iron sulfide nanoparticles. Water Res. 2009, 43, 5171–5179. [Google Scholar] [CrossRef] [PubMed]
- Liu, Y.H.; Chen, H.Q.; Zhu, N.L.; Zhang, J.; Li, Y.F.; Xu, D.D.; Gao, Y.X.; Zhao, J.T. Detection and remediation of mercury contaminated environment by nanotechnology: Progress and challenges. Environ. Pollut. 2022, 293, 118557. [Google Scholar] [CrossRef] [PubMed]
- Han, Y.-S.; Kim, S.-H.; Chon, C.-M.; Kwon, S.; Kim, J.G.; Choi, H.W.; Ahn, J.S. Effect of FeS on mercury behavior in mercury-contaminated stream sediment: A case study of Pohang Gumu Creek in South Korea. J. Hazard. Mater. 2020, 393, 122373. [Google Scholar] [CrossRef] [PubMed]
- Otunola, B.O.; Ololade, O.O. A review on the application of clay minerals as heavy metal adsorbents for remediation purposes. Environ. Technol. Innov. 2020, 18, 100692. [Google Scholar] [CrossRef]
- Wang, Y.; He, T.R.; Yin, D.L.; Han, Y.X.; Zhou, X.; Zhang, G.; Tian, X. Modified clay mineral: A method for the remediation of the mercury-polluted paddy soil. Ecotoxicol. Environ. Saf. 2020, 204, 111121. [Google Scholar] [CrossRef]
- Wang, Z.X.; Zhang, Z.J.; Xia, L.; Farías, M.E.; Sánchez, R.M.T.; Belfiore, C.; Montes, M.L.; Tian, X.; Chen, J.H.; Song, S.X. Sulfate induced surface modification of Chlorella for enhanced mercury immobilization. J. Environ. Chem. Eng. 2022, 10, 108156. [Google Scholar] [CrossRef]
- Huang, P.C.; Yang, W.C.; Johnson, V.E.; Si, M.Y.; Zhao, F.P.; Liao, Q.; Su, C.Q.; Yang, Z.H. Selenium-sulfur functionalized biochar as amendment for mercury-contaminated soil: High effective immobilization and inhibition of mercury re-activation. Chemosphere 2022, 306, 135552. [Google Scholar] [CrossRef]
- Zhao, B.; O’Connor, D.; Shen, Z.T.; Tsang, D.C.W.; Rinklebe, J.; Hou, D.Y. Sulfur-modified biochar as a soil amendment to stabilize mercury pollution: An accelerated simulation of long-term aging effects. Environ. Pollut. 2020, 264, 114687. [Google Scholar] [CrossRef]
- Cho, J.H.; Eom, Y.; Lee, T.G. Pilot-test of the calcium sodium phosphate (CNP) process for the stabilization/solidification of various mercury-contaminated wastes. Chemosphere 2014, 117, 374–381. [Google Scholar] [CrossRef]
- Wang, J.X.; Xing, Y.; Xie, Y.Y.; Meng, Y.; Xia, J.C.; Feng, X.B. The use of calcium carbonate-enriched clay minerals and diammonium phosphate as novel immobilization agents for mercury remediation: Spectral investigations and field applications. Sci. Total Environ. 2019, 646, 1615–1623. [Google Scholar] [CrossRef]
- He, L.Z.; Meng, J.; Wang, Y.; Tang, X.J.; Liu, X.M.; Tang, C.X.; Ma, L.Q.; Xu, J.M. Attapulgite and processed oyster shell powder effectively reduce cadmium accumulation in grains of rice growing in a contaminated acidic paddy field. Ecotoxicol. Environ. Saf. 2021, 209, 111840. [Google Scholar] [CrossRef]
- Fernández-Ondoño, E.; Bacchetta, G.; Lallena, A.M.; Navarro, F.B.; Ortiz, I.; Jiménez, M.N. Use of BCR sequential extraction procedures for soils and plant metal transfer predictions in contaminated mine tailings in Sardinia. J. Geochem. Explor. 2017, 172, 133–141. [Google Scholar] [CrossRef]
- Pérez-Moreno, S.M.; Gázquez, M.J.; Pérez-López, R.; Bolivar, J.P. Validation of the BCR sequential extraction procedure for natural radionuclides. Chemosphere 2018, 198, 397–408. [Google Scholar] [CrossRef]
- Ji, Y.N.; Wang, N.; Xu, Y.M.; Wang, R.L.; Sun, Y.B. Effect of inorganic-organic compound mixtures on the immobilization remediation of Cd contaminated soil. Environ. Chem. 2017, 36, 2333–2340. [Google Scholar]
- Wang, Y.G.; Liu, J.J.; Li, Y.X.; Liang, M.A. Effective factors of urease activities in soil by using the phenol-sodium hypochlorite colorimetric method. Chinese. J. Soil Sci. 2019, 50, 1166–1170. [Google Scholar]
- Gu, Y.; Wang, P.; Kong, C.H. Urease, invertase, dehydrogenase and polyphenoloxidase activities in paddy soil influenced by allelopathic rice variety. Eur. J. Soil Biol. 2009, 45, 436–441. [Google Scholar] [CrossRef]
- GB 2762-2017; National Food Safety Standard—Limit of Pollutants in Food. National Medical Products Administration: Beijing, China, 2017.
- Zuber, S.M.; Villamil, M.B. Meta-analysis approach to assess effect of tillage on microbial biomass and enzyme activities. Soil Biol. Biochem. 2016, 97, 176–187. [Google Scholar] [CrossRef] [Green Version]
- Zhang, X.Y.; Dong, W.Y.; Dai, X.Q.; Schaeffer, S.; Yang, F.T.; Radosevich, M.; Xu, L.L.; Liu, X.Y.; Sun, X.M. Response of absolute and specific soil enzyme activities to long term additions of organic and mineral fertilizer. Sci. Total Environ. 2015, 536, 59–67. [Google Scholar] [CrossRef]
- Natasha; Shahid, M.; Khalid, S.; Bibi, I.; Bundschuh, J.; Niazi, N.K.; Dumat, C. A critical review of mercury speciation, bioavailability, toxicity and detoxification in soil-plant environment: Ecotoxicology and health risk assessment. Sci. Total Environ. 2020, 711, 134749. [Google Scholar] [CrossRef]
- Khan, Z.; Fan, X.T.; Khan, M.N.; Khan, M.A.; Zhang, K.K.; Fu, Y.Q.; Shen, H. The toxicity of heavy metals and plant signaling facilitated by biochar application: Implications for stress mitigation and crop production. Chemosphere 2022, 308, 136466. [Google Scholar] [CrossRef] [PubMed]
- Ali, A.; Guo, D.; Jeyasundar, P.G.S.A.; Li, Y.; Xiao, R.; Du, J.; Li, R.H.; Zhang, Z.Q. Application of wood biochar in polluted soils stabilized the toxic metals and enhanced wheat (Triticum aestivum) growth and soil enzymatic activity. Ecotoxicol. Environ. Saf. 2019, 184, 109635. [Google Scholar] [CrossRef]
- O’Connor, D.; Peng, T.Y.; Li, G.H.; Wang, S.X.; Duan, L.; Mulder, J.; Cornelissen, G.; Cheng, Z.L.; Yang, S.H.; Hou, D.Y. Sulfur-modified rice husk biochar: A green method for the remediation of mercury contaminated soil. Sci. Total Environ. 2018, 621, 819–826. [Google Scholar] [CrossRef] [PubMed]
- Moreroa-Monyelo, M.; Falayi, T.; Ntuli, F.; Magwa, N. Studies towards the adsorption of sulphate ions from acid mine drainage by modified attapulgite clays. S. Afr. J. Chem. Eng. 2022, 42, 241–254. [Google Scholar] [CrossRef]
- Xu, C.B.; Qi, J.; Yang, W.J.; Chen, Y.; Yang, C.; He, Y.L.; Wang, J.; Lin, A.J. Immobilization of heavy metals in vegetable-growing soils using nano zero-valent iron modified attapulgite clay. Sci. Total Environ. 2019, 686, 476–483. [Google Scholar] [CrossRef]
- Yang, J.; Gao, X.H.; Li, J.; Zuo, R.; Wang, J.S.; Song, L.T.; Wang, G.Q. The stabilization process in the remediation of vanadium-contaminated soil by attapulgite, zeolite and hydroxyapatite. Ecol. Eng. 2020, 156, 105975. [Google Scholar] [CrossRef]
- Gong, H.B.; Zhao, L.; Rui, X.; Hu, J.W.; Zhu, N.W. A review of pristine and modified biochar immobilizing typical heavy metals in soil: Applications and challenges. J. Haz. Mat. 2022, 432, 128668. [Google Scholar] [CrossRef]
- Zhao, W.; Cui, Y.T.; Sun, X.P.; Wang, H.Y.; Teng, X.H. Corn stover biochar increased edible safety of spinach by reducing the migration of mercury from soil to spinach. Sci. Total Environ. 2021, 758, 143883. [Google Scholar] [CrossRef]
- Li, X.X.; Zhang, X.; Wang, X.L.; Cui, Z.J. Phytoremediation of multi-metal contaminated mine tailings with Solanum nigrum L. and biochar/attapulgite amendments. Ecotoxicol. Environ. Saf. 2019, 180, 517–525. [Google Scholar] [CrossRef]
Figure 1.
Geographical location and the fieldwork site in the study area.
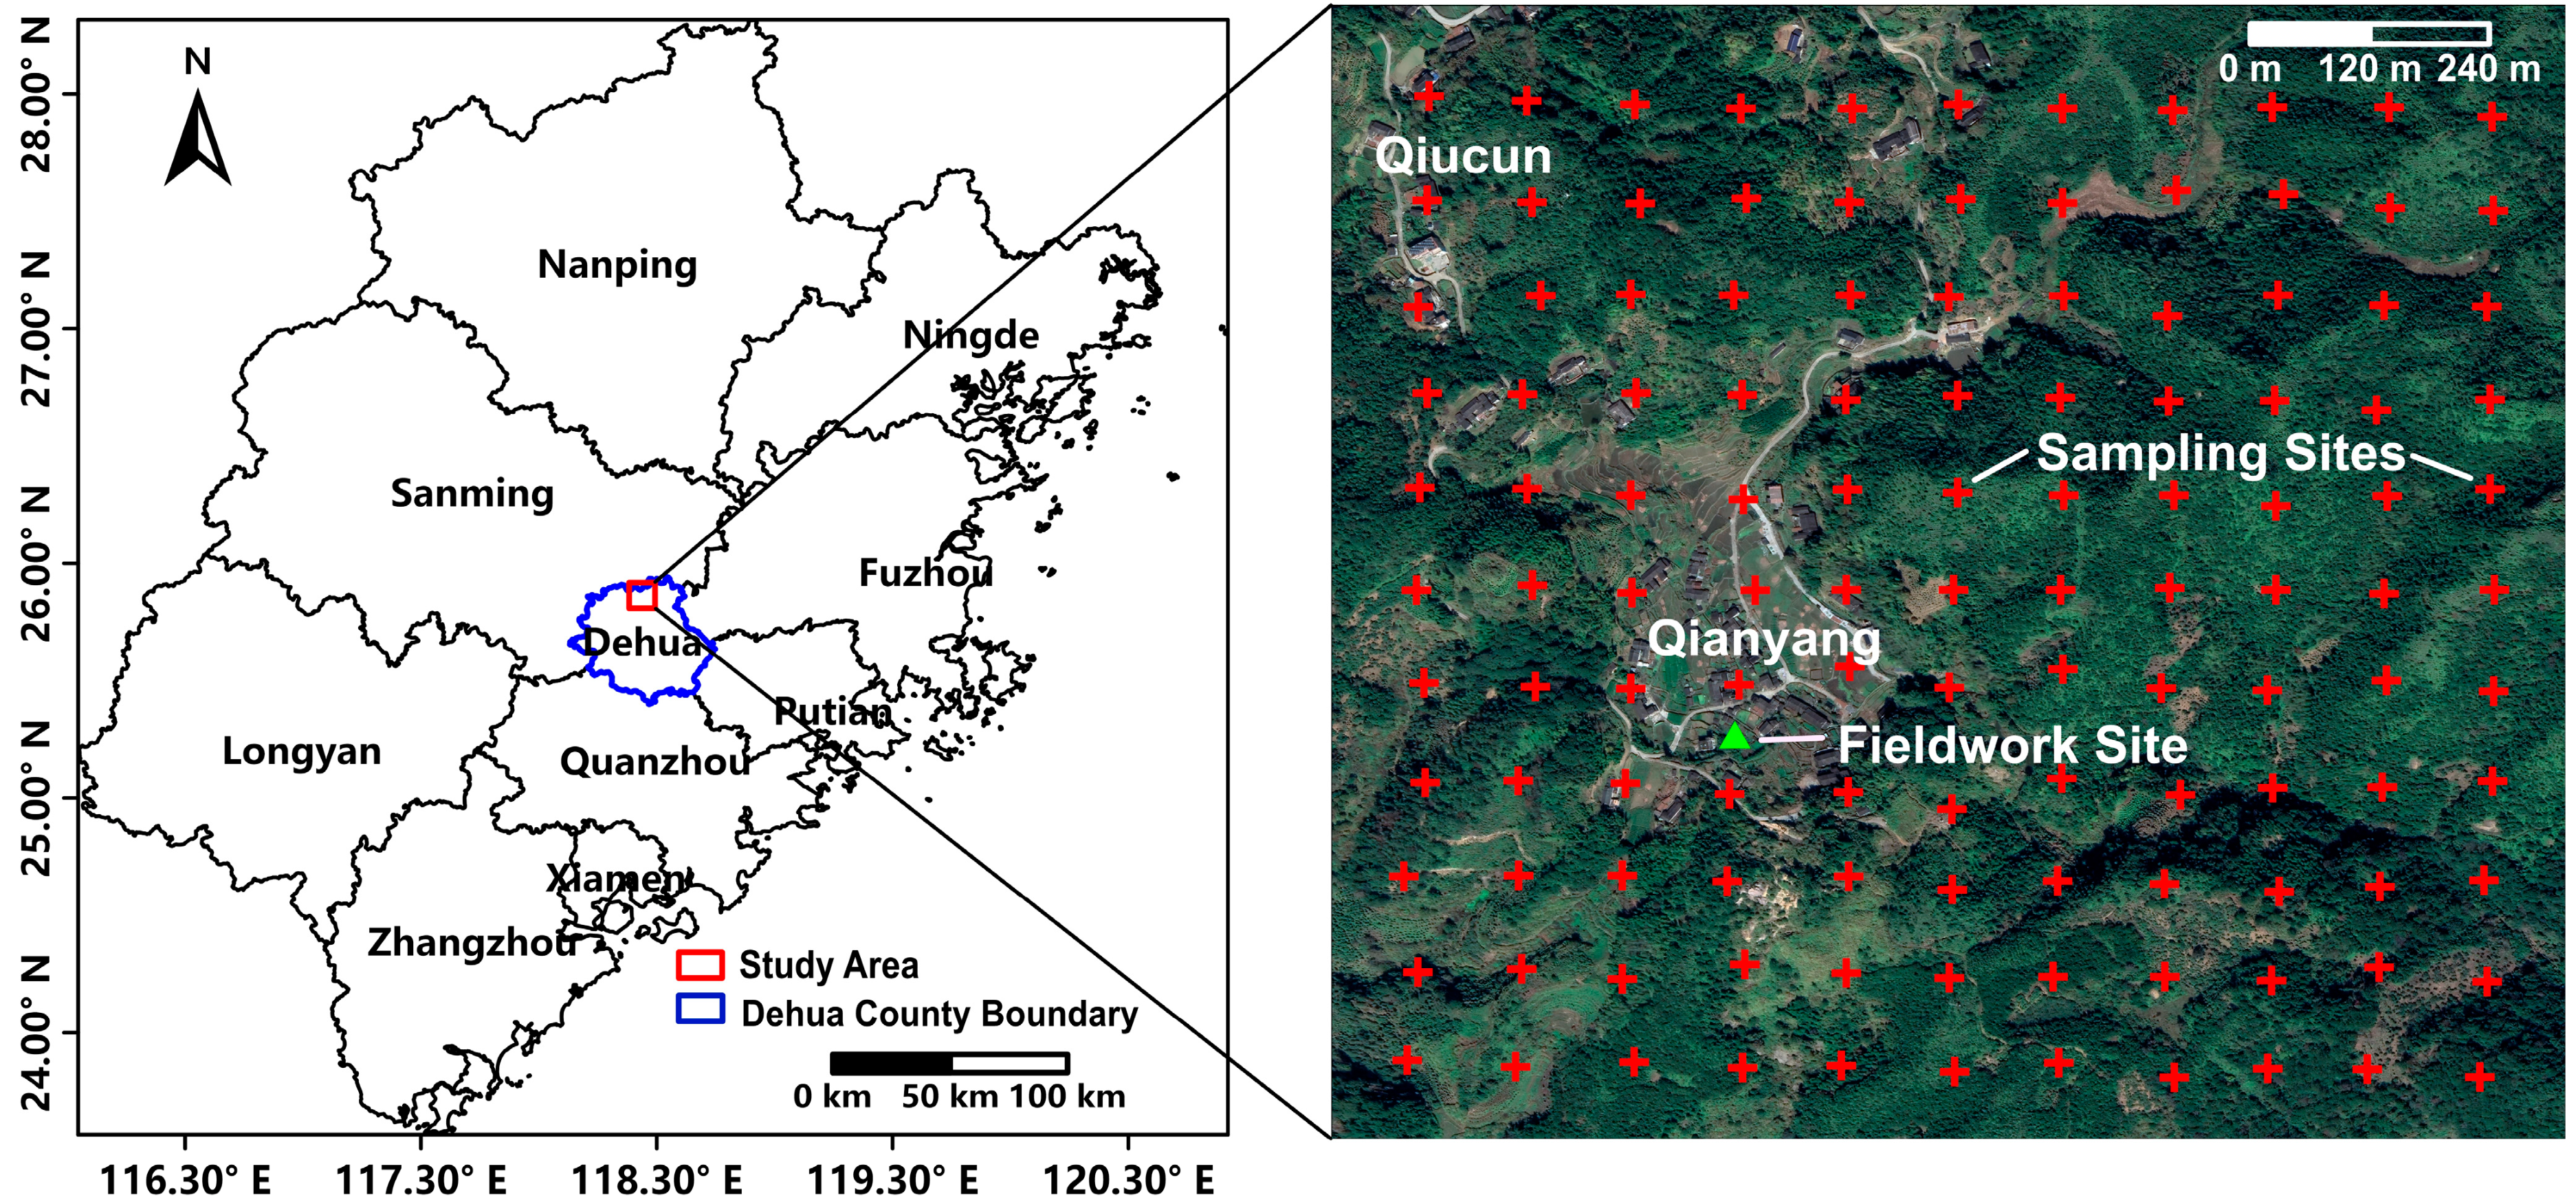
Figure 2.
Indicators (a) available Hg content in the soil; (b) Hg content in the water spinach; (c) dry weight of the water spinach under different treatments in the pot tests. The different lowercase letters indicate that there were significant differences among the treatments with different amendment application amounts (p < 0.05) for the same initial Hg concentration. The same lowercase letters indicate no significant difference at the level of p > 0.05.

Figure 3.
Stabilization effect (a) the reduction rate of the available Hg content in the soil (SE1); (b) the reduction rate of Hg content in the water spinach (SE2); (c) the growth rate of the dry weight of the water spinach (SE3). The different color areas indicate the changes in the SE1, SE2, and SE3 under the dual influence of the initial concentration of Hg in the soil and the amount of amendment added. The sequential transitions of the color from dark blue to light blue, white, light yellow, yellow, orange, and dark orange indicate a gradual increase in SE1, SE2, and SE3.

Figure 4.
The available Hg content in the soil in two consecutive years. The different lowercase letters indicate that there were significant differences among the treatments with different amendment application amounts (p < 0.05) for the same initial Hg concentration in the same year. The different capital letters indicate that there were significant differences among the treatments in different years (p < 0.05) for the same initial Hg concentration and the same amendment application amount.

Figure 5.
Proportion of Hg in each form in the soil in two consecutive years (a) the first year; and (b) the second year.
Figure 5.
Proportion of Hg in each form in the soil in two consecutive years (a) the first year; and (b) the second year.

Figure 6.
Hg content in the water spinach in two consecutive years. The different lowercase letters indicate that there were significant differences among the treatments with different amendment application amounts (p < 0.05) for the same initial Hg concentration in the same year. The different capital letters indicate that there were significant differences among the treatments in different years (p < 0.05) for the same initial Hg concentration and the same amendment application amount.

Figure 7.
The yield of the water spinach in two consecutive years. The same lowercase letters indicate that there were no significant differences among the treatments with different amendment application amounts (p > 0.05) for the same initial Hg concentration in the same year. The same capital letters indicate that there were no significant differences among the treatments in different years (p > 0.05) for the same initial Hg concentration and the same amendment application amount.
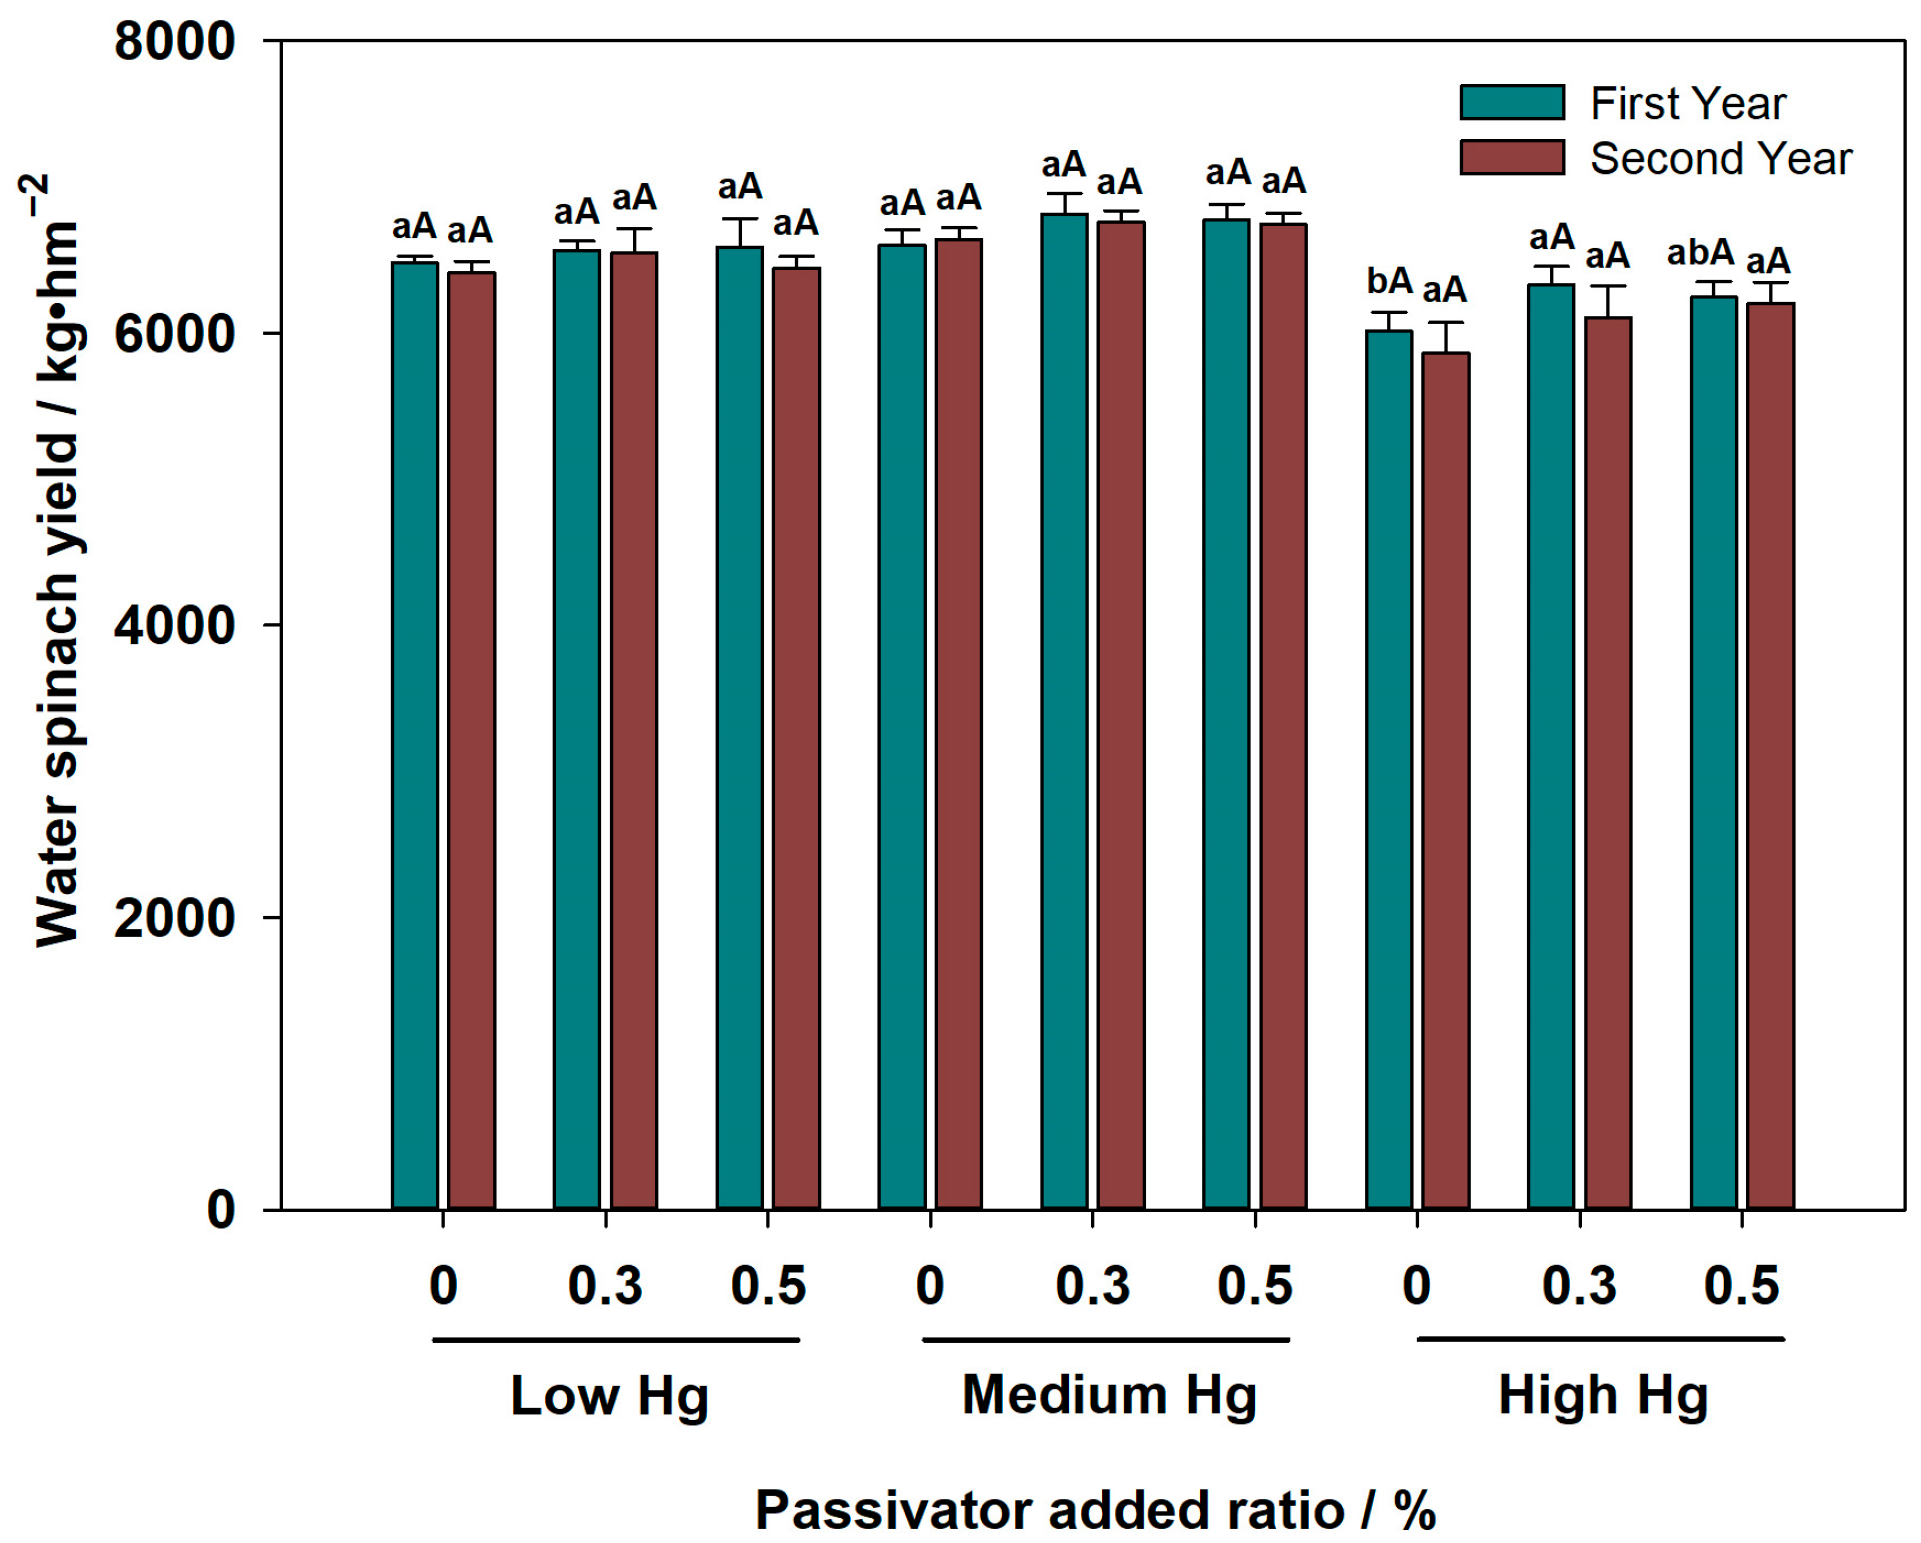
Figure 8.
Correlation analysis of various environmental factors. The color of the squares on the right represents the strength of positive and negative correlations among various environmental factors. The size of the squares represents the magnitude of the Spearman correlation coefficient. Ava, available Hg content in the soil; F1, exchangeable Hg content; F2, reducible Hg content; F3, oxidizable Hg content; F4, residual Hg content; CAT, catalase activity; URE, urease activity; INV, invertase activity; Abs, Hg content in the water spinach; Yield, water spinach yield.

Table 1.
Factor levels.
| Level | Factors | |||
|---|---|---|---|---|
| A (Amendment Type) | B (Amendment Added Ratio/%) | C (Initial Concentration of the Hg in the Soil/mg·kg−1) | D (Aging Time/d) | |
| 1 | Modified biochar | 0.5 | 3.85 | 30 |
| 2 | Modified Attapulgite | 1 | 8.97 | 60 |
| 3 | Biochar + Attapulgite | 2 | 18.4 | 90 |
| 4 | Modified biochar + Modified attapulgite | 3 | 28.7 | 120 |
Table 2.
Orthogonal experiment design.
| Test Number | Factors | Test Group | ||||
|---|---|---|---|---|---|---|
| A (Amendment Type) | B (Amendment Added Ratio/%) | C (Initial Concentration of the Hg in the Soil/mg·kg−1) | D (Aging Time/d) | E (Null Columns) | ||
| T1 | 1 | 1 | 1 | 1 | 1 | A1B1C1D1 |
| T2 | 1 | 2 | 2 | 2 | 2 | A1B2C2D2 |
| T3 | 1 | 3 | 3 | 3 | 3 | A1B3C3D3 |
| T4 | 1 | 4 | 4 | 4 | 4 | A1B4C4D4 |
| T5 | 2 | 1 | 2 | 3 | 4 | A2B1C2D3 |
| T6 | 2 | 2 | 1 | 4 | 3 | A2B2C1D4 |
| T7 | 2 | 3 | 4 | 1 | 2 | A2B3C4D1 |
| T8 | 2 | 4 | 3 | 2 | 1 | A2B2C1D3 |
| T9 | 3 | 1 | 3 | 4 | 2 | A3B1C3D4 |
| T10 | 3 | 2 | 4 | 3 | 1 | A3B2C4D3 |
| T11 | 3 | 3 | 1 | 2 | 4 | A3B3C1D2 |
| T12 | 3 | 4 | 2 | 1 | 3 | A3B4C2D1 |
| T13 | 4 | 1 | 4 | 2 | 3 | A4B1C4D2 |
| T14 | 4 | 2 | 3 | 1 | 4 | A4B2C3D1 |
| T15 | 4 | 3 | 2 | 4 | 1 | A4B3C2D4 |
| T16 | 4 | 4 | 1 | 3 | 2 | A4B4C1D3 |
Table 3.
Stabilization orthogonal experiment results.
| Test Number | Factor | SE1/% | ||||
|---|---|---|---|---|---|---|
| A (Amendment Type) | B (Amendment Added Ratio/%) | C (Initial Concentration of the Hg in the Soil/mg·kg−1) | D (Aging Time/d) | E (Null Columns) | ||
| T1 | 1 | 1 | 1 | 1 | 1 | 30.7 ± 1.61 |
| T2 | 1 | 2 | 2 | 2 | 2 | 34.8 ± 1.93 |
| T3 | 1 | 3 | 3 | 3 | 3 | 27.6 ± 2.62 |
| T4 | 1 | 4 | 4 | 4 | 4 | 20.5 ± 2.52 |
| T5 | 2 | 1 | 2 | 3 | 4 | 42.5 ± 3.25 |
| T6 | 2 | 2 | 1 | 4 | 3 | 33.2 ± 2.40 |
| T7 | 2 | 3 | 4 | 1 | 2 | 24.3 ± 2.26 |
| T8 | 2 | 4 | 3 | 2 | 1 | 24.2 ± 0.95 |
| T9 | 3 | 1 | 3 | 4 | 2 | 35.7 ± 1.61 |
| T10 | 3 | 2 | 4 | 3 | 1 | 29.1 ± 2.07 |
| T11 | 3 | 3 | 1 | 2 | 4 | 26.3 ± 1.45 |
| T12 | 3 | 4 | 2 | 1 | 3 | 29.7 ± 2.70 |
| T13 | 4 | 1 | 4 | 2 | 3 | 32.5 ± 1.92 |
| T14 | 4 | 2 | 3 | 1 | 4 | 33.4 ± 1.57 |
| T15 | 4 | 3 | 2 | 4 | 1 | 37.6 ± 2.46 |
| T16 | 4 | 4 | 1 | 3 | 2 | 35.5 ± 3.06 |
| k1 | 28.4 | 35.4 | 31.4 | 29.5 | 30.4 | |
| k2 | 31.1 | 32.6 | 36.2 | 29.4 | 32.6 | |
| k3 | 30.2 | 29.0 | 30.2 | 33.7 | 30.8 | |
| k4 | 34.8 | 27.5 | 26.6 | 31.2 | 30.7 | |
| R | 6.35 | 7.88 | 9.55 | 4.23 | 2.18 | |
| Order of factors | C > B > A > D | |||||
| Superior level | A4 | B1 | C2 | D3 | ||
k1, k2, k3, and k4 are the average SE1 of each factor at the same level, respectively, n = 4; R is the maximum k minus the minimum k for each factor.
Table 4.
Variance analysis of stabilization orthogonal experiment.
| Factor | Deviation Sum of Squares | Degree of Freedom | Mean Square | F Value | p Value | Significance |
|---|---|---|---|---|---|---|
| A | 85.700 | 3 | 28.567 | 7.217 | 0.069 | * |
| B | 152.605 | 3 | 50.868 | 12.851 | 0.032 | ** |
| C | 186.495 | 3 | 62.165 | 15.705 | 0.024 | ** |
| D | 49.025 | 3 | 16.342 | 4.128 | 0.137 | |
| Error | 11.875 | 3 | 3.958 |
** indicates a more significant impact on the test results at the level of p < 0.05; * indicates a significant impact on the test results at the level of p < 0.1.
Table 5.
Soil enzyme activities in two consecutive years.
| Initial Concentration of Hg in Soil/mg·kg−1 | Amendment Added Ratio/% | CAT/mL·g−1 | URE/mg·g−1 | INV/mg·g−1 | |||
|---|---|---|---|---|---|---|---|
| First Year | Second Year | First Year | Second Year | First Year | Second Year | ||
| L | CK | 1.24 ± 0.10 bA | 1.20 ± 0.07 bA | 1.34 ± 0.05 bA | 1.21 ± 0.21 bA | 7.87 ± 1.56 bA | 7.54 ± 1.23 bA |
| 0.3 | 1.74 ± 0.23 aA | 1.54 ± 0.14 aA | 1.91 ± 0.08 aA | 1.61 ± 0.14 aA | 11.4 ± 0.96 aA | 9.92 ± 1.22 aA | |
| 0.5 | 1.63 ± 0.15 aA | 1.37 ± 0.14 abA | 1.87 ± 0.09 aA | 1.47 ± 0.10 abA | 10.7 ± 0.56 aA | 9.43 ± 0.81 abA | |
| M | CK | 1.08 ± 0.13 bA | 1.02 ± 0.30 aA | 1.14 ± 0.09 bB | 1.26 ± 0.13 bA | 6.27 ± 0.54 bA | 6.34 ± 1.03 aA |
| 0.3 | 1.54 ± 0.21 aA | 1.33 ± 0.12 aA | 1.76 ± 0.11 aA | 1.73 ± 0.11 aA | 9.32 ± 0.78 aA | 8.37 ± 1.32 aA | |
| 0.5 | 1.48 ± 0.20 aA | 1.25 ± 0.14 aA | 1.69 ± 0.28 aA | 1.54 ± 0.15 aB | 9.04 ± 0.26 aA | 7.83 ± 0.83 aA | |
| H | CK | 0.95 ± 0.11 bA | 0.87 ± 0.15 aA | 0.66 ± 0.09 aA | 0.54 ± 0.12 aB | 4.61 ± 1.34 aA | 4.43 ± 0.68 aA |
| 0.3 | 1.22 ± 0.15 aA | 1.06 ± 0.11 aA | 0.85 ± 0.07 aA | 0.68 ± 0.08 aA | 5.80 ± 0.88 aA | 5.11 ± 0.69 aA | |
| 0.5 | 1.20 ± 0.14a bA | 0.97 ± 0.12 aA | 0.88 ± 0.27 aA | 0.63 ± 0.15 aA | 6.00 ± 0.90 aA | 5.40 ± 0.49 aA | |
The different lowercase letters indicate that there were significant differences among the treatments with different amendment application amounts (p < 0.05) for the same initial Hg concentration in the same year. The different capital letters indicate that there were significant differences among the treatments in different years (p < 0.05) for the same initial Hg concentration and the same amendment application amount.
Disclaimer/Publisher’s Note: The statements, opinions and data contained in all publications are solely those of the individual author(s) and contributor(s) and not of MDPI and/or the editor(s). MDPI and/or the editor(s) disclaim responsibility for any injury to people or property resulting from any ideas, methods, instructions or products referred to in the content. |
© 2023 by the authors. Licensee MDPI, Basel, Switzerland. This article is an open access article distributed under the terms and conditions of the Creative Commons Attribution (CC BY) license (https://creativecommons.org/licenses/by/4.0/).
Share and Cite
MDPI and ACS Style
Wang, R.; Chen, N.; Liu, G.; Ding, J.; Chen, M.; Zhang, J. Persistence of Hg-Contaminated Soil Stabilization in Typical Areas of Dehua County, Fujian Province, China. Sustainability 2023, 15, 1018. https://doi.org/10.3390/su15021018
AMA Style
Wang R, Chen N, Liu G, Ding J, Chen M, Zhang J. Persistence of Hg-Contaminated Soil Stabilization in Typical Areas of Dehua County, Fujian Province, China. Sustainability. 2023; 15(2):1018. https://doi.org/10.3390/su15021018
Chicago/Turabian StyleWang, Rui, Nan Chen, Guannan Liu, Jianhua Ding, Ming Chen, and Jiawen Zhang. 2023. "Persistence of Hg-Contaminated Soil Stabilization in Typical Areas of Dehua County, Fujian Province, China" Sustainability 15, no. 2: 1018. https://doi.org/10.3390/su15021018
Note that from the first issue of 2016, this journal uses article numbers instead of page numbers. See further details here.