Article

Investigating the Determinants of Financial Inclusion in BRICS Economies: Panel Data Analysis Using Fixed-Effect and Cross-Section Random Effect

School of Humanities and Social Science, Thapar Institute of Engineering and Technology, Patiala 147001, India
*
Author to whom correspondence should be addressed.
Sustainability 2023, 15(2), 1603; https://doi.org/10.3390/su15021603
Submission received: 25 December 2022 / Revised: 8 January 2023 / Accepted: 9 January 2023 / Published: 13 January 2023

Abstract

:
The current research empirically analyses the determinants of financial inclusion (FI) for BRICS (Brazil, Russia, India, China and South Africa) nations using the no. of depositors and Automated Teller Machines/user as dependent variables, a proxy for FI from 2004 to 2019. The study employs fixed-effect, cross-section random-effect and simple panel least square techniques to determine FI for different BRICS countries. The empirical findings of fixed effect and cross-section random highlight that population and internet users affirmatively and significantly influence FI. Simple panel least square analysis indicates that domestic credit to the finance sector, population, internet users and bank branches positively influence the no. of depositors in these economies. Gross domestic product (GDP) and domestic credit to private sector (DCPS) inversely affected FI. Results of the second measure of FI (ATM per user) show the exchange rate of domestic credit to the private sector, and GDP positively influences FI. These findings will induce policymakers to take corrective actions by considering the significant factors to boost FI in respective BRICS economies.

1. Introduction

Access to financial goods and services smoothly among individuals on a global level is recognized as a chief constraint for economic and social development. For sustainable long-term economic growth, financial inclusion (FI) has the utmost importance for policymakers. FI is gaining perceptible recognition around the globe due to its indispensability for socio-economic development. Many empirical studies have revealed that FI plays a pivotal part in lowering income gaps, helping to slash poverty, and assisting in the smooth consumption of economic goods and services [1,2,3]. FI ensures the affordability, convenience and accessibility of financial goods and services to all [4]. The G-20 Summit in 2019 recognized FI as playing an integral role in inclusive development across the globe. Thus, financial institutions and development banks are focusing on promoting FI to ensure inclusive growth.
Demirgüc-Kunt and Klapper [5] have examined FI via the World Bank’s Global Findex database, covering 148 countries. The results revealed that FI is influenced by bank credit, savings bank accounts, and account ownership. Luring researchers from developed and developing economies, FI studies are gaining momentum. Ghosh [6] has found that promoting development through FI is highly beneficial for the economy. Likewise, Cull, Demirgüc-Kunt, and Lyman [7] have also supported the impact of FI on financial stability. Kim, Yu, and Hassan [8] have also supported its role in economic growth. Regarding factors influencing FI, Ozili [9] illustrated innovation in banking services and technology infrastructure as stimulants of FI. Consequently, Mitchell and Scott [10] link FI with an increase in public revenue in a study based on the Argentinian economy. The government of Argentina used FI to connect people with the financial system and reported an increase in ATM usage and credit. Correspondingly, branch bank networking, the number of depositors, and the number of credit facilitators emerged as contributing to FI in India [11].
Zins and Weill [12] covered the FI of 37 African countries and supported that access to banking and credit facility improved economic growth. Comparably, Internet penetration and mobile services in Africa enabled and improved accessibility to essential financial services [13]. This was further supported by Allen et al. [14], suggesting that innovative financial products and services helped many African regions to overcome infrastructural difficulties while enhancing their access. Fungacova and Weill [15] reiterated that greater use of formal accounts and savings helped China, with higher inclusiveness than other BRICS nations. Apart from this, the internet facility and growth of innovative fintech products and services have increased due to digitization in China, and the government encouraged web-based services to promote inclusion in the economy [16].
While the influence of FI on development has been thoroughly documented in previous research, macroeconomic effects on FI have not been significantly investigated. However, not many academics and researchers have shed light on the significance of domestic credit given by banks to the private sector, domestic credit provided by the financial sector (DCFS), exchange rates, inflation, bank branches, population, GDP and internet users in promoting FI in BRICS countries. Against the above backdrop, this research has focused on FI in BRICS nations. Therefore, the current study, by focusing on two major issues, makes an earnest attempt to fill the gaps in the existing literature:
RQ1: Which macroeconomic factors assist in achieving financial inclusion in the BRICS countries?
RQ2: Does any positive relationship exist between financial inclusion and macroeconomic factors in these countries?
The BRICS are an intriguing set of nations for investigating these issues, since all of the BRICS nations have selected a financial inclusion strategy as their main objective for inclusive growth. FI is a crucial element of financial development in terms of supporting the financial industry and institutions. It is also thought to be very important for fostering economic development [17]. Thus, FI may be a mitigating factor for BRICS nations which are striving to improve their living standards by raising levels of inclusiveness [18]. These nations are also undertaking financial sector reforms at a high pace. Thus, understanding which macroeconomic factors influence FI is a major concern in this paper.
This research’s basic objective is to understand the contributing factors of FI in the BRICS region. The empirical study focuses on determinants responsible for achieving inclusion in BRICS economies. The study initially examines the level of FI in BRICS nations, as these are emerging economies having high growth. This research is intended to contribute in the following way. First, it identifies the determinants of FI, and second, it analyses the impact of FI on BRICS regions. Diversely, our findings have direct policy implications for determinants of FI in the BRICS region.

Theoretical Underpinning: The Intersection of FI and Economic Growth

Several studies have empirically examined FI, and some researchers have also concluded that FI is affirmatively related to economic growth [19,20]. Earlier studies have covered different perspectives of FI. FI provides access to financial services [21,22,23,24]. FI promotes financial goods/services, assists in the timely access of financial products, and helps to expand its usage to all segments of society [25,26]. Theoretically, the primary function of financial markets and institutions is to promote coordination and lower transaction costs. Other fundamental theories revolve around flaws in the capital market, such as information asymmetry and transaction costs. As a result of flaws in the market, underprivileged people and small businesses lacking collateral, credit histories, and connections may find it difficult to obtain the resources they need to grow. As a result of this, they have few opportunities, which aggravates poverty and inequalities. Galor and Zeira [27] suggest that financial market frictions are the reason why impoverished people do not invest in their education. These theories suggest that a lack of financial access causes income disparity and poverty traps, and reduces economic development. Claessens [28] has classified access to financial services, such as deposits, credit, savings and loans, as common individuals’ basic necessities, which will be possible through FI. Thus, FI has become a prime objective for emerging countries’ policymakers to embed financially excluded populations into the formal financial system [29]. FI may be analyzed using New Keynesian and neoclassical theory. According to the neoclassical approach, small businesses and consumers are the primary economic actors, and are competitive, self-interested and possess all the knowledge required to make informed choices that would increase their well-being. Additionally, the public goods theories of FI suggest that everyone, irrespective of income level and status, should benefit from FI. Financial inclusiveness promotes sustainable development, wherein all sections of society, particularly the disadvantaged, access financial services at reasonable rates [30]. Researchers such as Pradhan [31], Lee and Wang [32] and ul et al. [33] support its positive relation with growth. A broad conceptual framework of determinants of FI and economic growth is depicted in Figure 1. The details of why these variables have been included, with the literature support, are provided in the next section through Table 1. The researchers are still working to produce a consistent method to measure FI. Additionally, two main routes theoretically support the link between FI and economic development. First, providing inexpensive financial services to the needy and disadvantaged will promote economic activity, national productivity, and welfare [34,35,36]. Second, the potential availability of deposits and insurance services to the unbanked would encourage the vulnerable to save in banks and non-bank financial institutions, facilitating money flow to the financial markets [37,38,39].
The major question that arises is how to measure FI. Is there a comprehensive measure of FI? It has been well accepted that FI is a multi-dimensional concept expanding beyond individual indicators, viz., bank account ratios or the no. of ATMs [40]. Like many earlier studies, the current study also relies on banking penetration, availability of banking services and usage [41,42]. Different studies project diverse dimensions, viz., the proportion of the adults having access to formal financial services, viz., bank accounts [43], savings, borrowings and risk management of adults [44]. FI is constructed by taking five dimensions, viz., ATMs, bank branches, borrowers, depositors and domestic credit/GDP. Based on the earlier literature, we will use the no. of ATMs/depositors as the measure for FI.
The next issue was to select the determinants of FI. Which macroeconomic factors may be included in the study? The predictors of FI vary from broad macroeconomic indicators, such as inflation, population, GDP and exchange rate, to bank branches or internet users. Other factors include domestic credit by the financial sector (DCFS) or domestic credit by a bank to the private sector (DCBPS). As the earlier literature majorly focused on using Fixed-Effect (FE) or Cross Section Random-Effect (RE), this study, too, is based on panel data analysis for all BRICS economies. The outcome would be helpful in the choice of model (Fixed-Effect—FE or Cross Section Random-Effect—CSRE). It is a sincere effort to unearth the determinants of FI for BRICS nations to help policymakers focus on the right dimensions.

2. Review of the Empirical Literature

Despite the wide variation, all BRICS nations have clearly highlighted the promotion of FI as their primary policy objective. An increasing corpus of empirical research demonstrates that FI has various beneficial implications on development outcomes in emerging countries such as BRICS. Eventually, economic development is better in economies with higher levels of FI since improved access to financial services enables the poor and other excluded groups to participate in entrepreneurial activity [45]. As is apparent from the literature, there is a link between the financial system and economic development. According to Schumpeter [46], the banking system plays a crucial role in economic growth. King and Levine [47] have found that a well-structured banking system with financial intermediation boosts economic growth and productivity. Similarly, McKinnon [48] and Goldsmith [49] also suggested that a systematically organized fund from banks to the public enhances financial development in an economy. FI has strongly influenced the minds of many economists and policymakers. Since the beginning of the 19th century, FI has gained much attention due to the increased financial exclusion of weaker sections of societies [50]. Rajan and Zingales [51] opined that the development of a nation directly and indirectly depends upon the progress of a financial system. Increased evidence suggests that financial knowledge [52], aversion to risk [53], knowledge of securities traded on the exchange, motives for saving, and trust in financial systems, play a positive role in a person’s decision to invest in the stock market. Chakrabarty [54] considers financial exclusion to be a stringent barrier to growth. Chibba [55] has supported the view that the inclusive system assists in managing poverty. Wait et al. [56] analyzed datasets from BRICS and non-BRICS developing nations to investigate how BRICS’ financial market openness led to greater growth. The results showed that, in the BRICS nations, larger levels of lending to the private sector and greater financial depth contributed more to financial inclusiveness. In general, the expansions of the banking sector and internet connections are complementary in fostering FI, which instigates economic growth. Guru and Yadav [57] have used financial intermediaries, credit-to-deposit ratio, and domestic credit to the private sector of BRICS nations as determinants to investigate the factors that influence FI. They found that all these factors positively and significantly influenced FI. Olaniyi and Adeoye [58] examined the factors of FI in Africa from 2005 to 2014. The results indicated that per capita income, GDP, literacy, internet access, and Islamic banking significantly influenced financial inclusion in Africa. According to Wang and Guan [59], other macroeconomic factors, such as financial depth and bank health status, were also significant determinants of a country’s level of FI.
However, Demirgüc-Kunt and Klapper [44] have used the Global Findex data base of 148 economies to measure the FI in these nations and revealed that almost half of the adults had their accounts in formal financial institutions through inclusiveness. The results also highlight that the main reasons for financial exclusion were escalated cost, distance, and lack of documentation. Further, it was pointed out that credit, savings, risk management and payment methods were also the constraint of FI in economies. Boukhatem [60] opined that money supply and bank credit not only improve the well-being of individuals but also encourage the growth of small entrepreneurs through a credit facility. Hence, they drive prospects to amass assets and support effortless consumption. The research used 67 countries’ data from 1988 to 2012 to investigate the level of FI. The results revealed that an enhancement of financial development spearheads inclusion. Thus, these are pointers relating to access to financial services, strongly related to FI. The low cost and high accessibility of the banking system increased the use of accounts. The simple documentation and low-free accounts motivate people to connect with the bank [14].
A strong reliance on financial institutions strengthens access. Apparently, Van der Werff et al. [61] have ascertained the link amid FI and social factors based on Global Findex data of 31 OECD nations. They suggested that increased confidence in government and formal financial institutions improved FI. Similarly, Sarma and Lenka [62] investigated the influence of FI on the Indian economy, considering the period from 1980 to 2014. Principal component analysis (PCA) has been applied for generating the FI index using an autoregressive distributed lag (ARDL) and error correction model (ECM). The findings indicate a positive association between FI and growth. Moreover, Sethi and Acharya [63], analyzing thirty-one economies through panel co-integration methods, also suggest that FI and economic growth are related in the long run.
Furthermore, by comparing data from the worldwide Findex database, Asuming, Osei-Agyei and Mohammed [64] examine FI in 31 Sub-Saharan African nations. They concluded that the overall level of financial inclusion improved considerably between 2011 and 2014. They found that the levels and rates of progress differ greatly amongst nations. According to their research, the determinants of FI include covariates at the individual level (age, education, wealth, and gender), macroeconomic factors (GDP growth rate and the number of financial institutions), and Business Freedom. FI has a positive externality on the economy because it allows for the more effective execution and transmission of monetary policy by allowing a bigger portion of the economy to participate in the formal financial system. Thus, greater financial inclusion enables interest rates to serve as a valuable policy instrument and enhances the process by which Central Banks may stabilize prices [65]. Beck and Cull [66] investigated Africa’s banking systems, especially those in Sub-Saharan Africa, and explored new financial innovations that have the potential to enhance classical African models. They demonstrated that the African financial system is weak, yet stable. Although African banks are adequately capitalized and liquid, they lend less to the private sector than the banks in other emerging nations. Additionally, the authors concluded that consumers and businesses do not use financial services as often, due to a lower level of inclusiveness.
Demirgüç-Kunt, Klapper and Singer [67] pointed out that the usage diversity and possession of an account was higher among rich, educated and employed persons. The Chinese economy demonstrated high FI because of education and trust in the formal banking system. Supporting this, Fungácová and Weill [15] also indicated that income and education enabled people in China to be more aware of the costs of financial products/services and enhanced their trust in the banking system. However, women had lower FI, primarily due to male dominance in account ownership and their lack of awareness of documentation procedures. Sophastienphong and Kulathunga [68] opined that financial development improved loan deposits in Sri Lanka. Sarma [69] conducted a study on 100 countries and indicated that FI has associated with three dimensions: bank penetration; service accessibility; and service usage. Bourainy, Salah and Sherif [70] analyzed the influence of FI on inflation rates in 37 developing countries from 2009 to 2018. Initially, Principal Component Analysis (PCA) was used to create a new multidimensional Financial Inclusion Index (FII) based on three dimensions (access, utilization, and quality of financial services), and the Generalized Method of Moments (GMM) was used to assess the impact of FI on the inflation rate empirically. The researchers found that higher FI has an effect on reducing inflation rates in emerging nations. These results suggest that policymakers in emerging nations regard FI as a strategy for lowering inflation rates. Mbutor and Uba [71] also investigated the influence of FI on monetary policy in the Nigerian economy for the period of 1980 to 2012. The findings supported that increased financial inclusion will enhance the efficacy of monetary policy because inflation would fall as the percentage of total loans rises.
Beck and Torre [72] have highlighted that access and usage to financial goods/services are of utmost importance in FI. Subsequently, Beck et al. [73], covering 99 nations, suggest that outreach of financial services improved the reach of the banking sector. In fact, the access to and usage of financial services are correlated. Access is related to the geographic and demographic dispersion of banks and ATMs. Usage is measured by credit and deposit accounts/capita, loan/income ratio and loan/deposit ratio. The quality of institutions and the accessibility of infrastructure also impacted financial services. Camara and Tuesta [40] have used three main dimensions of FI. The first dimension, viz., usage, consists of owning a minimum of one financial product, and possessing savings accounts and loans. This was followed by the next dimension, covering the barriers and obstacles of accessibility to financial services. The last aspect was insufficient documentation, affordability and trust in the banking system. Any country’s economic growth depends upon the development of the financial sector, as it invariably provides a wide array of financial services to all categories [74]. Academics agree that a nation’s financial structure significantly impacts the extent to which its citizens may participate in the financial system. Owen and Pereira [75] suggest that increased levels of competitive pressure may incentivize innovation and growth of financial services. This reduces the cost of these services, broadens the risk spectrum of individuals, and finally increases FI. Using creative financial instruments and developing new financial goods/services may be restricted by capital, stringency and banking activity limit, which impede financial inclusion [76]. Restricted demand and supply for financial services reflect the country’s socio-economic restrictions and macroeconomic vulnerabilities in terms of per capita income. Zhang and Wei [77]’s findings also indicate that increased policy uncertainty negatively affects business innovation. Due to policy uncertainty and instability, financial inclusion may be particularly crucial in the BRICS region.
Kpodar and Andrianaivo [78], in their study on African economies for the period 1988–2007, analyzed financial variables, such as the no. of depositors, loans/head, internet/user and population covering ICT impact on FI. The ICT indicators include mobile dissemination fees and call charges. Major findings support the invincible role of ICT in FI. Unlike conventional banking, which still relies on physical restrictions for the spread of business outlets, digital payments may significantly reduce financial exclusion [79]. Mobile phone developments encouraged digital access to financial services and injected growth into the economy. Evans [13] has also reiterated that the internet, mobile phones and FI are associated. The study was based on a modified OLS method and Granger causality. Sha’ban, Girardone and Sarkisyan [80] built a multidimensional financial inclusion index for a worldwide sample of 95 countries from 2004 to 2015. The data used were from the IMF’s Financial Access Survey. They found a positive and substantial relationship between FI and variables, including GDP per capita, employment rates, bank competitiveness, human development, government transparency, and internet penetration as well.
Lenka and Barik [81] evaluated how internet and mobile services influenced FI for SAARC nations for 2004–2014. The study revealed that internet facilities and mobile phones had a vital affirmative relation with FI. Sharma [82], using the VAR model and Granger causality, explored how FI is related to growth. The findings support an affirmative impact of FI on GDP. Granger causality analysis revealed a two-way link between growth and geographical outreach but a single-sided relation of the no. of deposits and loan accounts with GDP. Siddik [83] employed a fixed effects regression technique for the period 2004–2016 for SAARC nations, and the outcome supports a positive effect of FI on economic development. The findings indicate that the wide availability of financial services would increase total income and investments in businesses, and would lead to a decrease in the unemployment rate.
Thus, as evidenced by the literature, there are studies on FI in BRICS economies. However, they are relatively scarce and are based on a few variables. In view of this, it was decided to use the no. of depositors; ATM per user as dependent variables and a range of independent variables, viz., Bank Branches (BB); Gross Domestic Product (GDP); Exchange Rate (ER); Inflation Rate (INFL); Internet User (IU); Population (POP); Domestic credit provided by financial sector (DCFS); and Domestic credit provided by bank to private sector (DCBPS). An in-depth analysis was undertaken for BRICS economies to obtain a holistic picture of FI. Thus, on the basis of the literature review, the following hypotheses have been proposed:
H1a. 
Bank branches have a positive relation with number of depositors.
H1b. 
Bank branches have a positive relation with ATM per user.
H2a. 
GDP has a positive relation with number of depositors.
H2b. 
GDP has a positive relation with ATM per user.
H3a. 
Exchange rates have a positive relation with number of depositors.
H3b. 
Exchange rates have a positive relation with ATM per user.
H4a. 
Population has a positive relation with number of depositors.
H4b. 
Population has a positive relation with ATM per user.
H5a. 
Domestic credit provided by the bank to the private sector positively affects the number of depositors.
H5b. 
Domestic credit provided by the bank to the private sector positively affects ATM per user.
H6a. 
Domestic credit provided by the financial sector positively affects the number of depositors.
H6b. 
Domestic credit provided by the financial sector positively affects ATM per user.
H7a. 
Inflation rate has a positive relation with number of depositors.
H7b. 
Inflation rate has a positive relation with ATM per user.
H8a. 
Internet users have a positive relation with number of depositors.
H8b. 
Internet users have a positive relation with ATM per user.

3. Research Methodology

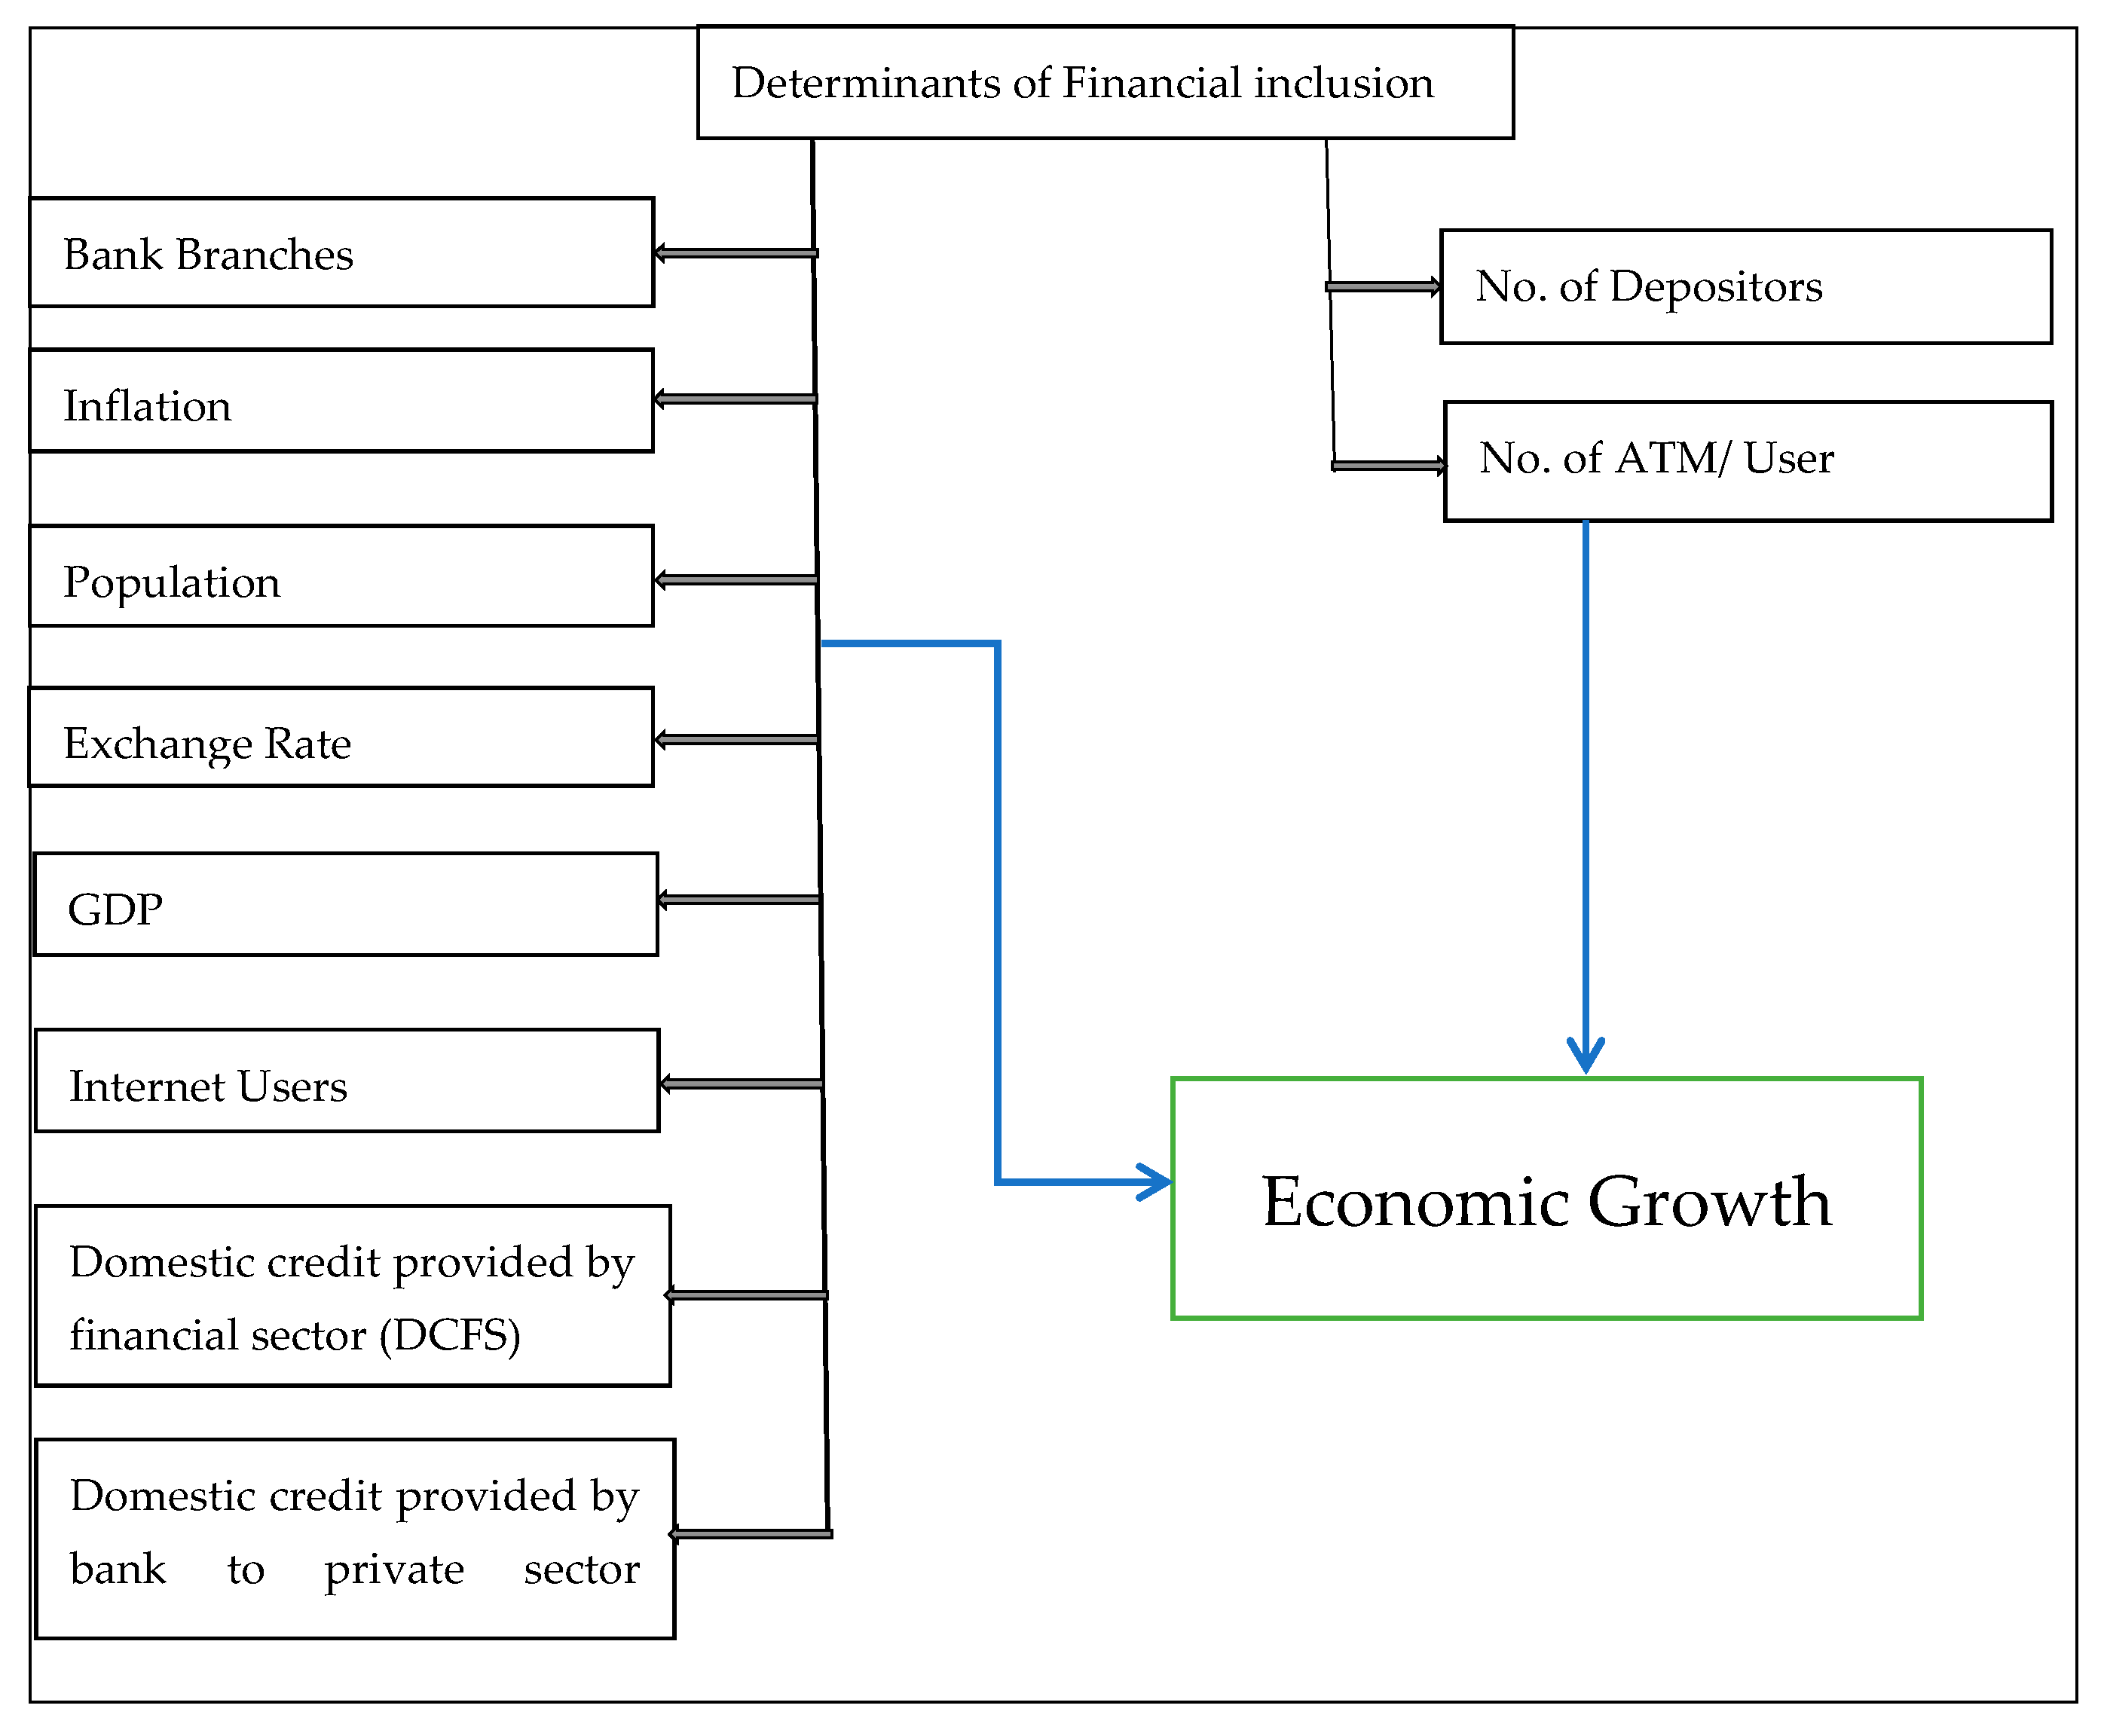
3.1. Description of Data

The current research analyses how growth parameters relate to FI for the BRICS economies. The study has used secondary data, choosing indicators of the FI index from the World Bank’s Global Findex database, IMF and balance sheets of BRICS banks. The panel data set consists of all five BRICS nations, covering 2005–2019. The currency value of all countries has been converted to USD. The two indicators used as dependent variables include depositors/1000 (DEPO) and ATM/user. Based on a few important studies, the independent variables selected are: BB; GDP; ER; IR: IU; PoP; DCFS and DCBPS. The indicators of the study, along with the literature support, are shown in Table 1. Kim et al. [8] included ATM/100,000; BB/100,000 adults and depositors/1000 as the measures of FI. ATMs offer impressive benefits, such as convenience, reduction in transaction costs and reduction of the workload of banks. GDP is the indicator used for economic growth as it is one of the most crucial factors influencing FI [82,84]. Domestic credit to the private sector is one of the indicators of FI which significantly affects economic growth [85], and has been included as an independent variable. Other indicators such as internet users [86], inflation rate [87] and population [84] have also been considered in the current research.
Table 1. Variable and references.
S.No.VariableDescriptionIndependent or DependentLiterature SupportSource of Data
1Depositors (DEPO)Natural logarithm of depositorsDependentBeck, Kunt and Peria [73], Kim et al. [8]World bank
database
2ATM per UserNo. of ATM/depositorsDependentMbutor and Uba [71], Chatterjee [86], Kim et al. [8]World bank
database
3Bank Branches (BB)Natural logarithm no. of bank branchesIndependentSarma [4,41,69] Kim et al. [8]World bank
database
4Gross Domestic Product (GDP)Natural logarithm of Gross Domestic ProductIndependentDabla-Norris et al. [88]. Chibba [55], Omar and Inaba [84]Global Findex
5Exchange Rate (ER)Exchange rate of USD of respective country’s currencyIndependentMbutor and Uba [71]Global Findex
6Inflation Rate (IR)Inflation rate in respective countryIndependentChatterjee [86], Lenka and Bairwa [89] Mbutor and Uba [71], Kim et al. [8]Global Findex
7Internet User (IU)Natural logarithm no. of internet user (IU)IndependentDurai and Stella [90], Bayar et al. [91]World bank
database
8.Population (PoP)Natural logarithm population in respective countryIndependentDavid et al. [92], Kim et al. [8]World bank
database
9.Domestic credit provided by financial sector (DCFS)Natural logarithm domestic credit provided by financial sector (DCFS)IndependentChauvet and Jacolin [93], King and Levine [47]Global Findex
10.Domestic credit provided by bank to private sector (DCBPS)Natural logarithm of domestic credit provided by bank to private sectorIndependentHannig and Jansen [94], Bhaskar [95]World bank
database
Source: Authors’ calculations.

3.2. Specification of Model

This section specifies an econometric model used to determine the key indicators influencing FI through a panel unit root test framework with fixed-effect (FE) and cross section random-effect (RE). The stationarity has been checked with unit root using the Levin–Lin–Chu test for pooled t-statistics [96]. The test maintains the equivalent substitute for the coefficient of the first serial correlation. The Im–Pesaran–Shin test, an extended version of Levin–Lin–Chu [97], was used along with augmented Dickey–Fuller (ADF) statistics. The ADF Fisher unit root test is used as a non-parametric test introduced by [98]. The last test, Phillips–Perron [99], has indeterminate auto-correlation and heteroscedasticity in the error term of the test equation. At the first stage, unit root tests were carried out to check the stationarity of the data series at a level. However, none of the variables were found to be stationary at level. Later, stationarity was checked at the first difference; again, the data series were not found to be stationary at the first difference. At last, stationarity was checked at the second difference, and data series of different variables were found stationary at the second difference. After that, the data series of all the independent and dependent variables were converted into a second difference. Then, model estimation was carried out using fixed effect and cross-section random effect.

3.3. Panel Unit Root Estimation Technique

The empirical results are obtained from the panel data approach. Unlike other studies, this research used many indicators for the FI index compared to the single indicator analysis usually undertaken. We employed a panel data model containing a set of fixed effect and cross-section random effects. Generally, panel are FE is used when we only want to analyze the influence of variables that diverge over a period of time. FE helps to discover the association between exogenous and endogenous variables in the country [100]. Each country has its own individual characteristics that might affect the exogenous or explanatory variables. While applying FE, accept that something within the single country influences the exogenous or endogenous variables are required to be controlled, relying on the association between the entity’s residual and explanatory variables. FE eliminates the influence of time-invariant descriptions and helps to evaluate the net result of the exogenous variable on the endogenous variable (Brandom, 2008; Kohler and Kreuter, 2009). The equation for the fixed effects model is:
  • Yit = αi + β1Xit + e………4αi (i = 1…n) is the intercept for each unit/country (n units/country-specific intercepts).
  • Yit: dependent variable (DV), with i (unit) and t (time)
  • Xit: one exogenous/explanatory variable.
  • β1: coefficient (exogenous variable)
  • e: error term

3.4. Panel Data Analysis with Cross-Section Random Effects (CSRE)

In panel data analysis CSRE, unlike the FE model, the deviations crossways units/countries are presumed to be accidental and uncorrelated with the predictors considered [100]. The vital difference between FE and RE is whether the individual effect exemplifies elements associated with the repressors, and not whether the effects are stochastic [101]. If dissimilarities across organizations/countries have some influence on the endogenous variable, then RE is recommended. In RE, we embrace time-invariant variables. On the other hand, in the FE model, variables are captivated by the intercept.
The random effects model:
Yit = α + βXit + uit + εit…………5
α: intercept; Yit: Endogenous variable; β: coefficient (exogenous variable); uit: Between organization/country error term; εit: within entry error.

4. Econometric Results

Table 2 represents panel unit root test outcomes. These tests have been performed in three ways, (i) without intercept and linear trends; (ii) with intercept; (iii) with intercept and linear trends. The outcome of Levin–Lin–Chu indicates that the data series of all, except inflation, are not stationary with a p-value > 0.05. Im–Pesaran–Shin outcomes for all except inflation do not highlight stationarity. The ADF test shows that the data series of all the variables at the level are non-stationary, as the p-value of all variables are >0.05. PP outcomes indicate that the data series of maximum variables are stationary with constant, with constant and linear trends. However, the data series of all the variables without intercept and linear trends do not highlight stationarity (p-value > 0.05). Overall, the panel unit root outcomes at the level show that the data series of all the variables do not depict stationarity. Later, the panel unit root tests were performed at first difference.
Table 3 Levin–Lin–Chu outcomes at first difference indicate that the data series of all the variables except inflation are not stationary. Im–Pesaran–Shin test outcomes point out that the data series of DCPFS, DCPSB, inflation and GDP are found to be stationary at first difference for levels with C and with constant and linear trends. The remaining variables of the data series do not indicate stationarity (p-value > 0.05). For the ADF test, the data series of variables except for depositors, no. of ATMs, exchange rate, population and ATM per user at three different levels, without C and T, with C, and with C and T are stationary. The test results of PP (Phillips and Perron, 1988) also show significant values at three different levels for all variables (p-value < 0.05). It means the data series of all these variables are stationary at the level. However, the data series of all variables are not found to be significant as per the different panel unit root tests used. Therefore, panel unit root tests have been conducted at the second difference.
As pointed out in Table 4, and according to ADF, PP and Im, Pesaran and Shin [97] tests, the data series of all variables highlight stationarity at second difference (p-value < 0.05). The overall outcome of the panel unit root indicates that the variables’ data series are stationary at second difference. After that, we estimated the model using fixed and cross-sectional random effects, as sometimes the data are not stationary at first difference, and, thus, it may be necessary to differentiate the data a second time to obtain a stationary series. Differencing help stabilize the mean of a time series by removing changes in the level of a time series and, therefore, reducing trend and seasonality so that it is not dependent on past values [102]. The stationarity of the data series reflects that data series of different variables do not follow the particular trend of different variables used in the study. Since all the variables have been made stationary at the second difference, the data series of all the variables are not going to follow a particular trend and independent variables used in the study are true predictors of dependent variables used in the study. Most forecasting techniques suppose that a distribution has stationarity, and if the data series of variables is not stationary, then it is made stationary before estimating the model. The economic significance of stationarity is that we can avoid the problem of autocovariance and autocorrelations, and only explanatory variables contribute to the variance of the model. An absence of stationarity can cause unexpected or bizarre behaviors, such as t-ratios not following a t-distribution or high r-squared values assigned to variables that are not correlated at all [103].
Table 5 represents panel data estimation using the no. of depositors as a dependent variable. The estimation has been conducted without fixed and cross section RE, with FE and with cross-section RE. Model 5.1 represents the results of cross-section RE. No. of internet users (p-value < 0.01) and population (p-value < 0.05) are significant. GDP is significant at a 10% confidence level. The result of cross-section RE indicates that heterogeneity across countries does not influence the result of panel data estimation. In the case of cross-section random effect, the associated R-Square is 0.4034. It means around 40.34% of the variance of FI (no. of depositors) is explained by indicated predictors. The model is a good fit (F: 4.90: p < 0.01).
Model 5.2 of panel data estimation deals with FE. Internet users are found to be significant (p-value < 0.01), and the population is significant at 10% (p-value < 0.10). GDP shows the negative significant impact on the no. of depositors at a 10% confidence level (p-value < 0.10). In the case of FE, the explained variance is quite high (R2: 0.83), and predictors elucidate 83% variance of FI (no. of depositors). The difference between R2 and adjusted is lesser. R2 authenticates the described variance of the FE model.
Model 5.3 has been developed without fixed and cross-section random effect. In this model, there are six significant variables. The internet users, population, domestic credit to financial sector, and bank branches highlight influence on the no. of depositors in a representative economy. It means all these variables encourage the no. of depositors in the particular country. The no. of internet users, population, and domestic credit to financial sector are found to be significant at 1% level; bank branches at 5%. DCPS is significant (p-value < 0.01) and GDP is also significant (p-value < 0.05). GDP and DCPS show the negative influence indicating that GDP and DCPS discourage the no. of depositors in BRICS economies. The explanatory power is high (R2: 0.7824), i.e., 78% variance explained by predictors. The model is a good fit, and the difference between the R-square and the adjusted R-square is less than 0.05.
Table 6 depicts the results of panel least squares with cross-section RE and FE using ATM/user (a proxy for FI) as a dependent variable.
For cross-section random effect (Model 6.1), GDP and exchange rate show positive and significant impacts on the dependent with p-value < 0.01. It means higher GDP and exchange rate across different BRICS countries encourage the no. of ATM/user or encourage FI. DCPS also shows a positive and significant influence on ATM/user (p-value < 0.05). This reflects that DCPS encourages FI in BRICS economies. Population exhibits a negative and significant influence on ATM/user (p-value < 0.01). Thus, the population across different BRICS nations discourages FI.
The panel least square results in FE (Model 6.2) are similar to cross-section RE. The exchange rate and GDP are significant in BRICS countries. The exchange rate shows the positive significant impact on ATM/user with (p-value < 0.01). GDP and DCPS are found to be significant at 5%. Population exhibits a significant negative association with ATM/user (p < 0.01).
In the case of cross-section RE (Model 6.1), the associated R2 is 0.701, and in FE (Model 6.2) R2 is 0.874. Thus, FE has a higher explanatory power.
Results of the simple panel least square (without fixed effect and cross-section random effect), as depicted by model 6.3, are not much different from 6.1 and 6.2, except in the case of one variable, i.e., internet users (p < 0.05). It indicates a negative association with ATM/user. It means that the no. of internet users in BRICS economies discourages ATM/user. Higher F statistics of all three models indicate that they are significant (p-value < 0.01). These statistics reflect that all three models are good fit models to predict ATM/user. The overall results of the status of the hypotheses for all models have been highlighted in Table 7.
The Hausman test (highlighted in Table 8) is sometimes described as a test for model misspecification. In panel data analysis, this test helps the researchers to choose either a fixed effect model or a cross-section random model [104]. Acceptance of the null hypothesis or failure to reject the null hypothesis indicate that the random model is best suited for the given data series, while acceptance of the alternate hypothesis demonstrates that the fixed effect model is best fitted for the given data series [105].
In the present study, the Hausman test is performed two times. Firstly, it is performed by using ATM per user as a dependent variable. In this case, the associated value of Chi-Square statistics (7.545030) is quite low, and a p-value > 0.05 means the failure to reject the null hypothesis and the rejection of the alternate hypothesis. This indicates that the cross-section random model is a good fit [106], using ATM per user as a dependent variable and all others as an independent variable (BB, INF, GDP, POP, DCPS, DCFS, INTUSER, EXCH). Secondly, the Housman test uses the depositor (DEPOSITER) as a dependent variable. Again, in this case, the associated Chi-Square value of the model is (6.030604) quite low, and the p-value > 0.05. It means that, again, in the case of DEPO, the cross-section random effect model is the best-suited model as compared to the fixed effect model.

5. Conclusions and Discussion

The key to driving development is to increase FI, which has several advantages for eradicating poverty and fostering prosperity. Hence, in order to evaluate progress, it is crucial to investigate the determinants of FI across BRICS. Therefore, this research is intended to analyze the factors influencing FI of BRICS economies, using determinants such as (i) domestic credit provided by the financial sector; (ii) domestic credit provided by banks to the private sector; (iii) exchange rate; (iv) inflation rate; (v) gross domestic product; (vi) bank branches; (vii) internet users; and (viii) the population as explanatory variables. The no. of depositors and ATM/user were the two dependent variables signifying FI in BRICS nations. The outcome of panel data analysis indicates that internet users and population have a positive and significant influence on FI in cross-section RE. This has also been corroborated by Duncombe and Boateng [107], that technological innovations through internet connectivity enhanced the accessibility of financial products.
In the case of FE, the internet users and population also emerge with an affirmative association with the no. of depositors (FI) in BRICS countries. An increase in internet users and a higher population encourages a higher no. of depositors in the BRICS economies. GDP has a negative and insignificant association with FI.
In the case of simple panel least square, domestic credit to the financial sector; population; no. of bank branches; and no. of internet users illustrate a positive and significant association with the no. of depositors, i.e., FI. It means that all these variables create a positive environment for FI in BRICS countries. These outcomes are in consensus with the results from earlier researchers [108,109,110].
Further, the simple panel least square results indicate that when heterogeneity across BRICS countries is not considered the maximum no. of variables, as explained above, are found to be significant, whereas when heterogeneity is considered across different BRICS economies, in that case, only three variables (internet users’ population and GDP) show significant association with the no. of depositors in these countries.
In the case of ATM per user (proxy of FI) as a dependent variable, the cross-section random effect results indicate that DCPS, GDP and exchange rate show a positive and significant impact on FI [111]. It means these variables encourage FI in the BRICS nations. As per Nasir, Balsalobre-Lorente, and Huynh [112], increased financial services accessibility through FI benefits macroeconomic factors, which help financial system stability and economic development.
Outcomes of FE [113] highlight that domestic credit to the private sector (DCPS), exchange rate and GDP positively impact FI. Population and internet users have a negative influence on FI. However, the variable domestic credit to the financial sector is not found to be significant in the case of FE. The results of FE indicate that when heterogeneity across BRICS countries is considered, the variables mentioned follow the described relationship.
Results of the simple panel least square (without fixed and cross-section random effect) indicate that internet users’ population and domestic credit financials have a negative association with FI. However, exchange rate, GDP and DCPS are positively related to FI. This conclusion is aligned with Lee et al. [32]’s results, which show that FI boosts business sales growth, which is then reflected in economic growth.
Summing up, it can be inferred that the results support that the existence of ICT in the banking industry provided numerous advantages, such as easy access to banking products and services. The unique outcomes from the current study highlight that more emphasis has to be given to access per user (ATM/user) rather than just focusing on the increase in the no. of depositors [114]. In these cases, the macroeconomic variables such as GDP, inflation and exchange rate appear to have a stronger impact. King and Levine [115] support that access to credit boosts economic growth. In contrast, Dabla-Norris et al. [116] found that FI promotes GDP growth via access to credit, credit depth, and the effectiveness of credit mediation among enterprises. Hence, increased financial access will have additional effects on GDP growth. Our data also emphasize how crucial it is to consider national income when formulating measures to increase financial inclusion. Conclusively, every nation needs to work towards enhancing the sharing of knowledge and experiences across nations through international financial institutions such as the Alliance for Financial Inclusion (AFI) and the Global Partnership for Financial Inclusion (GPFI). These types of organizations need to collaborate to increase the degree of FI in emerging nations with a low level of inclusion.

6. Practical Implications

The findings from this study have several policy implications. Unquestionably, many country-level features and economic aspects must undergo substantial enhancements to increase financial inclusion. Our analysis conclusively demonstrates the determinants of FI. Countries may focus on these indicators of FI, and governments should encourage opening domestic financial markets to enhance financial inclusiveness across the globe. Emerging economies such as India must promote FI to ensure more people have access to banking facilities. The variables as investigated by the study will benefit the policymakers when considering these factors for expanding banking facilities. The current study highlights that no. of internet users is strongly associated with the number of depositors in BRICS economies, and may be taken as a strong indicator to promote FI. Policymakers must initiate the requisite actions to start technology revolution campaigns in their respective countries to enhance no. of internet users. Another important step that the governments must take is to maintain adequate banking facilities as per the population in the respective country. We argue that pursuing these steps concurrently might have significant advantages, including more effective credit resource allocation, increased reliance on the formal, regulated financial sector, and increased access to a broad range of financial goods and services. In addition, our study’s results make it abundantly clear that technological advancement is critical to the process of FI. We suggest that authorities collaborate on the development of strategies for reducing the digital divide that exists in our modern societies.

7. Future Areas of Research

The current research has covered FI in BRICS nations. Future studies can be carried out for other emerging economies. There is further scope for research, and the study may be extended by using a higher no. of country specific variables. This study relies on only two proxies of FI; for deeper and comparative analysis, other proxies of FI may be used.

Author Contributions

Conceptualization, A.P.; Methodology, R.K.S.; Software, A.P. and R.K.S.; Validation, R.K.S.; Formal analysis, R.K.; Investigation, A.P.; Resources, A.P.; Data curation, R.K.S.; Writing—original draft, A.P.; Writing—review & editing, R.K.; Visualization, R.K.S.; Supervision, R.K. and R.K.S. All authors have read and agreed to the published version of the manuscript.

Funding

This research received no external funding.

Institutional Review Board Statement

Not applicable.

Informed Consent Statement

Not applicable.

Data Availability Statement

All the secondary data used for findings in the study are available from corresponding authors upon request.

Conflicts of Interest

The authors declare no conflict of interest.

References

  1. Aslan, G.; Deléchat, C.; Newiak, M.M.; Yang, M.F. Inequality in Financial Inclusion and Income Inequality; WP/17/236; International Monetary Fund: Washington, DC, USA, 2017. [Google Scholar]
  2. Gertler, P.; Levine, D.I.; Moretti, E. Do Microfinance Programs Help Families Insure Consumption Against Illness? Health Econ. 2009, 18, 257–273. [Google Scholar] [CrossRef] [PubMed]
  3. Abdu, E.; Adem, M. Determinants of financial inclusion in Afar Region: Evidence from selected woredas. Cogent Econ. Financ. 2021, 9, 1920149. [Google Scholar] [CrossRef]
  4. Sarma, M.; Pais, J. Financial inclusion and development: A cross country analysis annual conference of the human development and capability association. In Proceedings of the Annual Conference of the Human Development and Capability Association, New Delhi, India, 30 August–1 September 2008. [Google Scholar]
  5. Demirgüc-Kunt, A.; Klapper, L. Measuring financial inclusion: Explaining variation in use of financial services across and within countries. Brook. Pap. Econ. Act. 2013, 2013, 279–340. [Google Scholar] [CrossRef] [Green Version]
  6. Ghosh, J. Microfinance and the challenge of financial inclusion for development. Camb. J. Econ. 2013, 37, 1203–1219. [Google Scholar] [CrossRef] [Green Version]
  7. Cull, R.; Demirguc-Kunt, A.; Lyman, T. Financial Inclusion and Stability: What does Research Show? Consultative Group to Assist the Poor, 71305; CGAP: Washington, DC, USA, 2012; pp. 1–3. [Google Scholar]
  8. Kim, D.W.; Yu, J.S.; Hassan, M.K. Financial inclusion and economic growth in OIC countries. Res. Int. Bus. Financ. 2018, 43, 1–14. [Google Scholar] [CrossRef]
  9. Ozili, P.K. Impact of digital finance on financial inclusion and stability. Borsa. Istanb. Rev. 2018, 18, 329–340. [Google Scholar] [CrossRef]
  10. Mitchell, K.; Scott, R.H. Public revenue, financial inclusion and value-added tax in Argentina. In Pesos or Plastic? Palgrave Pivot: Cham, Switzerland, 2019; pp. 33–58. [Google Scholar]
  11. Kumar, N. Financial inclusion and its determinants: Evidence from India. J. Financ. Econ. 2013, 5, 4–19. [Google Scholar] [CrossRef]
  12. Zins, A.; Weill, L. The determinants of financial inclusion in Africa. Rev. Dev. Financ. 2016, 6, 46–57. [Google Scholar] [CrossRef] [Green Version]
  13. Evans, O. Connecting the poor: The internet, mobile phones and financial inclusion in Africa. Digit Policy Regul. Gov. 2018, 20, 568–581. [Google Scholar] [CrossRef]
  14. Allen, F.; Carletti, E.; Cull, R.; Qian, J.Q.; Senbet, L.; Valenzuela, P. The African financial development and financial inclusion gaps. J. Afr. Econ. 2014, 23, 614–642. [Google Scholar] [CrossRef]
  15. Fungacova, Z.; Weill, L. Understanding fi nancial inclusion in China. China Econ. Rev. 2015, 34, 196–206. [Google Scholar] [CrossRef] [Green Version]
  16. Tsai, K.S. FinTech and Financial Inclusion in China; HKUST Institute for Emerging Market Studies: Kowloon, Hong Kong, 2017; Volume 20. [Google Scholar]
  17. Le, T.-H.; Le, H.-C.; Taghizadeh-Hesary, F. Does financial inclusion impact CO2 emissions? Evidence from Asia. Financ. Res. Lett. 2020, 34, 101451. [Google Scholar] [CrossRef]
  18. Umar, M.; Rizvi, S.K.A.; Naqvi, B. Dance with the devil? The nexus of fourthindustrial revolution, technological financial products and volatility spillovers in globalfinancial system. Technol. Forecast. Soc. Chang. 2021, 163, 120450. [Google Scholar] [CrossRef]
  19. Okoye, L.U.; Erin, O.; Modebe, N.J. Financial inclusion as a strategy for enhanced economic growth and development. J. Internet Bank. Commer. 2017, 2, 1–14. [Google Scholar]
  20. Evans, O.; Lawanson, O. A Multi-Sectoral Study of Financial Inclusion and Economic Output in Nigeria. Ovidius Univ. Ann. Ser. Econ. Sci. 2017, 17, 195–204. [Google Scholar]
  21. Sanderson, A.; Mutandwa, L.; Le Roux, P. A review of determinants of financial inclusion. Int. J. Financ. Econ. 2018, 8, 1. [Google Scholar]
  22. Soumare, I.; Tchana Tchana, F.; Kengne, T.M. Analysis of the determinants of financial inclusion in Central and West Africa. Transnatl. Corp. Rev. 2016, 8, 231–249. [Google Scholar]
  23. Motta, V.; Gonzalez Farias, L.E. Determinants of financial inclusion in Latin America and the Caribbean. Dev. Pract. 2022, 32, 1063–1077. [Google Scholar] [CrossRef]
  24. Eldomiaty, T.; Hammam, R.; El Bakry, R. Institutional determinants of financial inclusion: Evidence from world economies. Int. J. Dev. Issues. 2020, 19, 217–228. [Google Scholar] [CrossRef]
  25. Lotto, J. Examination of the status of financial inclusion and its determinants in Tanzania. Sustainability 2018, 10, 2873. [Google Scholar] [CrossRef] [Green Version]
  26. Balliester Reis, T. Socio-economic determinants of financial inclusion: An evaluation with a microdata multidimensional index. J. Int. Dev. 2022, 34, 587–611. [Google Scholar] [CrossRef]
  27. Galor, O.; Zeira, J. Income distribution and macroeconomics. Rev. Econ. Stud. 1993, 60, 35–52. [Google Scholar] [CrossRef] [Green Version]
  28. Claessens, S. Access to financial services: A review of the issues and public policy objectives. World Bank Res. Obs. 2006, 21, 207–240. [Google Scholar] [CrossRef] [Green Version]
  29. Allen, F.; Demirguc-Kunt, A.; Klapper, L.; Martinez Peria, M.S. The Foundations of Financial Inclusion: Understanding Ownership and Use of Formal Accounts. J. Financ. Intermediation 2016, 27, 1–30. [Google Scholar] [CrossRef]
  30. Dahiya, S.; Kumar, M. Linkage between Financial Inclusion and Economic Growth: An Empirical Study of the Emerging Indian Economy. Vision 2020, 24, 184–193. [Google Scholar] [CrossRef]
  31. Pradhan, R.P.; Arvin, M.B.; Nair, M.S.; Hall, J.H.; Bennett, S.E. Sustainable economic development in India: The dynamics between financial inclusion, ICT development, and economic growth. Technol. Forecast. Soc. Chang. 2021, 169, 120758. [Google Scholar] [CrossRef]
  32. Lee, C.C.; Wang, C.W.; Ho, S.J. Financial inclusion, financial innovation, and firms’ sales growth. Int. Rev. Econ. Financ. 2020, 66, 189–205. [Google Scholar] [CrossRef]
  33. Ul Ain, N.; Sabir, S.; Asghar, N. Financial inclusion and economic growth: Empirical evidence from selected developing economies. Rev. Dev. Econ. 2020, 6, 179–203. [Google Scholar] [CrossRef]
  34. Gebrehiwot, K.G.; Makina, D. Macroeconomic determinants of financial inclusion: Evidence using dynamic panel data analysis. In Extending Financial Inclusion in Africa; Academic Press: Cambridge, MA, USA, 2019; pp. 167–191. [Google Scholar]
  35. Wale, L.E.; Makina, D. Account ownership and use of financial services among individuals: Evidence from selected sub-Saharan African economies. African J. Econ. Manag. Stud. 2017, 8, 19–35. [Google Scholar] [CrossRef]
  36. Anzoategui, D.; Demirguc-Kunt, A.; Peria, M.S.M. Remittances and financial inclusion: Evidence from El Salvador. World Dev. 2014, 54, 338–349. [Google Scholar] [CrossRef] [Green Version]
  37. Wagle, U.R. The economic footing of the global poor, 1980-2005: The roles of economic growth, openness and political institutions. J. Int. Dev. 2012, 24, S173–S197. [Google Scholar] [CrossRef]
  38. Bencivenga, V.R.; Smith, B.D. Financial intermediation and endogenous growth. Rev. Econ. Stud. 1991, 58, 195–209. [Google Scholar] [CrossRef] [Green Version]
  39. Nanda, K.; Kaur, M. Financial inclusion and human development: A cross-country evidence. Manag. Labour Stud. 2016, 41, 127–153. [Google Scholar] [CrossRef]
  40. Camara, N.; Tuesta, D. Measuring financial inclusion: A multidimensional index. SSRN Electron. J. 2014. [Google Scholar] [CrossRef]
  41. Sarma, M. Measuring financial inclusion for Asian economies. In Financial Inclusion in Asia; Palgrave Macmillan: London, UK, 2016; pp. 3–34. [Google Scholar]
  42. Park, C.Y.; Mercado, R., Jr. Financial inclusion, poverty, and income inequality. Singap. Econ. Rev. 2018, 63, 185–206. [Google Scholar] [CrossRef]
  43. Chakravarty, S.R.; Pal, R. Financial inclusion in India: An axiomatic approach. J. Policy Model. 2013, 35, 813–837. [Google Scholar] [CrossRef]
  44. Demirguc-Kunt, A.; Klapper, L. Measuring Financial Inclusion: The global Findex Database; World Bank Policy Research Working Paper Series 6025; World Bank: Washington, DC, USA, 2012. [Google Scholar]
  45. Mani, M. Financial inclusion in South Asia—Relative standing, challenges and initiatives. South Asian Surv. 2016, 23, 158–179. [Google Scholar] [CrossRef]
  46. Schumpeter, J.A. Theorie Derwirt-Schaftlichenentwicklung; Dunker & Humblot: Leipzig, Germany, 1912. [Google Scholar]
  47. King, R.G.; Levine, R. Finance, entrepreneurship and growth: Theory and evidence. J. Monet. Econ. 1993, 32, 513–542. [Google Scholar] [CrossRef]
  48. Mckinnon, R.I. Money and Capital in Economic Development; Brookings Institution Press: Washington, DC, USA, 1973. [Google Scholar]
  49. Goldsmith, R. Financial Structure and Development; New Haven Yale University Press: New Haven, CT, USA, 1969. [Google Scholar]
  50. Collard, S. Toward financial inclusion in the UK: Progress and challenges. Public Money Manag. 2007, 27, 13–20. [Google Scholar] [CrossRef]
  51. Rajan, R.G.; Zingales, L. Banks and Markets: The Changing Character of European Finance. 2003. Available online: https://www.nber.org/system/files/working_papers/w9595/w9595.pdf (accessed on 10 November 2022).
  52. Zheng, C. An innovative MS-VAR model with integrated financial knowledge for measuring the impact of stock market bubbles on financial security. J. Innov. Knowl. 2022, 7, 100207. [Google Scholar] [CrossRef]
  53. Cheng, L.; Zhang, Y. Do able managers take more risks? J. Innov. Knowl. 2022, 7, 100182. [Google Scholar] [CrossRef]
  54. Chakrabarty, T.K. Rural income: Some evidence of effect of rural credit during last three decades. Reserve Bank India Occas. Pap. 2003, 24, 225–239. [Google Scholar]
  55. Chibba, M. Financial inclusion, poverty reduction and the millennium development goals. Eur. J. Dev. Res. 2009, 21, 213–230. [Google Scholar] [CrossRef]
  56. Wait, C.; Ruzive, T.P.; Roux, P.L. The Influence of Financial Market Development on Economic Growth in BRICSCountries. Int. J. Manag. Econ. 2017, 53, 7–24. [Google Scholar]
  57. Guru, B.K.; Yadav, I.S. Financial Development and Economic Growth: Panel Evidence from BRICS. J. Econ. Financ. Adm. Sci. 2019, 24, 113–126. [Google Scholar] [CrossRef] [Green Version]
  58. Olaniyi, E.; Adeoye, B. Determinants of financial inclusion in Africa: A dynamic panel data approach. Univ. Maurit. Res. J. 2016, 22, 310–336. [Google Scholar]
  59. Wang, X.; Guan, J. Financial inclusion: Measurement, spatial effects and influencing factors. Appl. Econ. 2017, 49, 1751–1762. [Google Scholar] [CrossRef]
  60. Boukhatem, J. Assessing the direct effect of financial development on poverty reduction in a panel of low-and middle-income countries. Res. Int. Bus. Financ. 2016, 37, 214–230. [Google Scholar] [CrossRef]
  61. Van der Werff, A.D.; Hogarth, J.M.; Peach, N.D. A cross-country analysis of financial inclusion within the OECD. Consum. Interests Annual. 2013, 59, 1–12. [Google Scholar]
  62. Lenka, S.K.; Sharma, R. Does financial inclusion spur economic growth in India? J. Dev. Areas 2017, 51, 215–228. [Google Scholar] [CrossRef]
  63. Sethi, D.; Acharya, D. Financial inclusion and economic growth linkage: Some cross country evidence. J. Financ. Econ. 2018, 10, 369–385. [Google Scholar] [CrossRef]
  64. Asuming, P.O.; Osei-Agyei, L.G.; Mohammed, J.I. Financial inclusion in sub-Saharan Africa: Recent trends and determinants. J. Afr. Bus. 2019, 20, 112–134. [Google Scholar] [CrossRef]
  65. Mehrotra, A.; Yetman, J. Financial Inclusion and optimal Monetary Policy; Bank for International Settlements: Basel, Switzerland, 2014; p. 476. [Google Scholar]
  66. Beck, T.; Cull, R. Banking in Africa; World Bank Policy Research Working Paper 6684; World Bank: Washington, DC, USA, 2013. [Google Scholar]
  67. Demirgüç-Kunt, A.; Klapper, L.F.; Singer, D. Financial Inclusion and Legal Discrimination against Women: Evidence from Developing Countries; World Bank Policy Research Working Paper; World Bank: Washington, DC, USA, 2013. [Google Scholar]
  68. Sophastienphong, K.; Kulathunga, A. Getting finance in South Asia 2009: Indicators and Analysis of the Commercial Banking Sector; World Bank: Washington, DC, USA, 2008. [Google Scholar]
  69. Sarma, M. Index of Financial Inclusion; Working Paper No. 215; Indian Council for Research on International Economic Relations: New Delhi, India, 2008. [Google Scholar]
  70. Bourainy, M.E.; Salah, A.; Sherif, M.E. Assessing the impact of financial inclusion on inflation rate in developing countries. Open J. Soc. Sci. 2021, 9, 397–424. [Google Scholar] [CrossRef]
  71. Mbutor, O.; Uba, I. The Impact of Financial Inclusion on Monetary Policy in Nigeria. J. Econ. Int. Financ. 2013, 5, 318–326. [Google Scholar] [CrossRef] [Green Version]
  72. Beck, T.; Torre, A.D.L. The Basic Analysis of Access to Financial Services; WPS 4026, World Bank Memo; World Bank: Washington, DC, USA, 2006. [Google Scholar]
  73. Beck, T.; Demirgüç-Kunt, A.; Martinez-Peria, S. Reaching out: Access to and use of banking services across countries. J. Financ. Econ. 2007, 85, 234–266. [Google Scholar] [CrossRef] [Green Version]
  74. Australian Financial Centre Forum. Australia as a Financial Centre Building on our Strengths. 2009. Available online: https://trove.nla.gov.au/work/36802810 (accessed on 15 October 2022).
  75. Owen, A.L.; Pereira, J.M. Bank Concentration, Competition, and Financial Inclusion. Rev. Dev. Finance. 2018, 8, 1–17. [Google Scholar] [CrossRef]
  76. De Sousa, M.M. Financial Inclusion and Global Regulatory Standards: An Empirical Study Across Developing Economies. CIGI Working Paper No. 7. 2015. Available online: https://www.cigionline.org/static/documents/new_thinking_g20_no7.pdf (accessed on 20 October 2022).
  77. Hao, Z.; Zhang, X.; Wei, J. Research on the effect of enterprise financial flexibility on sustainable innovation. J. Innov. Knowl. 2022, 7, 100184. [Google Scholar] [CrossRef]
  78. Kpodar, K.; Andrianaivo, M. ICT, Financial Inclusion, and Growth Evidence from African Countries; IMF Working Papers; International Monetary Fund: Washington, DC, USA, 2011. [Google Scholar] [CrossRef]
  79. Ye, Y.; Chen, S.; Li, C. Financial technology as a driver of poverty alleviation in China: Evidence from an innovative regression approach. J. Innov. Knowl. 2022, 7, 100164. [Google Scholar] [CrossRef]
  80. Sha’ban, M.; Claudia Girardone, C.; Sarkisyan, A. Cross-country variation in financial inclusion: A global perspective. Eur. J. Financ. 2020, 26, 319–340. [Google Scholar] [CrossRef]
  81. Lenka, S.K.; Barik, R. Has expansion of mobile phone and internet use spurred financial inclusion in the SAARC countries? Financ. Innov. 2018, 4, 5. [Google Scholar] [CrossRef] [Green Version]
  82. Sharma, D. Nexus between financial inclusion and economic growth: Evidence from the emerging Indian economy. J. Financ. Econ. 2016, 8, 13–36. [Google Scholar] [CrossRef]
  83. Siddik, M.N.A. Does financial permeation induce economic growth? Evidence from SAARC countries. Glob. Bus. Rev. 2019, 097215091882495. [Google Scholar] [CrossRef]
  84. Omar, M.A.; Inaba, K. Does financial inclusion reduce poverty and income inequality in developing countries? A panel data analysis. J. Econ. Struct. 2020, 9, 9–37. [Google Scholar] [CrossRef]
  85. Olowofeso, E.O.; Adeleke, A.O.; Udoji, A.O. Impact of private sector credit on economic growth in Nigeria. CBN J. Appl. Stat. 2015, 6, 81–101. [Google Scholar]
  86. Chatterjee, A. Financial inclusion, information and communication technology diffusion, and economic growth: A panel data analysis. Inf. Technol. Dev. 2020, 26, 607–635. [Google Scholar] [CrossRef]
  87. Rojas-Suarez, L.; Amado, M. Understanding Latin America’s Financial Inclusion Gap; Center for Global Development Working Paper 367; Center for Global Development: Washington, DC, USA, 2014; Available online: http://www.cgdev.org/sites/default/files/latin-american-financial-inclusion-gap.pdf (accessed on 8 October 2022).
  88. Dabla-Norris, E.; Deng, Y.; Ivanova, A.; Karpowicz, I.; Unsal, F.D.; VanLeemput, E.; Wong, J.; Srinivasan, K. Financial Inclusion: Zooming in on Latin America; IMF Working Paper; International Monetary Fund: Washington, DC, USA, 2015. [Google Scholar]
  89. Lenka, S.K.; Bairwa, A.K. Does financial inclusion affect monetary policy in SAARC countries? Cogent Econ. Finance. 2016, 4, 1127011. [Google Scholar] [CrossRef] [Green Version]
  90. Durai, T.; Stella, G. Digital finance and its impact on financial inclusion. J. Emerg. Technol. Innov. 2019, 6, 122–127. [Google Scholar]
  91. Bayar, Y.; Gavriletea, M.D.; Păun, D. Impact of mobile phones and internet use on financial inclusion: Empirical evidence from the EU post-communist countries. Technol. Econ. Dev. Econ. 2021, 27, 722–741. [Google Scholar] [CrossRef]
  92. David, O.O.; Oluseyi, A.S.; Emmanuel, A. Empirical analysis of the determinants of financial inclusion in Nigeria: 1990-2016. J. Financ. Econ. 2018, 6, 19–25. [Google Scholar]
  93. Chauvet, L.; Jacolin, L. Financial inclusion, bank concentration, and firm performance. World Dev. 2017, 97, 1–13. [Google Scholar] [CrossRef]
  94. Hannig, A.; Jansen, S. Financial Inclusion and Financial Stability: Current Policy Issues; ADBI Working Paper Series No. 259; Asian Development Bank Institute: Tokyo, Japan, 2010. [Google Scholar]
  95. Bhaskar, P.V. Financial inclusion in India—An assessment. J. Financ. 2013, 2–3. Available online: https://rbidocs.rbi.org.in/rdocs/Bulletin/PDFs/04FS090114SF.pdf (accessed on 14 August 2022).
  96. Levin, A.; Lin, C.F.; Chu, C.-S.J. Unit root tests in panel data: Asymptotic and finite-sample properties. J. Econom. 2002, 108, 1–24. [Google Scholar] [CrossRef]
  97. Im, K.S.; Pesaran, M.H.; Shin, Y. Testing for unit roots in heterogeneous panels. J. Econom. 2003, 115, 53–74. [Google Scholar] [CrossRef]
  98. Maddala, G.; Wu, S. A comparative study of unit root tests and a new factors. J. Econom. 1999, 122, 81–126. [Google Scholar]
  99. Phillips, P.C.; Perron, P. Testing for a unit root in time series regression. Biometrika 1988, 75, 335–346. [Google Scholar] [CrossRef]
  100. Torres-Reyna, O. Panel Data Analysis Fixed and Random Effects Using Stata (v. 4.2). Data & Statistical Services. 2007. Available online: https://www.princeton.edu/~otorres/Panel101.pdf (accessed on 5 October 2022).
  101. Greene, W.H. Fixed and Random Effects in Nonlinear Models. NYU Working Paper No. EC-01-01. 2001. Available online: https://ssrn.com/abstract=1292666 (accessed on 14 September 2022).
  102. Kwiatkowski, D.; Phillips, P.C.B.; Schmidt, P.; Shin, Y. Testing the null hypothesis of stationarity against the alternative of a unit root: How sure are we that economic time series have a unit root? J. Econom. 1992, 54, 159–178. [Google Scholar] [CrossRef]
  103. Bierens, H.J.; Guo, S. Testing stationarity and trend stationarity against the unit root hypothesis. Econom Rev. 1993, 12, 1–32. [Google Scholar] [CrossRef]
  104. Mutl, J.; Pfaffermayr, M. The Hausman test in a Cliff and Ord panel model. Econom. J. 2011, 14, 48–76. [Google Scholar] [CrossRef]
  105. Hausman, J.A. Specification tests in econometrics. Econom. J. Econom. Soc. 1978, 1251–1271. [Google Scholar] [CrossRef] [Green Version]
  106. Clark, T.S.; Linzer, D.A. Should I use fixed or random effects? Political Sci. Res. Meth. 2015, 3, 399–408. [Google Scholar] [CrossRef] [Green Version]
  107. Duncombe, R.; Boateng, R. Mobile phones and financial services in developing countries: A review of concepts, methods, issues, evidence and future research directions. Third World Q. 2009, 30, 1237–1258. [Google Scholar] [CrossRef]
  108. Chu, L. Determinants of financial inclusions: Comparing high, middle, and low–income countries. Econ. Bull. 2019, 39, 1449–1457. [Google Scholar]
  109. Tuesta, D.; Sorensen, G.; Haring, A.; Camara, N. Financial Inclusion and Its Determinants: The Case of Argentina. BBVA Research Working Paper No. 15/03. 2015. Available online: https://www.bbvaresearch.com/wp-content/uploads/2015/01/WP_15-03_Financial-Inclusion-in-Argentina.pdf (accessed on 25 October 2022).
  110. Bhuvana, M.; Vasantha, S.; Bharath, R. Information and Communication Technology (ICT)–A drive for financial inclusion. J. Chem. Pharm. Sci. 2016, 9, 1885–1889. [Google Scholar]
  111. Brandon, L.B. Beyond “fixed versus random effects”: A framework for improving substantive and statistical analysis of panel, time-series cross-sectional, and multilevel data, "political methodology conference. Soc. Political Methodol. 2008, 9, 1–23. [Google Scholar]
  112. Nasir, M.A.; Balsalobre-Lorente, D.; Huynh, T.L.D. Anchoring inflation expectations in the face of oil shocks & in the proximity of ZLB: A tale of two targeters. Energy Econ. 2020, 86, 1–28. [Google Scholar]
  113. Kohler, U.; Kreuter, F. Data Analysis Using Stata, 2nd ed.; Stata Press Books; StataCorp LP: College Station, TX, USA, 2009. [Google Scholar]
  114. Iqbal, B.A.; Sami, S. Role of banks in financial inclusion in India. Contad. Adm. 2017, 62, 644–656. [Google Scholar] [CrossRef]
  115. King, R.G.; Levine, R. Financial Intermediation and Economic Development. In Capital Markets and Financial Intermediation; Cambridge University Press: Cambridge, UK, 1993; pp. 156–189. Available online: http://faculty.haas.berkeley.edu/ross_levine/Papers/1993_Book_Mayer_Intermediation.pdf (accessed on 2 September 2022).
  116. Dabla-Norris, E.; Ji, Y.; Townsend, R.; Unsal, U. Identifying Constraints to Financial Inclusion and Their Impact on GDP and Inequality (IMF Working Paper); International Monetary Fund: Washington, DC, USA, 2015. [Google Scholar]
Figure 1. Determinants of FI and economic growth relation. Source: Authors’ compilation.
Sustainability 15 01603 g001
Table 2. Panel unit root at level.
LLCATMDCPFSDCPSBDEPOERINFLBBGDPIUPOPATM/User
Without C and T1.19808
(0.8846)
2.84695
(0.9978)
0.95274
(0.8296)
3.94267
(1.0000)
0.96745
(0.8333)
−1.4728
(0.0704)
7.29784
(1.0000)
4.66632
(1.0000)
8.63505
(1.0000)
11.4892
(1.0000)
0.80662
(0.7901)
With C6.6666
(1.0000)
5.34001
(1.0000)
0.81523
(0.7925)
18.1093
(1.0000)
7.22215
(1.0000)
−3.1003
(0.0010)
3.07696
(0.9990)
−4.06938
(0.0000)
−5.32916
(0.0000)
36.6246
(1.0000)
179.727
(1.0000)
With C and T37.1606
(1.0000)
12.3989
(1.0000)
13.2268
(1.0000)
25.9219
(1.0000)
8.69718
(1.0000)
−2.9854
(0.0014)
12.8400
(1.0000)
7.04157
(1.0000)
4.44680
(1.0000)
2103.29
(1.0000)
571.303
(1.0000)
Im, Pesaran and Shin
Without C and T
With C0.58515
(0.7208)
1.69064
(0.9545)
−0.42671
(0.3348)
6.36271
(1.0000)
1.42691
(0.9232)
−2.53044
(0.0057)
1.01126
(0.8441)
−2.39184
(0.0084)
−2.66975
(0.0038)
4.87271
(1.0000)
−1.12864
(0.1295)
With C and T2.01280
(0.9779)
−0.11476
(0.4543)
0.80769
(0.7904)
2.26659
(0.9883)
0.33478
(0.6311)
−1.64375
(0.0501)
0.72765
(0.7666)
0.64289
(0.7399)
−0.09343
(0.4628)
−1.23924
(0.1076)
1.61997
(0.9474)
ADF
Without C and T1.29021
(0.9995)
1.33730
(0.9994)
3.80906
(0.9555)
0.90730
(0.9999)
2.63856
(0.9887)
10.2073
(0.4225)
2.61783
(0.9890)
0.99557
(0.9998)
0.02077
(1.0000)
0.12635
(1.0000)
4.82788
(0.9024)
With C10.4278
(0.4038)
3.84149
(0.9542)
13.3412
(0.2052)
4.04089
(0.9455)
3.54100
(0.9657)
24.4425
(0.0065)
1.01126
(0.8441)
−2.39184
(0.0084)
30.0687
(0.0008)
0.33955
(1.0000)
15.6768
(0.1093)
With C and T3.02179
(0.9809)
14.1422
(0.1666)
11.2570
(0.3378)
7.83733
(0.6447)
6.68244
(0.7550)
20.7143
(0.0232)
0.72765
(0.7666)
0.64289
(0.7399)
14.3742
(0.1566)
20.8800
(0.0219)
6.75208
(0.7486)
PP
Without C and T29.1270
(0.0012)
15.4556
(0.1163)
10.4037
(0.4058)
18.8968
(0.0416)
16.4075
(0.0885)
13.0559
(0.2206)
6.93649
(0.7314)
4.78824
(0.9049)
4.32092
(0.9317)
5.98884
(0.8162)
40.0848
(0.0000)
With C34.1688
(0.0002)
39.7516
(0.0000)
43.4427
(0.0000)
44.3710
(0.0000)
35.9442
(0.0001)
28.7323
(0.0014)
36.2175
(0.0001)
27.3641
(0.0023)
23.9118
(0.0078)
57.4836
(0.0000)
55.7535
(0.0000)
With C and T46.9104
(0.0000)
58.4410
(0.0000)
62.2313
(0.0000)
40.1362
(0.0000)
60.2081
(0.0000)
28.6216
(0.0014)
43.3265
(0.0000)
36.9007
(0.0001)
80.0993
(0.0000)
56.9510
(0.0000)
19.7336
(0.0319)
Source: Authors’ calculations with Eviews11.
Table 3. Panel unit root at first difference.
LLCATMDCPFSDCPSBDEPOERINFLBBGDPIUPOPATM/USER
Without C and T−2.81804
(0.0024)
−4.51705
(0.0000)
−5.01004
(0.0000)
2.36869
(0.9911)
−4.99789
(0.0000)
−8.31360
(0.0000)
−2.26432
(0.0118)
−3.79540
(0.0001)
−4.28441
(0.0000)
0.20579
(0.5815)
7.31995
(0.0000)
With C40.9274
(1.0000)
12.5357
(1.0000)
14.0137
(1.0000)
26.9693
(1.0000)
10.7713
(1.0000)
−5.44396
(0.0000)
13.7639
(1.0000)
6.30723
(1.0000)
8.92979
(1.0000)
2374.23
(1.0000)
668.597
(1.0000)
With C and T35.9735
(1.0000)
13.8813
(1.0000)
13.2249
(1.0000)
62.1063
(1.0000)
13.7106
(1.0000)
−6.50543
(0.0000)
15.3341
(1.0000)
7.87503
(1.0000)
18.4844
(1.0000)
141.823
(1.0000)
752.513
(1.0000)
Im, Pesaran and Shin
Without C and T
With C−0.45777
(0.3236)
−3.20043
(0.0007)
−2.05747
(0.0198)
0.60310
(0.7268)
−1.75797
(0.0394)
−3.96392
(0.0000)
−1.75712
(0.0394)
−2.63346
(0.0042)
−2.50496
(0.0061)
−3.69523
(0.0001)
−0.93911
(0.1738)
With C and T−0.78840
(0.2152)
−2.41456
(0.0079)
−2.27408
(0.0115)
1.05672
(0.8547)
−0.32369
(0.3731)
−3.13261
(0.0009)
−1.42073
(0.0777)
−2.24169
(0.0125)
−0.94960
(0.1712)
0.45522
(0.6755)
−0.82105
(0.2058)
ADF
Without C and T15.7901
(0.1058)
29.1294
(0.0012)
35.6639
(0.0001)
17.0303
(0.0737)
33.1368
(0.0003)
60.0266
(0.0000)
28.8920
(0.0013)
33.4518
(0.0002)
26.7645
(0.0028)
12.1179
(0.2772)
26.4407
(0.0032)
With C10.0062
(0.4399)
28.7135
(0.0014)
23.5864
(0.0088)
10.8685
(0.3679)
17.7364
(0.0596)
33.8269
(0.0002)
18.4819
(0.0474)
24.4633
(0.0065)
23.3056
(0.0097)
32.1912
(0.0004)
12.3081
(0.2650)
With C and T13.3659
(0.2039)
22.9226
(0.0110)
23.9728
(0.0077)
4.86572
(0.9000)
10.9790
(0.3592)
28.4215
(0.0015)
20.5404
(0.0245)
22.9551
(0.0109)
17.2800
(0.0684)
9.86486
(0.2746)
13.0062
(0.2233)
PP
Without C and T64.0861
(0.0000)
68.7969
(0.0000)
89.5589
(0.0000)
53.4400
(0.0000)
75.4641
(0.0000)
71.8665
(0.0000)
67.7947
(0.0000)
65.6003
(0.0000)
88.7803
(0.0000)
73.4560
(0.0000)
42.2895
(0.0000)
With C63.6961
(0.0000)
78.2208
(0.0000)
79.5951
(0.0000)
58.6660
(0.0000)
71.9093
(0.0000)
51.2138
(0.0000)
53.0021
(0.0000)
66.3438
(0.0000)
99.5154
(0.0000)
56.7943
(0.0000)
33.9392
(0.0002)
With C and T62.9860
(0.0000)
82.0445
(0.0000)
77.5300
(0.0000)
57.7273
(0.0000)
68.4164
(0.0000)
54.0432
(0.0000)
47.5186
(0.0000)
77.9936
(0.0000)
93.3361
(0.0000)
55.2620
(0.0000)
33.7663
(0.0002)
Source: Authors’ calculations with Eviews11.
Table 4. Panel unit root at the second difference.
LLCATMDCPFSDCPSBDEPOERINFLBBGDPIUPOPATM/
User
Without C and T−8.18609
(0.0000)
−10.3275
(0.0000)
−8.89980
(0.0000)
−4.03747
(0.0000)
−7.00968
(0.0000)
−11.0836
(0.0000)
−8.71464
(0.0000)
−11.3691
(0.0000)
−8.92335
(0.0000)
−22.9309
(0.0000)
−11.9405
(0.0000)
With C21.2301
(1.0000)
5.24140
(1.0000)
7.94936
(1.0000)
52.3502
(1.0000)
7.06820
(1.0000)
−8.82909
(0.0000)
10.5664
(1.0000)
−2.01695
(0.0219)
6.72571
(1.0000)
2580.09
(1.0000)
557.602
(1.0000)
With C and T20.9549
(1.0000)
5.65905
(1.0000)
9.90707
(1.0000)
55.4134
(1.0000)
7.52763
(1.0000)
−7.24729
(0.0000)
13.5671
(1.0000)
−2.00431
(0.0225)
9.46400
(1.0000)
77.5186
(1.0000)
615.695
(1.0000)
Im, Pesaran and Shin
Without C and T
With C−4.45103
(0.0000)
−5.97929
(0.0000)
−4.56204
(0.0000)
−1.21276
(0.1126)
−2.90779
(0.0018)
−5.43773
(0.0000)
−4.41986
(0.0000)
−5.86351
(0.0000)
−4.89460
(0.0000)
−3.88355
(0.0001)
−3.79194
(0.0001)
With C and T−2.55972
(0.0052)
−3.75924
(0.0001)
−2.19156
(0.0142)
−0.04195
(0.4833)
−1.08611
(0.1387)
−2.92360
(0.0017)
−2.54519
(0.0055)
−2.88170
(0.0020)
−2.90666
(0.0018)
−5.14313
(0.0000)
−1.62446
(0.0521)
ADF
Without C and T59.8919
(0.0000)
78.0699
(0.0000)
63.3855
(0.0000)
32.1116
(0.0004)
49.6085
(0.0000)
74.5576
(0.0000)
63.2309
(0.0000)
65.5357
(0.0000)
69.4423
(0.0000)
65.6961
(0.0000)
57.4444
(0.0000)
With C38.9131
(0.0000)
48.4024
(0.0000)
38.6851
(0.0000)
15.8001
(0.1055)
26.7450
(0.0029)
44.9350
(0.0000)
37.7208
(0.0000)
46.1430
(0.0000)
43.5374
(0.0000)
36.8605
(0.0001)
33.2521
(0.0002)
With C and T30.4908
(0.0007)
35.6813
(0.0001)
24.0469
(0.0075)
10.3584
(0.4096)
17.0121
(0.0741)
29.9309
(0.0009)
26.8375
(0.0028)
28.6121
(0.0014)
29.9999
(0.0009)
32.1255
(0.0001)
20.2019
(0.0274)
PP
Without C and T89.8553
(0.0000)
96.0283
(0.0000)
86.5876
(0.0000)
61.6247
(0.0000)
87.1887
(0.0000)
92.5230
(0.0000)
77.4615
(0.0000)
95.2717
(0.0000)
95.2111
(0.0000)
60.1991
(0.0000)
70.1315
(0.0000)
With C76.1645
(0.0000)
108.656
(0.0000)
96.8579
(0.0000)
65.2886
(0.0000)
77.3801
(0.0000)
90.7456
(0.0000)
72.5153
(0.0000)
102.562
(0.0000)
94.6752
(0.0000)
56.2480
(0.0000)
65.7413
(0.0000)
With C and T74.8204
(0.0000)
91.5914
(0.0000)
90.6683
(0.0000)
60.5010
(0.0000)
69.9152
(0.0000)
70.0087
(0.0000)
69.4405
(0.0000)
81.2396
(0.0000)
88.8257
(0.0000)
56.2327
(0.0000)
49.3571
(0.0000)
Source: Authors’ calculations with Eviews11.
Table 5. Panel Least Squares with Cross section Random and Fixed Effect (Depositors).
5.1 Cross-Section Random Effect5.2 Fixed Effect5.3 Without Fixed and Random Effect
VariableCoefficientt-StatisticCoefficientt-StatisticCoefficientt-Statistic
Domestic Credit to Financial Sector3.2911811.102465
(0.2748)
1.3572330.381075
(0.7046)
7.1974532.9597 *
(0.0045)
Domestic Credit to Private Sector−8.281807−1.599206
(0.1152)
−3.325062−0.465988
(0.6431)
−14.01716−5.25137 *
(0.0000)
Exchange Rate−2.709269−0.919437
(0.3617)
−4.217192−1.253087
(0.2156)
−1.437202−0.548958
(0.5851)
Inflation Rate−270.0783−0.284451
(0.7771)
−432.5921−0.431500
(0.6678)
−537.1401−0.522219
(0.6035)
No. of Bank Branches8.1419140.779224
(0.4390)
4.3926420.398039
(0.6922)
23.465072.27552 **
(0.0266)
Gross Domestic Product−217.9722−1.7158 ***
(0.0915)
−273.7548−1.719 ***
(0.0913)
−384.5451−4.75780 *
(0.0000)
Internet Users204.41433.563590 *
(0.0007)
225.15303.5733 *
(0.0008)
212.97173.5327 *
(0.0008)
Population157.99732.211612 **
(0.0309)
161.99811.954453 ***
(0.0558)
228.98014.8381 *
(0.0000)
C−3078.858−2.737549 *
(0.0082)
−2816.191−2.150041 **
(0.0360)
−2347.067−3.1174 *
(0.0028)
Cross-section random S.D./Rho 257.5897
(0.6751)
Idiosyncratic random S.D./Rho 178.6883
(0.3249)
R-squared 0.403409 0.838095 0.782438
Adjusted R-squared 0.321121 0.802116 0.752429
S.E. of regression 181.0207 182.4858 204.1143
F-statistic 4.902385
(0.000118)
23.29407
(0.000000)
26.07382
(0.000000)
Akaike info criterion 13.42357 13.59964
Schwarz criterion 13.85135 13.89580
Source: Authors’ calculations with Eviews11, * p value < 0.01 ** p value < 0.05 *** p value < 0.10.
Table 6. Panel Least Squares with Cross section Random and Fixed Effect (ATM/User).
6.1 Cross-Section Random Effect6.2 Fixed Effect6.3 Without Fixed and Random Effect
VariableCoefficientt-StatisticCoefficientt-StatisticCoefficientt-Statistic
Domestic Credit to Financial Sector−0.014457−1.754396 ***
(0.0845)
−0.014520−1.500900
(0.1390)
−0.022003−3.189650 *
(0.0023)
Domestic Credit to Private Sector0.0338282.658788 **
(0.0100)
0.0366982.237329 **
(0.0293)
0.0378314.986724 *
(0.0000)
Exchange Rate0.0295403.730900 *
(0.0004)
0.0275923.193083 *
(0.0023)
0.0368974.957580 *
(0.0000)
Inflation Rate−2.516099−0.917280
(0.3627)
−2.927792−0.998179
(0.3225)
−1.205760−0.413739
(0.6805)
No. of Bank Branches0.0253060.881366
(0.3816)
0.0283570.919545
(0.3618)
0.0124710.444567
(0.6582)
Gross Domestic Product1.3175033.802321 *
(0.0003)
1.1483832.664574 **
(0.0101)
1.8217028.131877 *
(0.0000)
Internet Users−0.247697−1.498354
(0.1393)
−0.203865−1.119164
(0.2678)
−0.351417−2.134441 **
(0.0369)
Population−0.953691−4.847351 *
(0.0000)
−0.904078−3.744875 *
(0.0004)
−1.182962−8.823982 **
(0.0000)
C3.6341871.175361
(0.2445)
4.1411611.133064
(0.2620)
3.0414111.425740
(0.1591)
Cross-section random S.D./Rho 0.613498
(0.5793)
Idiosyncratic random S.D./Rho 0.522860
(0.4207)
R-squared 0.701333 0.874595 0.846138
Adjusted R-squared 0.661511 0.847723 0.825623
S.E. of regression 0.533436 0.542655 0.580700
F-statistic 17.61161
(0.000000)
32.54622
(0.000000)
41.24492
(0.000000)
Akaike info criterion 1.783371 1.871941
Schwarz criterion 2.204290 2.163347
Source: Authors’ calculations with Eviews11, * p value < 0.01 ** p value < 0.05 *** p value < 0.10.
Table 7. Result of Hypotheses Support.
HypothesesModel
123
H1aSupportedSupportedSupported
H1bSupportedSupportedSupported
H2aNot-SupportedNot-SupportedNot-Supported
H2bSupportedSupportedSupported
H3aNot-SupportedNot-SupportedNot-Supported
H3bSupportedSupportedSupported
H4aSupportedSupportedSupported
H4bNot-SupportedNot-SupportedNot-Supported
H5aNot-SupportedNot-SupportedNot-Supported
H5bSupportedSupportedSupported
H6aSupportedSupportedSupported
H6bNot-SupportedNot-SupportedNot-Supported
H7aNot-SupportedNot-SupportedNot-Supported
H7bSupportedSupportedSupported
H8aSupportedSupportedSupported
H8bNot-SupportedNot-SupportedNot-Supported
Source: Authors’ compilation.
Table 8. Hausman Test.
VariableChi.Square-StatisticsDegree of FreedomProb.
ATM per User7.54503080.4791
Depositor6.03060480.6438
Source: Authors’ compilation through Eviews 12.
Disclaimer/Publisher’s Note: The statements, opinions and data contained in all publications are solely those of the individual author(s) and contributor(s) and not of MDPI and/or the editor(s). MDPI and/or the editor(s) disclaim responsibility for any injury to people or property resulting from any ideas, methods, instructions or products referred to in the content.

